Article

Identification of 7-Ketocholesterol-Modulated Pathways and Sterculic Acid Protective Effect in Retinal Pigmented Epithelium Cells by Using Genome-Wide Transcriptomic Analysis

by
Ana Pariente
1,
Álvaro Pérez-Sala
1,
Rodrigo Ochoa
1,2,
Miriam Bobadilla
1,
Ángela Villanueva-Martínez
1,
Rafael Peláez
1,* and
Ignacio M. Larráyoz
1,3,*
1
Biomarkers and Molecular Signaling Group, Neurodegeneration Area, Center for Biomedical Research of La Rioja (CIBIR), Piqueras 98, 26006 Logroño, Spain
2
Proteomics Research Core Facility, Aragonese Institute of Health Sciences (IACS), University of Zaragoza, San Juan Bosco 13, 50009 Zaragoza, Spain
3
Biomarkers, Artificial Intelligence and Signaling (BIAS), Department of Nursing, University of La Rioja, Duquesa de la Victoria 88, 26006 Logroño, Spain
*
Authors to whom correspondence should be addressed.
Int. J. Mol. Sci. 2023, 24(8), 7459; https://doi.org/10.3390/ijms24087459
Submission received: 21 March 2023 / Revised: 12 April 2023 / Accepted: 14 April 2023 / Published: 18 April 2023

Abstract

:
Age-related macular degeneration (AMD) is the leading cause of blindness in developed countries. AMD is characterized by the formation of lipidic deposits between the retinal pigment epithelium (RPE) and the choroid called drusen. 7-Ketocholesterol (7KCh), an oxidized-cholesterol derivative, is closely related to AMD as it is one of the main molecules accumulated in drusen. 7KCh induces inflammatory and cytotoxic responses in different cell types, and a better knowledge of the signaling pathways involved in its response would provide a new perspective on the molecular mechanisms that lead to the development of AMD. Furthermore, currently used therapies for AMD are not efficient enough. Sterculic acid (SA) attenuates the 7KCh response in RPE cells and is presented as an alternative to improve these therapies. By using genome-wide transcriptomic analysis in monkey RPE cells, we have provided new insight into 7KCh-induced signaling in RPE cells, as well as the protective capacity of SA. 7KCh modulates the expression of several genes associated with lipid metabolism, endoplasmic reticulum stress, inflammation and cell death and induces a complex response in RPE cells. The addition of SA successfully attenuates the deleterious effect of 7KCh and highlights its potential for the treatment of AMD.

1. Introduction

Age-related macular degeneration (AMD) is a serious disease affecting the macula of the retina, and it is characterized by a gradual loss of central vision because of aging. AMD represents, in developed countries, the principal cause of blindness in people older than 65 years [1,2,3,4]. This disease is mainly classified into two different types: dry AMD and wet AMD [1,5,6]. Dry AMD is the most common form of the disease and is characterized by the accumulation of yellowish extracellular deposits called drusen [6,7,8,9]. Because of aging, intracellular material not digested by the retinal pigment epithelium (RPE) begins to accumulate around it, forming these specific deposits [7,8,10]. Drusen can be formed both in the apical and basolateral part of the RPE, but only drusen located basolaterally, between the epithelium and the choroid, are characteristic of AMD and represent the first hallmark of the disease [7,8,9]. For this reason, an important part of the research related to AMD is centered on the RPE, as it is in this area of the retina where the disease can be detected earlier. Nevertheless, some studies have been focused on other parts of the retina, such as the photoreceptors, the choroid or the extracellular cell matrix of the RPE [11,12,13]. When the number and size of drusen increases, the molecules inside them—mainly lipid compounds, cholesterol derivatives and unfolded-oxidized proteins—trigger different responses that may damage the epithelium, promoting the development of dry AMD [3,8,10,14,15]. Dry AMD does not usually cause complete loss of central vision due to its slow progress [3].
On the other hand, wet AMD is the most severe form of the disease. It is characterized by an abnormal angiogenesis process of choroidal blood vessels from the macula called choroidal neovascularization (CNV) [1,3,6,11]. Eventually, this process leads to blood and fluid leakage that can scar the macula, leading to a rapid and permanent loss of central vision [5,6]. Nowadays, anti-VEGF therapy is the only treatment available for wet AMD patients to counteract CNV. However, these therapies are not efficient enough, as they are not exempt from serious side effects, and some patients develop resistance to these drugs [1,5,6,16,17,18]. For this reason, there is a need to find new alternatives to these therapies by looking for new therapeutic targets.
7-Ketocholesterol (7KCh) is an oxidized cholesterol derivative or oxysterol known for inducing oxidative stress, inflammation and cell death in different cell types, including retinal cells [15,19,20,21,22,23,24,25,26,27,28]. There is strong evidence suggesting a connection between 7KCh and AMD since this oxysterol is formed and accumulated in drusen as a consequence of aging [29,30,31,32,33,34]. In addition, 7KCh has been related to other neurodegenerative diseases that, like AMD, are characterized by the formation of specific deposits, such as atherosclerosis or Alzheimer’s disease [4,29]. The response induced by 7KCh seems to depend on the cell type and dose used, and little is known about its mechanism of action in retinal cells [35]. The study of the signaling pathways involved in the response to 7KCh in RPE cells could provide a new perspective on the molecular mechanisms that lead to the development of AMD.
Likewise, it would be interesting to find a molecule capable of counteracting the deleterious effect of 7KCh in the retina. Sterculic acid (SA) is a natural cyclopropane fatty acid mainly obtained from the seeds of Sterculia foetida. SA is known to inhibit the enzyme from de novo lipogenesis SCD1 (Stearoyl coenzyme-A desaturase 1) [36,37,38]. One of the most promising breakthroughs in the last decade regarding SA has been the discovery of its potential as a functional antagonist of 7KCh in the human RPE cell line ARPE-19 [19,20,35]. At low concentrations, SA protected these cells from 7KCh-induced toxicity and inflammation. Moreover, SA was able to reduce in vivo laser-induced CNV levels in a rat model, suggesting that SA could be a good candidate for the treatment of AMD [19,32]. We have previously reported the potential of SA for the treatment of retinal diseases, as it has no toxic effects on RPE cells and regulates crucial pathways related to survival, inflammation and cell death. However, the mechanism by which SA attenuates the 7KCh effect is still poorly understood and seems to be independent of its ability to inhibit SCD1 [39]. Therefore, the study of the mechanism of action of SA in the inhibition of the 7KCh response in RPE cells would be of interest in the improvement of the therapies currently used in AMD.
In this work, genome-wide transcriptomic analysis has been used to unravel the molecular pathways induced by 7KCh as well as the inhibition that SA exerts on the response of this oxysterol in RPE cells. Results showed a wide range of genes altered in response to 7KCh and reaffirmed the potential of SA as a functional antagonist of this oxysterol in the retina.

2. Results

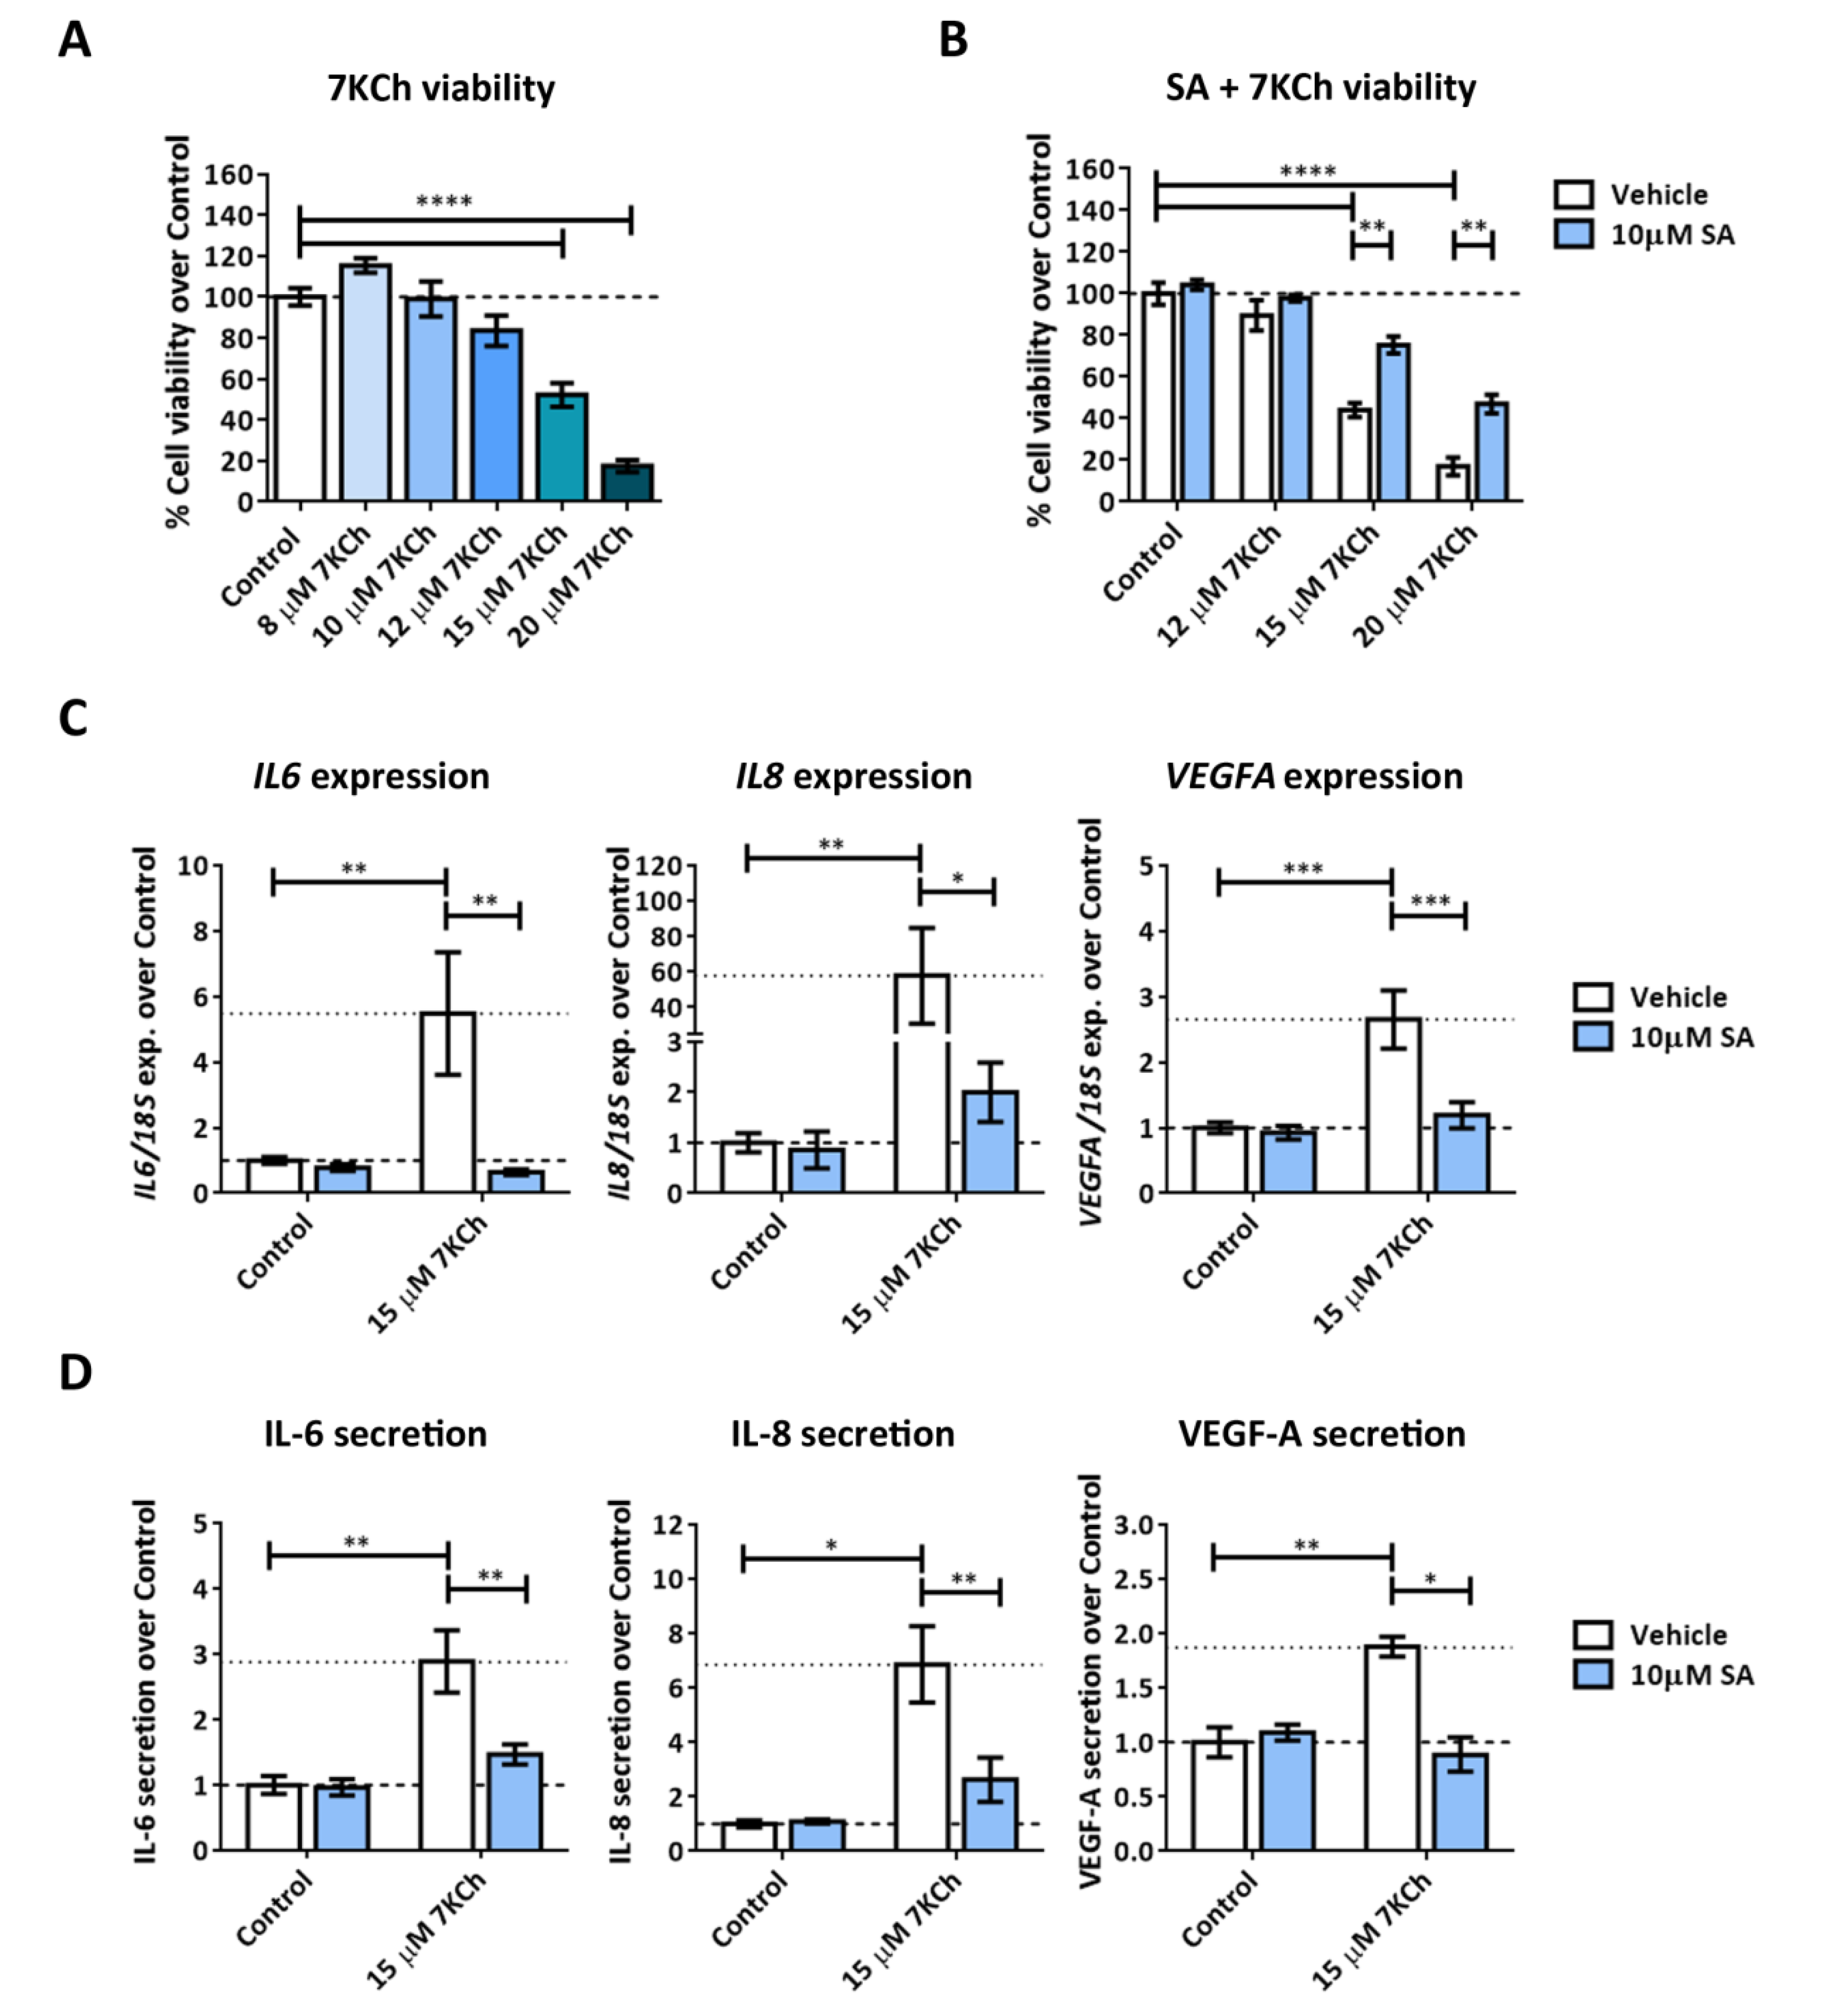
2.1. 7KCh Induces Cell Death and Inflammatory Responses in mRPE Cells, Which Are Attenuated by SA Administration

We treated mRPE (monkey retinal pigment epithelium) cells for 24 h with increasing concentrations of 7KCh (8–20 μM) in order to test its effect on cell viability by MTS assay. At 15 μM, 7KCh produced a decrease of approximately 50% in cell viability, and at 20 μM, the viability was reduced to almost 20% (Figure 1A).
Co-treatment with 10 μM SA showed a protective effect over 7KCh-induced toxicity even at the highest concentration of 7KCh used (Figure 1B). On the other hand, incubation with 15 μM 7KCh induced inflammation in mRPE cells, which was observed by the increase in the gene expression levels of IL6, IL8 and VEGFA after 24 h of treatment (Figure 1C) and by the increase in the secretion of these cytokines to the medium after 48 h (Figure 1D). The addition of 10 μM SA attenuated both the increase in gene expression and secretion of the three cytokines evaluated (Figure 1C,D).

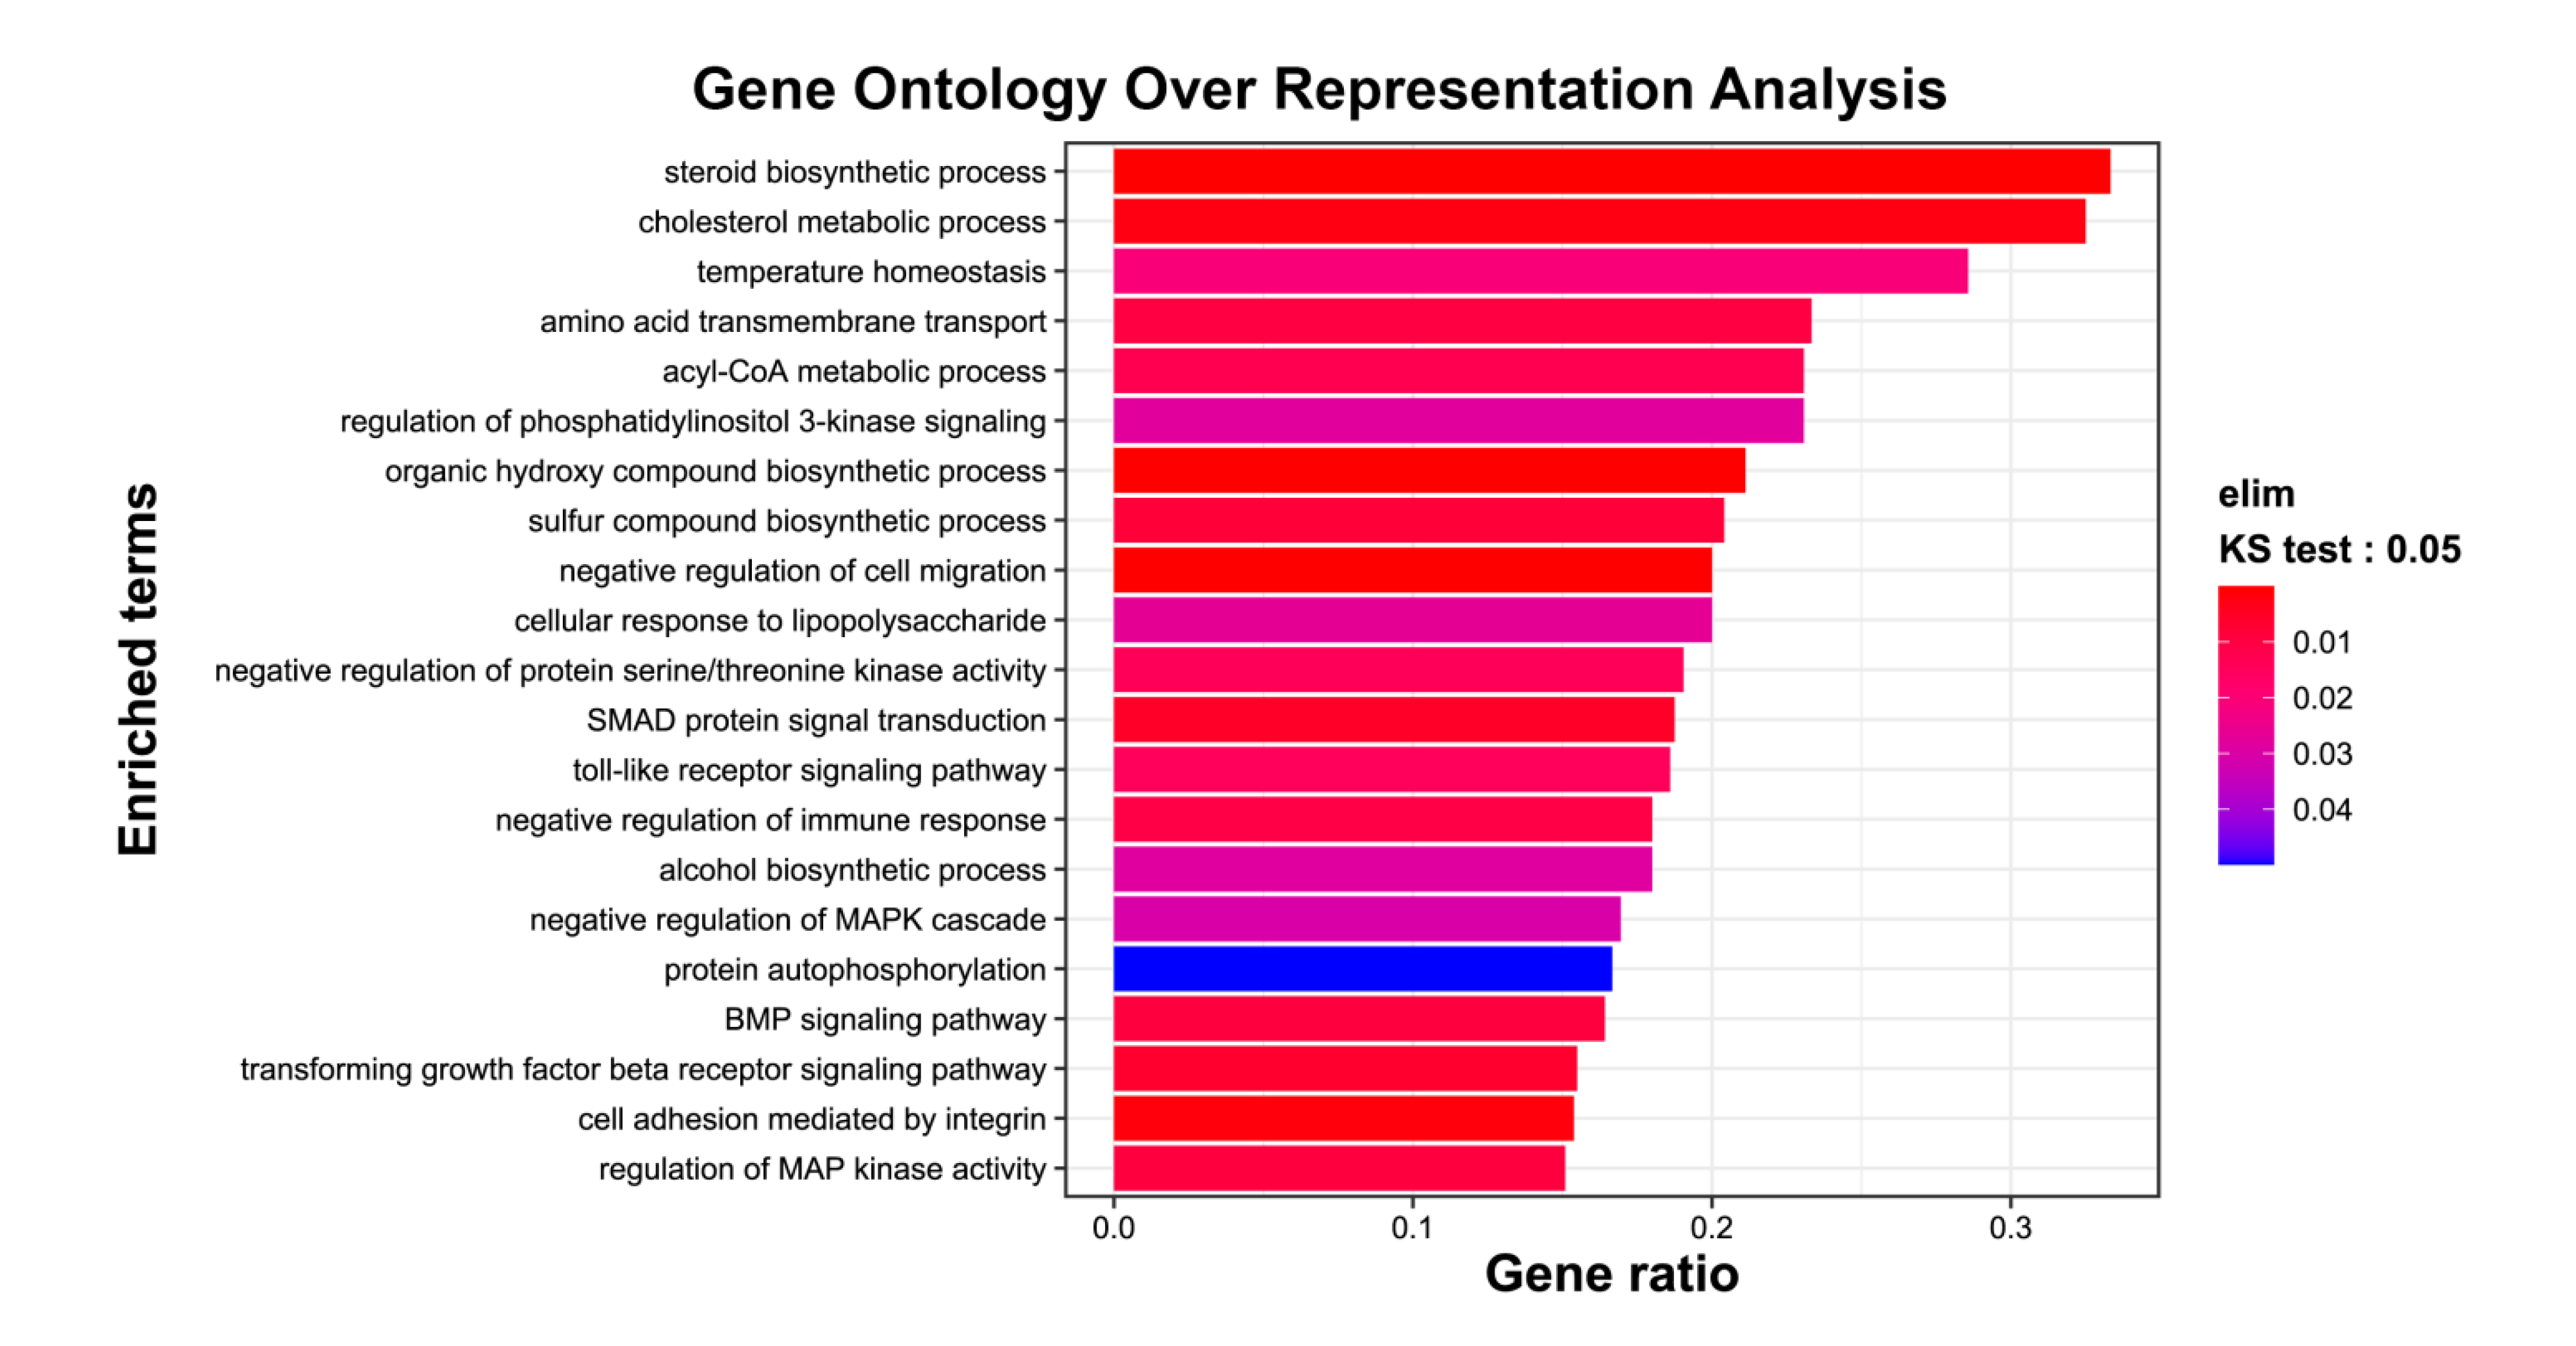
2.2. Exposure of mRPE Cells to 7KCh Causes Modulation of Genes Associated with Lipid Metabolism, ER (Endoplasmic Reticulum) Stress, Inflammation and Cell Death

In order to study the signaling pathways involved in the response of retinal cells to 7KCh, the genetic profile of mRPE cells exposed to this oxysterol was analyzed. Genome-wide transcriptome analysis was performed in mRPE cells treated with 15 μM 7KCh for 24 h to locate differentially expressed genes (DEGs) with respect to control cells. After applying FDR (false discovery rate) methods [40], 757 DEGs were found between 7KCh-treated and control cells (Table S1). TOP GO (Gene Ontology) enrichment analysis showed a wide range of biological processes were modified in response to 15 μM 7KCh exposition (Figure 2). A summary of relevant genes altered by 7KCh in mRPE cells and the associated pathways can be found in Table 1.
First, we found a strong negative regulation over the expression of several genes of fatty acid biosynthesis (ACACA, ACLY, CAV1, FADS1, FADS2, FASN, SCD) and, especially, sterol biosynthesis (FDFT1, HMGCR, HMGCS1, INSIG1, LDLR, LSS, MSMO1, MVD, MVK, SQLE). Likewise, an increase in the expression levels of genes associated with ER (endoplasmic reticulum) stress was observed (ASNS, ATF3, CEBPB, CEBPG, EIF2S2, ERN1, GFPT1, HSPA5, HYOU1, PREB, SRPRB, SSR1), as well as in the expression of several genes belonging to MAPK and NFκB inflammatory pathways (CXCL2, EGFR, FOSB, IL1A, IL6, MAP2K1, MAP3K8, MYC, NFKBIA, NFKBIB, NFBIZ, TRAF1, VEGFA). Lastly, some genes of different cell death pathways were also upregulated by 7KCh treatment (CASP1, DFNA5, GADD45A, PMAIP1, TNFRSF10B, TP53I3).

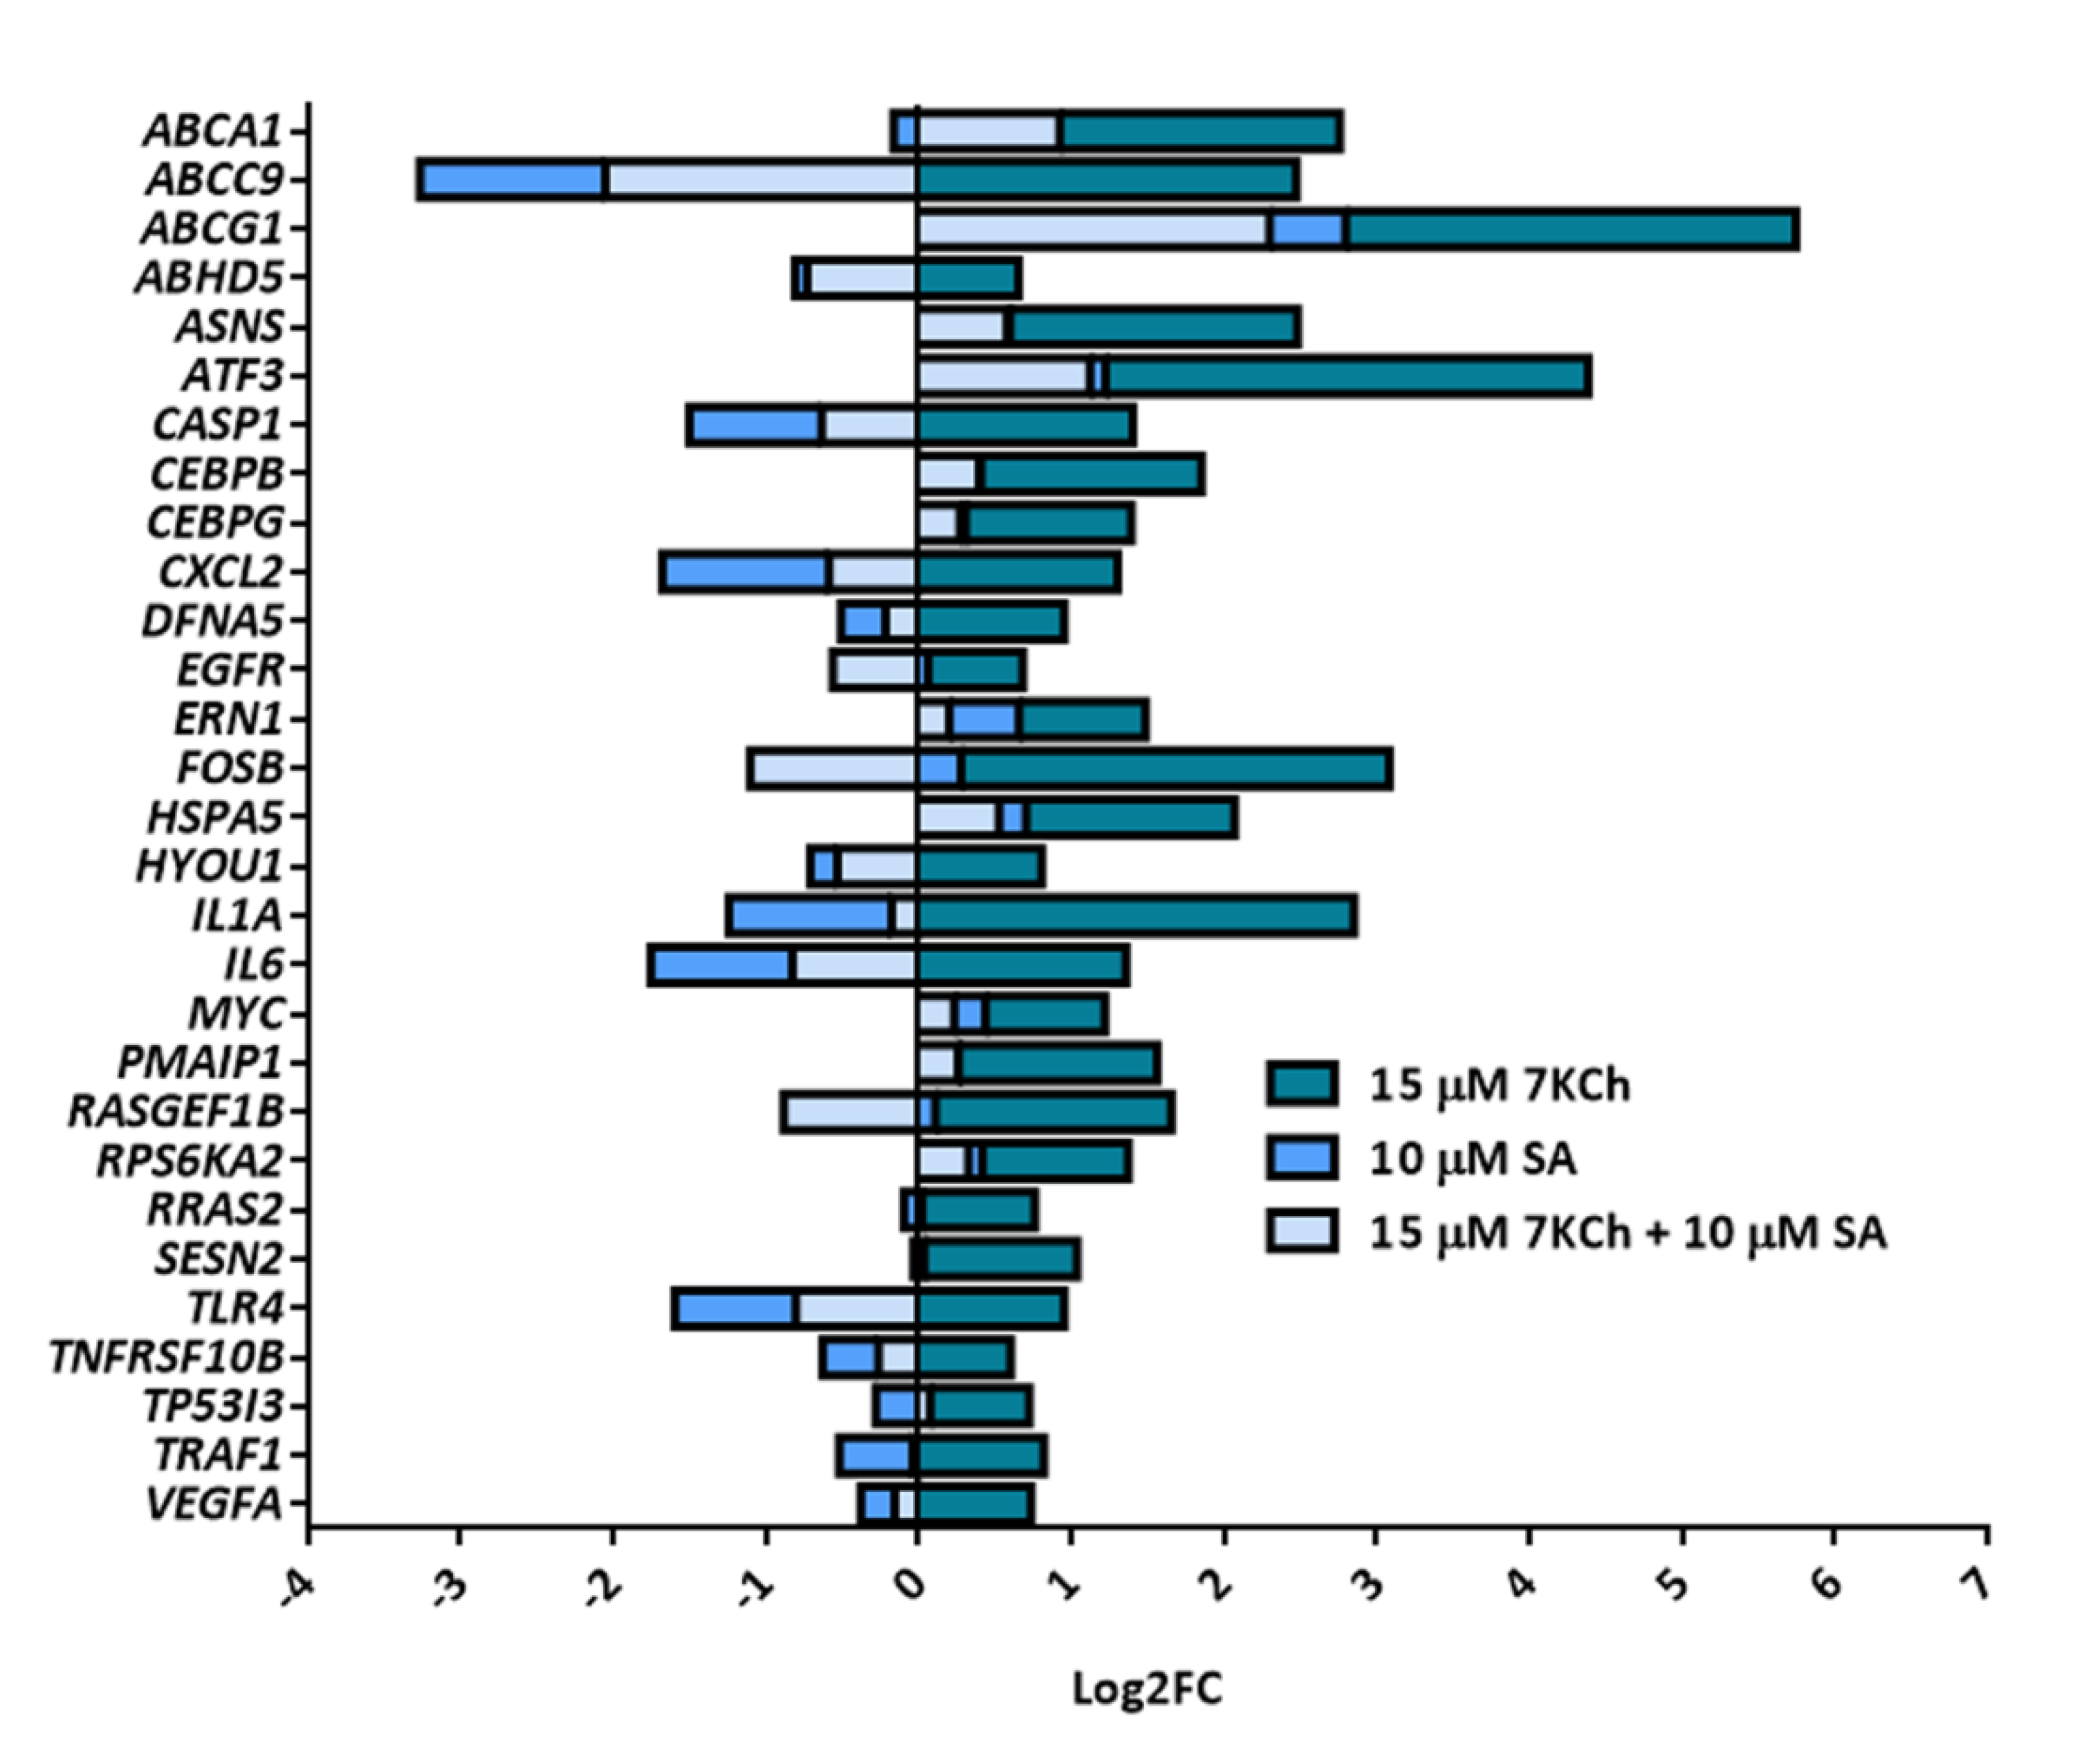
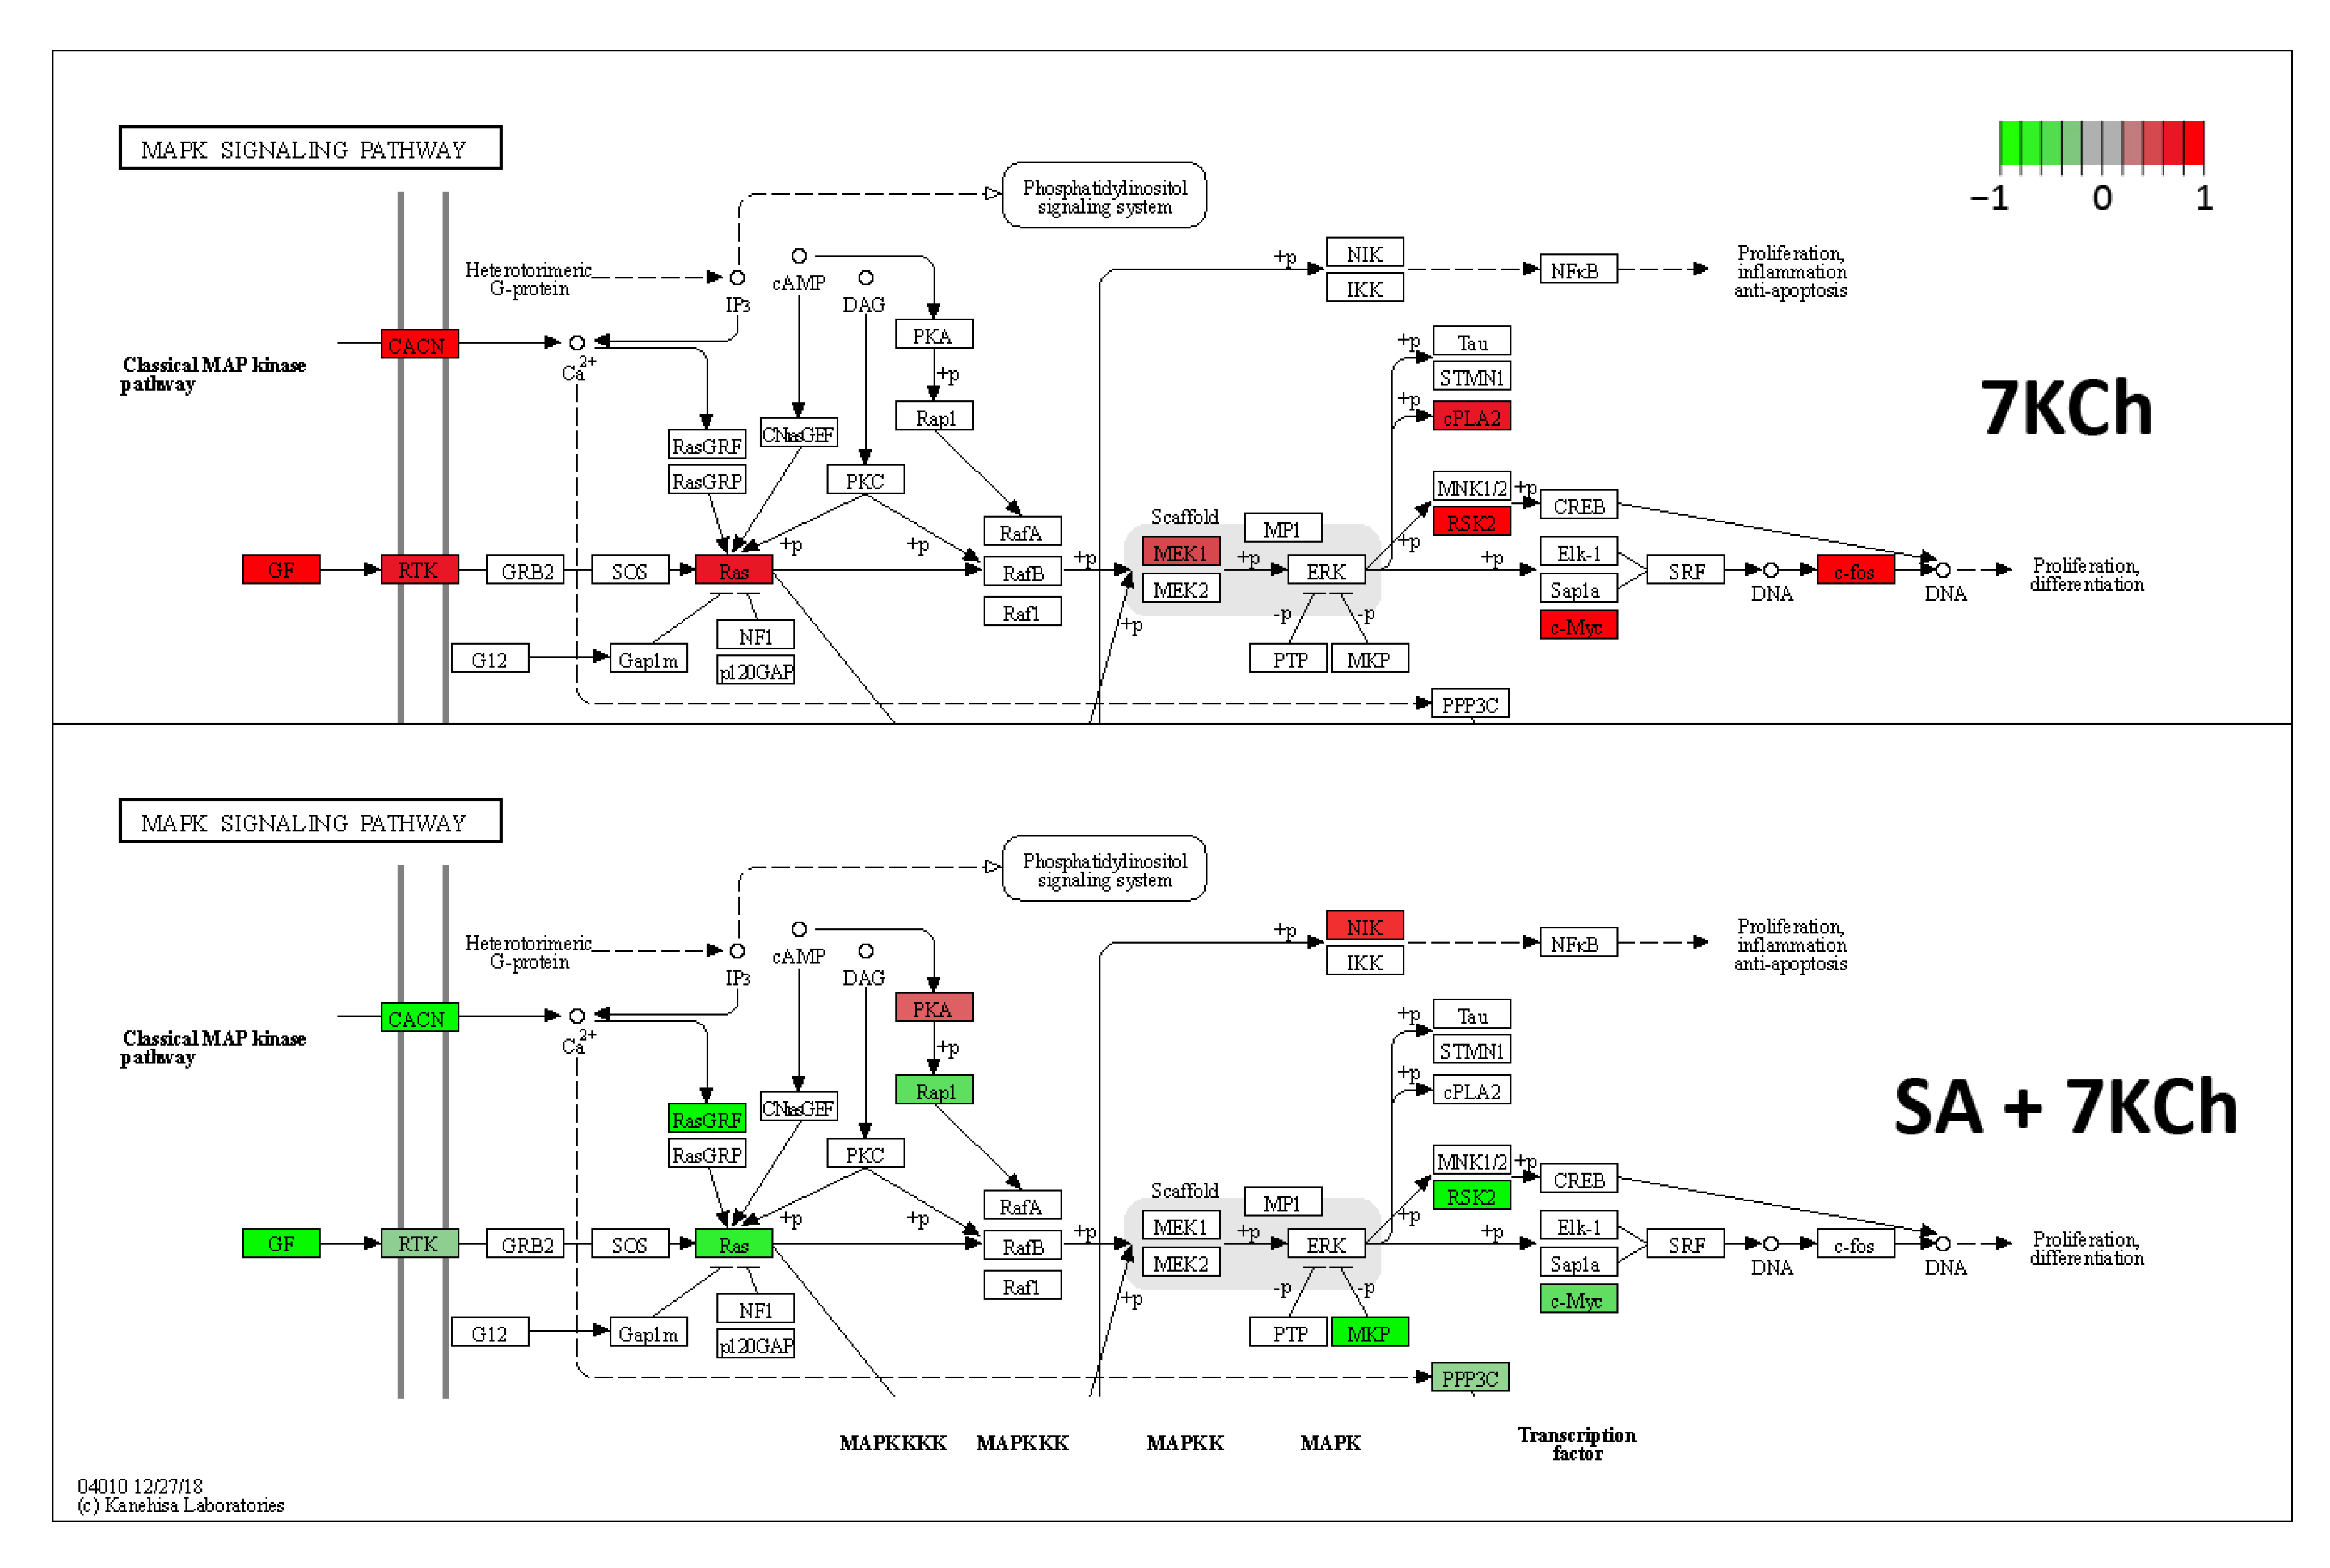
2.3. SA Exerts a Reverse Effect on the Modulation of Part of the Genes Altered by 7KCh

Genome-wide transcriptome analysis was also performed in mRPE cells treated with the combination of 10 μM SA and 15 μM 7KCh. We obtained 1291 DEGs between the combined treatment and 7KCh alone. Compared with DEGs found between 7KCh-treated and control cells, SA was able to reverse the modulation of 212 genes altered by 7KCh and associated with ER stress, inflammation and cell death (Table S2). Figure 3 summarizes this reversion effect.

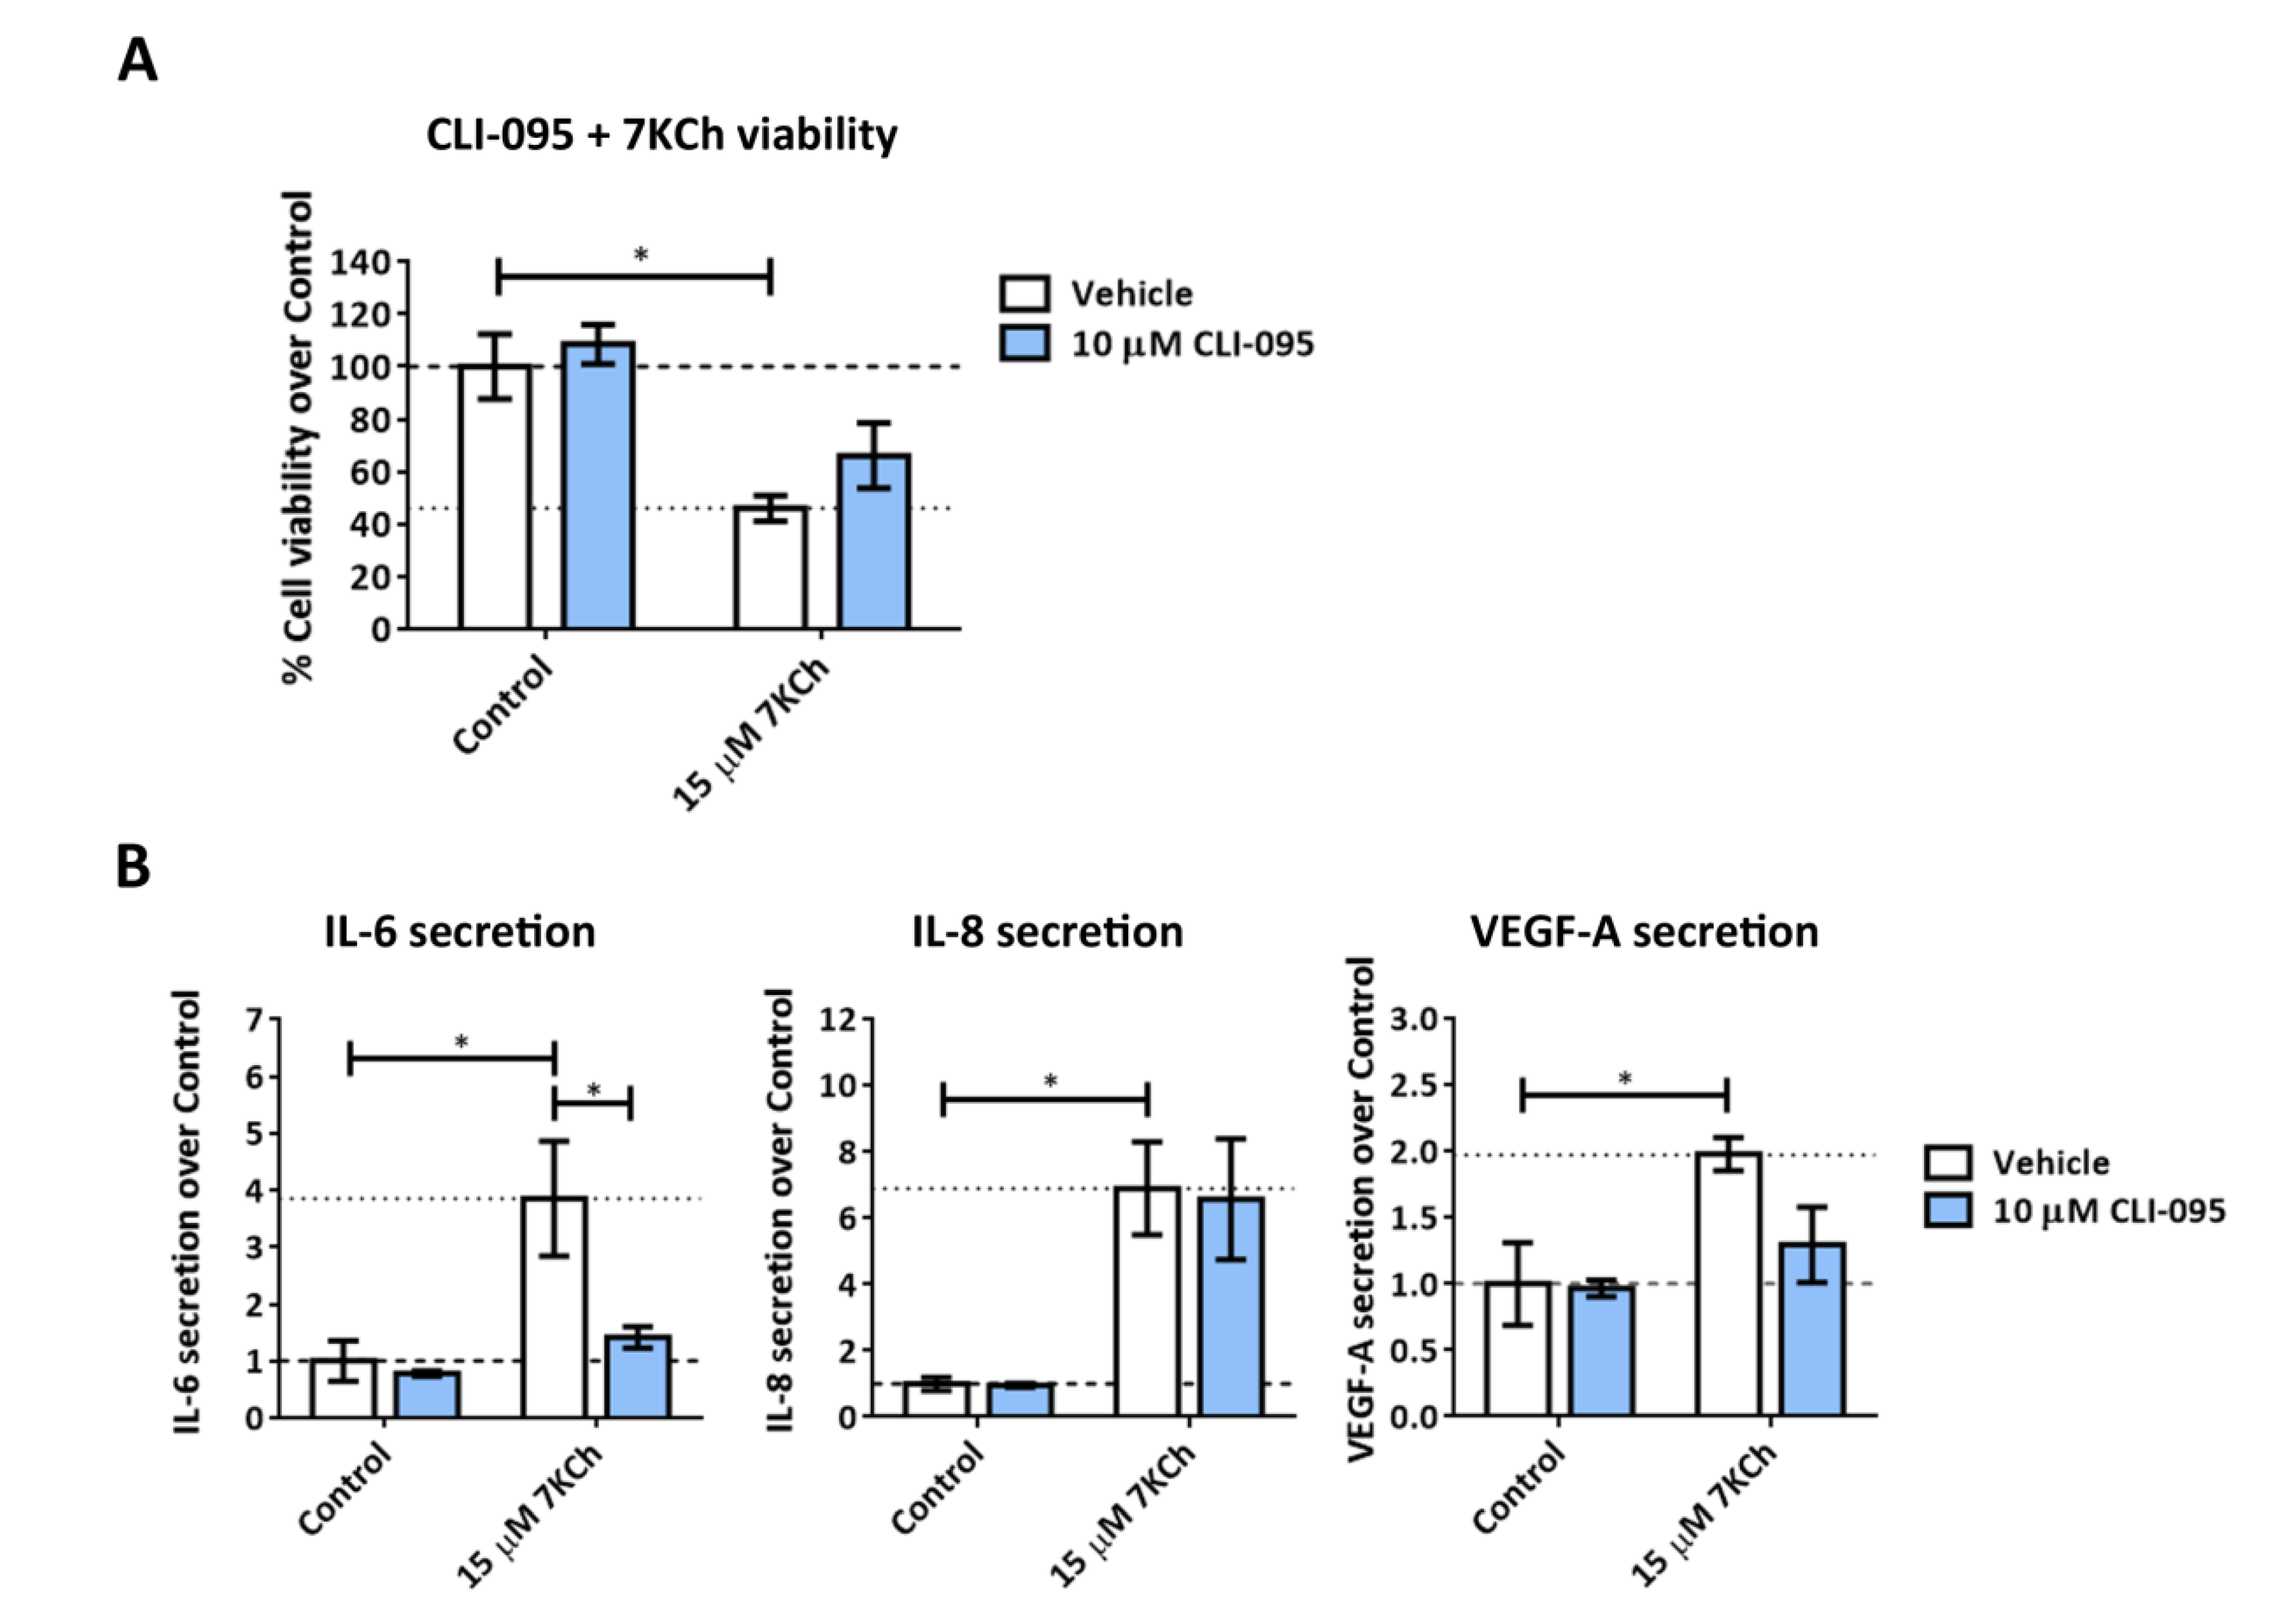
2.4. TLR4 Does Not Have an Important Role in Mediating 7KCh-Response in mRPE Cells

TLR4 has been previously proposed as the major receptor mediating 7KCh-response in ARPE-19 cells [20]. In addition, data obtained from transcriptome sequencing in mRPE cells showed an increase in TLR4 expression. For that reason, we tested the implication of the TLR4 receptor in 7KCh-induced inflammation and cell death in mRPE cells. We treated mRPE cells with 15 μM 7KCh and the specific TLR4 inhibitor CLI-095 at the concentration of 10 μM. No effect was observed over 7KCh-induced toxicity as assessed by MTS assay (Figure 4A). Regarding inflammation, ELISAs showed that TLR4 inhibition was only capable of attenuating IL-6 secretion to the medium.

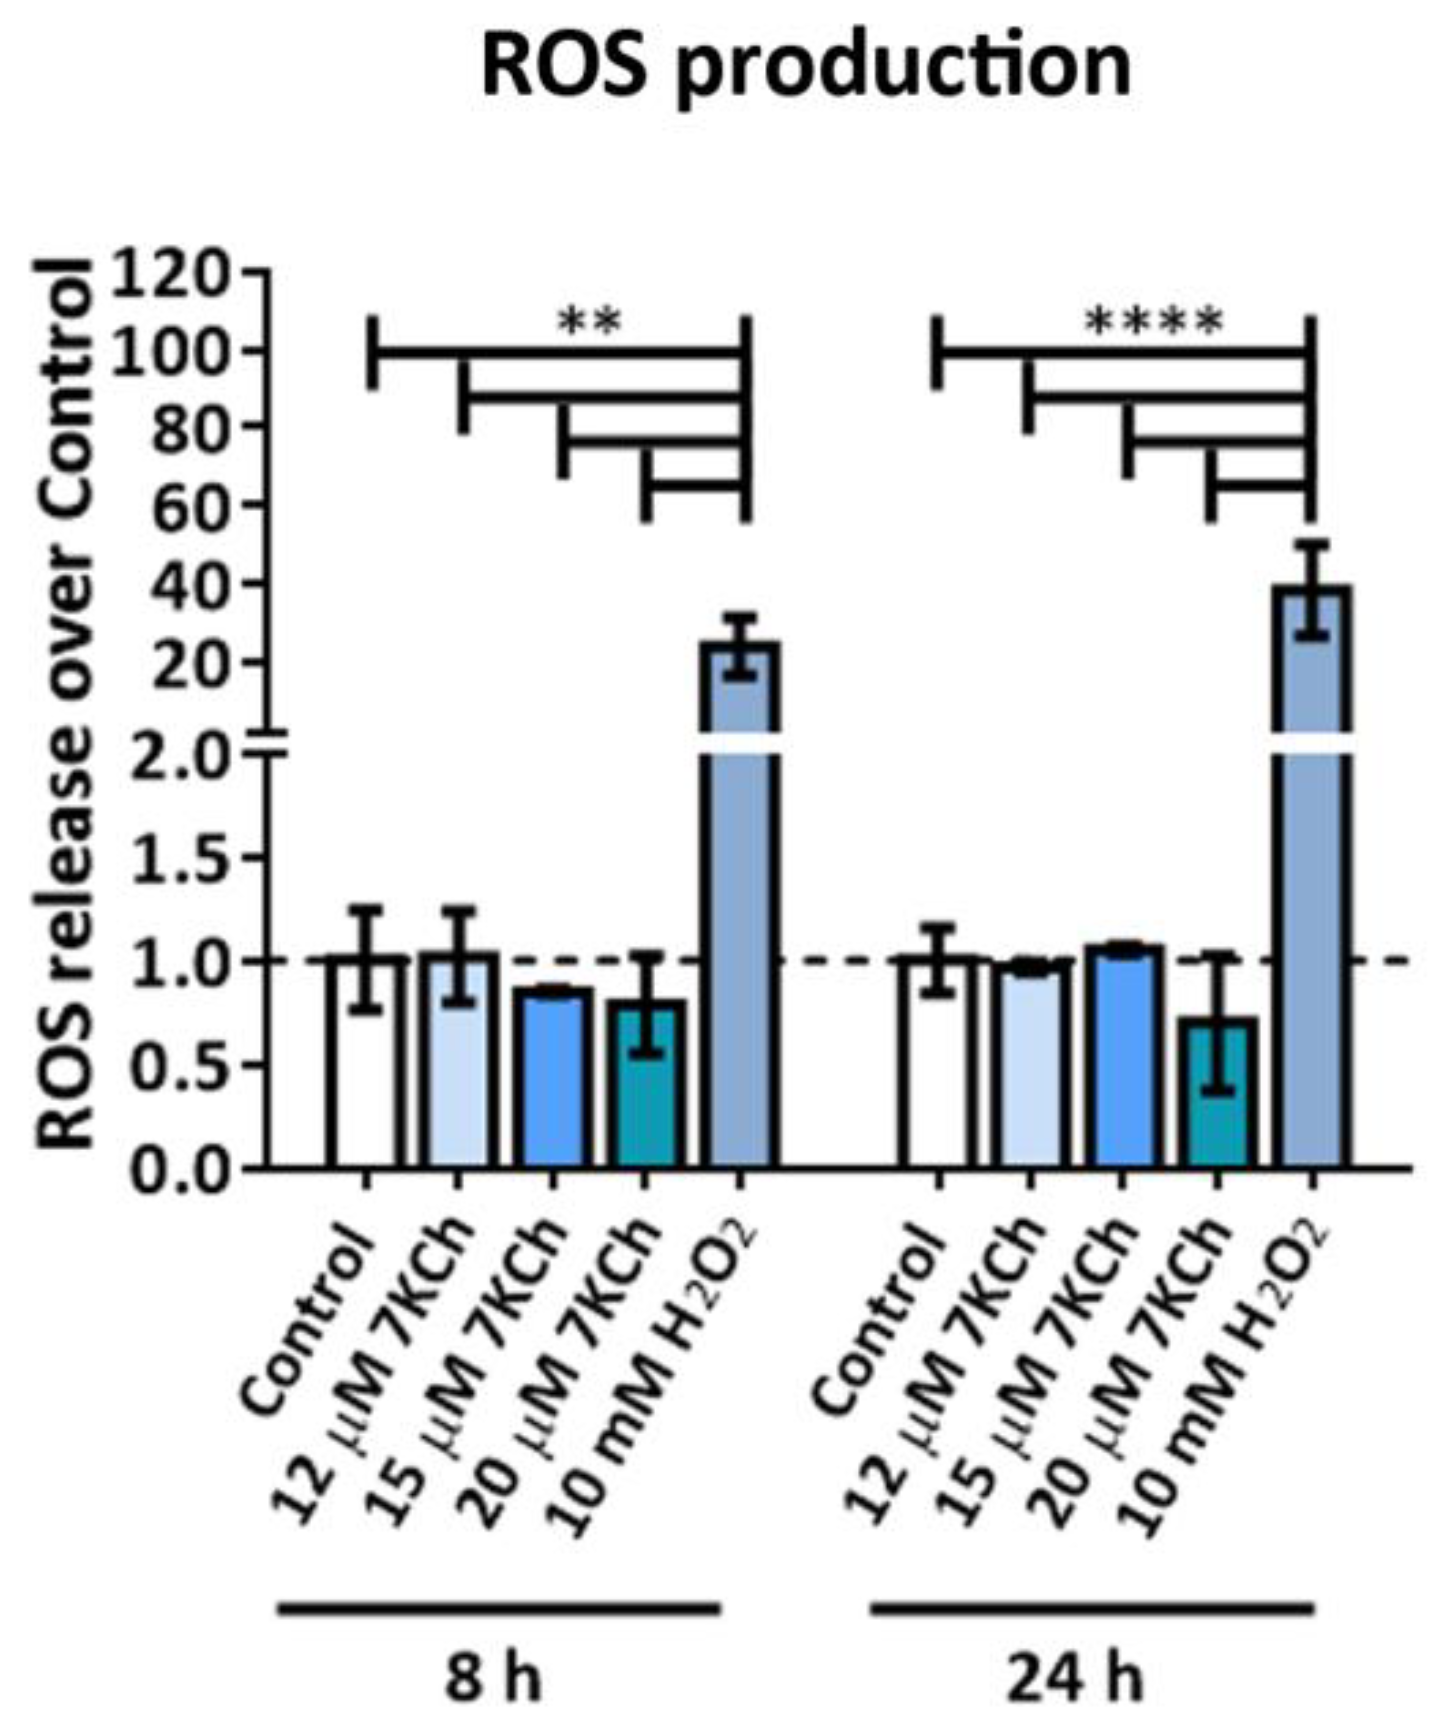
2.5. 7KCh Does Not Induce ROS Release in mRPE Cells

In order to study the induction of oxidative stress in response to 7KCh, we measured ROS levels in mRPE cells incubated with 12–20 μM 7KCh for 8 h and 24 h. Treatment with 10 mM H2O2 was used as a positive control [41]. No difference was observed between cells exposed to the oxysterol and non-treated control cells (Figure 5), indicating that the response exerted by 7KCh in retinal cells is independent of ROS production.

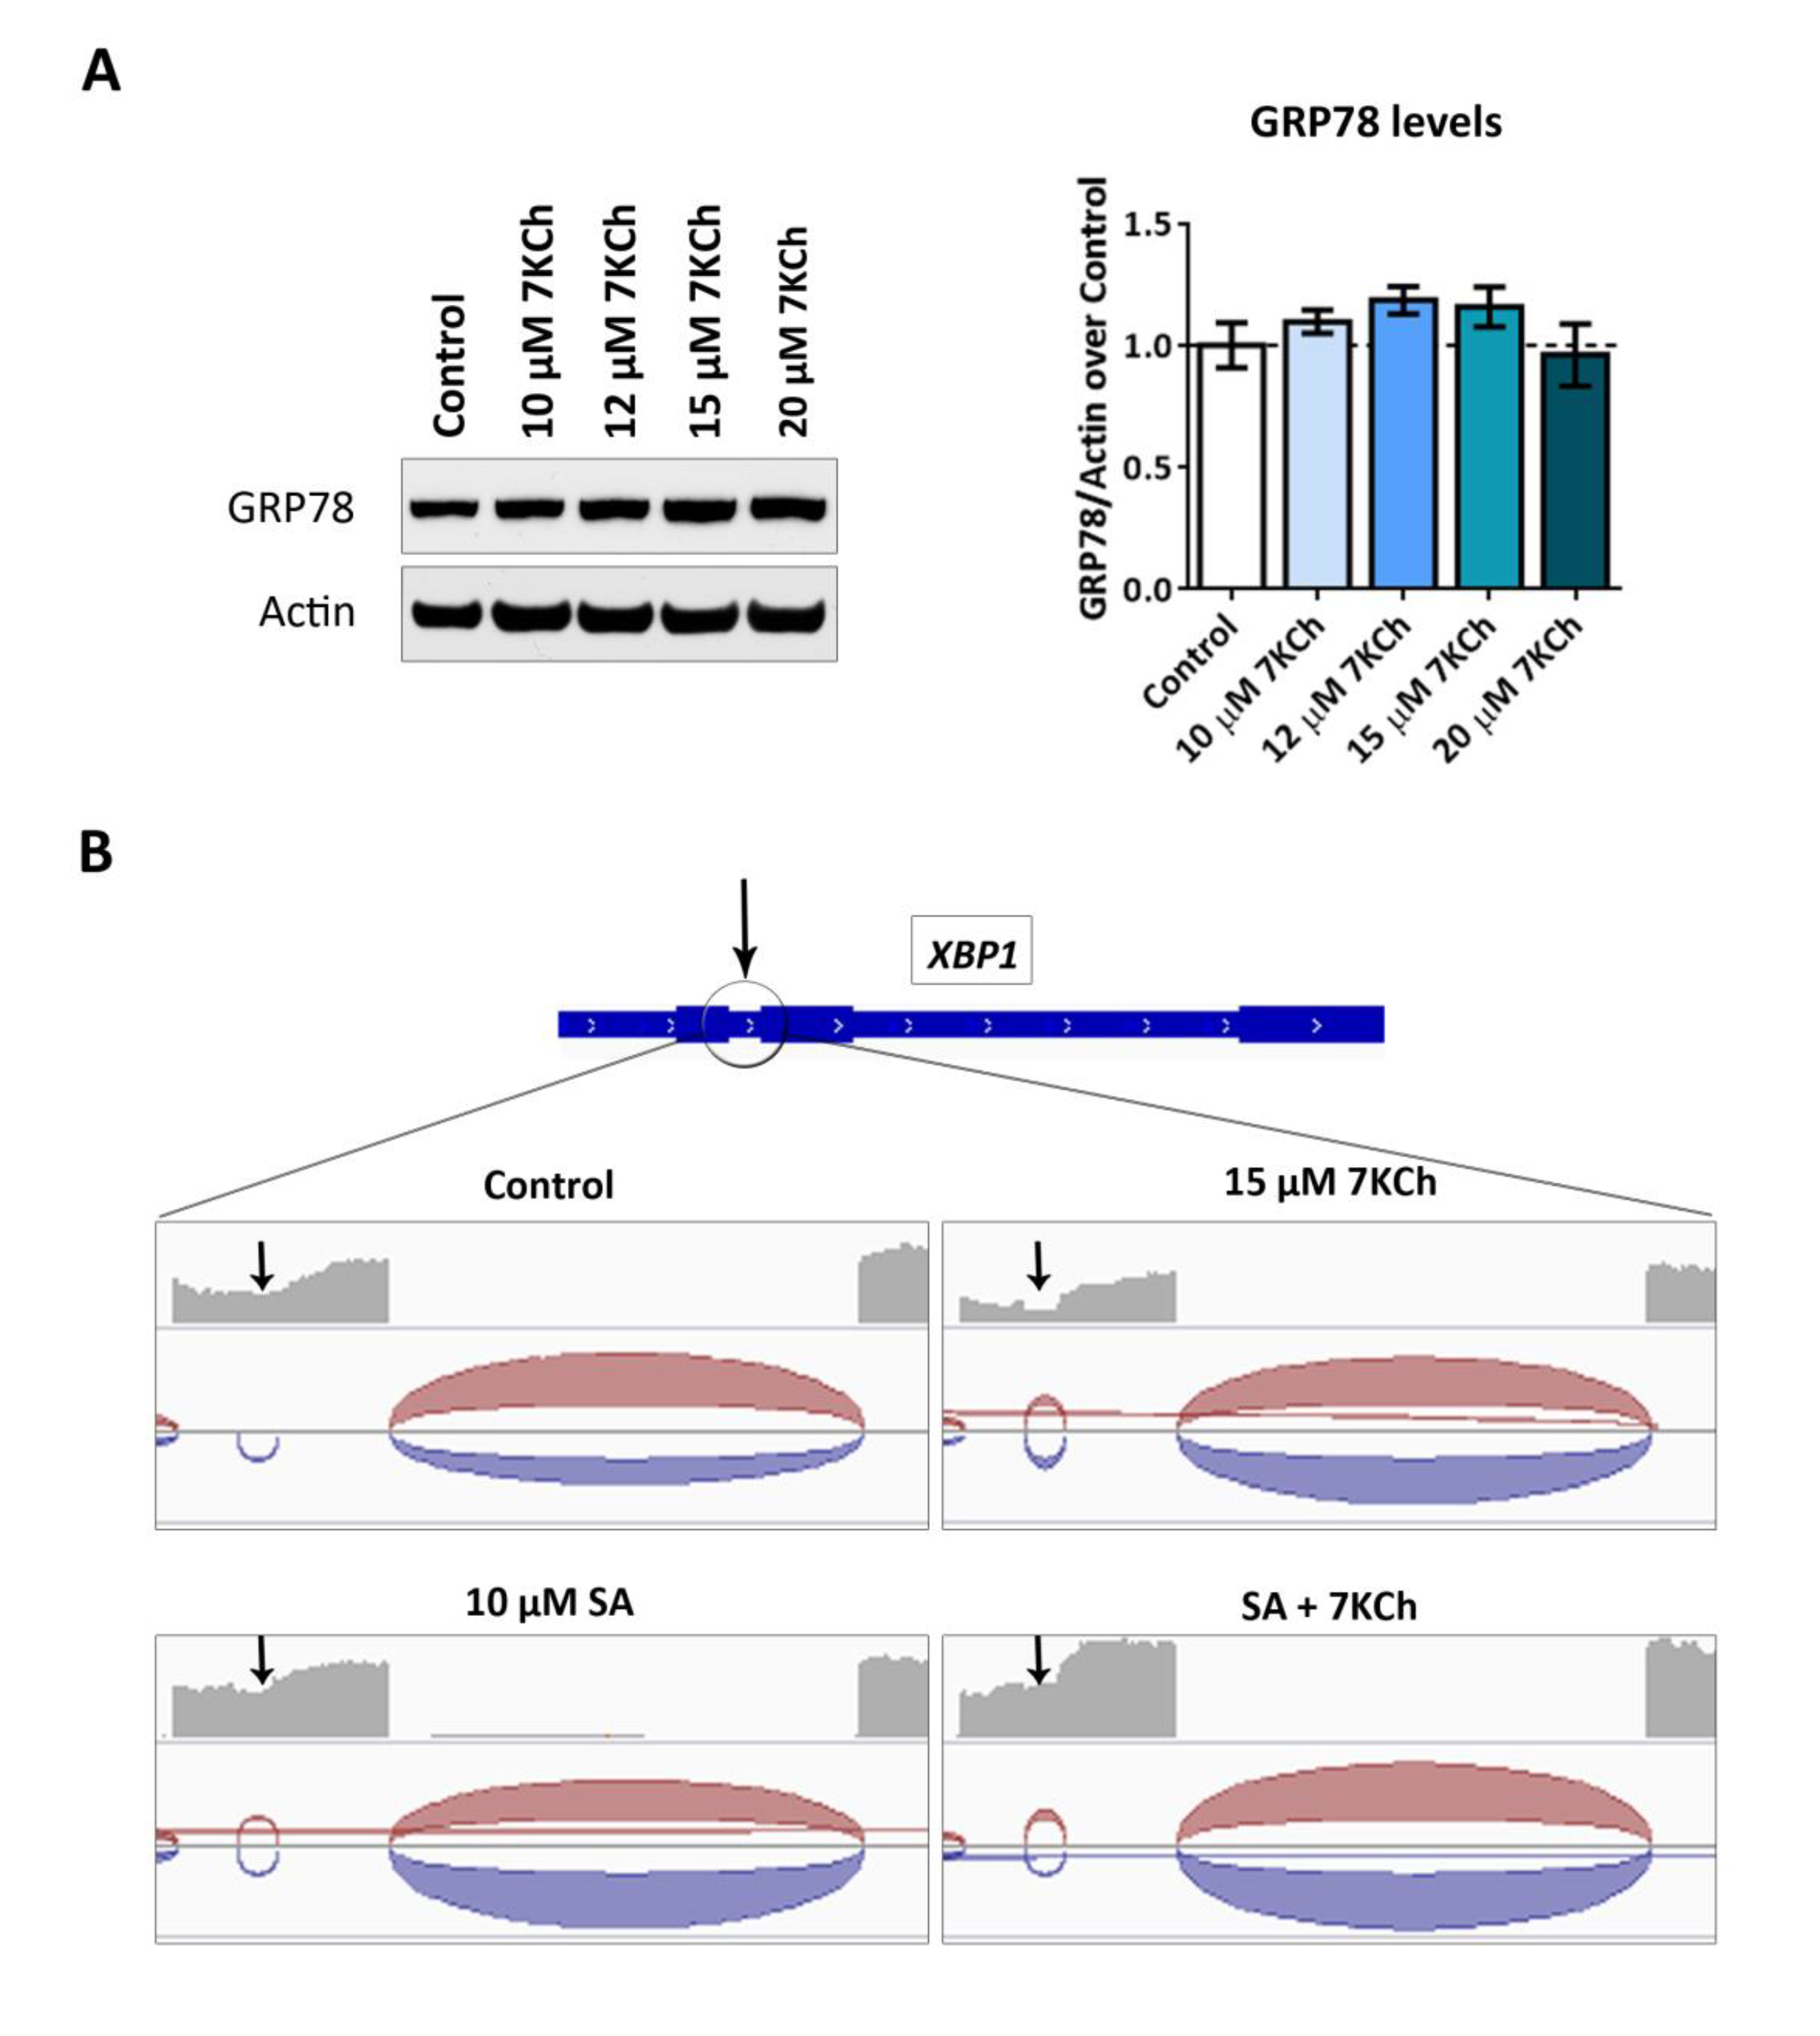
2.6. ER Stress Induced by 7KCh in mRPE Cells Is Mediated by the Unfolded Protein Response

Data obtained from the transcriptome analysis showed an upregulation of several genes related to ER stress and, specifically, to the unfolded protein response (UPR). Among these genes, we found HSPA5, coding for GRP78, and ERN1, coding for IRE1, two important regulators of this response. We also found some genes related to PERK activation, such as ASNS, ATF3 and CEBPG, and genes coding for proteins that are accumulated in the ER in response to stress, such as HYOU1. Treatment with SA reduced the expression of several of these genes, including HSPA5, HYOU1, ERN1, CEBPG and ATF3 (Figure 3, Table S2).
To verify UPR activation, we first evaluated by Western blot the effect on GRP78 accumulation in mRPE cells exposed for 24 h to different concentrations of 7KCh (10–20 μM) (Figure 6A). However, no difference was found between the GRP78 levels detected in control cells and 7KCh-treated cells at any of the doses used. Secondly, since IRE1 promotes XBP1 mRNA splicing and, consequently, its activation [42], we checked whether XBP1 splicing occurs in cells exposed to 7KCh. By using the IGV (Integrative Genome Viewer) software, we found in the mRPE RNAseq samples that exposure to 7KCh induced XBP1 splicing, thus promoting UPR signaling (Figure 6B). Interestingly, treatment with 10 μM SA counteracted XBP1 activation, preventing its splicing.

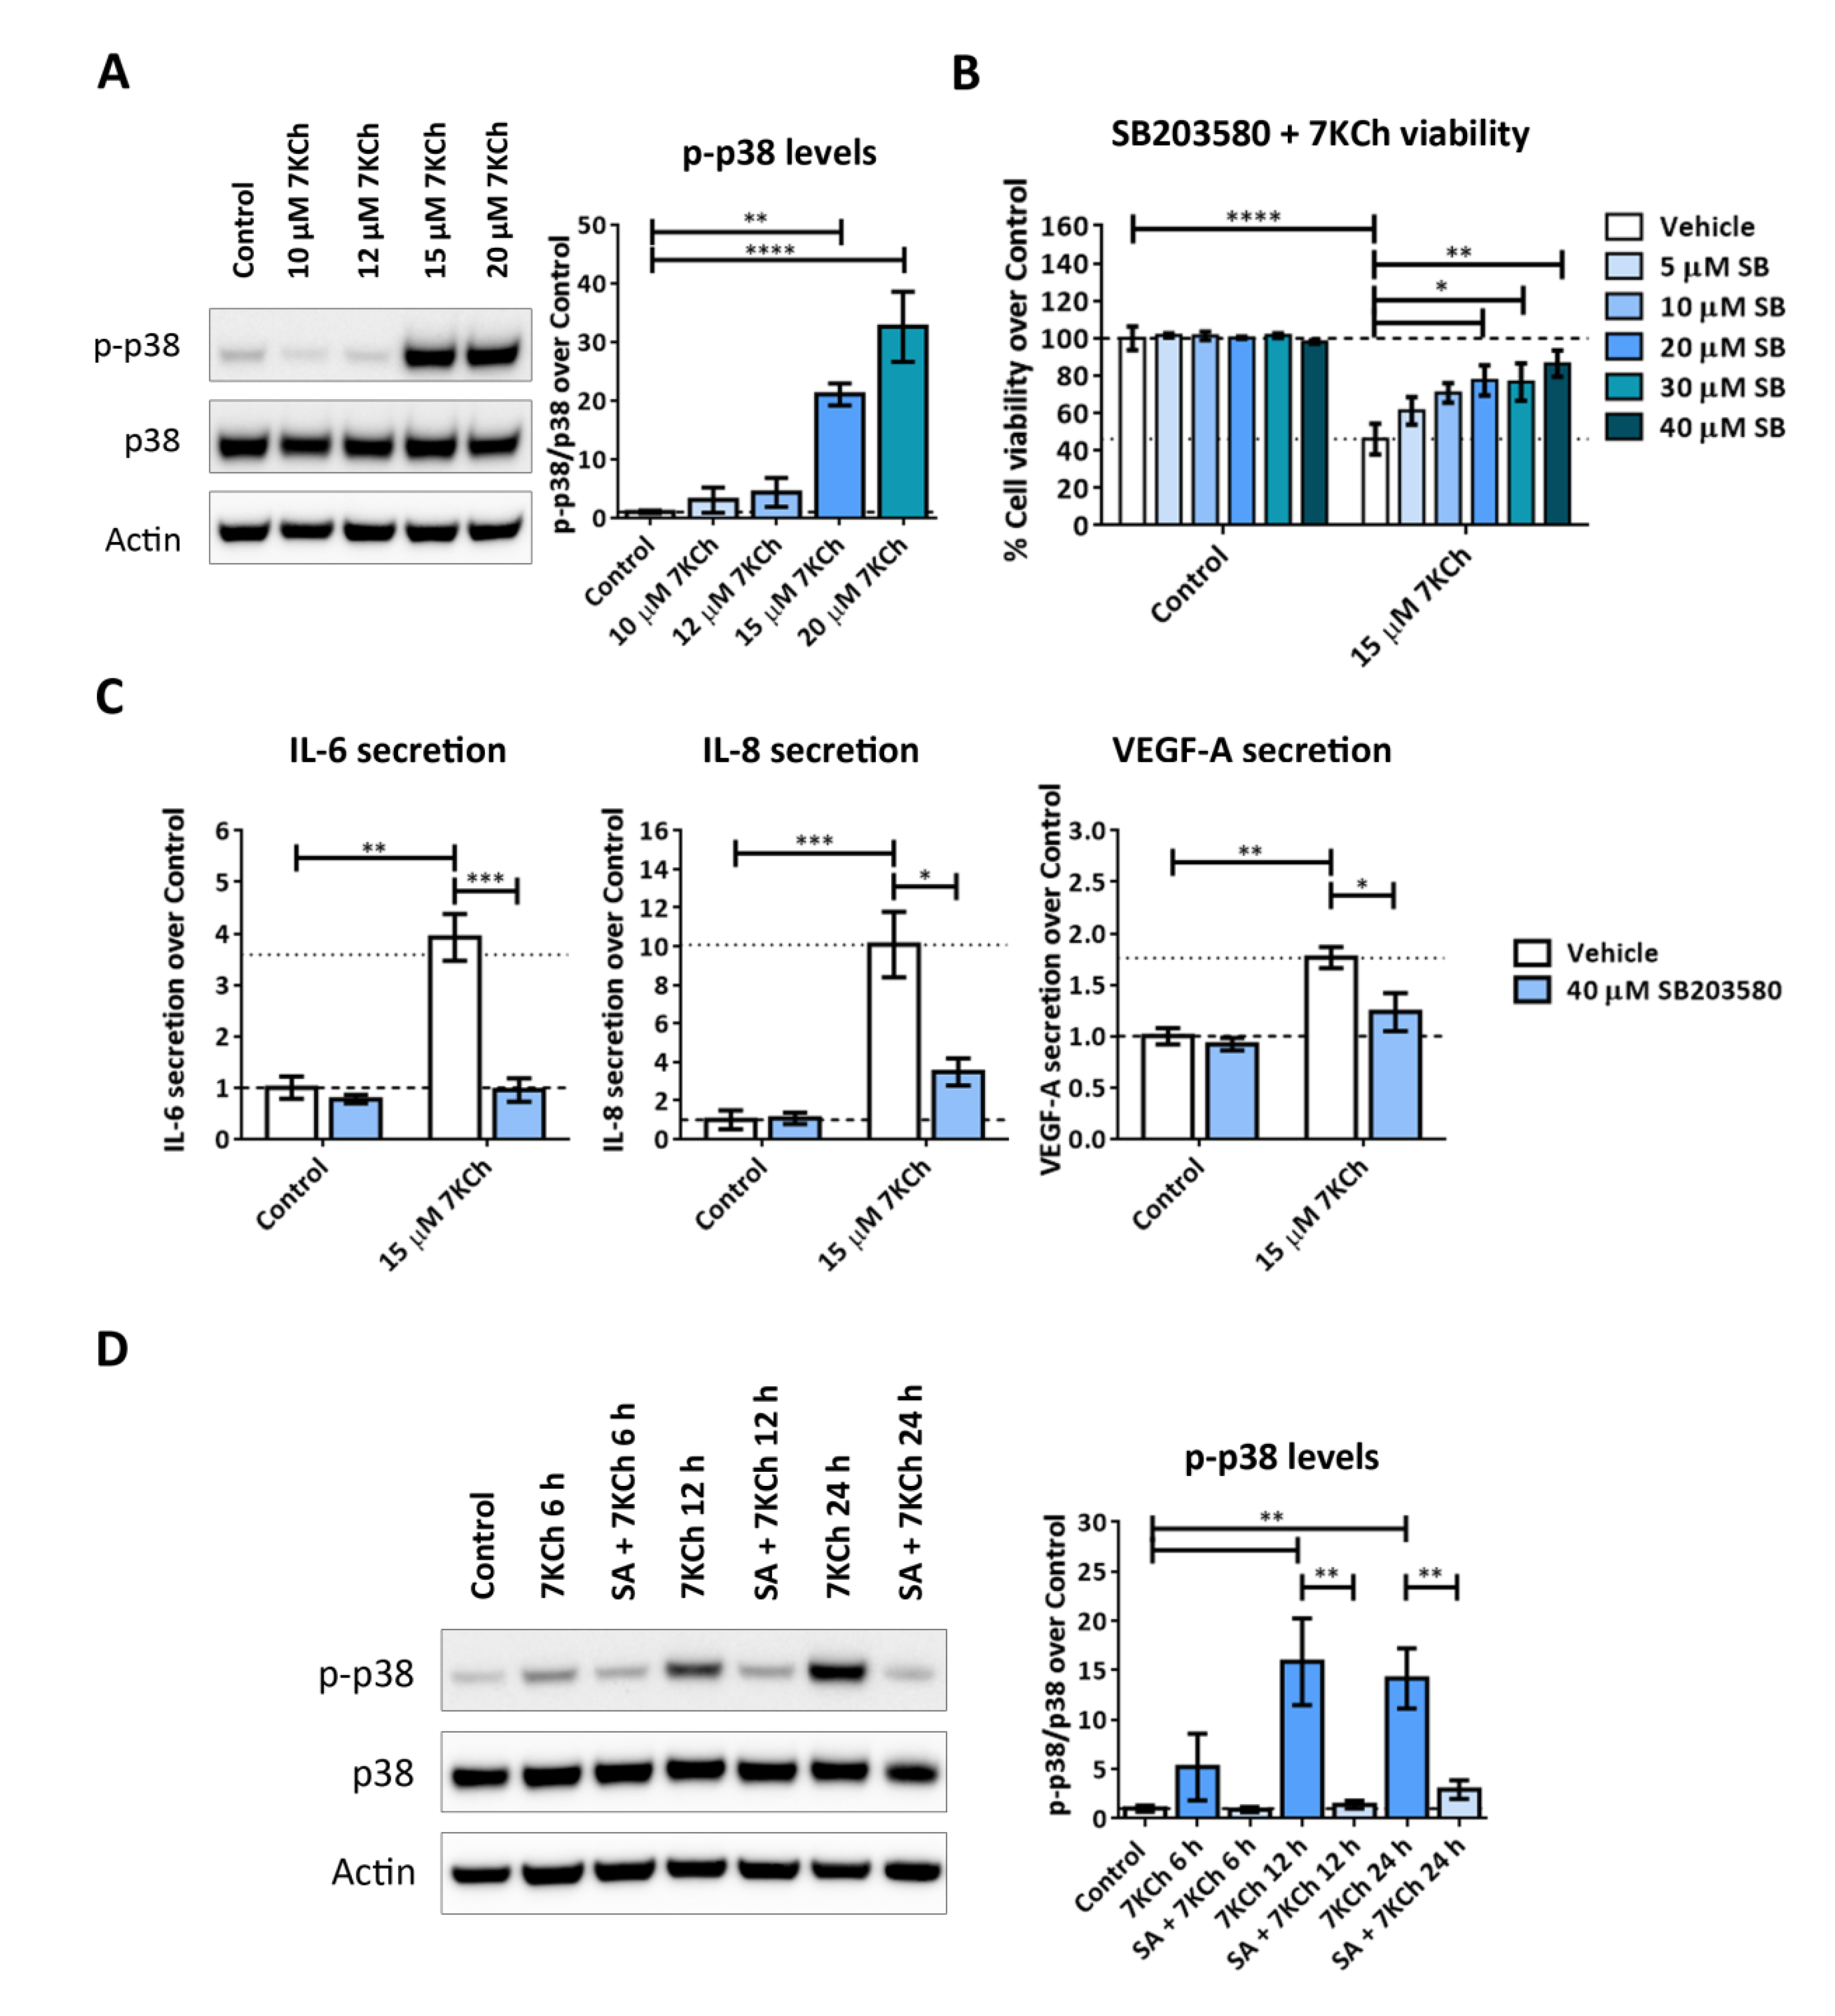
2.7. Both JNK and p38 Pathways Are Involved in the Inflammatory Response to 7KCh in mRPE Cells, but Only p38 Participates in the Cell Death Response

Upregulation of the classical MAPK pathway was observed in response to 7KCh in transcriptomic data, which was almost reversed with co-treatment with SA (Figure 7). The signaling pathways of JNK and p38 are related to MAPK activation. Although at the transcriptomic level no modulation over JNK or p38 was observed in mRPE cells exposed to 15 μM 7KCh, we decided to deepen our investigation into their involvement in the response to 7KCh since these proteins are activated by phosphorylation.
We checked by Western blot the JNK phosphorylation in mRPE cells treated with increasing concentrations of 7KCh for 24 h (Figure 8A). A dose-dependent activation was observed, reaching its highest level of phosphorylation with 15 μM 7KCh, and decreasing with 20 μM 7KCh, coinciding with an elevated toxicity of 7KCh (Figure 1A). This suggests a role of JNK in the inflammatory response but not in 7KCh-induced cell death. This observation was confirmed when mRPE cells were treated with 7KCh and SP600125, a JNK-specific inhibitor. SP600125 had no effect on 7KCh-induced toxicity (Figure 8B) but attenuated IL-6 and IL-8 secretion into the medium induced by 7KCh (Figure 8C). To further study JNK activation, we assessed its phosphorylation levels by Western blot at different times in mRPE cells treated with 20 μM 7KCh alone or with 10 μM SA. JNK activation started after 6 h of 7KCh treatment, reaching its maximum level of phosphorylation at 12 h and decreasing at 24 h (Figure 8D), again showing a decrease in JNK activation when 7KCh-induced toxicity is elevated. Co-treatment with 10 μM SA significantly attenuated JNK phosphorylation at both 6 h and 12 h of treatment.
Regarding p38 phosphorylation (p-p38), its activation was observed at 15 μM 7KCh and reached its highest level at a concentration of 20 μM. This suggests that activation of p38 may be related to both 7KCh-induced inflammation and cell death in mRPE cells. The inhibition of p38 with SB203580 significantly reduced the toxicity induced by 15 μM 7KCh in the range of concentrations from 20–40 μM (Figure 9B). In addition, 40 μM SB203580 attenuated the release of the cytokines IL-6, IL-8 and VEGF-A to the medium, promoted by 15 μM 7KCh (Figure 9C). When p38 activation was evaluated in mRPE cells treated with 20 μM 7KCh and 10 μM SA at different times, phosphorylation of p38 was observed after 12 h of treatment and its activation was maintained after 24 h of exposure to 20 μM 7KCh (Figure 9D). On the other hand, co-treatment with 10 μM SA significantly attenuated p38 activation at both 12 h and 24 h. Taken together, these results suggest that both JNK and p38 are involved in the inflammatory response, but only p38 mediates 7KCh-induced cell death.

3. Discussion

In this work, we have shown that exposure to 7KCh in RPE cells transcriptionally modulates the expression of several genes associated with different cell processes. Likewise, co-treatment with SA significantly reverses the alteration exerted by 7KCh over several key genes, as well as attenuates the activation of the signaling pathways associated with these genes, highlighting the role of SA as a functional antagonist of this oxysterol in the retina.
First, we verified the ability of 7KCh to induce both inflammation and cell death in mRPE cells and the capacity of SA to counteract these effects (Figure 1). We had already demonstrated that SA not only protected mRPE cells but also ARPE-19 (human RPE cells) and RF/6A (monkey choroid cells) from 7KCh toxicity [39]. These results are also in line with those previously described in ARPE-19 cells [19,20]. Then, in order to delve into the mechanism of action of 7KCh in the retina, we performed for the first time a genome-wide transcriptome analysis in mRPE cells treated with 15 μM 7KCh. This concentration of 7KCh was selected on the basis that at 15 μM 7KCh, viability has been approximately halved (Figure 1A), but there is still a strong inflammatory induction observed through cytokine release into the medium (Figure 1D). Transcriptome analysis revealed that 15 μM 7KCh upregulates several genes associated with ER stress (UPR signaling), inflammation (cytokines, NFκB and MAPK pathways) and cell death, among others (Figure 2, Table 1 and Table S1). In previous works, authors showed by means of qRT-PCR that 7KCh could increase expression levels of different cytokines and UPR-related genes in ARPE-19 cells [19,20,24,43]. Our results not only validate these previous observations but also offer a broader view of the regulation that 7KCh exerts on retinal cells. On the other hand, we also performed genome-wide transcriptome analysis in mRPE cells treated with both 15 μM 7KCh and 10 μM SA for 24 h. Addition of 10 μM SA significantly reversed the 7KCh-induced modulation over several of these important genes (Figure 3, Table S2).
It is striking the negative regulation that 7KCh provokes on lipid and cholesterol biosynthesis (Table 1). Since oxysterols are formed from cholesterol [44], an upregulation of sterol synthesis would be expected. However, this inhibition of cholesterol synthesis has already been described with other oxysterols, such as 25-hydroxycholesterol [45,46]. In addition, 7KCh treatment in murine oligodendrocyte cells significantly reduced the cellular levels of several sterol and cholesterol precursors [21]. On the other hand, an increase in the expression levels of genes associated with cholesterol transport, such as ABCA1 or ABCG1, is observed in response to 7KCh. These genes are transcriptionally regulated by LXR (liver X receptor), which is activated by oxysterol-binding [45]. The role of LXR in the 7KCh response is controversial; whereas some authors showed that its activation counteracts 7KCh signaling [47,48,49], others demonstrated that LXR mediates cytokine release and cell death induced by this oxysterol [15,50]. A possible explanation of our results is that the cell mistakenly reacts to the presence of oxysterols as an excess of cholesterol and, in response, sterol biosynthesis is repressed, and cholesterol transport is favored. In our previous work, we showed that 10 μM SA negatively regulated lipid and sterol biosynthesis-associated genes in mRPE cells. We also demonstrated that SA modulated the 7KCh response independently of the inhibition of SCD1 and hypothesized that this modulation might be carried out through sterol metabolism [39]. Our current work, however, contradicts this first observation since 7KCh itself represses sterol metabolism. Nevertheless, it validates the fact that the effect of SA over 7KCh is independent of SCD1 inhibition, as 7KCh also reduces SCD1 expression (Table 1). This is in agreement with a recent study, where SA protected ARPE-19 cells from fenretinide independently of SCD1 inhibition [51]. Regarding genes whose alteration is reversed by adding SA, no effect was found on lipid and sterol metabolism, as would be expected, with the exception of genes activated by LXR and associated with cholesterol transport, such as ABCA1 and ABCG1 (Figure 3, Table S2). This suggests that in mRPE cells, perhaps, LXR is important in the induction of the 7KCh response, and that SA exerts part of its inhibition through the repression of this receptor, although further research is needed.
Next, we evaluated the involvement of different signaling pathways in the response to 7KCh, taking into account data obtained from the transcriptome analysis. TLR4 has been described as the main receptor mediating the 7KCh mechanism of action in ARPE-19 and other cell types [20,52]. Treatment with 15 μM 7KCh increased TLR4 expression in mRPE cells, and this was attenuated by the addition of 10 μM SA. However, TLR4 inhibition with 10 μM CLI-095 failed to protect mRPE cells from 7KCh-induced toxicity and only significantly decreased IL-6 release to the medium (Figure 4). Thus, our results contradict previous works [20,52] and show minor participation of TLR4 in the response to 7KCh in mRPE cells, although further research is needed to validate these results.
Then, we assessed the induction of ER stress through UPR signaling, as several genes related to this response were upregulated by 7KCh treatment (Table 1), such as ATF3, ASNS, CEBPG, EIF2S2, GFPT1, ERN1, HSPA5, HYOU1, SRPRB and SSR1. Since ER stress is favored by increasing levels of ROS [42,53] and there is a wide range of evidence that 7KCh promotes ROS production in different cell types [21,25,27,28,54,55], we first checked ROS release in mRPE cells treated at different times and concentrations of 7KCh. The incubation with 7KCh did not affect ROS release (Figure 5), in disagreement with these studies but in agreement with another study where exposure to 7KCh did not increase ROS production in RPE cells [43]. We also tested the effect of 7KCh treatment on GRP78 accumulation and XBP1 splicing, two key regulators of UPR signaling [42,56]. Under ER stress conditions, GRP78 binds to unfolded proteins and activates ATF6, IRE1 and PERK, three ER membrane-located receptors that initiate UPR signaling. Once activated, IRE1 promotes the splicing in the XBP1 mRNA of an intron of 26 nucleotides located between the positions 531–556. The resulting protein enters the nucleus and induces the transcription of several genes involved in ER-associated protein degradation and UPR signaling [42]. We did not see any change in GRP78 protein levels (Figure 6A), contrary to previous works carried out in ARPE-19 cells [19,20]. However, the splicing of XBP1 was observed in mRPE cells treated with 15 μM 7KCh (Figure 6B), which means that UPR signaling is activated in response to 7KCh in retinal cells. Co-treatment with 10 μM SA successfully avoided XBP1 splicing.
Finally, we investigated the implication of MAPK-associated pathways in the 7KCh-induced response in mRPE cells. To begin with, we observed in data obtained from transcriptome sequencing analysis a clear induction of the MAPK classical pathway in response to 15 μM 7KCh, which was attenuated by the addition of 10 μM SA (Figure 7). This contradicts the results obtained by Huang et al. in ARPE-19 cells [20] but is consistent with other studies that show MEK/ERK activation in response to 7KCh, and a protective effect on the inflammation induced by this oxysterol in ARPE-19 cells [24,43] and other cell types [57]. JNK and p38 are two MAPK-related pathways that mediate inflammation and, when their activation persists, can induce cell death [58,59]. Transcriptomic analysis did not show any evidence of activation of either of these two pathways (Table 1 and Table 1 and Table S1). Nevertheless, as these proteins are activated by phosphorylation, we decided to check both JNK and p38 phosphorylation in response to 7KCh. JNK phosphorylation was detected in mRPE cells treated for 24 h with increasing concentrations of 7KCh. However, a decrease in its activation levels was observed with 20 μM 7KCh (Figure 8A), a concentration at which cell death is already well established (Figure 1A). Treatment with the JNK inhibitor SP600125 counteracted cytokine secretion, but had no effect on 7KCh-induced toxicity (Figure 8B,C), indicating a role of JNK only in the inflammatory response to 7KCh. By contrast, activation of p38 was observed in mRPE cells exposed for 24 h to 15 μM and 20 μM 7KCh, and its inhibition with SB203580 attenuated both 7KCh-induced cell death and inflammation (Figure 9A–C).
Differences between JNK and p38 activation were most evident in mRPE cell samples treated with 20 μM 7KCh at different times (Figure 8D and Figure 9D). JNK phosphorylation was observed after 6 h of treatment with 7KCh, and an important decrease in its activation was detected at 24 h (Figure 8D). On the other hand, p38 activation began after 12 h of treatment, when cell death had not yet been completely triggered, and its phosphorylation levels were maintained after 24 h of exposure to the oxysterol (Figure 9D). These results suggest that in RPE cells, JNK is activated before p38, and both signaling pathways are involved in the inflammatory response to 7KCh, but only p38 participates in the toxic response. These data could also indicate that p38 may trigger the switch between inflammatory and cell death responses. The activation of JNK and p38 has already been reported in response to 7KCh-induced inflammation in different cell types, including ARPE-19 cells [43,54,57,60,61]. Recently, p38 has also been associated with 7KCh modulation of cell adhesion in leukocytes [23]. However, to our knowledge, there are no previous studies demonstrating a direct implication between p38 activation and 7KCh-induced cell death. Once again, co-treatment with 10 μM SA significantly reduced p-JNK levels after 6 h and 12 h of treatment, and p-p38 levels after 12 h and 24 h of treatment, highlighting the potential, once again, of this molecule counteracting 7KCh effects in these cells (Figure 8D and Figure 9D).
The relationship between 7KCh and the development of AMD is well established since this oxysterol is one of the main molecules accumulated in drusen [4,19,20,26,29,30,31,32,33,34,39,43]. ER stress activation and alterations in MAPK signaling have been associated with the pathogenesis of AMD [62,63,64,65]. In this study, we have demonstrated that 7KCh induces these responses in RPE cells; in addition, we have provided a broader view of the alterations that this oxysterol causes at the transcriptomic level. Thus, the characterization of the 7KCh-induced response in retinal cells offers new opportunities to search for alternative therapeutic targets for AMD. Likewise, SA is, currently, the molecule that has worked best counteracting the harmful effect of 7KCh on retinal cells. The potential of SA as a treatment for AMD has already been revealed due to its ability to attenuate the 7KCh response in ARPE-19 cells, as well as the deleterious effect of fenretinide in this cell line [19,20,51]. In our previous study, we highlighted the benefits of SA administration in three retinal cell lines and its potential in the treatment of ocular diseases [39]. In our current work, we have demonstrated that SA attenuates the response to 7KCh in mRPE cells at different levels, as well as its ability to reverse part of the gene modulation that 7KCh exposure exerts on these cells, providing new evidence of SA therapeutic capacity. Although there is still a long way to go and further research is needed, SA is presented as a new opportunity to improve or complement therapies currently used to treat AMD.

4. Materials and Methods

4.1. Cell Lines and Culture

Monkey retinal pigment epithelium (mRPE) cells were obtained as a gift from Dr. SP Becerra from the National Eye Institute (NIH, Bethesda, MD, USA) and derived from 3- to 5-year-old Rhesus monkey eyes. Once obtained, mRPE cells were kept in a stable monolayer for two weeks until the expression of biochemical and physiological markers of differentiated tissue (pigmentation, polarization RPE65 expression) was achieved [66]. Cells were grown in DMEM/F12 1:1 medium (Hyclone-Thermo Scientific, Waltham, MA, USA) supplemented with 5% fetal bovine serum (Invitrogen, Alcobendas, Madrid, Spain), 1.5% pyruvate, 1% non-essential amino-acids and 1% penicillin/streptomycin (Hyclone-Thermo Scientific, Waltham, MA, USA). Cultured cells were maintained in an atmosphere of 37 °C containing 5% CO2 and 85% humidity.

4.2. Cell Treatments

Cells were seeded in 12-well plates for cell viability or in P100 plates (Corning, New York, NY, USA) for RNA and protein purification at a density of 100.000 cells/well or 1.2 × 10⁶ cells/plate, respectively. Then, cells were allowed to attach and reach 100% confluency for 24 h before removing the medium and replacing it with serum-free medium for 24 h. Treatments were then added and maintained for 24 h, with the exception of ELISAs that were maintained for 48 h, and some protein extracts that were collected at shorter times. Cells were treated with 8–20 μM 7KCh (Sigma-Aldrich, Madrid, Spain) alone or with 10 μM SA (PPQF, University of Alcalá, Madrid, Spain), 10 μM of the TLR4 inhibitor CLI-095 (Invivogen Inc., San Diego, CA, USA), 10–50 μM of the JNK inhibitor SP600125 (StressMarq Biosciences Inc., Victoria, BC, Canada) or 5–40 μM of the p38 inhibitor SB203580 (Sigma-Aldrich, Madrid, Spain). 7KCh was prepared in β-cyclodextrin (Sigma-Aldrich, Madrid, Spain) as previously described [15,20], CLI-095 was dissolved in culture medium and SA, SP600125 and SB203580 were dissolved in DMSO (Sigma-Aldrich, Madrid, Spain).

4.3. Cell Viability Assays

Cell toxicity or protective effect of the different treatments was validated using CellTitter 96 Aqueous One Solution Reagent MTS assay (Promega, Madison, WI, USA). This assay measures cell metabolic activity by the reduction of the MTS compound (3-(4,5-dimethylthiazol-2-yl)-5-(3-carboxymethoxyphenyl)-2-(4-sulfophenyl)-2H-tetrazolium), a reaction that is only carried out by living cells. Cells were washed two times with PBS before adding the MTS reagent at a concentration of 1:10 in culture medium. A baseline measure of the absorbance at 490 nm was performed using Biotek Synergy H4 multi-mode plate reader (BioTek Instruments, Covina, CA, USA) and then a final measurement was performed after 4 h of incubation at 37 °C. Results were presented as percentage viability with respect to control vehicle cells.

4.4. ROS Detection Assay

The release of ROS was determined by measuring the fluorescence resulting from the oxidation of the probe H2DCFDA (2,7-dichlorodihydrofluorescein diacetate, Invitrogen, Madrid, Spain) into DFC (dichlorofluorescein), as this oxidation is promoted by ROS. Cells were incubated with 10 μM H2DCFDA freshly prepared in 1× PBS after 8 h or 24 h of treatment. Then, fluorescence was measured using Biotek Synergy H4 multi-mode plate reader (BioTek Instruments, Covina, CA, USA) with 488 nm excitation and 535 nm emission filters.

4.5. RNA Purification

Total RNA was isolated from cell cultures in 1 mL of TRIzol (Invitrogen, Madrid, Spain). Then, the RNA was purified with the RNeasy mini-kit (Qiagen, Valencia, CA, USA) and DNase I (Qiagen, Valencia, CA, USA) according to manufacturer’s guidelines.

4.6. Quantitative Real-Time PCR

Reverse transcription was performed from 1 μg of total RNA with random primers and the SuperScript III kit (Invitrogen, Madrid, Spain) in order to synthesize first-strand DNA following manufacturer’s instructions. Then, the cDNA obtained was mixed with 0.3 μM forward and reverse oligonucleotide primers (Table 2) and SYBR Green PCR Master Mix (Applied Biosystems, Carlsbad, CA, USA) to carry out real-time polymerase chain reaction (qRT-PCR). Quantitative measures were taken using a 7300 Real-Time PCR System (Applied Biosystems, Madrid, Spain). Cycling conditions were: an initial denaturation at 95 °C for 10 min, followed by 40 cycles of 95 °C for 15 s and 60 °C for 1 min. Finally, to validate amplicon specificity, the dissociation curve was implemented from 60 °C to 95 °C. Gene expression levels were calculated by interpolating Ct value (threshold cycle) from the corresponding standard line and using 18S rRNA expression to normalize the results.

4.7. Next-Generation Sequencing

Ultrasequencing was carried out using Illumina reagents (Illumina, San Diego, CA, USA) and protocols as previously described [67]. The integrity and quality of total RNA was assessed with the Experion™ automated electrophoresis system (Bio-Rad, Hercules, CA, USA). Next, mRNA was isolated from 1 μg of total RNA with Illumina’s Ribo-zero plus rRNA depletion kit (Illumina, Madrid, Spain), and cleaved into approximately 200 bp fragments by divalent cations at high temperatures. The first cDNA strand was obtained by reverse transcription of the mRNA fragments with random primers and reverse transcriptase, whereas the second cDNA strand was synthesized using DNA polymerase I and RNase H. The cDNA double-stranded fragments were end-repaired using T4 DNA polymerase and Klenow DNA polymerase, then phosphorylated by T4 polynucleotide kinase and, finally, ligated to Illumina Indexed Adapters. The resulting adapter-tagged libraries were amplified with 15 PCR cycles and using DNA polymerase (Phusion, Finnzymes Reagents, Vantaa, Finland). Validation and quantification were performed using the Experion™ automated electrophoresis system and qPCR, respectively. Then, pools of six indexed libraries were mixed at equimolar ratios to reach a total oligonucleotide concentration of 10 mM. Finally, libraries obtained were sequenced on the Illumina Genome Analyzer IIx platform in order to generate 150 bp single reads, sequencing six groups of libraries per lane.
Raw sequence data in fastq format were cleaned of low-quality and adapter sequencing. Reads were then mapped using the aligner STAR (https://github.com/alexdobin/STAR (version 2.7.8a, accessed on 20 February 2021) to the reference genome of Macaca mulatta (Mmul_8.0.1) and counted with FeatureCounts (http://subread.sourceforge.net/ (accessed on 1 April 2021)). Normalization and global distance analysis of reads were performed with DESeq2 and the differential expression analysis was carried out using the R package [68]. The analysis of altered pathways promoted by the treatment of 7KCh alone or with the combination of SA was performed by studying significant up- and downregulated genes from high-throughput sequencing. Specialized software (www.genemania.org, www.reactome.org, accessed on 15 December 2022) was used to find cellular pathways differentially expressed and shown in the Kyoto Encyclopedia of Genes and Genomes (KEGG) [69,70,71]. The software IGV was used to visualize the splicing of XBP1 [72].

4.8. Western Blotting

Protein extracts were obtained from scraped cells in culture using RIPA buffer (Thermo Scientific, Madrid, Spain) containing phosphatase (PhosStop, Roche, Basilea, Switzerland) and protease (EDTA-free complete, Roche, Basilea, Switzerland) inhibitors. Supernatants were collected from homogenates by centrifugation for 30 min at 15,000× g, and protein concentration was determined using a BCA kit (Pierce, Rockford, IL, USA) following manufacturer’s guidelines and using Biotek Synergy H4 multi-mode plate reader (BioTek Instruments, Covina, CA, USA) to measure the absorbance at 562 nm. Next, 20 μg of sample mixed with 10× sample reducing agent (Invitrogen, Madrid, Spain) and 4× sample Buffer (Invitrogen, Madrid, Spain) were heated for 10 min at 70 °C. SeeBlue plus 2 pre-stained standard (Invitrogen, Madrid, Spain) was used as a molecular weight marker and was run with the samples on 4–12% SDS–polyacrylamide gels (Invitrogen, Madrid, Spain). After that, proteins were transferred onto 0.2 μm polyvinylidene difluoride (PVDF) membranes (iBlot system, Invitrogen, Madrid, Spain). Blocking was performed for 2 h at room temperature with 5% non-fat dry milk dissolved in 1× TBS (tris-buffered saline) and 0.1% Tween (Sigma-Aldrich, Madrid, Spain).
Membranes were then incubated overnight at 4 °C with different primary antibodies for protein identification: α-GRP78 1:1000 (#3183, Cell Signaling, Danvers, MA, USA), α-p-JNK 1:1000 (ab124956, Abcam, Cambridge, UK), α-JNK 1:5000 (ab179461, Abcam, Cambridge, UK), α-p-p38 1:5000 (#4511, Cell Signaling, Danvers, MA, USA) or α-p38 1:5000 (#8690, Cell Signaling, Danvers, MA, USA). Protein levels were standardized with the detection of α-Actin at a dilution of 1:10000 (#A5441, Sigma-Aldrich, Madrid, Spain) in the same membranes. Immunoreactivity was demonstrated by incubating the membranes with α-mouse (715-035-1514, Jackson Immunoresearch Lab. West Grobe, PA, USA) or α-rabbit (7074, Cell Signaling) and using the chemiluminescence kit ClarityTM Western ECL (BIO-RAD, Berkeley, CA, USA), and exposing to X-ray films (Amersham Hyperfilm ECL, GE Healthcare, Buckinghamshire, UK) or using the ChemiDoc Imaging System (Bio-Rad, Hercules, CA, USA).

4.9. ELISAs

Levels of secreted IL-6, IL-8 and VEGF-A were measured in conditioned medium of mRPE cells treated with 15 μM 7KCh and/or 10 μM SA, 10 μM CLI-095 or 40 μM SB203580 for 48 h using Macaque IL-6 ELISA kit (Raybiotech Life, Peachtree Corners, GA, USA), Macaque IL-8 ELISA kit (Raybiotech Life, Peachtree Corners, GA, USA) and Monkey Vascular Endothelial Growth Factor A ELISA kit (MyBiosource, San Diego, CA, USA), respectively. The culture medium was collected following manufacturer’s instructions and absorbance was measured at 450 nm using the Biotek Synergy H4 multi-mode plate reader (BioTek Instruments, Covina, CA, USA).

4.10. Statistical Analysis

Statistical analysis was performed using GraphPad Prism 6 software. Data were expressed as means ± SEM (standard error of the means) and were considered statistically significant when p ≤ 0.05. ANOVA test was used to analyze normally distributed data followed by Sidak or Tukey post hoc test, following the program’s recommendation.

Supplementary Materials

The following supporting information can be downloaded at: https://www.mdpi.com/article/10.3390/ijms24087459/s1.

Author Contributions

Conceptualization, A.P., Á.P.-S., R.P. and I.M.L.; methodology, R.P. and I.M.L.; software, Á.P.-S.; validation, A.P., Á.P.-S., R.O. and R.P.; formal analysis, A.P., Á.P.-S., R.P. and I.M.L.; investigation, A.P., R.O., M.B., Á.V.-M. and R.P.; resources, I.M.L.; data curation, A.P., Á.P.-S., R.P. and I.M.L.; writing—original draft preparation, A.P., Á.P.-S., R.O., M.B., Á.V.-M., R.P. and I.M.L.; writing—review and editing, A.P., R.P. and I.M.L.; visualization, A.P.; supervision, R.P. and I.M.L.; project administration, R.P. and I.M.L.; funding acquisition, R.P. and I.M.L. All authors have read and agreed to the published version of the manuscript.

Funding

This research was funded, in part, by a grant (PI19/01805) from the Instituto de Salud Carlos III, co-funded by European Regional Development Fund (ERDF) “A way to build Europe” and by Fundación Rioja Salud. I.M.L. was supported by a Miguel Servet contract (CPII20/00029) from the Instituto de Salud Carlos III, co-funded by European Social fund (ESF) “Investing in your future”. M.B. was supported by “Retos Colaboración” project, GLIOPROG561 (RTC2019-007399-1) from the Ministry of Science and Innovation (Spain). Á.V.-M. was supported by Agencia de Desarrollo Económico de la Rioja (ADER) engagements.

Institutional Review Board Statement

Not applicable.

Informed Consent Statement

Not applicable.

Data Availability Statement

Not applicable.

Conflicts of Interest

I.M.L. holds a patent on “Methods of treatment using sterculic acid”. The funders had no role in the design of the study; in the collection, analyses, or interpretation of data; in the writing of the manuscript, or in the decision to publish the results.

Abbreviations

7KCh7-Ketocholesterol
AMDage-related macular degeneration
CNVchoroidal neovascularization
DEGdifferentially expressed genes
ERendoplasmic reticulum
FCfold change
FDRfalse discovery rate
GOgene ontology
IGVIntegrative Genome Viewer
KEGGKyoto Encyclopedia of Genes and Genomes
LXRliver X receptor
mRPEmonkey retinal pigment epithelium
qRT-PCRreal-time polymerase chain reaction
RPEretinal pigment epithelium
SAsterculic acid
SCD1stearoyl coenzyme-A desaturase 1
SEMstandard error of the means
TBStris-buffered saline
UPRunfolded protein response

References

  1. Deng, Y.; Qiao, L.; Du, M.; Qu, C.; Wan, L.; Li, J.; Huang, L. Age-related macular degeneration: Epidemiology, genetics, pathophysiology, diagnosis, and targeted therapy. Genes Dis. 2022, 9, 62–79. [Google Scholar] [CrossRef] [PubMed]
  2. Mehrzadi, S.; Hemati, K.; Reiter, R.J.; Hosseinzadeh, A. Mitochondrial dysfunction in age-related macular degeneration: Melatonin as a potential treatment. Expert Opin. Ther. Targets 2020, 24, 359–378. [Google Scholar] [CrossRef] [PubMed]
  3. Taylor, A. Introduction to the issue regarding research regarding age related macular degeneration. Mol. Asp. Med. 2012, 33, 291–294. [Google Scholar] [CrossRef] [PubMed]
  4. Xu, Q.; Cao, S.; Rajapakse, S.; Matsubara, J.A. Understanding AMD by analogy: Systematic review of lipid-related common pathogenic mechanisms in AMD, AD, AS and GN. Lipids Health Dis. 2018, 17, 3. [Google Scholar] [CrossRef] [PubMed]
  5. Stahl, A. The Diagnosis and Treatment of Age-Related Macular Degeneration. Dtsch. Arztebl. Int. 2020, 117, 513–520. [Google Scholar] [CrossRef] [PubMed]
  6. Thomas, C.J.; Mirza, R.G.; Gill, M.K. Age-Related Macular Degeneration. Med. Clin. North Am. 2021, 105, 473–491. [Google Scholar] [CrossRef]
  7. Curcio, C.A. Antecedents of Soft Drusen, the Specific Deposits of Age-Related Macular Degeneration, in the Biology of Human Macula. Investig. Ophthalmol. Vis. Sci. 2018, 59, AMD182–AMD194. [Google Scholar] [CrossRef]
  8. Curcio, C.A. Soft Drusen in Age-Related Macular Degeneration: Biology and Targeting Via the Oil Spill Strategies. Investig. Ophthalmol. Vis. Sci. 2018, 59, AMD160–AMD181. [Google Scholar] [CrossRef]
  9. Spaide, R.F.; Ooto, S.; Curcio, C.A. Subretinal drusenoid deposits AKA pseudodrusen. Surv. Ophthalmol. 2018, 63, 782–815. [Google Scholar] [CrossRef]
  10. Curcio, C.A.; Johnson, M.; Rudolf, M.; Huang, J.D. The oil spill in ageing Bruch membrane. Br. J. Ophthalmol. 2011, 95, 1638–1645. [Google Scholar] [CrossRef]
  11. Abokyi, S.; To, C.H.; Lam, T.T.; Tse, D.Y. Central Role of Oxidative Stress in Age-Related Macular Degeneration: Evidence from a Review of the Molecular Mechanisms and Animal Models. Oxidative Med. Cell. Longev. 2020, 2020, 7901270. [Google Scholar] [CrossRef] [PubMed]
  12. Pfau, M.; von der Emde, L.; de Sisternes, L.; Hallak, J.A.; Leng, T.; Schmitz-Valckenberg, S.; Holz, F.G.; Fleckenstein, M.; Rubin, D.L. Progression of Photoreceptor Degeneration in Geographic Atrophy Secondary to Age-related Macular Degeneration. JAMA Ophthalmol. 2020, 138, 1026–1034. [Google Scholar] [CrossRef] [PubMed]
  13. Shu, D.Y.; Butcher, E.; Saint-Geniez, M. EMT and EndMT: Emerging Roles in Age-Related Macular Degeneration. Int. J. Mol. Sci. 2020, 21, 4271. [Google Scholar] [CrossRef] [PubMed]
  14. Garcia-Garcia, J.; Usategui-Martin, R.; Sanabria, M.R.; Fernandez-Perez, E.; Telleria, J.J.; Coco-Martin, R.M. Pathophysiology of Age-Related Macular Degeneration. Implications for Treatment. Ophthalmic Res. 2022, 65, 615–636. [Google Scholar] [CrossRef] [PubMed]
  15. Moreira, E.F.; Larrayoz, I.M.; Lee, J.W.; Rodriguez, I.R. 7-Ketocholesterol is present in lipid deposits in the primate retina: Potential implication in the induction of VEGF and CNV formation. Investig. Ophthalmol. Vis. Sci. 2009, 50, 523–532. [Google Scholar] [CrossRef]
  16. Bobadilla, M.; Pariente, A.; Oca, A.I.; Pelaez, R.; Perez-Sala, A.; Larrayoz, I.M. Biomarkers as Predictive Factors of Anti-VEGF Response. Biomedicines 2022, 10, 1003. [Google Scholar] [CrossRef]
  17. Oca, A.I.; Perez-Sala, A.; Pariente, A.; Ochoa, R.; Velilla, S.; Pelaez, R.; Larrayoz, I.M. Predictive Biomarkers of Age-Related Macular Degeneration Response to Anti-VEGF Treatment. J. Pers. Med. 2021, 11, 1329. [Google Scholar] [CrossRef]
  18. Mettu, P.S.; Allingham, M.J.; Cousins, S.W. Incomplete response to Anti-VEGF therapy in neovascular AMD: Exploring disease mechanisms and therapeutic opportunities. Prog. Retin. Eye Res. 2021, 82, 100906. [Google Scholar] [CrossRef]
  19. Huang, J.D.; Amaral, J.; Lee, J.W.; Larrayoz, I.M.; Rodriguez, I.R. Sterculic acid antagonizes 7-ketocholesterol-mediated inflammation and inhibits choroidal neovascularization. Biochim. Et Biophys. Acta 2012, 1821, 637–646. [Google Scholar] [CrossRef]
  20. Huang, J.D.; Amaral, J.; Lee, J.W.; Rodriguez, I.R. 7-Ketocholesterol-induced inflammation signals mostly through the TLR4 receptor both in vitro and in vivo. PLoS ONE 2014, 9, e100985. [Google Scholar] [CrossRef]
  21. Leoni, V.; Nury, T.; Vejux, A.; Zarrouk, A.; Caccia, C.; Debbabi, M.; Fromont, A.; Sghaier, R.; Moreau, T.; Lizard, G. Mitochondrial dysfunctions in 7-ketocholesterol-treated 158N oligodendrocytes without or with alpha-tocopherol: Impacts on the cellular profil of tricarboxylic cycle-associated organic acids, long chain saturated and unsaturated fatty acids, oxysterols, cholesterol and cholesterol precursors. J. Steroid Biochem. Mol. Biol. 2017, 169, 96–110. [Google Scholar] [CrossRef] [PubMed]
  22. Sul, O.J.; Li, G.; Kim, J.E.; Kim, E.S.; Choi, H.S. 7-ketocholesterol enhances autophagy via the ROS-TFEB signaling pathway in osteoclasts. J. Nutr. Biochem. 2021, 96, 108783. [Google Scholar] [CrossRef] [PubMed]
  23. Tani, M.; Kamata, Y.; Deushi, M.; Osaka, M.; Yoshida, M. 7-Ketocholesterol enhances leukocyte adhesion to endothelial cells via p38MAPK pathway. PLoS ONE 2018, 13, e0200499. [Google Scholar] [CrossRef] [PubMed]
  24. Yang, C.; Xie, L.; Gu, Q.; Qiu, Q.; Wu, X.; Yin, L. 7-Ketocholesterol disturbs RPE cells phagocytosis of the outer segment of photoreceptor and induces inflammation through ERK signaling pathway. Exp. Eye Res. 2019, 189, 107849. [Google Scholar] [CrossRef]
  25. Nury, T.; Sghaier, R.; Zarrouk, A.; Menetrier, F.; Uzun, T.; Leoni, V.; Caccia, C.; Meddeb, W.; Namsi, A.; Sassi, K.; et al. Induction of peroxisomal changes in oligodendrocytes treated with 7-ketocholesterol: Attenuation by alpha-tocopherol. Biochimie 2018, 153, 181–202. [Google Scholar] [CrossRef]
  26. Wang, H.; Ramshekar, A.; Kunz, E.; Hartnett, M.E. 7-ketocholesterol induces endothelial-mesenchymal transition and promotes fibrosis: Implications in neovascular age-related macular degeneration and treatment. Angiogenesis 2021, 24, 583–595. [Google Scholar] [CrossRef] [PubMed]
  27. Vejux, A.; Abed-Vieillard, D.; Hajji, K.; Zarrouk, A.; Mackrill, J.J.; Ghosh, S.; Nury, T.; Yammine, A.; Zaibi, M.; Mihoubi, W.; et al. 7-Ketocholesterol and 7beta-hydroxycholesterol: In vitro and animal models used to characterize their activities and to identify molecules preventing their toxicity. Biochem. Pharmacol. 2020, 173, 113648. [Google Scholar] [CrossRef]
  28. Brahmi, F.; Vejux, A.; Sghaier, R.; Zarrouk, A.; Nury, T.; Meddeb, W.; Rezig, L.; Namsi, A.; Sassi, K.; Yammine, A.; et al. Prevention of 7-ketocholesterol-induced side effects by natural compounds. Crit. Rev. Food Sci. Nutr. 2019, 59, 3179–3198. [Google Scholar] [CrossRef]
  29. Poli, G.; Biasi, F.; Leonarduzzi, G. Oxysterols in the pathogenesis of major chronic diseases. Redox Biol. 2013, 1, 125–130. [Google Scholar] [CrossRef]
  30. Indaram, M.; Ma, W.; Zhao, L.; Fariss, R.N.; Rodriguez, I.R.; Wong, W.T. 7-Ketocholesterol increases retinal microglial migration, activation, and angiogenicity: A potential pathogenic mechanism underlying age-related macular degeneration. Sci. Rep. 2015, 5, 9144. [Google Scholar] [CrossRef]
  31. Shi, G.; Chen, S.; Wandu, W.S.; Ogbeifun, O.; Nugent, L.F.; Maminishkis, A.; Hinshaw, S.J.; Rodriguez, I.R.; Gery, I. Inflammasomes Induced by 7-Ketocholesterol and Other Stimuli in RPE and in Bone Marrow-Derived Cells Differ Markedly in Their Production of IL-1beta and IL-18. Investig. Ophthalmol. Vis. Sci. 2015, 56, 1658–1664. [Google Scholar] [CrossRef] [PubMed]
  32. Amaral, J.; Lee, J.W.; Chou, J.; Campos, M.M.; Rodriguez, I.R. 7-Ketocholesterol induces inflammation and angiogenesis In Vivo: A novel rat model. PLoS ONE 2013, 8, e56099. [Google Scholar] [CrossRef] [PubMed]
  33. Rodriguez, I.R.; Clark, M.E.; Lee, J.W.; Curcio, C.A. 7-ketocholesterol accumulates in ocular tissues as a consequence of aging and is present in high levels in drusen. Exp. Eye Res. 2014, 128, 151–155. [Google Scholar] [CrossRef] [PubMed]
  34. Olivier, E.; Dutot, M.; Regazzetti, A.; Leguillier, T.; Dargere, D.; Auzeil, N.; Laprevote, O.; Rat, P. P2X7-pannexin-1 and amyloid beta-induced oxysterol input in human retinal cell: Role in age-related macular degeneration? Biochimie 2016, 127, 70–78. [Google Scholar] [CrossRef] [PubMed]
  35. Pariente, A.; Pelaez, R.; Perez-Sala, A.; Larrayoz, I.M. Inflammatory and cell death mechanisms induced by 7-ketocholesterol in the retina. Implications for age-related macular degeneration. Exp. Eye Res. 2019, 187, 107746. [Google Scholar] [CrossRef]
  36. Herrera-Meza, M.S.; Mendoza-Lopez, M.R.; Garcia-Barradas, O.; Sanchez-Otero, M.G.; Silva-Hernandez, E.R.; Angulo, J.O.; Oliart-Ros, R.M. Dietary anhydrous milk fat naturally enriched with conjugated linoleic acid and vaccenic acid modify cardiovascular risk biomarkers in spontaneously hypertensive rats. Int. J. Food Sci. Nutr. 2013, 64, 575–586. [Google Scholar] [CrossRef]
  37. Pelaez, R.; Pariente, A.; Perez-Sala, A.; Larrayoz, I.M. Sterculic Acid: The Mechanisms of Action beyond Stearoyl-CoA Desaturase Inhibition and Therapeutic Opportunities in Human Diseases. Cells 2020, 9, 140. [Google Scholar] [CrossRef]
  38. Ortinau, L.C.; Nickelson, K.J.; Stromsdorfer, K.L.; Naik, C.Y.; Pickering, R.T.; Haynes, R.A.; Fritsche, K.L.; Perfield, J.W., 2nd. Sterculic oil, a natural inhibitor of SCD1, improves the metabolic state of obese OLETF rats. Obesity 2013, 21, 344–352. [Google Scholar] [CrossRef]
  39. Pariente, A.; Perez-Sala, A.; Ochoa, R.; Pelaez, R.; Larrayoz, I.M. Genome-Wide Transcriptomic Analysis Identifies Pathways Regulated by Sterculic Acid in Retinal Pigmented Epithelium Cells. Cells 2020, 9, 1187. [Google Scholar] [CrossRef]
  40. Glickman, M.E.; Rao, S.R.; Schultz, M.R. False discovery rate control is a recommended alternative to Bonferroni-type adjustments in health studies. J. Clin. Epidemiol. 2014, 67, 850–857. [Google Scholar] [CrossRef]
  41. Sies, H. Hydrogen peroxide as a central redox signaling molecule in physiological oxidative stress: Oxidative eustress. Redox Biol. 2017, 11, 613–619. [Google Scholar] [CrossRef] [PubMed]
  42. Park, S.M.; Kang, T.I.; So, J.S. Roles of XBP1s in Transcriptional Regulation of Target Genes. Biomedicines 2021, 9, 791. [Google Scholar] [CrossRef]
  43. Larrayoz, I.M.; Huang, J.D.; Lee, J.W.; Pascual, I.; Rodriguez, I.R. 7-ketocholesterol-induced inflammation: Involvement of multiple kinase signaling pathways via NFkappaB but independently of reactive oxygen species formation. Investig. Ophthalmol. Vis. Sci. 2010, 51, 4942–4955. [Google Scholar] [CrossRef] [PubMed]
  44. Brown, A.J.; Dean, R.T.; Jessup, W. Free and esterified oxysterol: Formation during copper-oxidation of low density lipoprotein and uptake by macrophages. J. Lipid Res. 1996, 37, 320–335. [Google Scholar] [CrossRef] [PubMed]
  45. Griffiths, W.J.; Wang, Y. Cholesterol metabolism: From lipidomics to immunology. J. Lipid Res. 2022, 63, 100165. [Google Scholar] [CrossRef]
  46. Yanagisawa, R.; He, C.; Asai, A.; Hellwig, M.; Henle, T.; Toda, M. The Impacts of Cholesterol, Oxysterols, and Cholesterol Lowering Dietary Compounds on the Immune System. Int. J. Mol. Sci. 2022, 23, 12236. [Google Scholar] [CrossRef]
  47. Xie, L.; Gu, Q.; Wu, X.; Yin, L. Activation of LXRs Reduces Oxysterol Lipotoxicity in RPE Cells by Promoting Mitochondrial Function. Nutrients 2022, 14, 2473. [Google Scholar] [CrossRef]
  48. Iborra, R.T.; Machado-Lima, A.; Castilho, G.; Nunes, V.S.; Abdalla, D.S.; Nakandakare, E.R.; Passarelli, M. Advanced glycation in macrophages induces intracellular accumulation of 7-ketocholesterol and total sterols by decreasing the expression of ABCA-1 and ABCG-1. Lipids Health Dis. 2011, 10, 172. [Google Scholar] [CrossRef]
  49. Okabe, A.; Urano, Y.; Itoh, S.; Suda, N.; Kotani, R.; Nishimura, Y.; Saito, Y.; Noguchi, N. Adaptive responses induced by 24S-hydroxycholesterol through liver X receptor pathway reduce 7-ketocholesterol-caused neuronal cell death. Redox Biol. 2013, 2, 28–35. [Google Scholar] [CrossRef]
  50. Levy, D.; de Melo, T.C.; Oliveira, B.A.; Paz, J.L.; de Freitas, F.A.; Reichert, C.O.; Rodrigues, A.; Bydlowski, S.P. 7-Ketocholesterol and cholestane-triol increase expression of SMO and LXRalpha signaling pathways in a human breast cancer cell line. Biochem. Biophys. Rep. 2019, 19, 100604. [Google Scholar] [CrossRef]
  51. William, S.; Duncan, T.; Redmond, T.M. Pretreatment of human retinal pigment epithelial cells with sterculic acid forestalls fenretinide-induced apoptosis. Sci. Rep. 2022, 12, 22442. [Google Scholar] [CrossRef] [PubMed]
  52. Aye, I.L.; Waddell, B.J.; Mark, P.J.; Keelan, J.A. Oxysterols exert proinflammatory effects in placental trophoblasts via TLR4-dependent, cholesterol-sensitive activation of NF-kappaB. Mol. Hum. Reprod. 2012, 18, 341–353. [Google Scholar] [CrossRef] [PubMed]
  53. Cano, M.; Wang, L.; Wan, J.; Barnett, B.P.; Ebrahimi, K.; Qian, J.; Handa, J.T. Oxidative stress induces mitochondrial dysfunction and a protective unfolded protein response in RPE cells. Free. Radic. Biol. Med. 2014, 69, 1–14. [Google Scholar] [CrossRef] [PubMed]
  54. Pedruzzi, E.; Guichard, C.; Ollivier, V.; Driss, F.; Fay, M.; Prunet, C.; Marie, J.C.; Pouzet, C.; Samadi, M.; Elbim, C.; et al. NAD(P)H oxidase Nox-4 mediates 7-ketocholesterol-induced endoplasmic reticulum stress and apoptosis in human aortic smooth muscle cells. Mol. Cell. Biol. 2004, 24, 10703–10717. [Google Scholar] [CrossRef]
  55. Yammine, A.; Nury, T.; Vejux, A.; Latruffe, N.; Vervandier-Fasseur, D.; Samadi, M.; Greige-Gerges, H.; Auezova, L.; Lizard, G. Prevention of 7-Ketocholesterol-Induced Overproduction of Reactive Oxygen Species, Mitochondrial Dysfunction and Cell Death with Major Nutrients (Polyphenols, omega3 and omega9 Unsaturated Fatty Acids) of the Mediterranean Diet on N2a Neuronal Cells. Molecules 2020, 25, 2296. [Google Scholar] [CrossRef]
  56. Ibrahim, I.M.; Abdelmalek, D.H.; Elfiky, A.A. GRP78: A cell's response to stress. Life Sci. 2019, 226, 156–163. [Google Scholar] [CrossRef]
  57. Guina, T.; Deiana, M.; Calfapietra, S.; Cabboi, B.; Maina, M.; Tuberoso, C.I.; Leonarduzzi, G.; Gamba, P.; Gargiulo, S.; Testa, G.; et al. The role of p38 MAPK in the induction of intestinal inflammation by dietary oxysterols: Modulation by wine phenolics. Food Funct. 2015, 6, 1218–1228. [Google Scholar] [CrossRef]
  58. Kim, E.K.; Choi, E.J. Compromised MAPK signaling in human diseases: An update. Arch. Toxicol. 2015, 89, 867–882. [Google Scholar] [CrossRef]
  59. Yue, J.; Lopez, J.M. Understanding MAPK Signaling Pathways in Apoptosis. Int. J. Mol. Sci. 2020, 21, 2346. [Google Scholar] [CrossRef]
  60. Sung, S.C.; Kim, K.; Lee, K.A.; Choi, K.H.; Kim, S.M.; Son, Y.H.; Moon, Y.S.; Eo, S.K.; Rhim, B.Y. 7-Ketocholesterol upregulates interleukin-6 via mechanisms that are distinct from those of tumor necrosis factor-alpha, in vascular smooth muscle cells. J. Vasc. Res. 2009, 46, 36–44. [Google Scholar] [CrossRef]
  61. Suzuki, K.; Sakiyama, Y.; Usui, M.; Obama, T.; Kato, R.; Itabe, H.; Yamamoto, M. Oxidized low-density lipoprotein increases interleukin-8 production in human gingival epithelial cell line Ca9-22. J. Periodontal Res. 2010, 45, 488–495. [Google Scholar] [CrossRef] [PubMed]
  62. Salminen, A.; Kauppinen, A.; Hyttinen, J.M.; Toropainen, E.; Kaarniranta, K. Endoplasmic reticulum stress in age-related macular degeneration: Trigger for neovascularization. Mol. Med. 2010, 16, 535–542. [Google Scholar] [CrossRef] [PubMed]
  63. SanGiovanni, J.P.; Lee, P.H. AMD-associated genes encoding stress-activated MAPK pathway constituents are identified by interval-based enrichment analysis. PLoS ONE 2013, 8, e71239. [Google Scholar] [CrossRef] [PubMed]
  64. Kheitan, S.; Minuchehr, Z.; Soheili, Z.S. Exploring the cross talk between ER stress and inflammation in age-related macular degeneration. PLoS ONE 2017, 12, e0181667. [Google Scholar] [CrossRef]
  65. Ghemrawi, R.; Khair, M. Endoplasmic Reticulum Stress and Unfolded Protein Response in Neurodegenerative Diseases. Int. J. Mol. Sci. 2020, 21, 6127. [Google Scholar] [CrossRef]
  66. Becerra, S.P.; Fariss, R.N.; Wu, Y.Q.; Montuenga, L.M.; Wong, P.; Pfeffer, B.A. Pigment epithelium-derived factor in the monkey retinal pigment epithelium and interphotoreceptor matrix: Apical secretion and distribution. Exp. Eye Res. 2004, 78, 223–234. [Google Scholar] [CrossRef]
  67. Larrayoz, I.M.; de Luis, A.; Rua, O.; Velilla, S.; Cabello, J.; Martinez, A. Molecular effects of doxycycline treatment on pterygium as revealed by massive transcriptome sequencing. PLoS ONE 2012, 7, e39359. [Google Scholar] [CrossRef]
  68. Varet, H.; Brillet-Gueguen, L.; Coppee, J.Y.; Dillies, M.A. SARTools: A DESeq2- and EdgeR-Based R Pipeline for Comprehensive Differential Analysis of RNA-Seq Data. PLoS ONE 2016, 11, e0157022. [Google Scholar] [CrossRef]
  69. Kanehisa, M.; Goto, S.; Sato, Y.; Kawashima, M.; Furumichi, M.; Tanabe, M. Data, information, knowledge and principle: Back to metabolism in KEGG. Nucleic Acids Res. 2013, 42, D199–D205. [Google Scholar] [CrossRef]
  70. Kanehisa, M.; Goto, S. KEGG: Kyoto encyclopedia of genes and genomes. Nucleic Acids Res. 2000, 28, 27–30. [Google Scholar] [CrossRef]
  71. Kanehisa, M. Toward understanding the origin and evolution of cellular organisms. Protein Sci. 2019, 28, 1947–1951. [Google Scholar] [CrossRef] [PubMed]
  72. Robinson, J.T.; Thorvaldsdottir, H.; Wenger, A.M.; Zehir, A.; Mesirov, J.P. Variant Review with the Integrative Genomics Viewer. Cancer Res. 2017, 77, e31–e34. [Google Scholar] [CrossRef] [PubMed]
Figure 1. Cell toxicity and inflammation induced by 7KCh and protective effect exerted by SA on mRPE cells. (A) Cell viability determined by MTS assay in mRPE cells treated with increasing concentrations of 7KCh or with (B) 10 μM SA and 12–20 μM 7KCh for 24 h. (C) Quantification by qRT-PCR of IL6, IL8 and VEGFA gene expression levels in mRPE cells treated with 15 μM 7KCh and 10 μM SA for 24 h, normalized with respect to rRNA 18S expression. (D) Secreted levels of IL-6, IL-8 and VEGF-A in mRPE cells exposed to 15 μM 7KCh and 10 μM SA for 48 h and measured by ELISA. The vehicle group in the graphs represents the control (control-vehicle) and the 7KCh (7KCh-vehicle) treatment. Data are represented as mean ± SEM of at least three different experiments. The dashed and dotted lines are a guidance mark of control and 7KCh value, respectively. ANOVA test was used for statistical analysis followed by Tukey (in A) or Sidak (in BD) post hoc test. * p < 0.05; ** p < 0.01; *** p < 0.001; **** p < 0.0001.
Ijms 24 07459 g001
Figure 2. TOP GO categories for biological processes in gene expression altered by 15 μM 7KCh in mRPE cells. DEGs between control and 7KCh-treated cells for 24 h were used to perform Gene Ontology (GO) enrichment analysis. The annotated DEGs were classified into different categories according to GO terms by EnrichGO. Functional groups are shown on the y-axis, while the gene ratio of each category is displayed on the x-axis.
Ijms 24 07459 g002
Figure 3. Reversion effect induced by 10 μM SA over several representative genes altered by 15 μM 7KCh. Y-axis shows examples of genes modulated by 7KCh, whereas the X-axis represents the change in the expression of these genes in mRPE cells treated with 15 μM 7KCh, 10 μM SA or with the combination of SA and 7KCh with respect to the control and expressed as Log2FC. Positive Log2FC represents upregulated genes, while negative Log2FC represents downregulated genes. SA gene modulation data were obtained from our previous work [39].
Ijms 24 07459 g003
Figure 4. Effect of TLR4 inhibition with CLI-095 on 7KCh-induced toxicity and inflammation. (A) Cell viability determined by MTS assay in mRPE cells treated with 15 μM 7KCh and 10 μM CLI-095 for 24 h. (B) Secreted levels of IL-6, IL-8 and VEGF-A in mRPE cells exposed to 15 μM 7KCh and 10 μM CLI-095 for 48 h and measured with ELISA. CLI-095 was added with a pretreatment of 2 h with respect to 7KCh. The vehicle group in the graphs represents the control (control-vehicle) and the 7KCh (7KCh-vehicle) treatment. Data are represented as mean ± SEM of at least three different experiments. The dashed and dotted lines are a guidance mark of control and 7KCh value, respectively. ANOVA test was used for statistical analysis followed by Sidak post hoc test. * p < 0.05.
Ijms 24 07459 g004
Figure 5. ROS released in mRPE cells exposed to 12–20 μM 7KCh for 8 h and 24 h. ROS production levels were measured by oxidation of H2DCFDA probe to DCF, and 10 mM H2O2 was used as a positive control. Data are represented as mean ± SEM of at least three different experiments. The dashed line is a guidance of the control value. ANOVA test was used for statistical analysis followed by Tukey post hoc test. ** p < 0.01; **** p < 0.0001.
Ijms 24 07459 g005
Figure 6. UPR signaling induced in response to 7KCh in mRPE cells. (A) Western blot estimation of GRP78 levels in mRPE cells exposed to increasing concentrations of 7KCh for 24 h. GRP78 levels were normalized with respect to Actin band quantification. Data are represented as mean ±SEM of at least three different experiments. The dashed line is a guidance of the control value. ANOVA test was used for statistical analysis followed by Tukey post hoc test. (B) XBP1 splicing detection in the RNAseq analysis in mRPE cells treated with 15 μM 7KCh and/or 10 μM SA. Distribution of reads on XBP1 was visualized using the software IGV (Integrated Genome Viewer). Black arrows indicate the position in which the splicing was performed.
Ijms 24 07459 g006
Figure 7. Classical MAPK signaling pathway altered by 15 μM 7KCh treatment in mRPE cells and reversion effect exerted by 10 μM SA over this modulation. In red, proteins expressed at higher levels than control. In green, proteins expressed at lower levels than control. Reprinted and modified with permission from Kyoto Encyclopedia of Genes and Genomes (KEGG). Copyright 2013, KEGG, Kyoto, Japan.
Ijms 24 07459 g007
Figure 8. Activation of JNK in response to 7KCh in mRPE cells. (A) Western blot estimation of phosphorylated JNK (p-JNK) levels in mRPE cells exposed to increasing concentrations of 7KCh for 24 h. (B) Cell viability determined by MTS assay in mRPE cells treated with 15 μM 7KCh and increasing concentrations of SP600125 (SP) for 24 h. (C) Secreted levels of IL-6, IL-8 and VEGF-A in mRPE cells exposed to 15 μM 7KCh and 40 μM SP600125 for 48 h and measured with ELISA. (D) Western blot estimation of p-JNK levels in mRPE cells exposed to 20 μM 7KCh and 10 μM SA for 6 h, 12 h and 24 h. In Western blot assays, JNK levels, previously normalized with respect to Actin, were used to normalize p-JNK quantification. In MTS assay and ELISA, the JNK inhibitor SP600125 was added with a pretreatment of 2 h with respect to 7KCh. The vehicle group in the graphs represents the control (control-vehicle) and the 7KCh (7KCh-vehicle) treatment. Data are represented as mean ± SEM of at least three different experiments. The dashed and dotted lines are a guidance mark of control and 7KCh value, respectively. ANOVA test was used for statistical analysis followed by Tukey (in A,B,D) or Sidak (in C) post hoc test.* p < 0.05; ** p < 0.01.
Ijms 24 07459 g008
Figure 9. Activation of p38 in response to 7KCh in mRPE cells. (A) Western blot estimation of phosphorylated p38 (p-p38) levels in mRPE cells exposed to increasing concentrations of 7KCh for 24 h. (B) Cell viability determined by MTS assay in mRPE cells treated with 15 μM 7KCh and increasing concentrations of SB203580 (SB) for 24 h. (C) Secreted levels of IL-6, IL-8 and VEGF-A in mRPE cells exposed to 15 μM 7KCh and 40 μM SB203580 for 48 h and measured with ELISA. (D) Western blot estimation of p-p38 levels in mRPE cells exposed to 20 μM 7KCh and 10 μM SA for 6 h, 12 h and 24 h. In Western blot assays, p38 levels, previously normalized with respect to Actin, were used to normalize p-p38 quantification. In MTS assay and ELISA, the p38 inhibitor SB203580 was added with a pretreatment of 2 h with respect to 7KCh. The vehicle group in the graphs represents the control (control-vehicle) and the 7KCh (7KCh-vehicle) treatment. Data are represented as mean ± SEM of at least three different experiments. The dashed and dotted lines are a guidance mark of control and 7KCh value, respectively. ANOVA test was used for statistical analysis followed by Tukey (in A,B,D) or Sidak (in C) post hoc test.* p < 0.05; ** p < 0.01; *** p < 0.001; **** p < 0.0001.
Ijms 24 07459 g009
Table 1. Relevant genes and associated pathways altered in mRPE cells treated with 15 μM 7KCh for 24 h. Positive Log2FC (FC, Fold Change) represents upregulated genes, while negative Log2FC represents downregulated genes.
PathwayGene IDLog2FCFDRGene Description
Lipid metabolismACACA−0.694.43 × 10−5acetyl-CoA carboxylase 1
ABHD50.662.64 × 10−2abhydrolase domain containing 5
ACLY−0.767.19 × 10−8ATP-citrate synthase
CAV1−0.534.64 × 10−2Caveolin-1
ELOVL40.992.57 × 10−2Elongation very long chain fatty acids protein 4
FADS1−0.821.86 × 10−5fatty acid desaturase 1
FADS2−1.021.05 × 10−7fatty acid desaturase 2
FASN−1.172.21 × 10−8Fatty acid synthase
SCD−0.932.26 × 10−7Stearoyl-CoA desaturase
Sterol biosynthesis and transportABCA11.831.91 × 10−14ATP binding cassette subfamily A member 1
ABCG12.959.60 × 10−21ATP binding cassette subfamily G member 1
ABCC92.486.32 × 10−5ATP binding cassette subfamily C member 9
FDFT1−1.451.38 × 10−26squalene synthase
HMGCR−1.653.23 × 10−173-hydroxy-3-methylglutaryl coenzyme A reductase
HMGCS1−3.12.56 × 10−51hydroxymethylglutaryl-CoA synthase
INSIG1−2.099.80 × 10−28insulin-induced gene protein
LDLR−0.84.65 × 10−3low-density lipoprotein receptor
LSS−2.086.49 × 10−44terpene cyclase/mutase family member
MSMO1−2.22.28 × 10−42methylsterol monooxygenase 1
MVD−2.44.33 × 10−37diphosphomevalonate decarboxylase
MVK−1.134.66 × 10−8mevalonate kinase
SQLE−2.111.36 × 10−44squalene monooxygenase
ER stressASNS1.883.62 × 10−7glutamine-dependent asparagine synthetase
ATF33.161.58 × 10−8activating transcription factor 3
CEBPB1.443.54 × 10−4CCAAT/enhancer-binding protein beta
CEBPG1.091.71 × 10−4CCAAT/enhancer-binding protein gamma
EIF2S20.463.81 × 10−2eukaryotic translation initiation factor 2 subunit beta
ERN10.831.33 × 10−3non-specific serine/threonine protein kinase
GFPT10.912.52 × 10−3glutamine--fructose-6-phosphate transaminase 1
HSPA51.361.94 × 10−5heat Shock Protein Family A (Hsp70) Member 5
HYOU10.811.40 × 10−3hypoxia up-regulated 1
PREB0.638.42 × 10−3prolactin regulatory element binding
SRPRB0.824.86 × 10−4SRP receptor subunit beta
SSR10.472.21 × 10−2signal sequence receptor subunit 1
NFκB and MAPK inflammatory signalingCXCL21.31.99 × 10−2C-X-C motif chemokine 2
EGFR0.622.55 × 10−2receptor protein-tyrosine kinase
FOSB2.812.50 × 10−2FosB proto-oncogene
IL1A2.854.87 × 10−5interleukin-1 alpha
IL61.364.98 × 10−2interleukin-6
MAP2K10.461.83 × 10−2mitogen-activated protein kinase kinase 1
MAP3K80.894.25 × 10−2mitogen-activated protein kinase kinase kinase 8
MYC0.784.90 × 10−5mYC proto-oncogene
NFKBIA0.551.83 × 10−2NF-kappa-B inhibitor alpha
NFKBIB1.037.77 × 10−5NF-kappa-B inhibitor beta
NFKBIERPS6KA10.540.954.83 × 10−22.22 × 10⁻³NF-kappa-B inhibitor epsilonribosomal Protein S6 Kinase A1
RRAS20.741.14 × 10−3Ras related 2
TLR40.962.31 × 10−3toll-like receptor 4
TRAF10.822.35 × 10−2TNF Receptor Associated Factor 1
VEGFA0.743.42 × 10−2vascular endothelial growth factor A
Cell death signalingAPAF1−0.453.16 × 10−2apoptotic peptidase activating factor 1
CASP11.403.21 × 10−7caspase-1
DFNA50.959.87 × 10−4non-syndromic hearing impairment protein 5 isoform A
GADD45A0.701.99 × 10−5growth arrest and DNA damage-inducible alpha
PMAIP11.309.07 × 10−6phorbol-12-Myristate-13-Acetate-Induced Protein 1
TNFRSF10B0.602.36 × 10−2TNF receptor superfamily member 10b
TP53I30.652.57 × 10−2tumor protein p53 inducible protein 3
Table 2. Primers used in this work in mRPE cells.
GeneOligonucleotide Sequence
18S—Forward5′-ATGCTCTTAGCTGAGTGTCCCG-3′
18S—Reverse5′-ATTCCTAGCTGCGGTATCCAGG-3′
IL8—Forward5′-ACCAAGGAAATCGGCCCCTA-3′
IL8—Reverse5′-CCATACCTCTAGGCTGGCTATC-3′
IL6—Forward5′-CTGGTCTTTTGGAGTTTGAGGT-3′
IL6—Reverse5′-GCTGGCATTTGTGGTTGGT-3′
VEGFA—Forward5′-TTCACCCTCGTCCTCTTCCT-3′
VEGFA—Reverse5′-ATCCTGCCCTGTCTCTCTGT-3′
Disclaimer/Publisher’s Note: The statements, opinions and data contained in all publications are solely those of the individual author(s) and contributor(s) and not of MDPI and/or the editor(s). MDPI and/or the editor(s) disclaim responsibility for any injury to people or property resulting from any ideas, methods, instructions or products referred to in the content.

