
Evaluation of the Oral Bacterial Genome and Metabolites in Patients with Wolfram Syndrome

 , , , ,
  , and
, and
Abstract
:1. Introduction
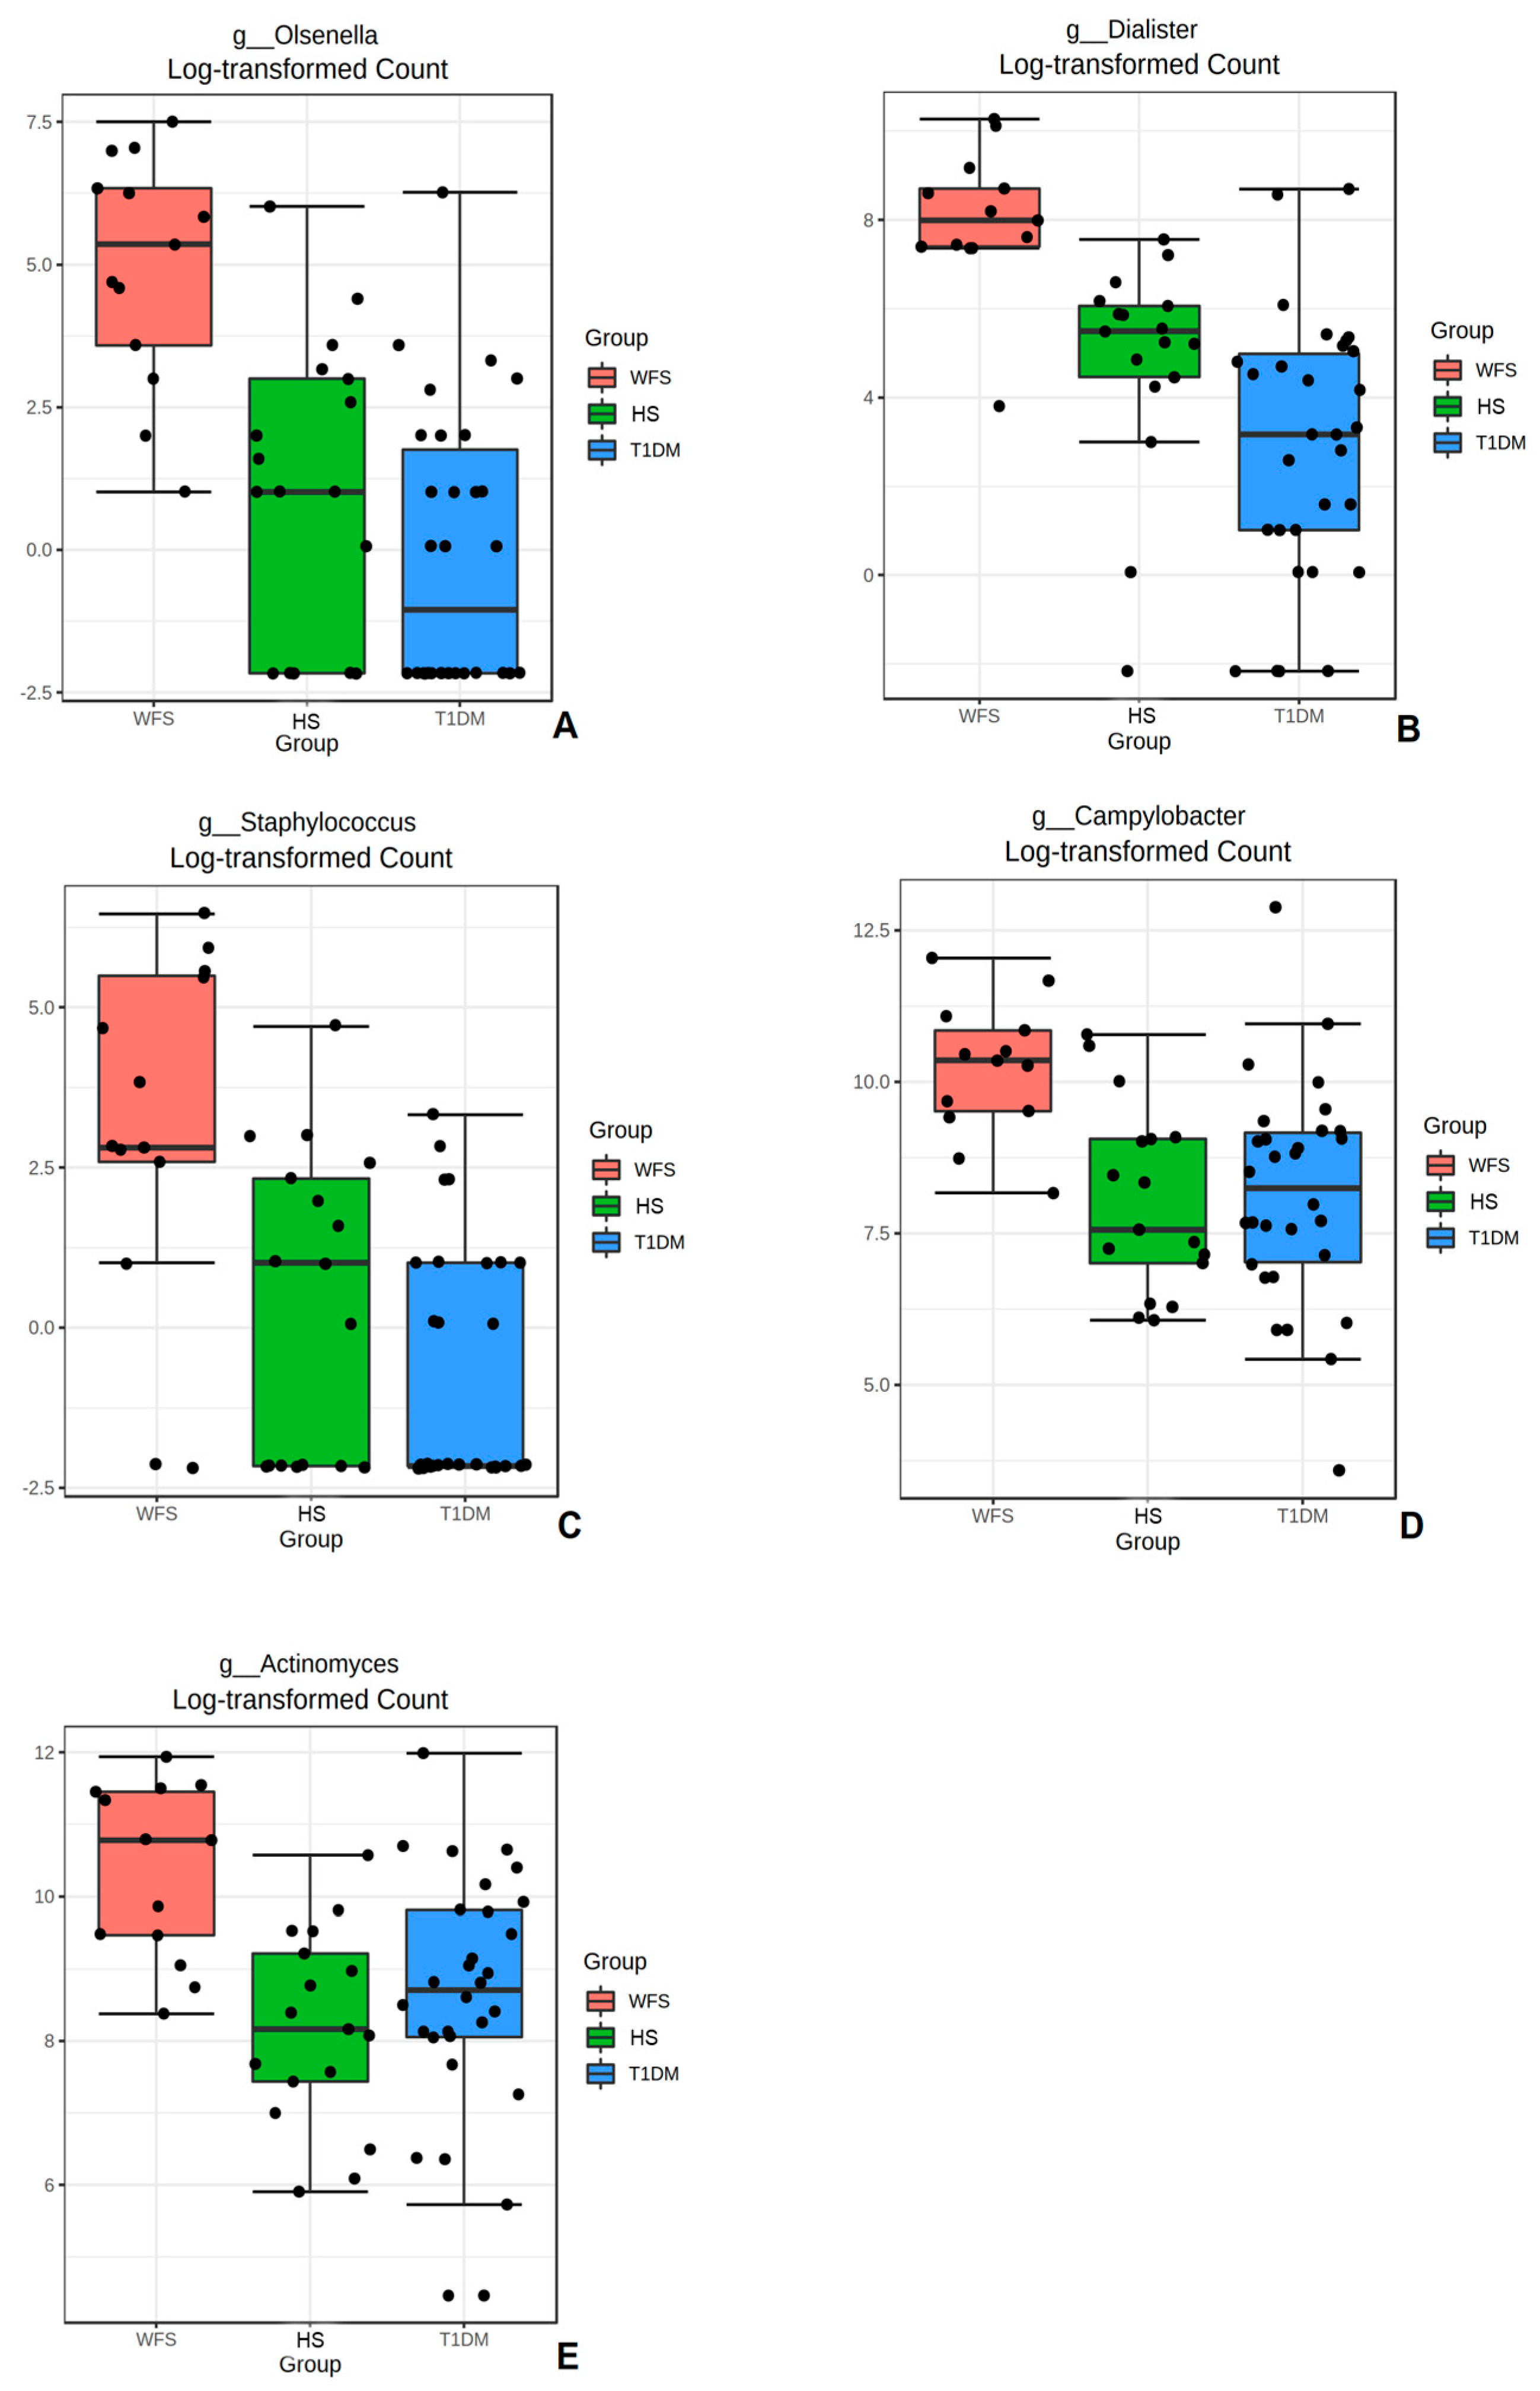
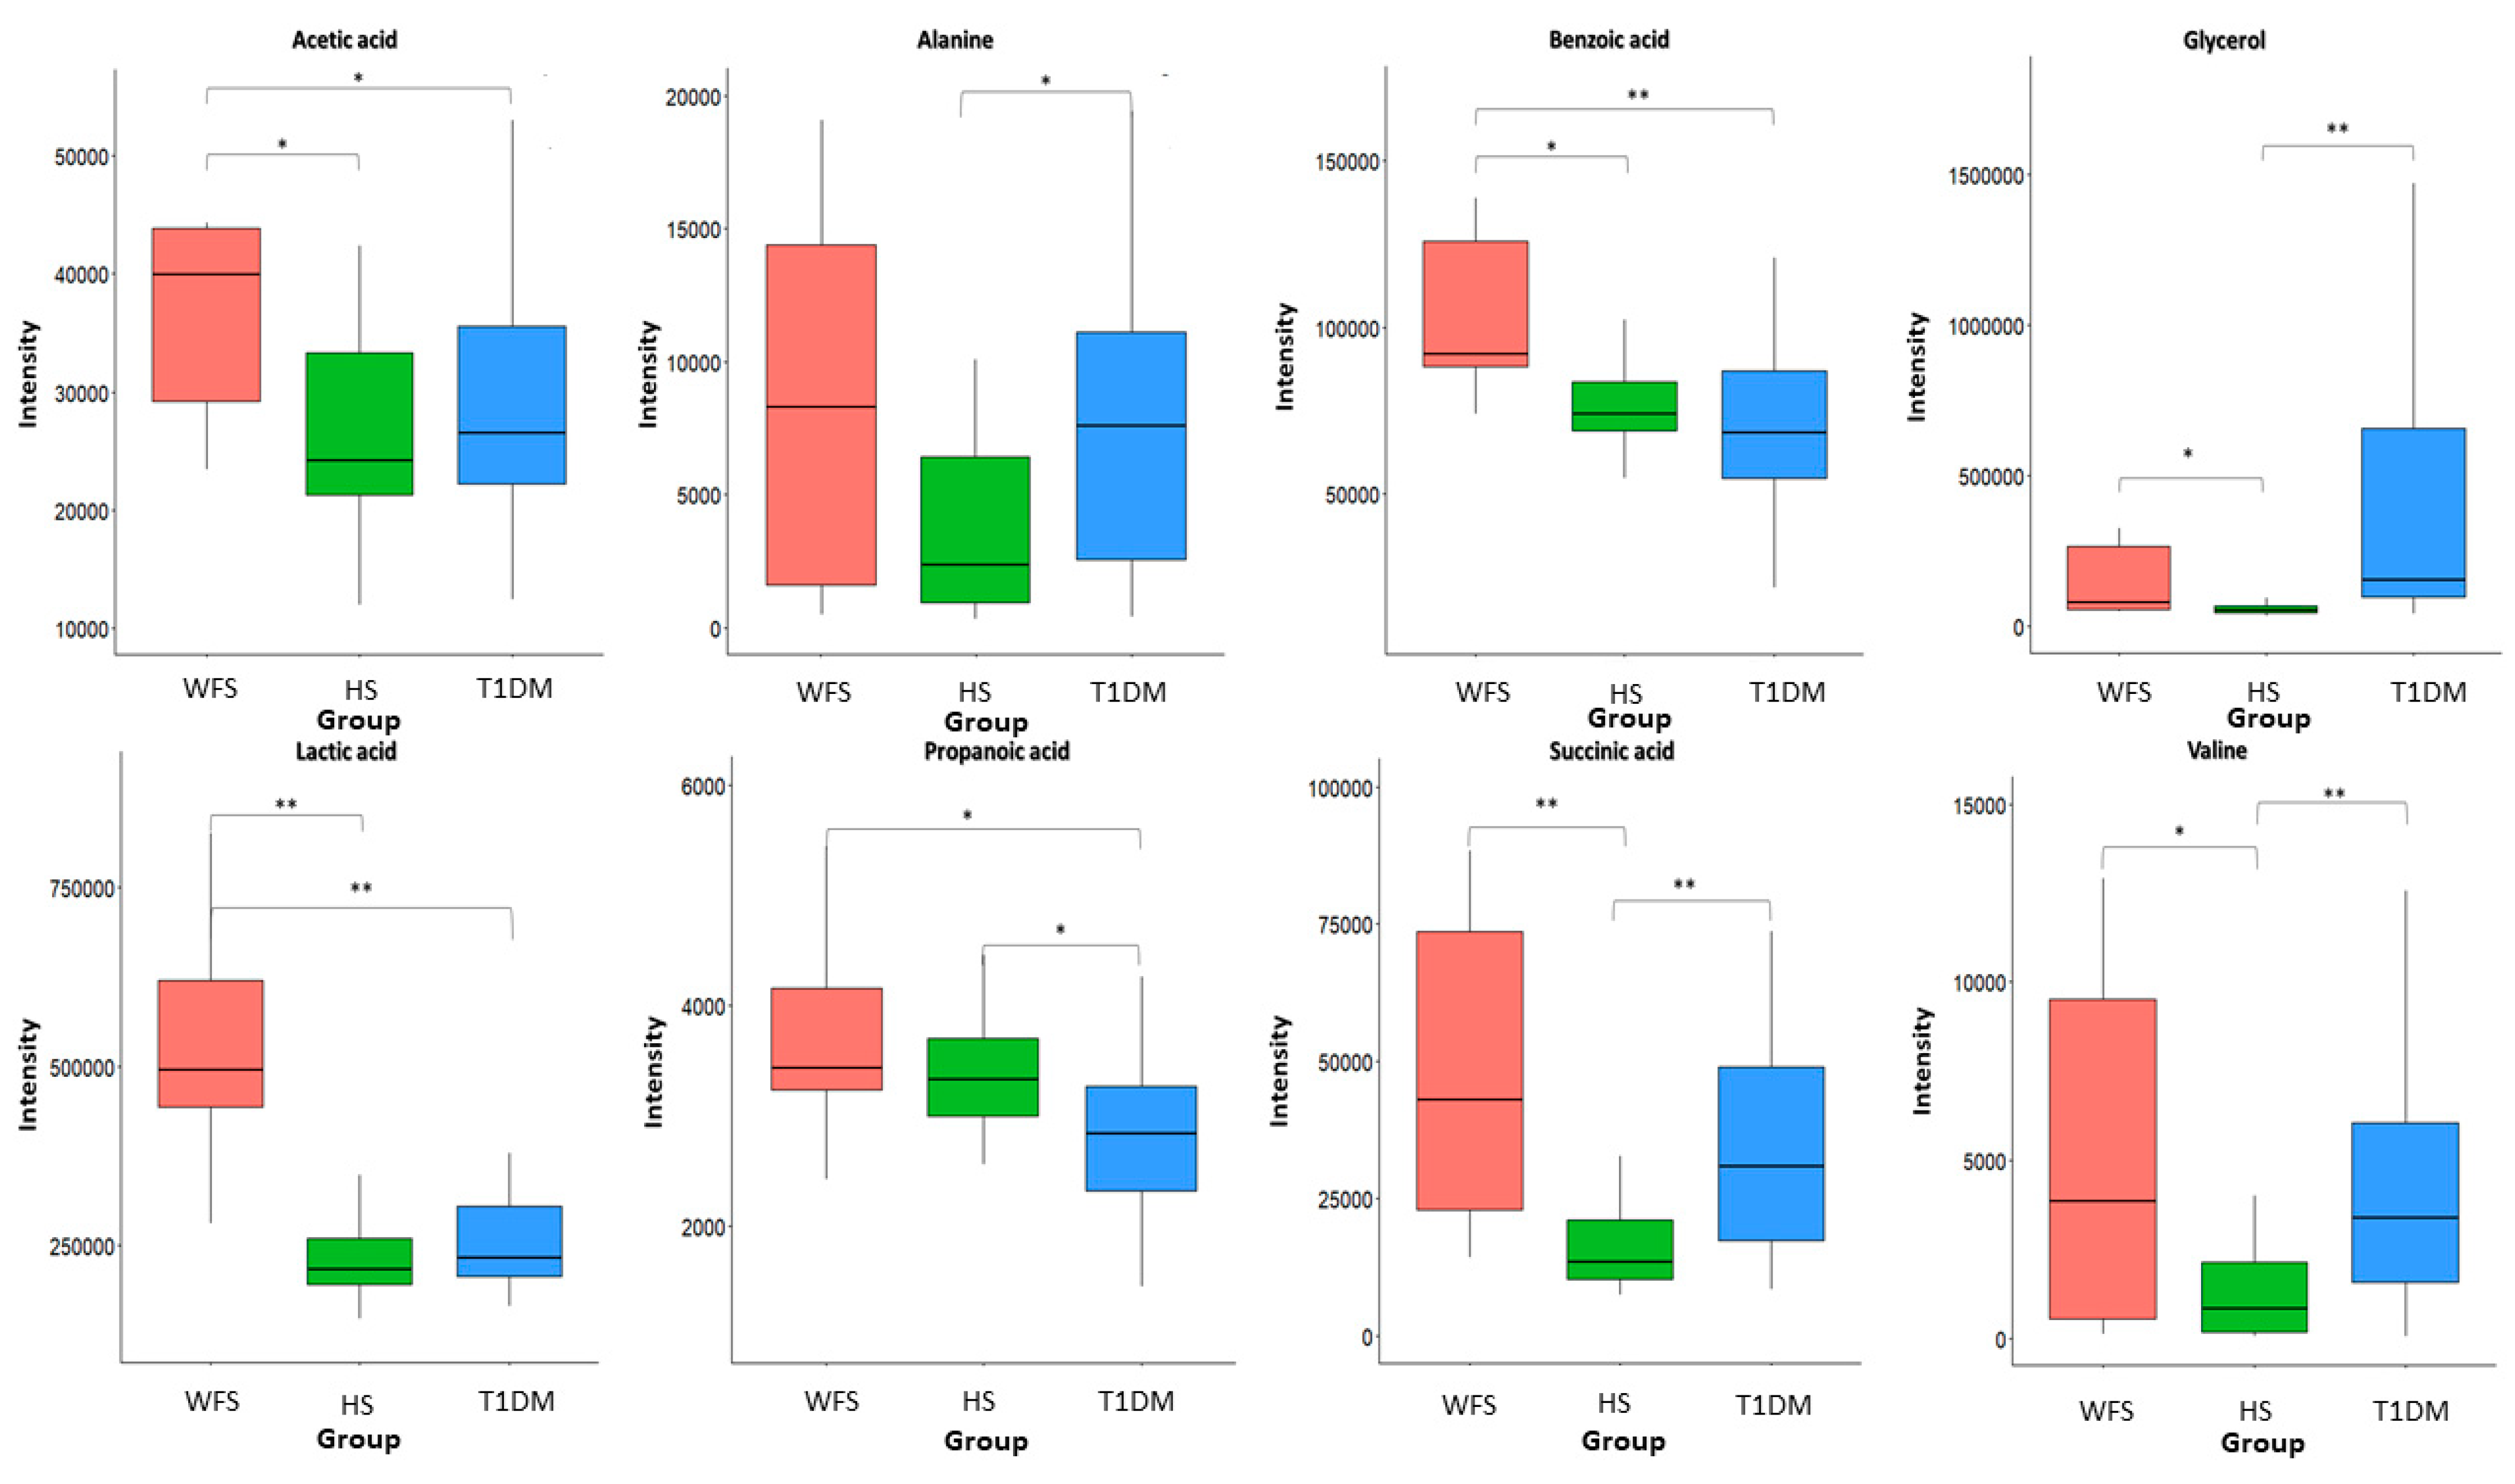
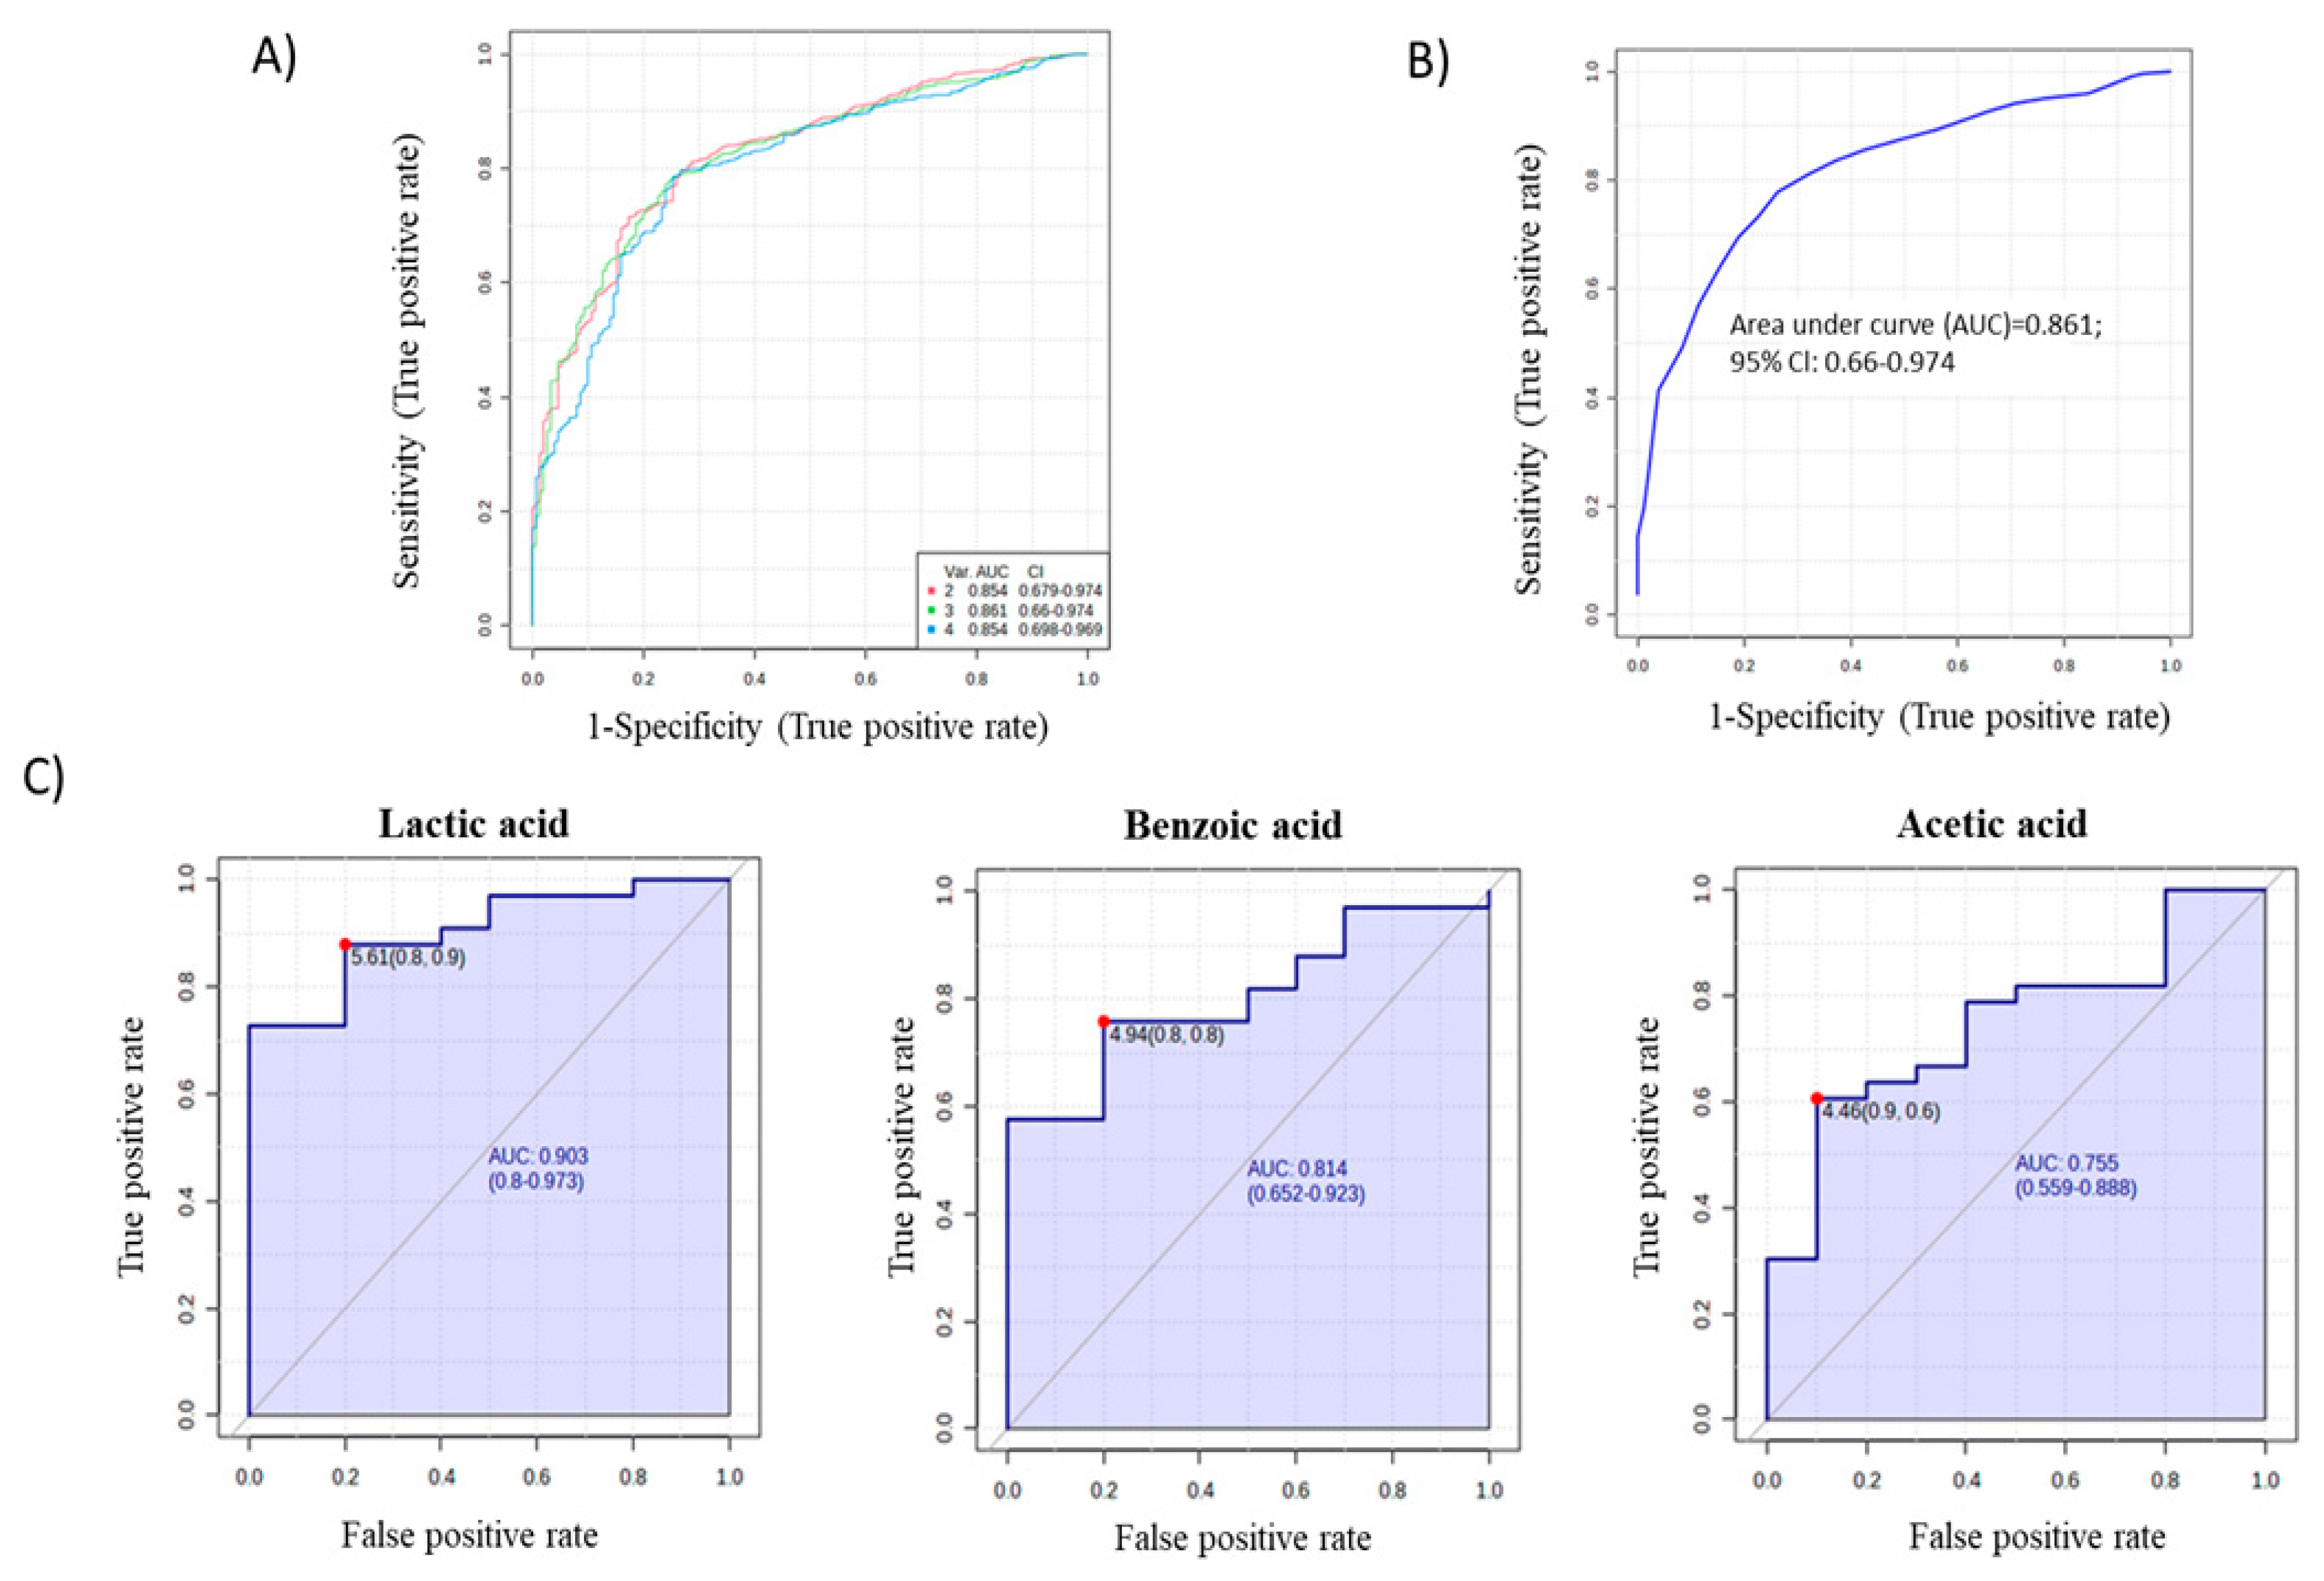
2. Results
3. Discussion
4. Materials and Methods
4.1. Patients
4.2. Molecular Analysis—DNA Isolation
4.3. Library Preparation and Sequencing
4.4. NGS Data Processing
4.5. Data Analysis—Alpha and Beta Diversity
4.6. Metabolite Extraction and Derivatization from the GCF Samples
4.7. Untargeted GC–MS (Gas Chromatography–Mass Spectrometry) Data Analysis
4.8. Raw GC–MS Data Processing
4.9. Visualization of Data and Statistical Analysis
Supplementary Materials
Author Contributions
Funding
Institutional Review Board Statement
Informed Consent Statement
Data Availability Statement
Acknowledgments
Conflicts of Interest
References
- Barrett, T.G.; Bundey, S.E.; Macleod, A.F. Neurodegeneration and Diabetes: UK Nationwide Study of Wolfram (DIDMOAD) Syndrome. Lancet 1995, 346, 1458–1463. [Google Scholar] [CrossRef]
- Farmer, A.; Aymé, S.; de Heredia, M.L.; Maffei, P.; McCafferty, S.; Młynarski, W.; Nunes, V.; Parkinson, K.; Paquis-Flucklinger, V.; Rohayem, J.; et al. EURO-WABB: An EU Rare Diseases Registry for Wolfram Syndrome, Alström Syndrome and Bardet-Biedl Syndrome. BMC Pediatr. 2013, 13, 130. [Google Scholar] [CrossRef] [PubMed] [Green Version]
- Marshall, B.A.; Permutt, M.A.; Paciorkowski, A.R.; Hoekel, J.; Karzon, R.; Wasson, J.; Viehover, A.; White, N.H.; Shimony, J.S.; Manwaring, L.; et al. Phenotypic Characteristics of Early Wolfram Syndrome. Orphanet J. Rare Dis. 2013, 8, 64. [Google Scholar] [CrossRef] [Green Version]
- Ishihara, H.; Takeda, S.; Tamura, A.; Takahashi, R.; Yamaguchi, S.; Takei, D.; Yamada, T.; Inoue, H.; Soga, H.; Katagiri, H.; et al. Disruption of the WFS1 Gene in Mice Causes Progressive β-Cell Loss and Impaired Stimulus–Secretion Coupling in Insulin Secretion. Hum. Mol. Genet. 2004, 13, 1159–1170. [Google Scholar] [CrossRef] [PubMed] [Green Version]
- Rohayem, J.; Ehlers, C.; Wiedemann, B.; Holl, R.; Oexle, K.; Kordonouri, O.; Salzano, G.; Meissner, T.; Burger, W.; Schober, E.; et al. Diabetes and Neurodegeneration in Wolfram Syndrome. Diabetes Care 2011, 34, 1503–1510. [Google Scholar] [CrossRef] [PubMed] [Green Version]
- Fonseca, S.G.; Ishigaki, S.; Oslowski, C.M.; Lu, S.; Lipson, K.L.; Ghosh, R.; Hayashi, E.; Ishihara, H.; Oka, Y.; Permutt, M.A.; et al. Wolfram syndrome 1 gene negatively regulates ER stress signaling in rodent and human cells. J. Clin. Investig. 2010, 120, 744–755. [Google Scholar] [CrossRef] [Green Version]
- Zmyslowska, A.; Borowiec, M.; Antosik, K.; Szalecki, M.; Stefanski, A.; Iwaniszewska, B.; Jedrzejczyk, M.; Pietrzak, I.; Mlynarski, W. Wolfram Syndrome in the Polish Population: Novel Mutations and Genotype-Phenotype Correlation: Novel Mutations in the WFS1 Gene. Clin. Endocrinol. 2011, 75, 636–641. [Google Scholar] [CrossRef]
- Zmyslowska, A.; Ciborowski, M.; Borowiec, M.; Fendler, W.; Pietrowska, K.; Parfieniuk, E.; Antosik, K.; Pyziak, A.; Waszczykowska, A.; Kretowski, A.; et al. Serum Metabolic Fingerprinting Identified Putatively Annotated Sphinganine Isomer as a Biomarker of Wolfram Syndrome. J. Proteome Res. 2017, 16, 4000–4008. [Google Scholar] [CrossRef]
- Ilievski, V.; Zuchowska, P.K.; Green, S.J.; Toth, P.T.; Ragozzino, M.E.; Le, K.; Aljewari, H.W.; O’Brien-Simpson, N.M.; Reynolds, E.C.; Watanabe, K. Chronic Oral Application of a Periodontal Pathogen Results in Brain Inflammation, Neurodegeneration and Amyloid Beta Production in Wild Type Mice. PLoS ONE 2018, 13, e0204941. [Google Scholar] [CrossRef] [Green Version]
- Shinjyo, N.; Kagaya, W.; Pekna, M. Interaction between the Complement System and Infectious Agents—A Potential Mechanistic Link to Neurodegeneration and Dementia. Front. Cell. Neurosci. 2021, 15, 710390. [Google Scholar] [CrossRef]
- Kilian, M.; Chapple, I.L.C.; Hannig, M.; Marsh, P.D.; Meuric, V.; Pedersen, A.M.L.; Tonetti, M.S.; Wade, W.G.; Zaura, E. The Oral Microbiome—An Update for Oral Healthcare Professionals. Br. Dent. J. 2016, 221, 657–666. [Google Scholar] [CrossRef] [PubMed]
- Carter, C.J.; France, J.; Crean, S.; Singhrao, S.K. The Porphyromonas Gingivalis/Host Interactome Shows Enrichment in GWASdb Genes Related to Alzheimer’s Disease, Diabetes and Cardiovascular Diseases. Front. Aging Neurosci. 2017, 9, 408. [Google Scholar] [CrossRef] [PubMed] [Green Version]
- Tran, T.T.A.; Kang, Y.J.; Kim, H.-K.; Kim, H.-R.; Cho, H. Oral Pathogenic Bacteria-Inducing Neurodegenerative Microgliosis in Human Neural Cell Platform. Int. J. Mol. Sci. 2021, 22, 6925. [Google Scholar] [CrossRef]
- Andrade-Guerrero, J.; Santiago-Balmaseda, A.; Jeronimo-Aguilar, P.; Vargas-Rodríguez, I.; Cadena-Suárez, A.R.; Sánchez-Garibay, C.; Pozo-Molina, G.; Méndez-Catalá, C.F.; Cardenas-Aguayo, M.D.; Diaz-Cintra, S.; et al. Alzheimer’s Disease: An Updated Overview of Its Genetics. Int. J. Mol. Sci. 2023, 13, 3754. [Google Scholar] [CrossRef] [PubMed]
- Sánchez-Sanhueza, G.; Bello-Toledo, H.; González-Rocha, G.; Gonçalves, A.T.; Valenzuela, V.; Gallardo-Escárate, C. Metagenomic Study of Bacterial Microbiota in Persistent Endodontic Infections Using Next-Generation Sequencing. Int. Endod. J. 2018, 51, 1336–1348. [Google Scholar] [CrossRef] [PubMed]
- Stebner, A.; Ensser, A.; Geißdörfer, W.; Bozhkov, Y.; Lang, R. Molecular Diagnosis of Polymicrobial Brain Abscesses with 16S-RDNA-Based next-Generation Sequencing. Clin. Microbiol. Infect. 2021, 27, 76–82. [Google Scholar] [CrossRef]
- Wang, J.; Han, Y.; Feng, J. Metagenomic Next-Generation Sequencing for Mixed Pulmonary Infection Diagnosis. BMC Pulm. Med. 2019, 19, 252. [Google Scholar] [CrossRef] [Green Version]
- Zaura, E. Next-Generation Sequencing Approaches to Understanding the Oral Microbiome. Adv. Dent. Res. 2012, 24, 81–85. [Google Scholar] [CrossRef]
- Moskovitz, M.; Nassar, M.; Moriel, N.; Cher, A.; Faibis, S.; Ram, D.; Zangen, D.; Yassour, M.; Steinberg, D. Characterization of the Oral Microbiome among Children with Type 1 Diabetes Compared with Healthy Children. Front. Microbiol. 2021, 12, 756808. [Google Scholar] [CrossRef]
- Babatzia, A.; Papaioannou, W.; Stavropoulou, A.; Pandis, N.; Kanaka-Gantenbein, C.; Papagiannoulis, L.; Gizani, S. Clinical and Microbial Oral Health Status in Children and Adolescents with Type 1 Diabetes Mellitus. Int. Dent. J. 2020, 70, 136–144. [Google Scholar] [CrossRef]
- Jensen, E.D.; Selway, C.A.; Allen, G.; Bednarz, J.; Weyrich, L.S.; Gue, S.; Peña, A.S.; Couper, J. Early Markers of Periodontal Disease and Altered Oral Microbiota Are Associated with Glycemic Control in Children with Type 1 Diabetes. Pediatr. Diabetes 2021, 22, 474–481. [Google Scholar] [CrossRef]
- Chakraborty, P.; Chowdhury, R.; Bhakta, A.; Mukhopahyay, P.; Ghosh, S. Microbiology of Periodontal Disease in Adolescents with Type 1 Diabetes. Diabetes Metab. Syndr. Clin. Res. Rev. 2021, 15, 102333. [Google Scholar] [CrossRef]
- Preshaw, P.M.; Alba, A.L.; Herrera, D.; Jepsen, S.; Konstantinidis, A.; Makrilakis, K.; Taylor, R. Periodontitis and Diabetes: A Two-Way Relationship. Diabetologia 2012, 55, 21–31. [Google Scholar] [CrossRef] [PubMed] [Green Version]
- Darveau, R.P. Periodontitis: A Polymicrobial Disruption of Host Homeostasis. Nat. Rev. Microbiol. 2010, 8, 481–490. [Google Scholar] [CrossRef] [PubMed]
- Marsh, P.D.; Head, D.A.; Devine, D.A. Ecological Approaches to Oral Biofilms: Control without Killing. Caries Res. 2015, 49, 46–54. [Google Scholar] [CrossRef] [Green Version]
- Meyle, J.; Chapple, I. Molecular Aspects of the Pathogenesis of Periodontitis. Periodontol. 2000 2015, 69, 7–17. [Google Scholar] [CrossRef]
- Dibello, V.; Lozupone, M.; Manfredini, D.; Dibello, A.; Zupo, R.; Sardone, R.; Daniele, A.; Lobbezoo, F.; Panza, F. Oral Frailty and Neurodegeneration in Alzheimer’s Disease. Neural Regen. Res. 2021, 16, 2149. [Google Scholar] [CrossRef] [PubMed]
- Dominy, S.S.; Lynch, C.; Ermini, F.; Benedyk, M.; Marczyk, A.; Konradi, A.; Nguyen, M.; Haditsch, U.; Raha, D.; Griffin, C.; et al. Porphyromonas gingivalis in Alzheimer’s Disease Brains: Evidence for Disease Causation and Treatment with Small-Molecule Inhibitors. Sci. Adv. 2019, 5, eaau3333. [Google Scholar] [CrossRef] [Green Version]
- Dohm-Hansen, S.; Donoso, F.; Lucassen, P.J.; Clarke, G.; Nolan, Y.M. The Gut Microbiome and Adult Hippocampal Neurogenesis: A New Focal Point for Epilepsy? Neurobiol. Dis. 2022, 170, 105746. [Google Scholar] [CrossRef]
- Miraglia, F.; Colla, E. Microbiome, Parkinson’s Disease and Molecular Mimicry. Cells 2019, 8, 222. [Google Scholar] [CrossRef] [Green Version]
- La Morgia, C.; Maresca, A.; Amore, G.; Gramegna, L.L.; Carbonelli, M.; Scimonelli, E.; Danese, A.; Patergnani, S.; Caporali, L.; Tagliavini, F.; et al. Calcium Mishandling in Absence of Primary Mitochondrial Dysfunction Drives Cellular Pathology in Wolfram Syndrome. Sci. Rep. 2020, 10, 4785. [Google Scholar] [CrossRef] [PubMed] [Green Version]
- Zmyslowska, A.; Kuljanin, M.; Malachowska, B.; Stanczak, M.; Michalek, D.; Wlodarczyk, A.; Grot, D.; Taha, J.; Pawlik, B.; Lebiedzińska-Arciszewska, M.; et al. Multiomic Analysis on Human Cell Model of Wolfram Syndrome Reveals Changes in Mitochondrial Morphology and Function. Cell Commun. Signal. 2021, 19, 116. [Google Scholar] [CrossRef] [PubMed]
- Proia, P.; Di Liegro, C.; Schiera, G.; Fricano, A.; Di Liegro, I. Lactate as a Metabolite and a Regulator in the Central Nervous System. Int. J. Mol. Sci. 2016, 17, 1450. [Google Scholar] [CrossRef] [PubMed] [Green Version]
- Cecarini, V.; Bonfili, L.; Gogoi, O.; Lawrence, S.; Venanzi, F.M.; Azevedo, V.; Mancha-Agresti, P.; Drumond, M.M.; Rossi, G.; Berardi, S.; et al. Neuroprotective Effects of P62(SQSTM1)-Engineered Lactic Acid Bacteria in Alzheimer’s Disease: A Pre-Clinical Study. Aging 2020, 12, 15995–16020. [Google Scholar] [CrossRef]
- Aharoni, R.; Eilam, R.; Lerner, S.; Shavit-Stein, E.; Dori, A.; Chapman, J.; Arnon, R. Neuroprotective Effect of Glatiramer Acetate on Neurofilament Light Chain Leakage and Glutamate Excess in an Animal Model of Multiple Sclerosis. Int. J. Mol. Sci. 2021, 22, 13419. [Google Scholar] [CrossRef] [PubMed]
- Ibarburu, S.; Kovacs, M.; Varela, V.; Rodríguez-Duarte, J.; Ingold, M.; Invernizzi, P.; Porcal, W.; Arévalo, A.P.; Perelmuter, K.; Bollati-Fogolín, M.; et al. A Nitroalkene Benzoic Acid Derivative Targets Reactive Microglia and Prolongs Survival in an Inherited Model of ALS via NF-κB Inhibition. Neurotherapeutics 2021, 18, 309–325. [Google Scholar] [CrossRef]
- Elmazoglu, Z.; Prnova, M.S.; Santamaria, A.; Stefek, M.; Karasu, C. Combatting Nitrosative Stress and Inflammation with Novel Substituted Triazinoindole Inhibitors of Aldose Reductase in PC12 Cells Exposed to 6-Hydroxydopamine Plus High Glucose. Neurotox. Res. 2021, 39, 210–226. [Google Scholar] [CrossRef]
- World Health Organization. Classification of Diabetes Mellitus; World Health Organization: Geneva, Switzerland, 2019.
- Afgan, E.; Baker, D.; Batut, B.; van den Beek, M.; Bouvier, D.; Čech, M.; Chilton, J.; Clements, D.; Coraor, N.; Grüning, B.A.; et al. The Galaxy Platform for Accessible, Reproducible and Collaborative Biomedical Analyses: 2018 Update. Nucleic Acids Res. 2018, 46, W537–W544. [Google Scholar] [CrossRef] [Green Version]
- Blankenberg, D.; Gordon, A.; Von Kuster, G.; Coraor, N.; Taylor, J.; Nekrutenko, A. Manipulation of FASTQ Data with Galaxy. Bioinformatics 2010, 26, 1783–1785. [Google Scholar] [CrossRef] [Green Version]
- Magoč, T.; Salzberg, S.L. FLASH: Fast Length Adjustment of Short Reads to Improve Genome Assemblies. Bioinformatics 2011, 27, 2957–2963. [Google Scholar] [CrossRef] [Green Version]
- Bolger, A.M.; Lohse, M.; Usadel, B. Trimmomatic: A Flexible Trimmer for Illumina Sequence Data. Bioinformatics 2014, 30, 2114–2120. [Google Scholar] [CrossRef] [PubMed] [Green Version]
- Wood, D.E.; Lu, J.; Langmead, B. Improved Metagenomic Analysis with Kraken 2. Genome Biol. 2019, 20, 257. [Google Scholar] [CrossRef] [PubMed] [Green Version]
- Chong, J.; Liu, P.; Zhou, G.; Xia, J. Using MicrobiomeAnalyst for Comprehensive Statistical, Functional, and Meta-Analysis of Microbiome Data. Nat. Protoc. 2020, 15, 799–821. [Google Scholar] [CrossRef] [PubMed]
- Pei, J.; Li, F.; Xie, Y.; Liu, J.; Yu, T.; Feng, X. Microbial and Metabolomic Analysis of Gingival Crevicular Fluid in General Chronic Periodontitis Patients: Lessons for a Predictive, Preventive, and Personalized Medical Approach. EPMA J. 2020, 11, 197–215. [Google Scholar] [CrossRef] [PubMed] [Green Version]
- Godzien, J.; Alonso-Herranz, V.; Barbas, C.; Armitage, E.G. Controlling the Quality of Metabolomics Data: New Strategies to Get the Best out of the QC Sample. Metabolomics 2015, 11, 518–528. [Google Scholar] [CrossRef]
- Armitage, E.G.; Godzien, J.; Alonso-Herranz, V.; López-Gonzálvez, Á.; Barbas, C. Missing Value Imputation Strategies for Metabolomics Data. Electrophoresis 2015, 36, 3050–3060. [Google Scholar] [CrossRef]


| Metabolites | RT Library | RT | RI | TI | QI 1 | QII 2 | CV (%) QCs | HMDB | Group of Metabolites |
|---|---|---|---|---|---|---|---|---|---|
| Acetic acid | - | 5.8 | 596 | 75 | 117 | 45 | 25.4% | HMDB00237 | Carboxylic acids |
| Propanoic acid | - | 6.5 | 720 | 131 | 75 | 73 | 16.0% | HMDB00042 | Carboxylic acids |
| Lactic acid | 6.851 | 6.6 | 732 | 117 | 147 | 73 | 17.2% | HMDB00190 | Alpha hydroxy acids and derivatives |
| Glycolic acid | 7.049 | 6.9 | 745 | 147 | 73 | 66 | 21.2% | HMDB00115 | Alpha hydroxy acids and derivatives |
| Alanine | 7.474 | 7.3 | 774 | 116 | 73 | 147 | 27.2% | HMDB00161 | Amino acids, peptides, and analogues |
| Acetic acid | - | 7.48 | 785 | 145 | 104 | 174 | 23.9% | HMDB00532 | Amino acids, peptides, and analogues |
| Valine | 9.151 | 8.9 | 898 | 144 | 218 | 73 | 13.2% | HMDB00883 | Amino acids, peptides, and analogues |
| Glycerol-3-phophate | 9.7 | 9.5 | 930 | 299 | 73 | 314 | 12.5% | HMDB00126 | Glycerophosphates |
| Benzoic acid | 9.595 | 9.5 | 935 | 179 | 105 | 135 | 19.5% | HMDB01870 | Benzoic acids and derivatives |
| Glycerol | 9.941 | 9.8 | 950 | 205 | 147 | 73 | 29.7% | HMDB00131 | Carbohydrates and carbohydrate conjugates |
| Glycine | 10.456 | 10.1 | 985 | 174 | 248 | 147 | 24.6% | HMDB00123 | Organic acids and derivatives |
| Succinic acid | 10.509 | 10.4 | 995 | 247 | 73 | 75 | 17.9% | HMDB00254 | Dicarboxylic acids and derivatives |
| m-toluic acid | 11.006 | 10.835 | 1020 | 193 | 119 | 149 | 17.7% | HMDB62810 | Benzoic acids and derivatives |
| WFS | T1DM | HS | ||||
|---|---|---|---|---|---|---|
| N | Mean ± SD or % | N | Mean ± SD or % | N | Mean ± SD or % | |
| Age (years) | 12 | 23.5 ± 6.2 | 29 | 11.3 ± 3.4 | 17 | 26.8 ± 3.3 |
| HbA1c (%) | 12 | 7.6 ± 0.6 | 29 | 7.3 ± 0.8 | 17 | N/A |
| Diabetes duration (years) | 12 | 17.9 ± 6.5 | 29 | 5.0 ± 2.7 | 17 | N/A |
| Gender (F/M) | 12 | 8/4 (66.7%/33.3%) | 29 | 14/15 (48.3%/51.7%) | 17 | 11/6 (64.7%/35.3%) |
Disclaimer/Publisher’s Note: The statements, opinions and data contained in all publications are solely those of the individual author(s) and contributor(s) and not of MDPI and/or the editor(s). MDPI and/or the editor(s) disclaim responsibility for any injury to people or property resulting from any ideas, methods, instructions or products referred to in the content. |
© 2023 by the authors. Licensee MDPI, Basel, Switzerland. This article is an open access article distributed under the terms and conditions of the Creative Commons Attribution (CC BY) license (https://creativecommons.org/licenses/by/4.0/).
Share and Cite
Zmysłowska-Polakowska, E.; Płoszaj, T.; Skoczylas, S.; Mojsak, P.; Ciborowski, M.; Kretowski, A.; Lukomska-Szymanska, M.; Szadkowska, A.; Mlynarski, W.; Zmysłowska, A. Evaluation of the Oral Bacterial Genome and Metabolites in Patients with Wolfram Syndrome. Int. J. Mol. Sci. 2023, 24, 5596. https://doi.org/10.3390/ijms24065596
Zmysłowska-Polakowska E, Płoszaj T, Skoczylas S, Mojsak P, Ciborowski M, Kretowski A, Lukomska-Szymanska M, Szadkowska A, Mlynarski W, Zmysłowska A. Evaluation of the Oral Bacterial Genome and Metabolites in Patients with Wolfram Syndrome. International Journal of Molecular Sciences. 2023; 24(6):5596. https://doi.org/10.3390/ijms24065596
Chicago/Turabian StyleZmysłowska-Polakowska, E., T. Płoszaj, S. Skoczylas, P. Mojsak, M. Ciborowski, A. Kretowski, M. Lukomska-Szymanska, A. Szadkowska, W. Mlynarski, and A. Zmysłowska. 2023. "Evaluation of the Oral Bacterial Genome and Metabolites in Patients with Wolfram Syndrome" International Journal of Molecular Sciences 24, no. 6: 5596. https://doi.org/10.3390/ijms24065596