
Microbiome Dysbiosis Shows Strong Association of Gut-Derived Altered Metabolomic Profile in Gulf War Chronic Multisymptom Illness Symptom Persistence Following Western Diet Feeding and Development of Obesity
 , , , , , and
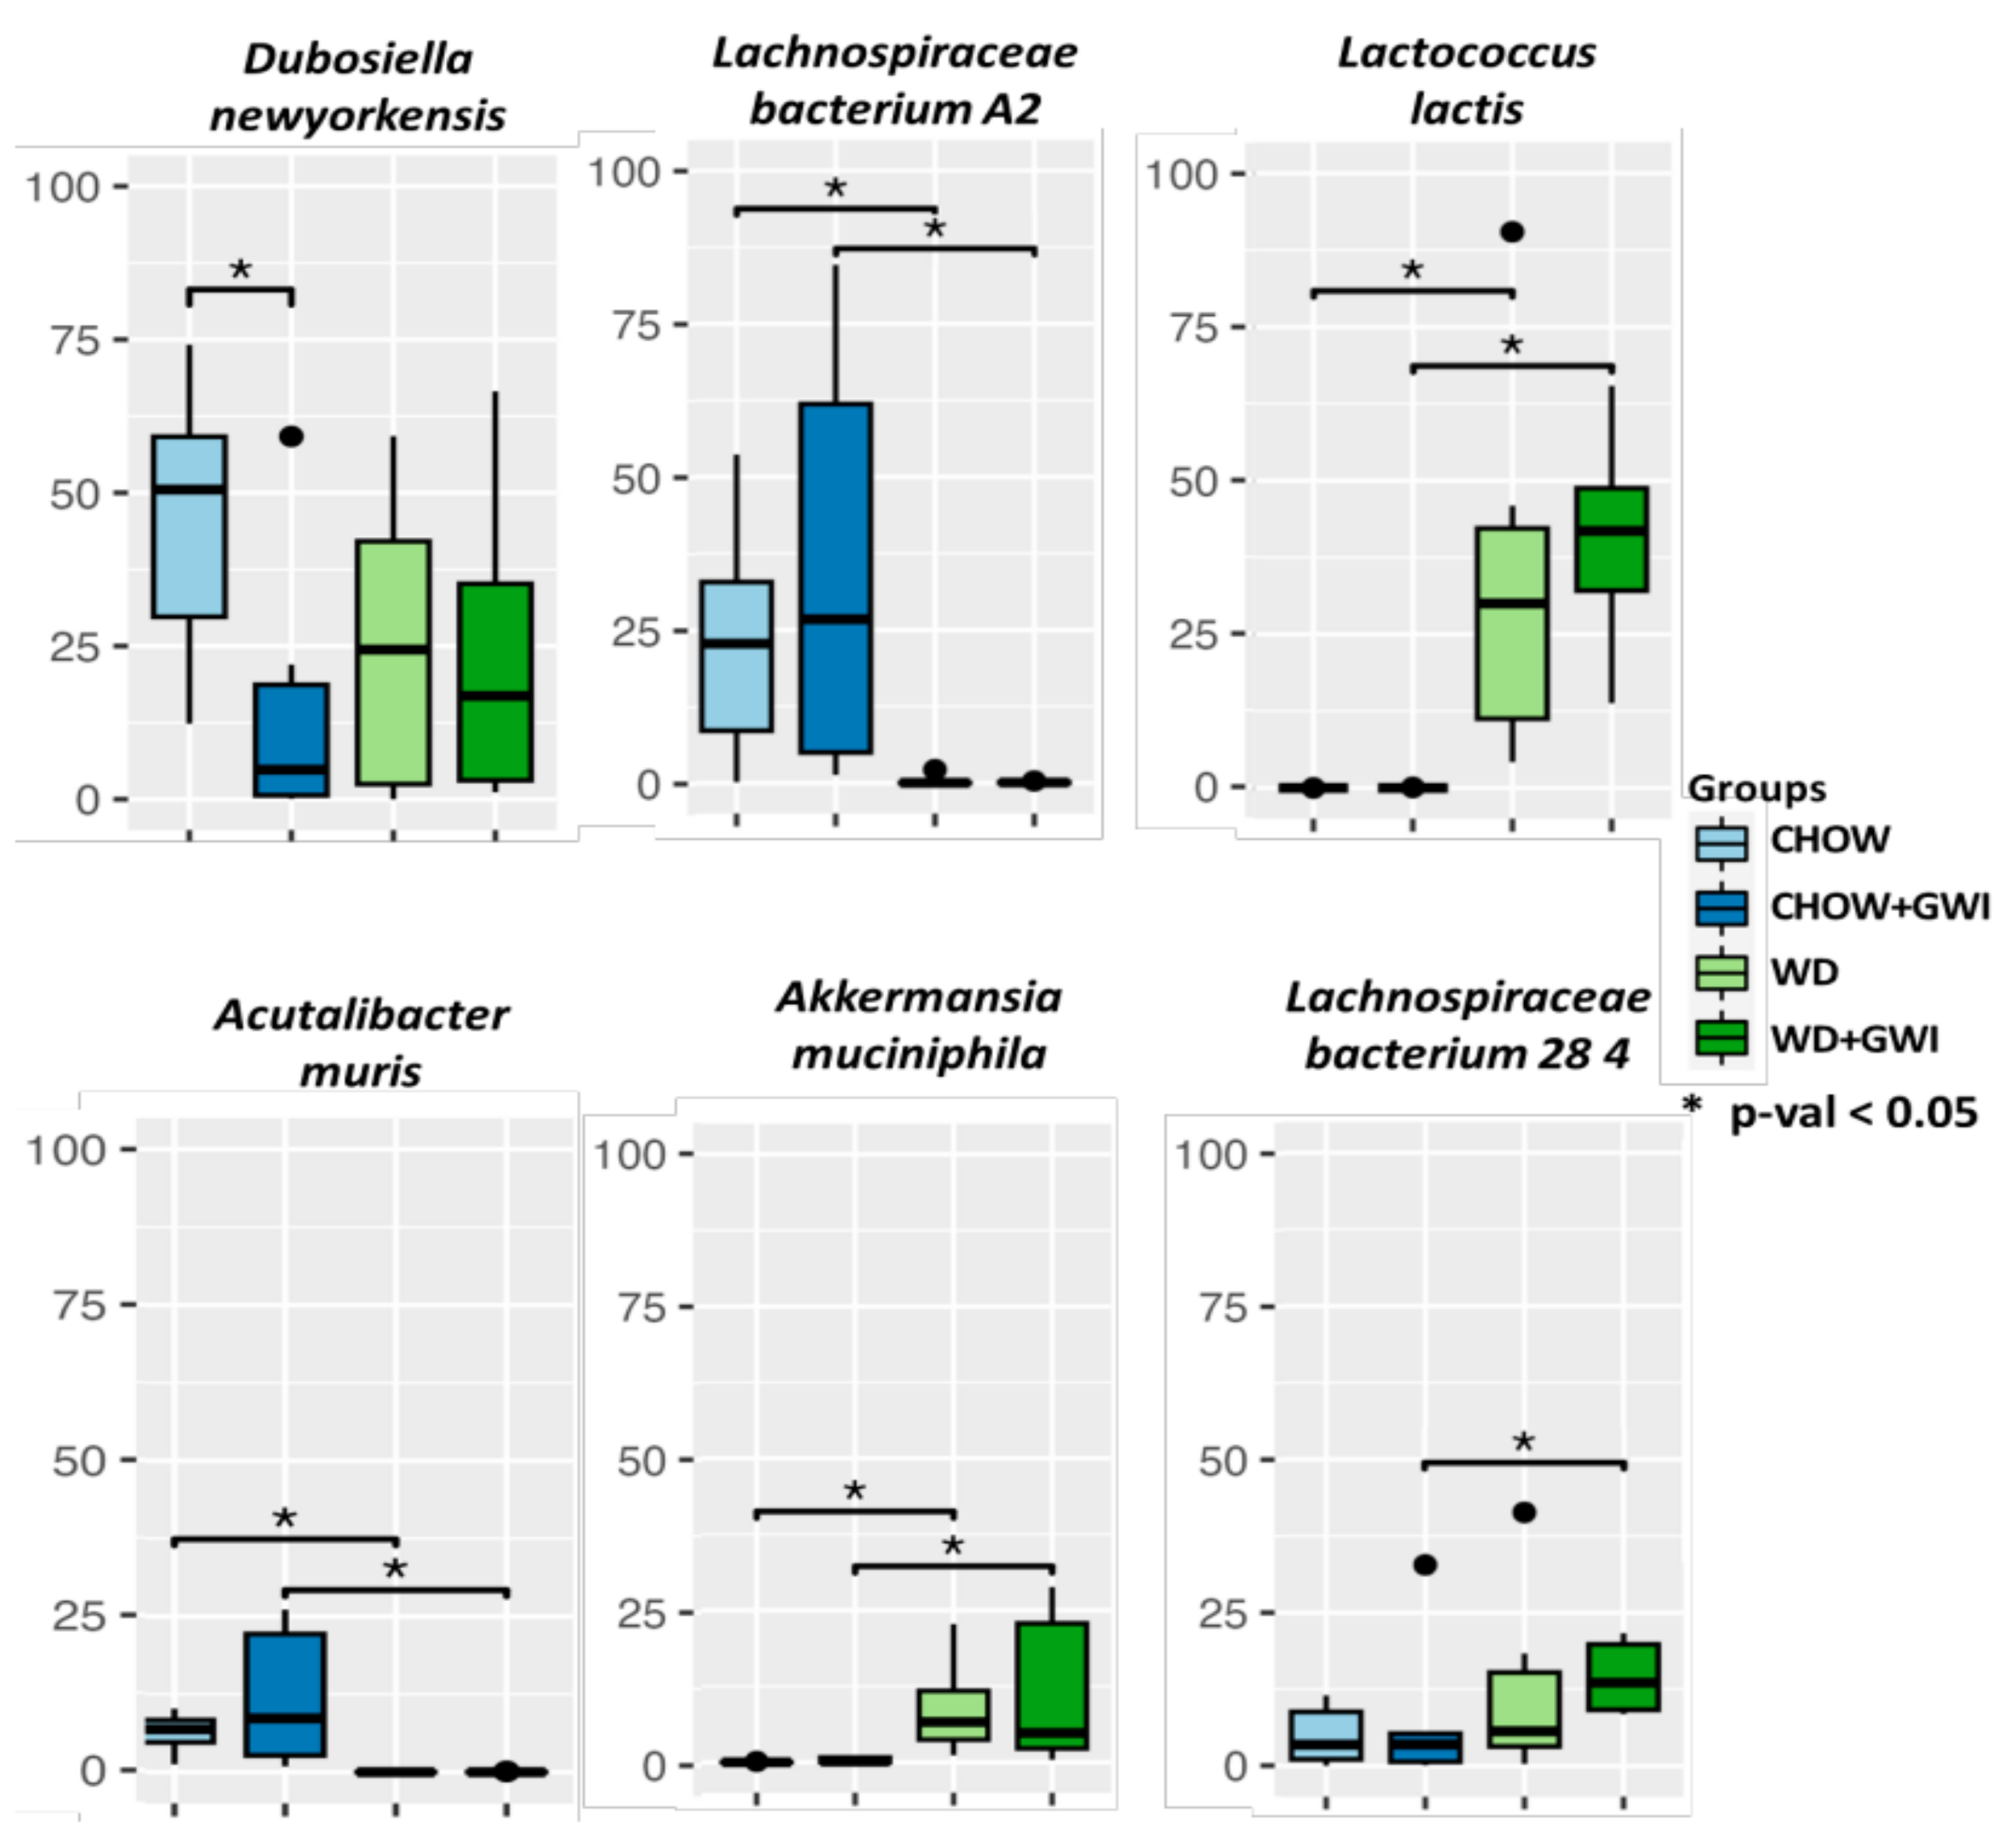
Abstract
:1. Introduction
2. Results
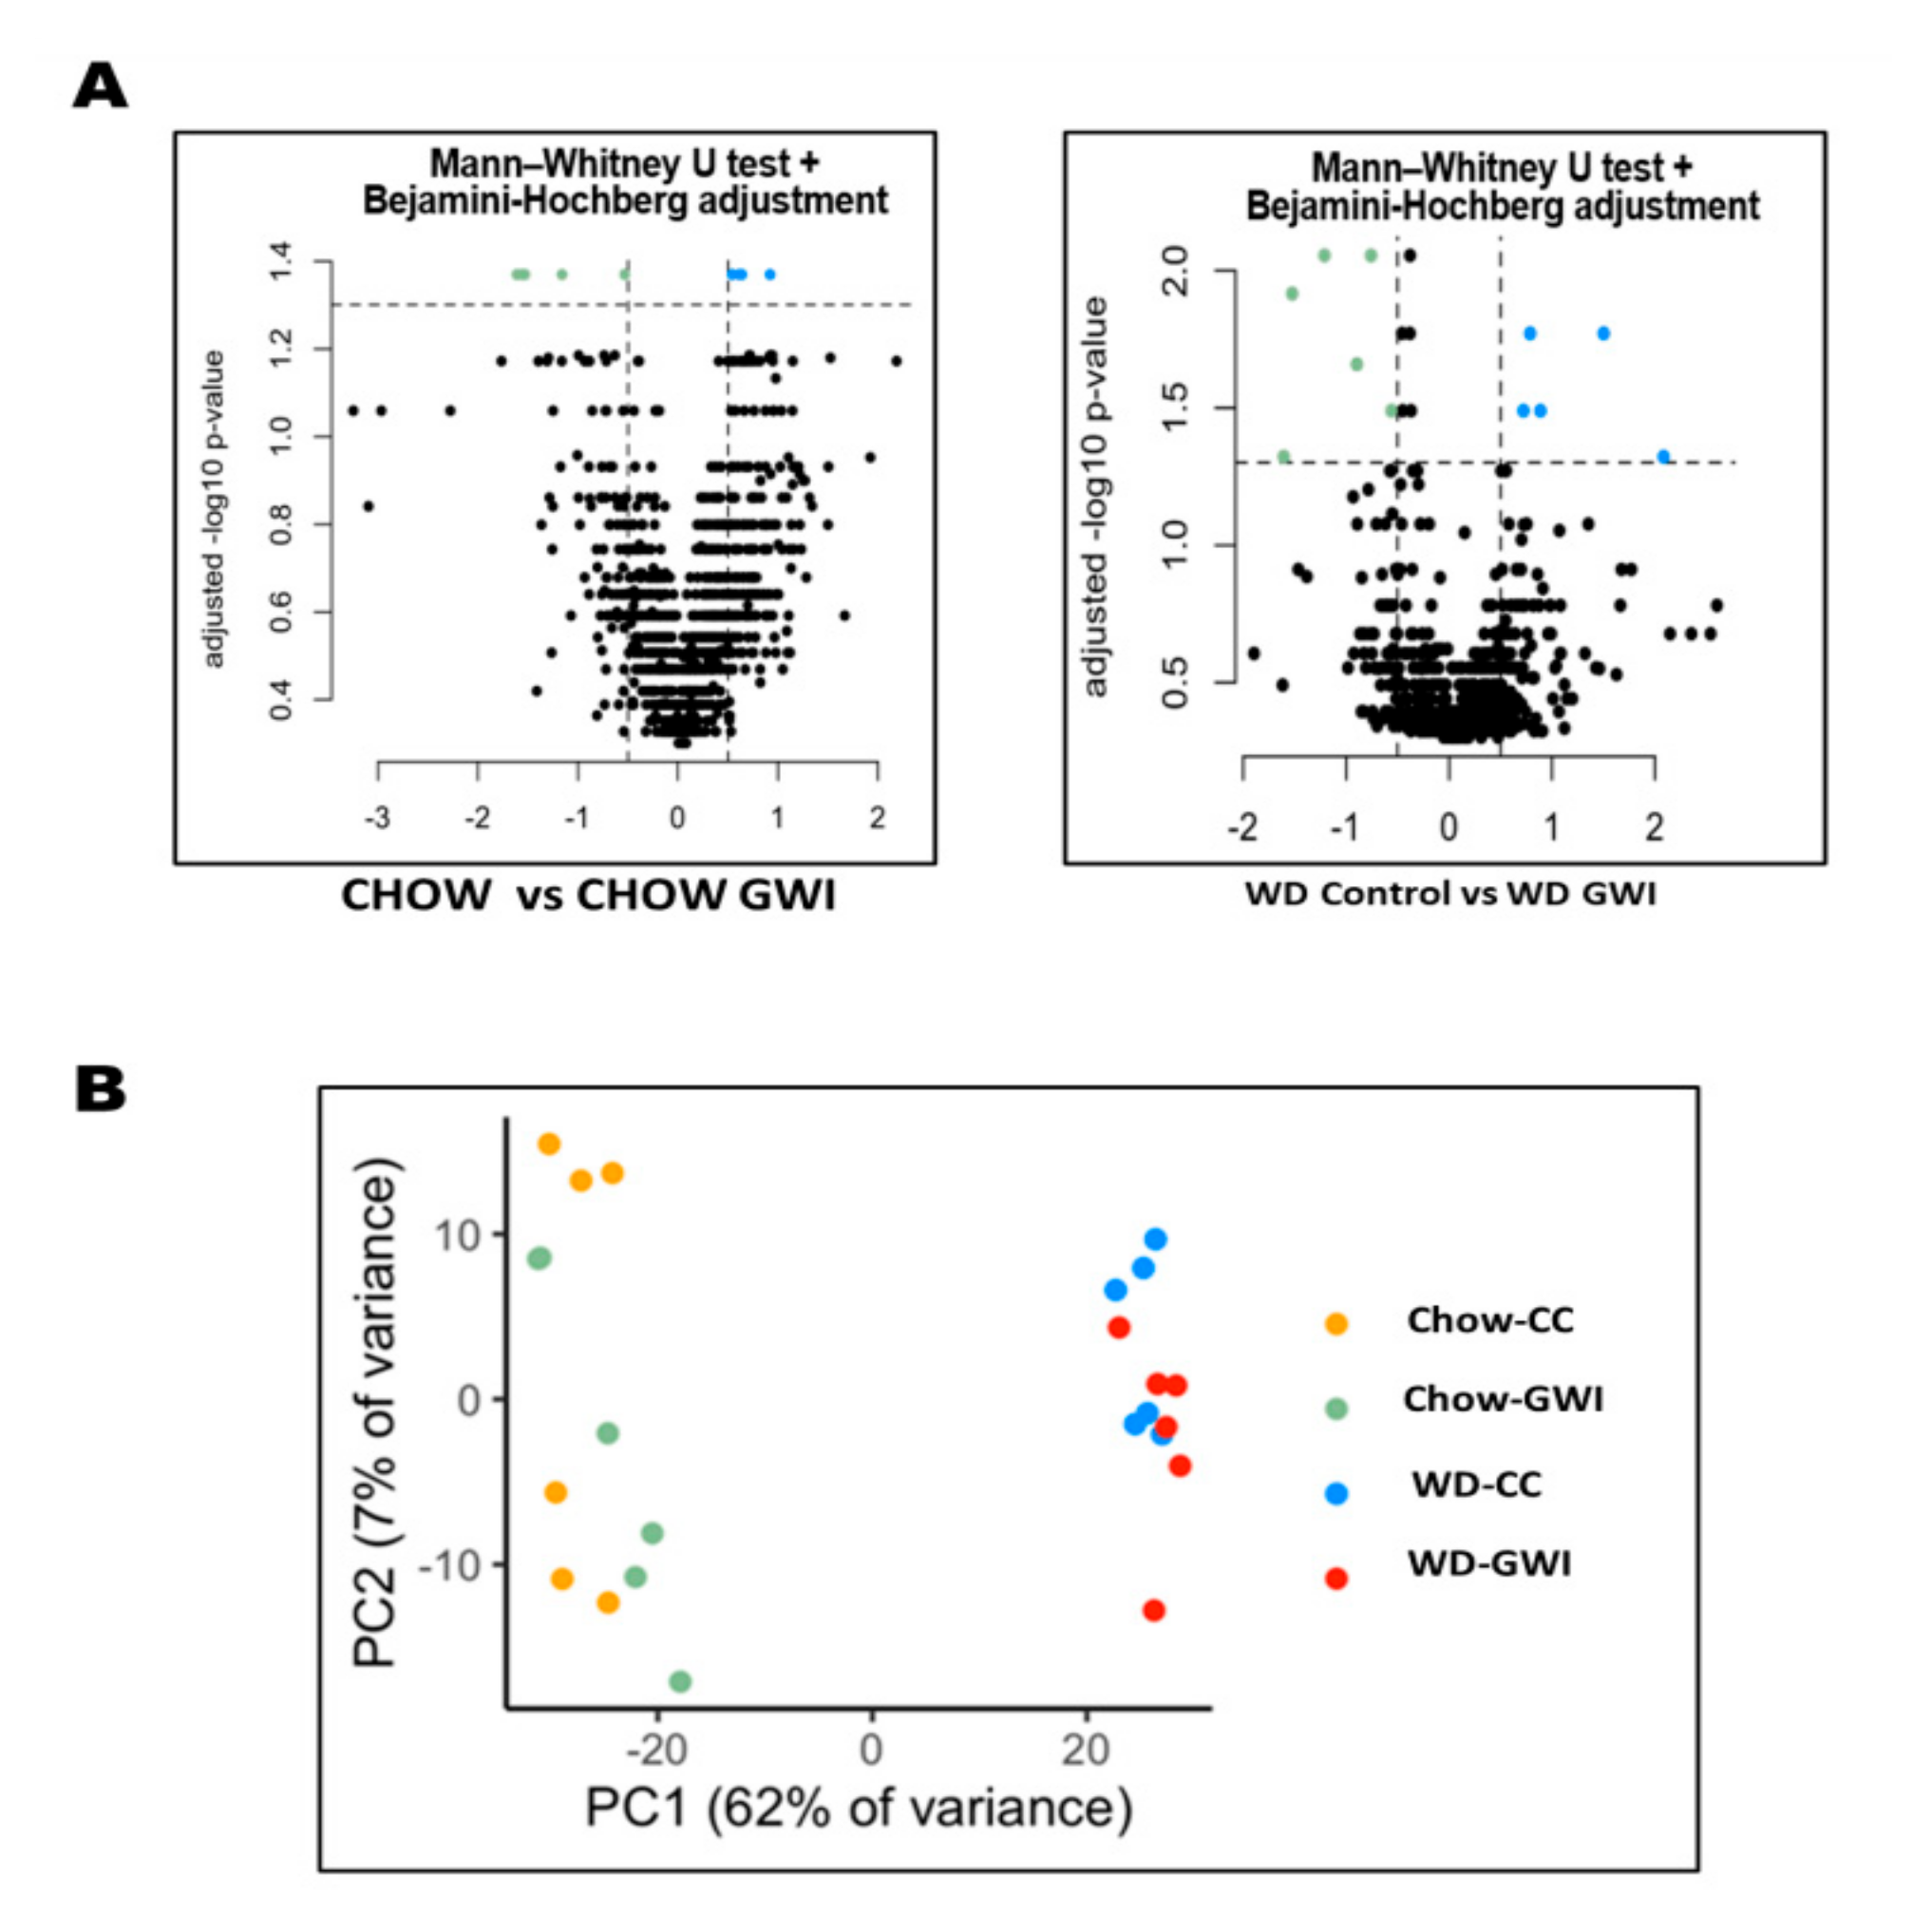
2.1. Western Diet Significantly Altered Gut Bacteriome Composition in Mice Exposed to GW Chemicals
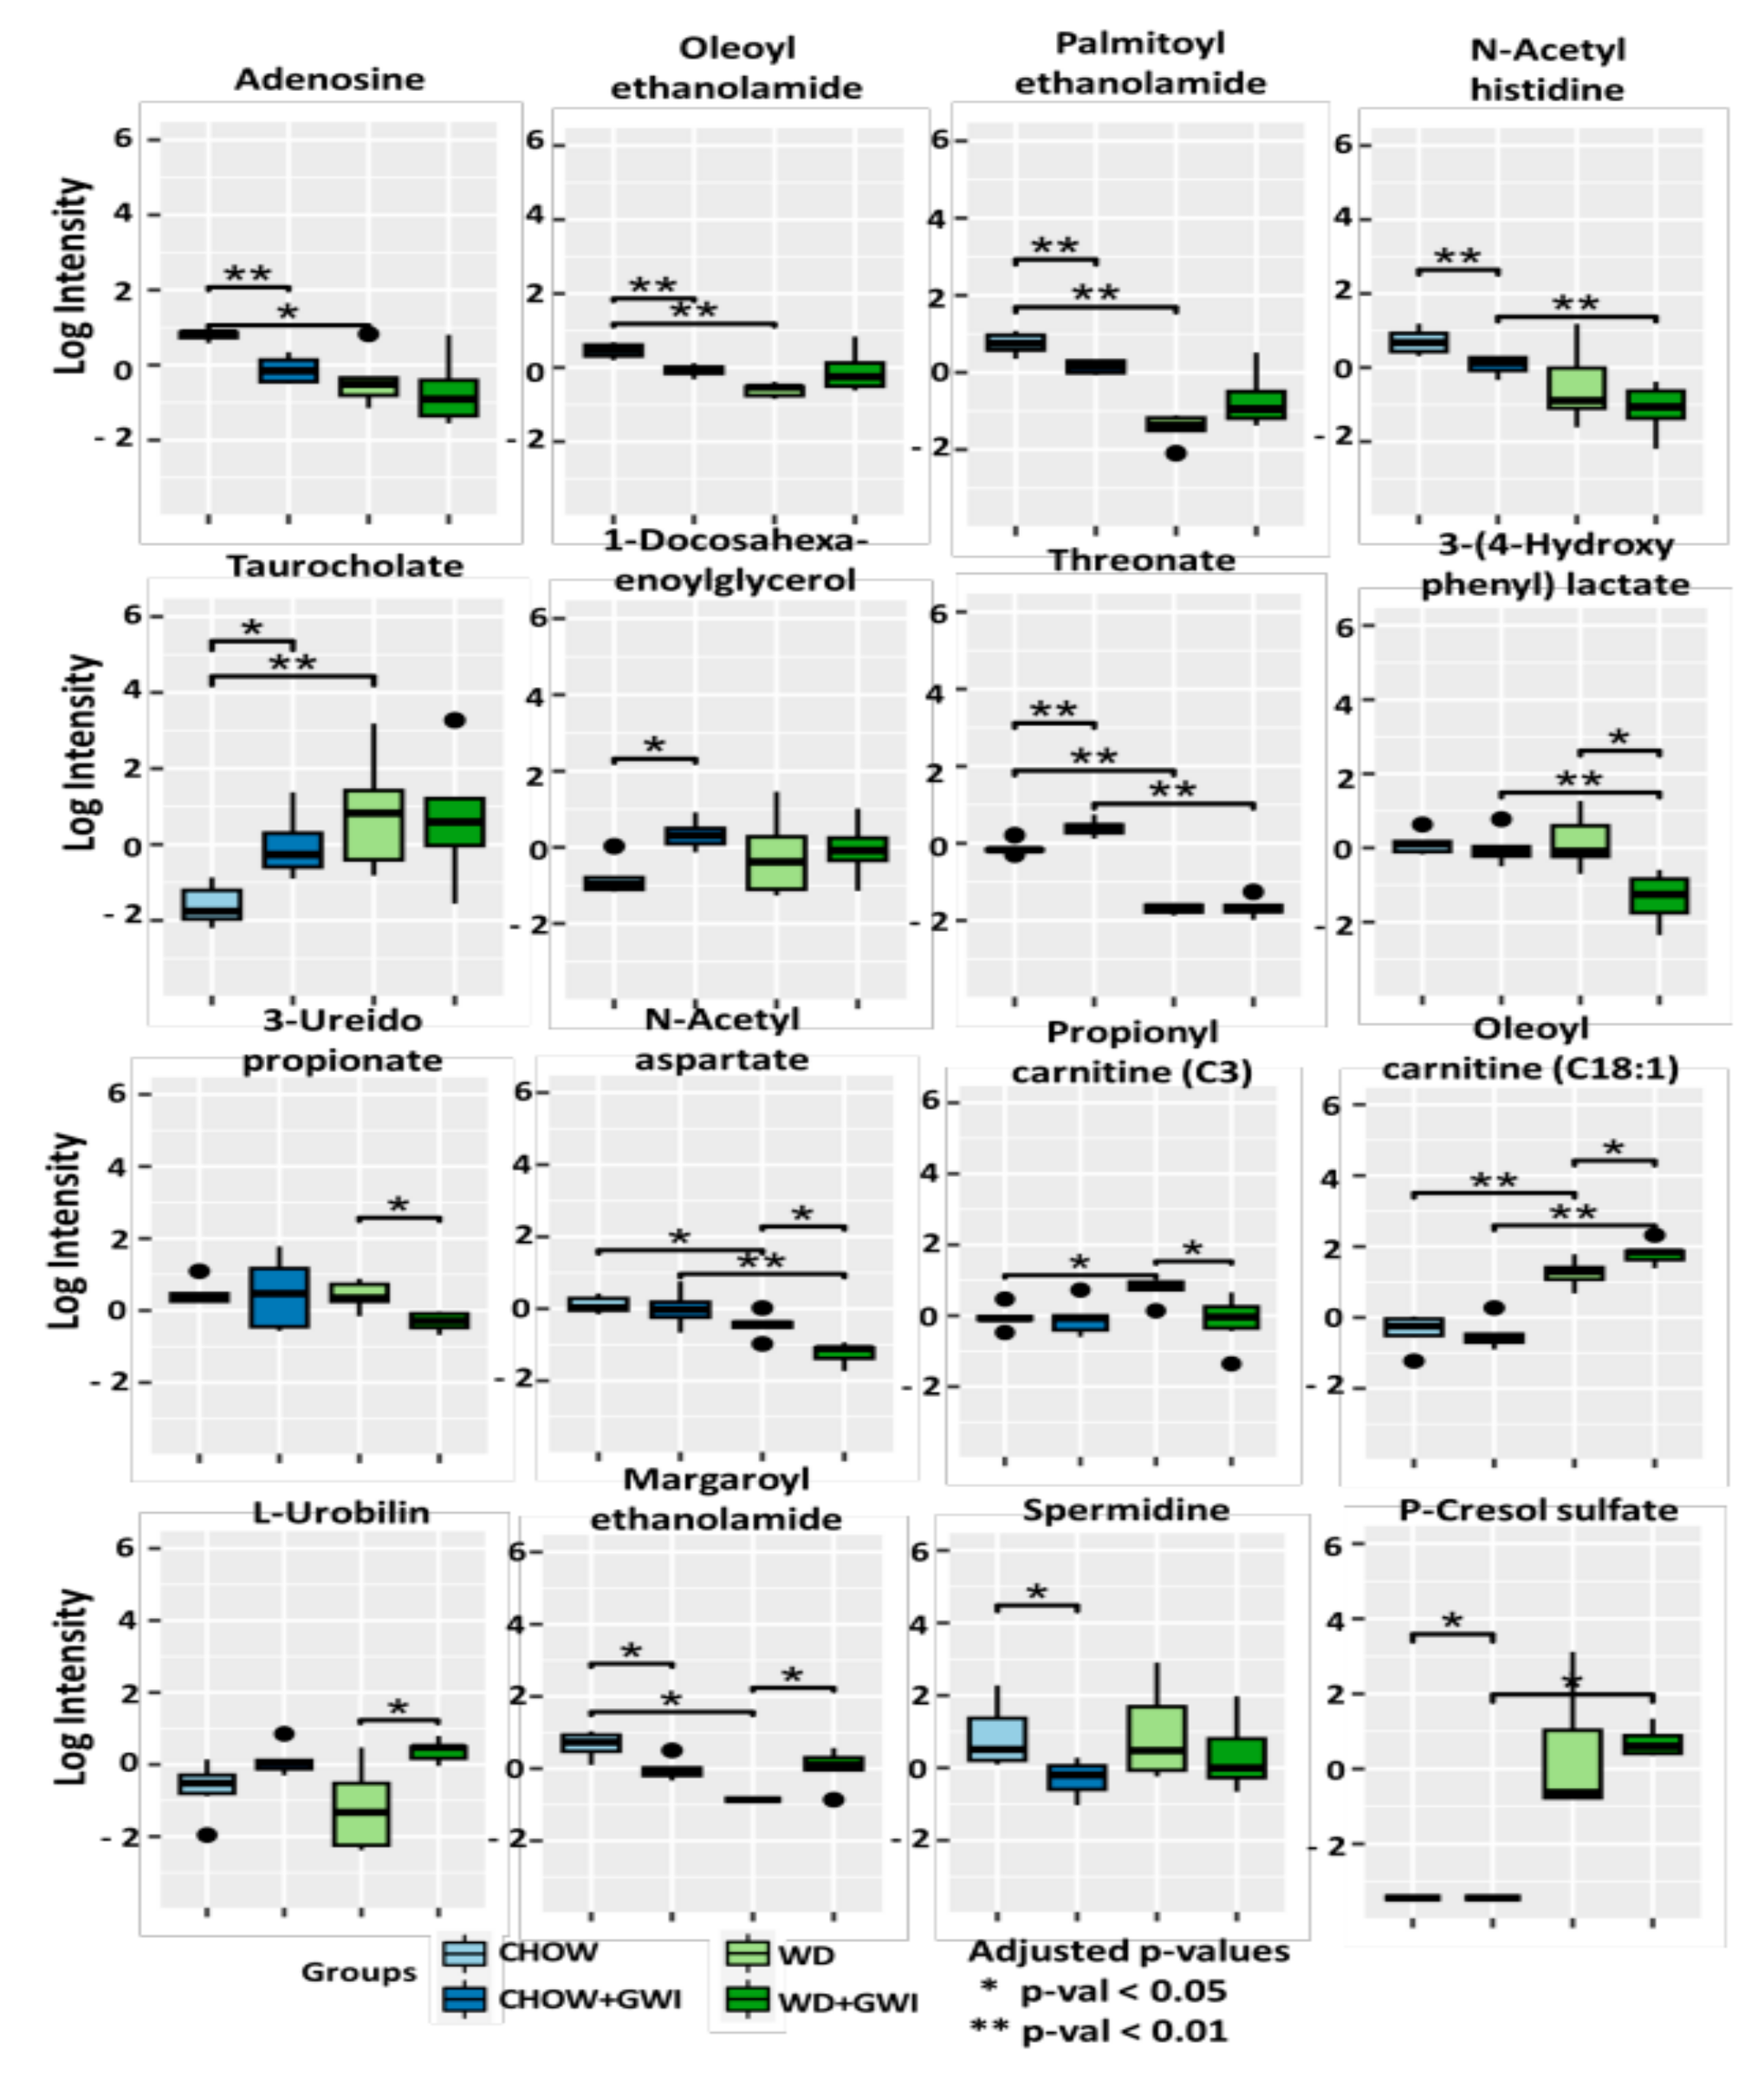
2.2. Fecal Metabolomic Analysis Showed Significantly Altered Metabolite Profile in Mice Exposed to GW Chemicals and Western Diet
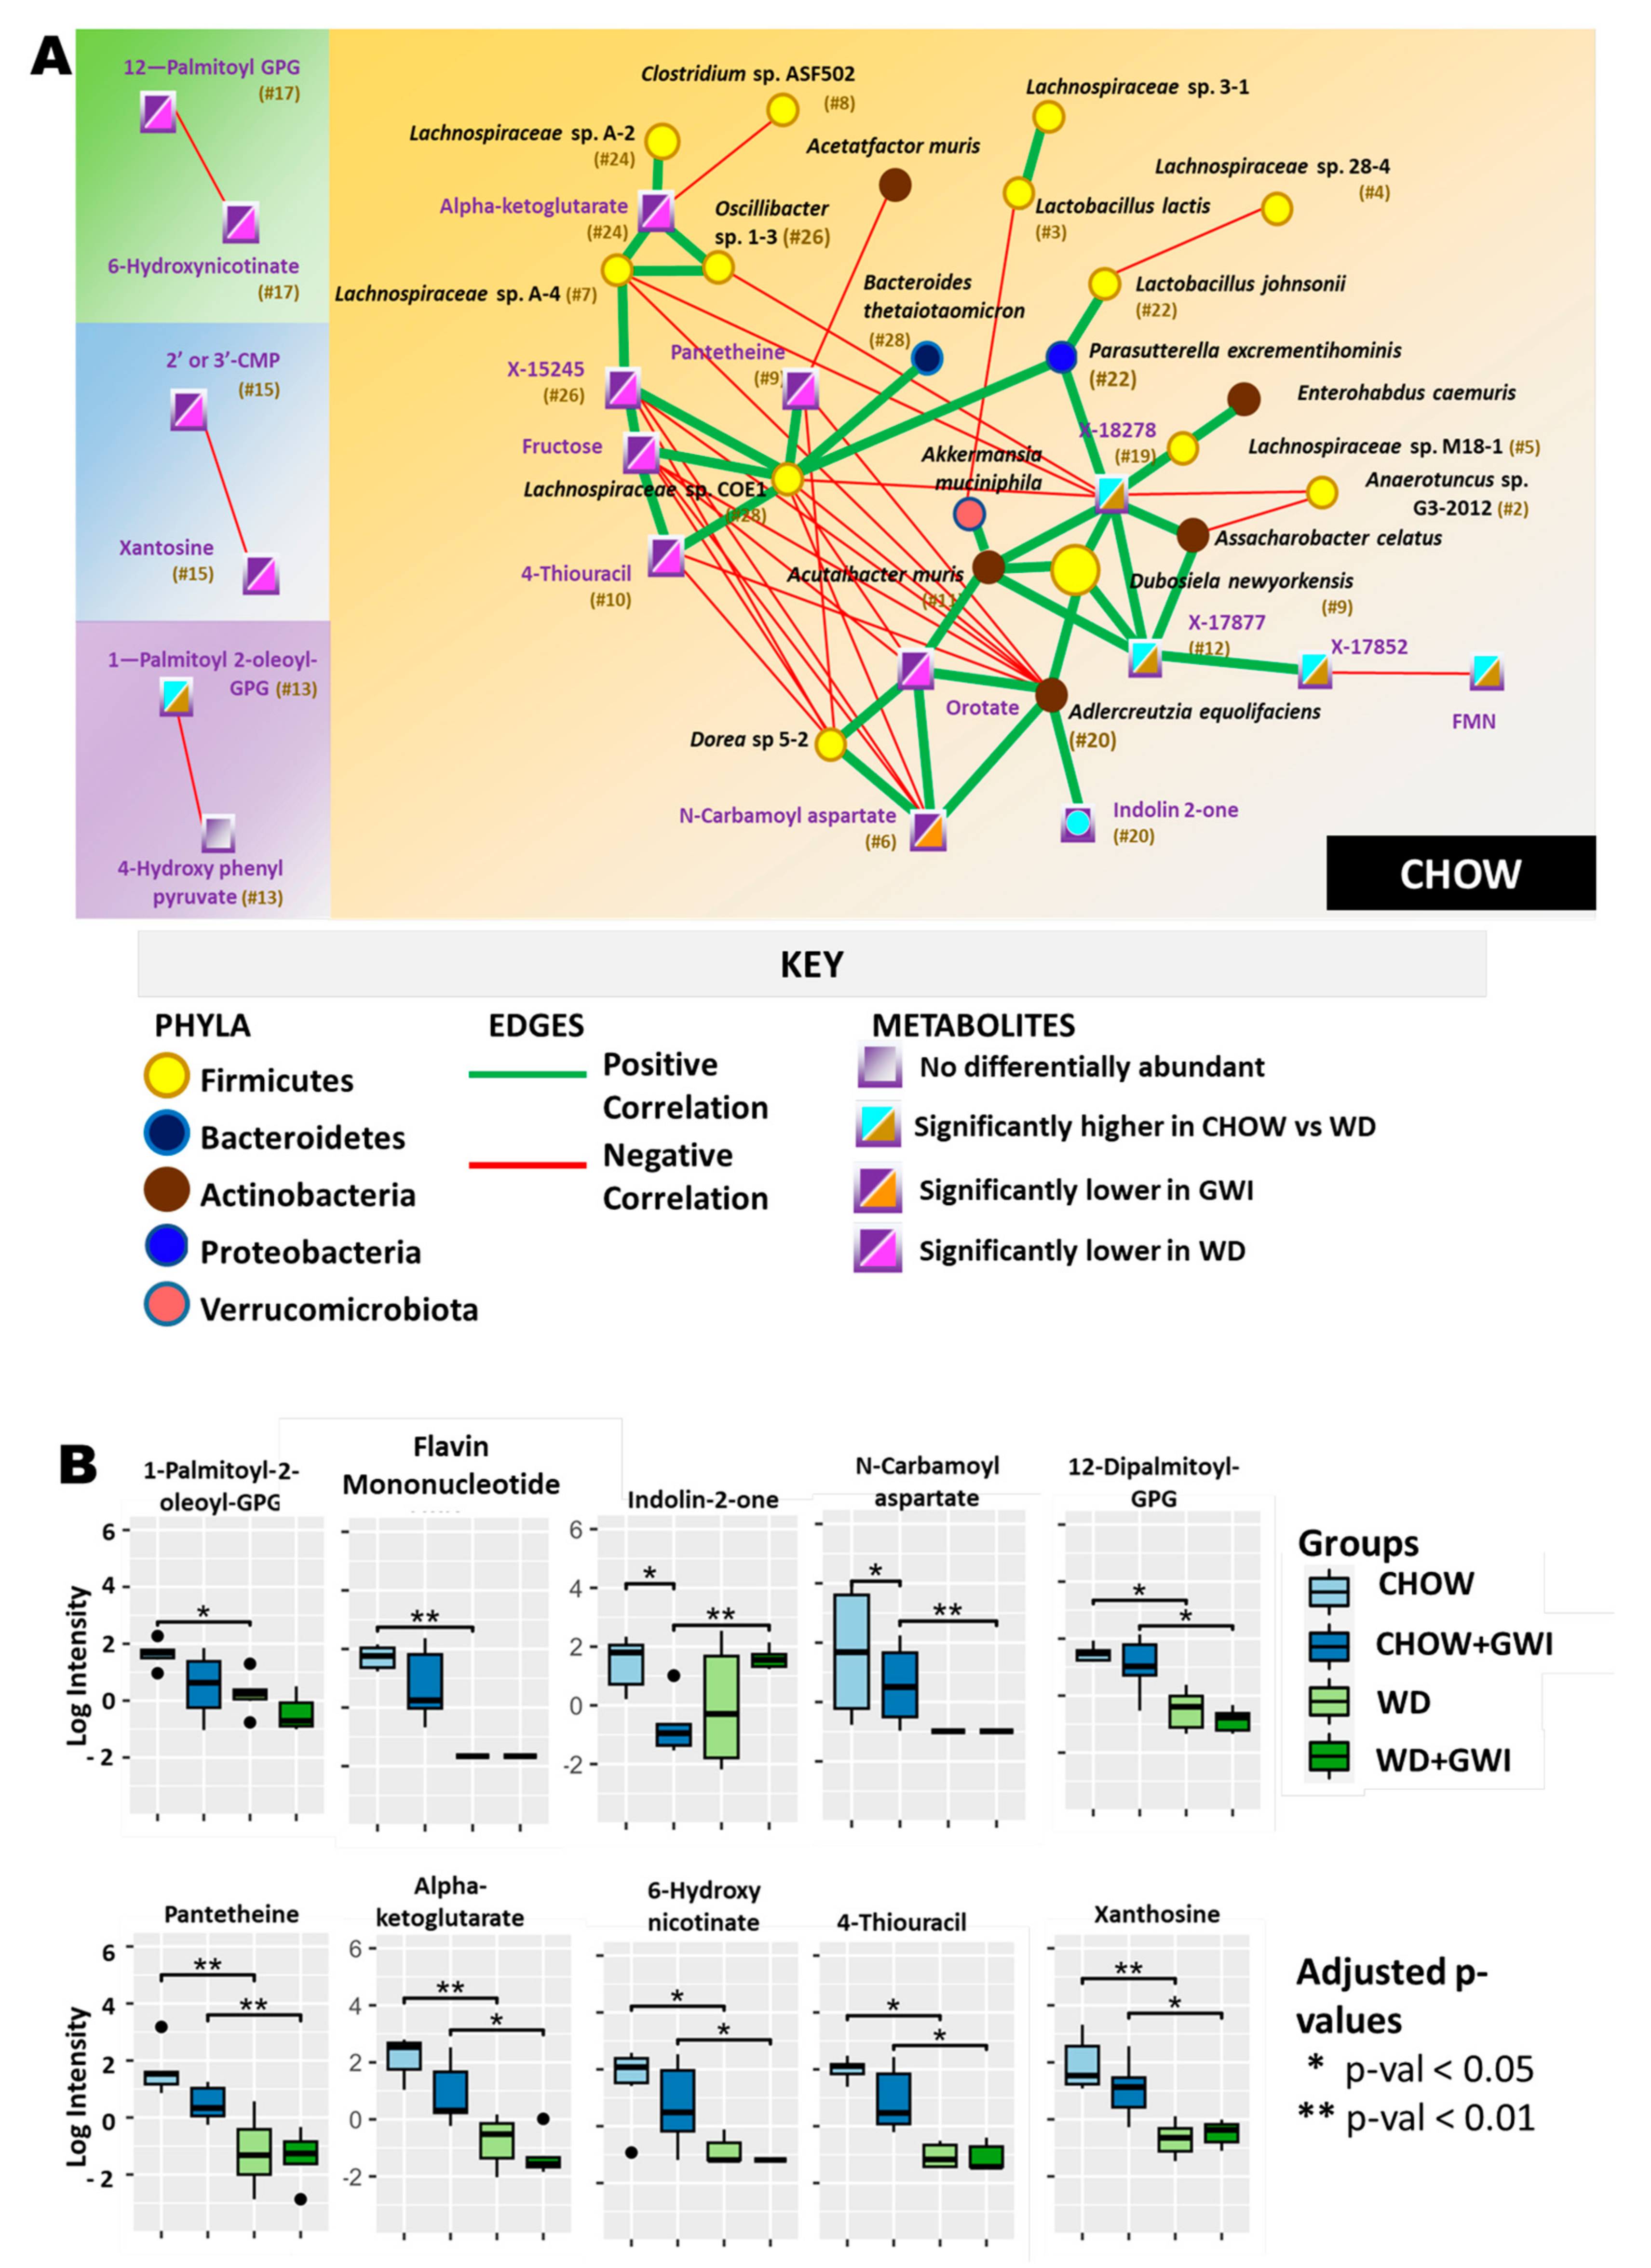
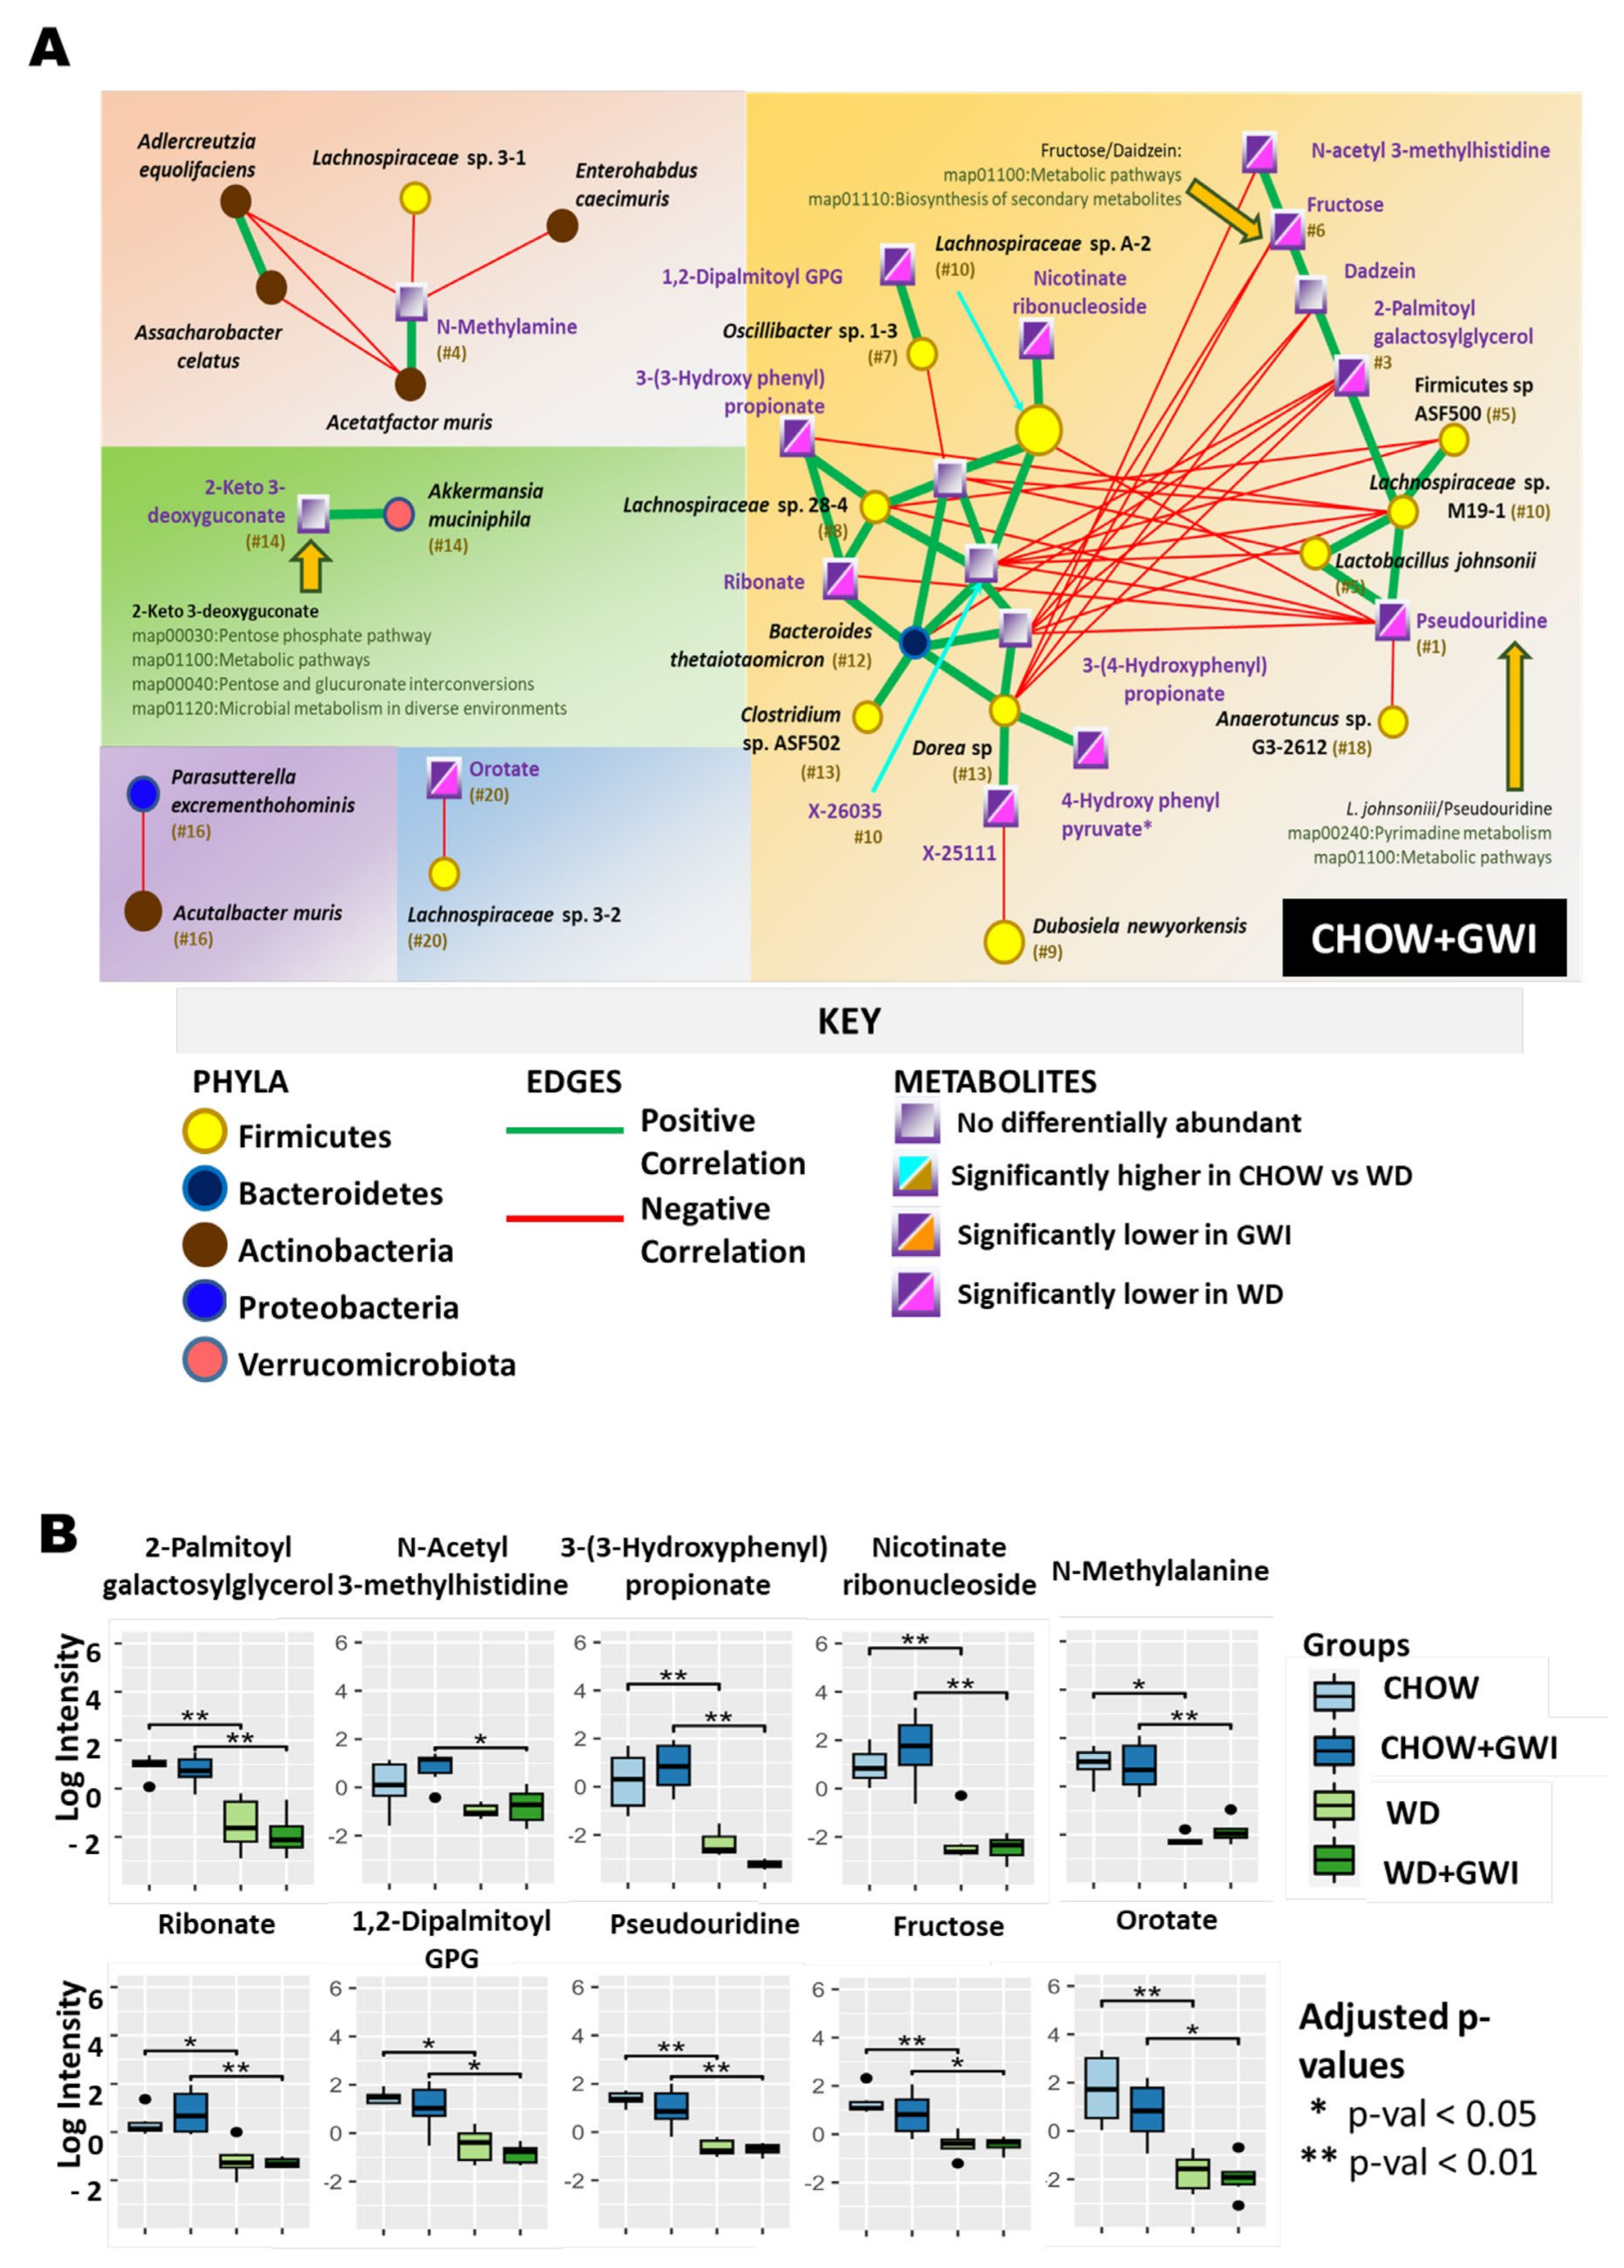
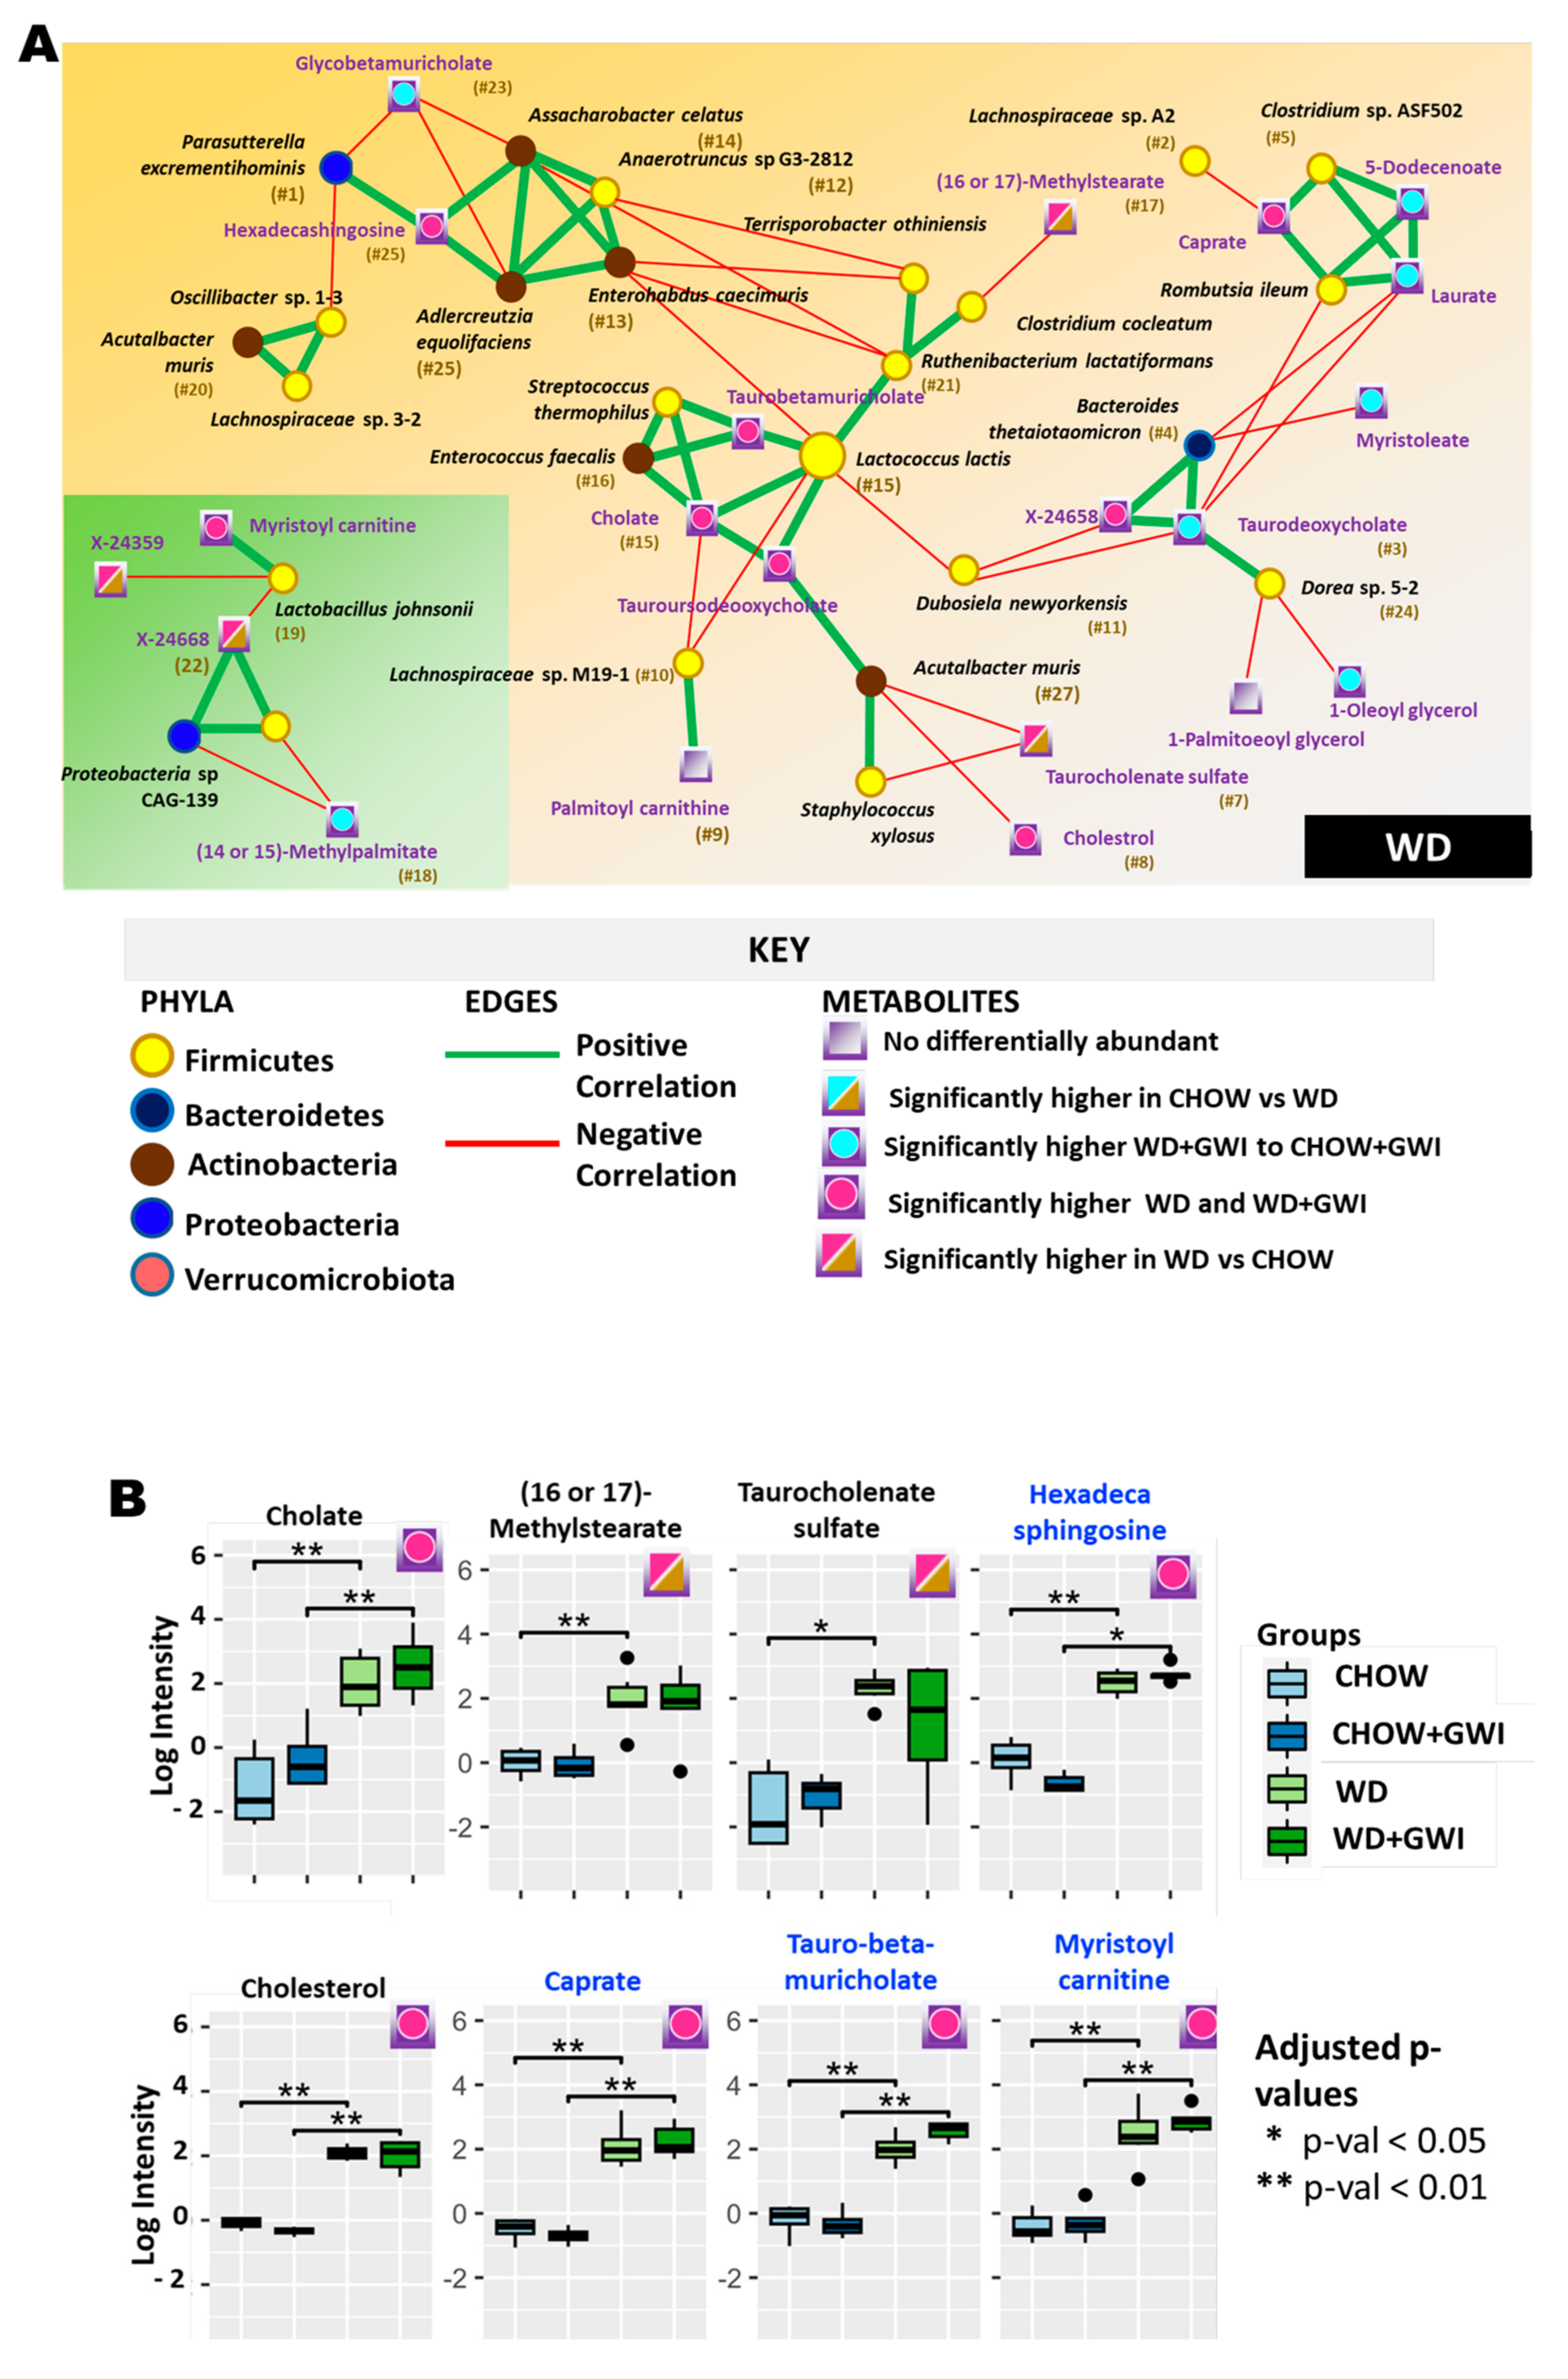
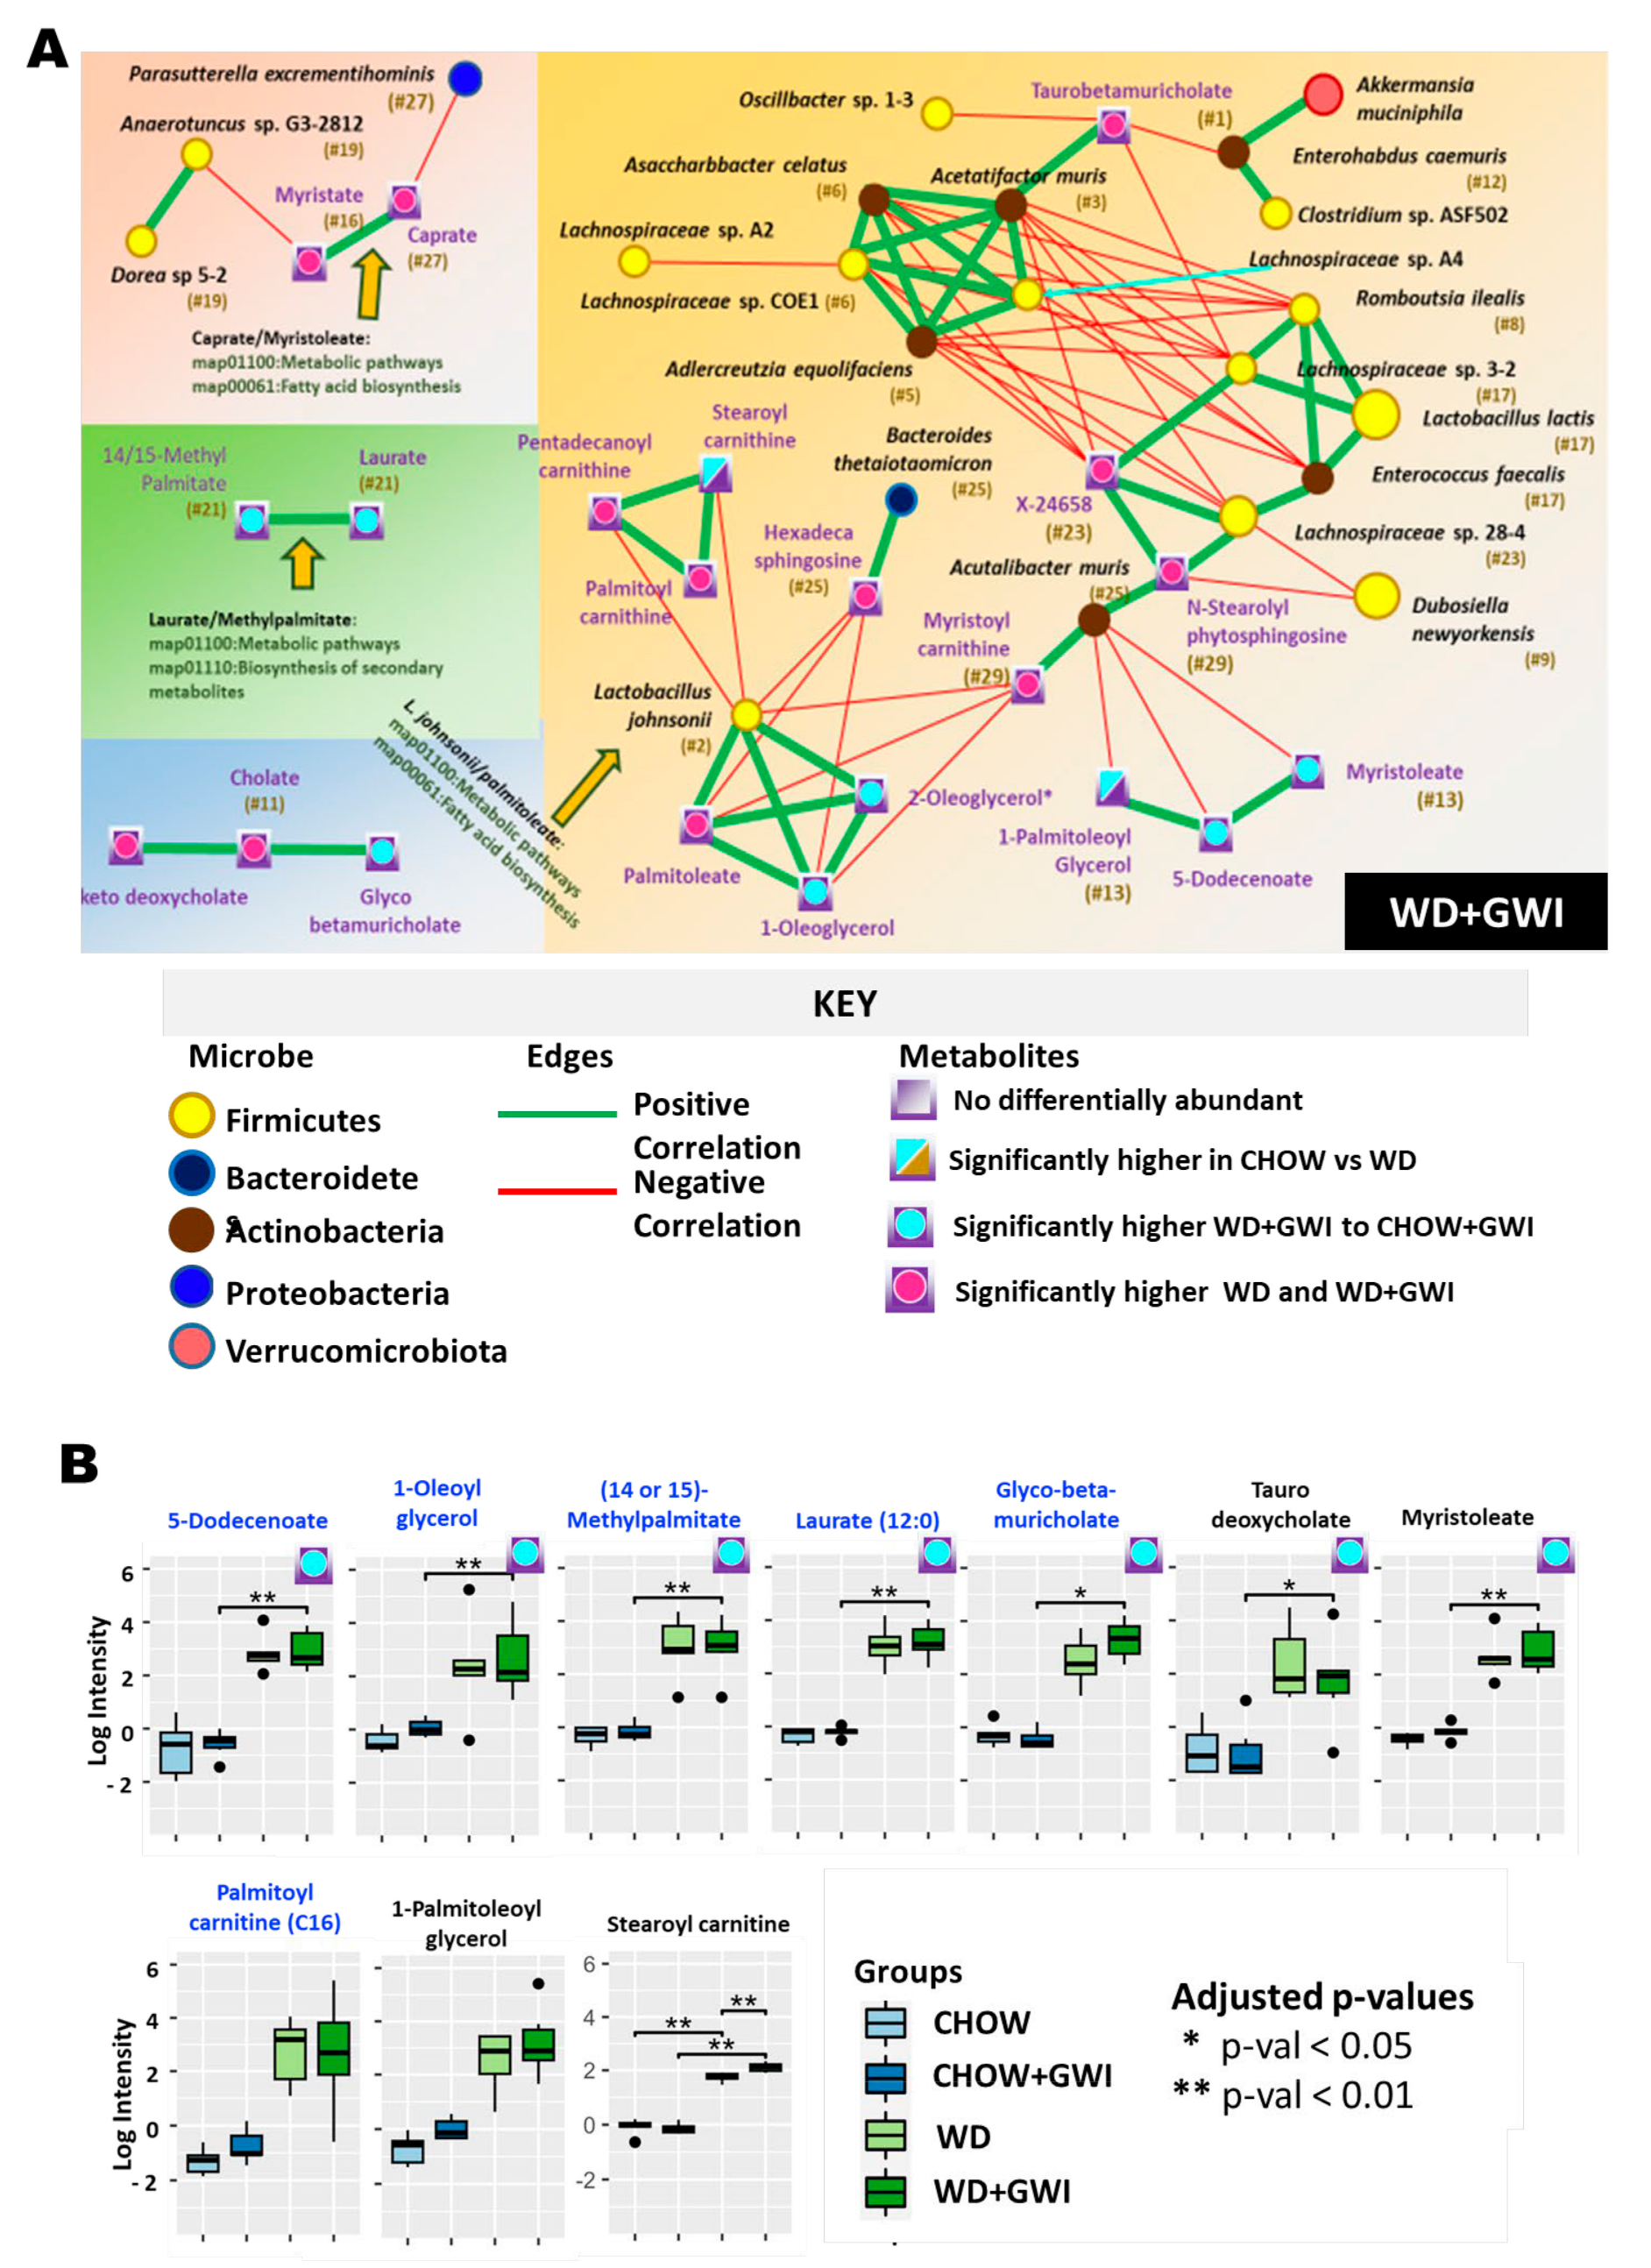
2.3. Association Study Showed That Altered Metabolites Were Correlated with Gut Bacterial Species
3. Discussion
4. Materials and Methods
4.1. Animals
4.2. Mouse Model of Gulf War Illness
4.3. Bacteriome Analysis
4.4. Metabolomics
4.5. Metabolomics Data Analysis
4.6. Statistical Analyses
Author Contributions
Funding
Institutional Review Board Statement
Informed Consent Statement
Data Availability Statement
Acknowledgments
Conflicts of Interest
References
- Coughlin, S.S.; Kang, H.K.; Mahan, C.M. Selected Health Conditions Among Overweight, Obese, and Non-Obese Veterans of the 1991 Gulf War: Results from a Survey Conducted in 2003–2005. Open Epidemiol. J. 2011, 4, 140–146. [Google Scholar] [CrossRef] [PubMed] [Green Version]
- Cohen, B.E.; Marmar, C.; Ren, L.; Bertenthal, D.; Seal, K.H. Association of cardiovascular risk factors with mental health diagnoses in Iraq and Afghanistan war veterans using VA health care. JAMA 2009, 302, 489–492. [Google Scholar] [CrossRef] [PubMed] [Green Version]
- Alhasson, F.; Das, S.; Seth, R.; Dattaroy, D.; Chandrashekaran, V.; Ryan, C.N.; Chan, L.S.; Testerman, T.; Burch, J.; Hofseth, L.J.; et al. Altered gut microbiome in a mouse model of Gulf War Illness causes neuroinflammation and intestinal injury via leaky gut and TLR4 activation. PLoS ONE 2017, 12, e0172914. [Google Scholar] [CrossRef] [Green Version]
- Bose, D.; Mondal, A.; Saha, P.; Kimono, D.; Sarkar, S.; Seth, R.K.; Janulewicz, P.; Sullivan, K.; Horner, R.; Klimas, N.; et al. TLR Antagonism by Sparstolonin B Alters Microbial Signature and Modulates Gastrointestinal and Neuronal Inflammation in Gulf War Illness Preclinical Model. Brain Sci. 2020, 10, 532. [Google Scholar] [CrossRef] [PubMed]
- Saha, P.; Skidmore, P.T.; Holland, L.A.; Mondal, A.; Bose, D.; Seth, R.K.; Sullivan, K.; Janulewicz, P.A.; Horner, R.; Klimas, N.; et al. Andrographolide Attenuates Gut-Brain-Axis Associated Pathology in Gulf War Illness by Modulating Bacteriome-Virome Associated Inflammation and Microglia-Neuron Proinflammatory Crosstalk. Brain Sci. 2021, 11, 905. [Google Scholar] [CrossRef]
- Bose, D.; Chatterjee, S.; Older, E.; Seth, R.; Janulewicz, P.; Saha, P.; Mondal, A.; Carlson, J.M.; Decho, A.W.; Sullivan, K.; et al. Host gut resistome in Gulf War chronic multisymptom illness correlates with persistent inflammation. Commun. Biol. 2022, 5, 552. [Google Scholar] [CrossRef]
- Kimono, D.; Bose, D.; Seth, R.K.; Mondal, A.; Saha, P.; Janulewicz, P.; Sullivan, K.; Lasley, S.; Horner, R.; Klimas, N.; et al. Host Akkermansia muciniphila Abundance Correlates With Gulf War Illness Symptom Persistence via NLRP3-Mediated Neuroinflammation and Decreased Brain-Derived Neurotrophic Factor. Neurosci. Insights 2020, 15, 2633105520942480. [Google Scholar] [CrossRef]
- Noecker, C.; Chiu, H.C.; McNally, C.P.; Borenstein, E. Defining and Evaluating Microbial Contributions to Metabolite Variation in Microbiome-Metabolome Association Studies. mSystems 2019, 4, e00579-e19. [Google Scholar] [CrossRef] [Green Version]
- Bose, D.; Saha, P.; Mondal, A.; Fanelli, B.; Seth, R.K.; Janulewicz, P.; Sullivan, K.; Lasley, S.; Horner, R.; Colwell, R.R.; et al. Obesity Worsens Gulf War Illness Symptom Persistence Pathology by Linking Altered Gut Microbiome Species to Long-Term Gastrointestinal, Hepatic, and Neuronal Inflammation in a Mouse Model. Nutrients 2020, 12, 2764. [Google Scholar] [CrossRef]
- De Filippis, F.; Pellegrini, N.; Vannini, L.; Jeffery, I.B.; La Storia, A.; Laghi LI Serrazanetti, D.; Di Cagno, R.; Ferrocino, I.; Lazzi, C. High-level adherence to a Mediterranean diet beneficially impacts the gut microbiota and associated metabolome. Gut 2016, 65, 1812–1821. [Google Scholar] [CrossRef]
- Wlodarska, M.; Luo, C.; Kolde, R.; d’Hennezel, E.; Annand, J.W.; Heim, C.E.; Krastel, P.; Schmitt, E.K.; Omar, A.S.; Creasey, E.A.; et al. Indoleacrylic Acid Produced by Commensal Peptostreptococcus Species Suppresses Inflammation. Cell Host Microbe 2017, 22, 25–37.e26. [Google Scholar] [CrossRef] [PubMed] [Green Version]
- Dumas, M.E.; Barton, R.H.; Toye, A.; Cloarec, O.; Blancher, C.; Rothwell, A.; Fearnside, J.; Tatoud, R.; Blanc, V.; Lindon, J.C.; et al. Metabolic profiling reveals a contribution of gut microbiota to fatty liver phenotype in insulin-resistant mice. Proc. Natl. Acad. Sci. USA 2006, 103, 12511–12516. [Google Scholar] [CrossRef] [PubMed] [Green Version]
- Hsiao, E.Y.; McBride, S.W.; Hsien, S.; Sharon, G.; Hyde, E.R.; McCue, T.; Codelli, J.A.; Chow, J.; Reisman, S.E.; Petrosino, J.F.; et al. Microbiota modulate behavioral and physiological abnormalities associated with neurodevelopmental disorders. Cell 2013, 155, 1451–1463. [Google Scholar] [CrossRef] [PubMed] [Green Version]
- Abdullah, L.; Evans, J.E.; Montague, H.; Reed, J.M.; Moser, A.; Crynen, G.; Gonzalez, A.; Zakirova, Z.; Ross, I.; Mullan, C.; et al. Chronic elevation of phosphocholine containing lipids in mice exposed to Gulf War agents pyridostigmine bromide and permethrin. Neurotoxicol. Teratol. 2013, 40, 74–84. [Google Scholar] [CrossRef]
- Orio, L.; Alen, F.; Pavon, F.J.; Serrano, A.; Garcia-Bueno, B. Oleoylethanolamide, Neuroinflammation, and Alcohol Abuse. Front. Mol. Neurosci. 2018, 11, 490. [Google Scholar] [CrossRef] [Green Version]
- Clayton, P.; Subah, S.; Venkatesh, R.; Hill, M.; Bogoda, N. Palmitoylethanolamide: A Potential Alternative to Cannabidiol. J. Diet. Suppl. 2021, 2022, 1–26. [Google Scholar] [CrossRef]
- Reiss, A.B.; Grossfeld, D.; Kasselman, L.J.; Renna, H.A.; Vernice, N.A.; Drewes, W.; Konig, J.; Carsons, S.E.; DeLeon, J. Adenosine and the Cardiovascular System. Am. J. Cardiovasc. Drugs 2019, 19, 449–464. [Google Scholar] [CrossRef]
- Rebholz, C.M.; Surapaneni, A.; Levey, A.S.; Sarnak, M.J.; Inker, L.A.; Appel, L.J.; Coresh, J.; Grams, M.E. The Serum Metabolome Identifies Biomarkers of Dietary Acid Load in 2 Studies of Adults with Chronic Kidney Disease. J. Nutr. 2019, 149, 578–585. [Google Scholar] [CrossRef]
- Löffler, M.; Carrey, E.A.; Zameitat, E. Orotic Acid, More Than Just an Intermediate of Pyrimidine de novo Synthesis. J. Genet. Genom. 2015, 42, 207–219. [Google Scholar] [CrossRef]
- Zhao, C.; Gammie, S.C. Glutamate, GABA, and glutamine are synchronously upregulated in the mouse lateral septum during the postpartum period. Brain Res. 2014, 1591, 53–62. [Google Scholar] [CrossRef] [Green Version]
- Pierzynowski, S.; Pierzynowska, K. Alpha-ketoglutarate, a key molecule involved in nitrogen circulation in both animals and plants, in the context of human gut microbiota and protein metabolism. Adv. Med. Sci. 2022, 67, 142–147. [Google Scholar] [CrossRef] [PubMed]
- Wei, H.; Gu, J.; Jiang, X.; Deng, N.; Wu, J.; Zou, L.; Zhu, Y.; Tan, B. Anxiety disturbs the blood plasma metabolome in acute coronary syndrome patients. Sci. Rep. 2021, 11, 12897. [Google Scholar] [CrossRef] [PubMed]
- Yu, B.; Tang, D.Z.; Li, S.Y.; Wu, Y.; Chen, M. Daidzein promotes proliferation and differentiation in osteoblastic OCT1 cells via activation of the BMP-2/Smads pathway. Pharmazie 2017, 72, 35–40. [Google Scholar] [CrossRef] [PubMed]
- Vazquez-Munoz, R.; Thompson, A.; Russell, J.T.; Sobue, T.; Zhou, Y.; Dongari-Bagtzoglou, A. Insights From the Lactobacillus johnsonii Genome Suggest the Production of Metabolites With Antibiofilm Activity Against the Pathobiont Candida albicans. Front. Microbiol. 2022, 13, 853762. [Google Scholar] [CrossRef] [PubMed]
- Vergnes, L.; Phan, J.; Strauss, M.; Tafuri, S.; Reue, K. Cholesterol and cholate components of an atherogenic diet induce distinct stages of hepatic inflammatory gene expression. J. Biol. Chem. 2003, 278, 42774–42784. [Google Scholar] [CrossRef] [Green Version]
- Frigolet, M.E.; Gutierrez-Aguilar, R. The Role of the Novel Lipokine Palmitoleic Acid in Health and Disease. Adv. Nutr. 2017, 8, 173S–181S. [Google Scholar] [CrossRef] [Green Version]
- Marc, M.A.; Jastrzab, R.; Mytych, J. Does the Gut Microbial Metabolome Really Matter? The Connection between GUT Metabolome and Neurological Disorders. Nutrients 2022, 14, 3967. [Google Scholar] [CrossRef]
- Chatterjee, S.; Bose, D.; Seth, R. Host gut microbiome and potential therapeutics in Gulf War Illness: A short review. Life Sci. 2021, 280, 119717. [Google Scholar] [CrossRef]
- Chen, Z.; Li, Z.; Li, H.; Jiang, Y. Metabolomics: A promising diagnostic and therapeutic implement for breast cancer. Onco. Targets Ther. 2019, 12, 6797–6811. [Google Scholar] [CrossRef] [Green Version]
- Cook, D.P.; Gysemans, C.; Mathieu, C. Lactococcus lactis As a Versatile Vehicle for Tolerogenic Immunotherapy. Front. Immunol. 2017, 8, 1961. [Google Scholar] [CrossRef] [Green Version]
- Kleemann, R.; Verschuren, L.; van Erk, M.J.; Nikolsky, Y.; Cnubben, N.H.; Verheij, E.R.; Smilde, A.K.; Hendriks, H.F.; Zadelaar, S.; Smith, G.J.; et al. Atherosclerosis and liver inflammation induced by increased dietary cholesterol intake: A combined transcriptomics and metabolomics analysis. Genome Biol. 2007, 8, R200. [Google Scholar] [CrossRef] [PubMed] [Green Version]
- Sayin, S.I.; Wahlström, A.; Felin, J.; Jäntti, S.; Marschall, H.U.; Bamberg, K.; Angelin, B.; Hyötyläinen, T.; Orešič, M.; Bäckhed, F. Gut microbiota regulates bile acid metabolism by reducing the levels of tauro-beta-muricholic acid, a naturally occurring FXR antagonist. Cell Metab. 2013, 17, 225–235. [Google Scholar] [CrossRef] [PubMed] [Green Version]
- Ueyama, J.; Hayashi, M.; Hirayama, M.; Nishiwaki, H.; Ito, M.; Saito, I.; Tsuboi, Y.; Isobe, T.; Ohno, K. Effects of Pesticide Intake on Gut Microbiota and Metabolites in Healthy Adults. Int. J. Environ. Res. Public Health 2022, 20, 213. [Google Scholar] [CrossRef] [PubMed]
- Orio, L.; Javier Pavon, F.; Blanco, E.; Serrano, A.; Araos, P.; Pedraz, M.; Rivera, P.; Calado, M.; Suárez, J.; Rodriguez de Fonseca, F. Lipid transmitter signaling as a new target for treatment of cocaine addiction: New roles for acylethanolamides and lysophosphatidic acid. Curr. Pharm. Des. 2013, 19, 7036–7049. [Google Scholar] [CrossRef] [PubMed]
- Takeuchi KProstaglandin, E.P. Receptors and their roles in mucosal protection and ulcer healing in the gastrointestinal tract. Adv. Clin. Chem. 2010, 51, 121–144. [Google Scholar] [CrossRef]
- Dueland, S.; Drisko, J.; Graf, L.; Machleder, D.; Lusis, A.J.; Davis, R.A. Effect of dietary cholesterol and taurocholate on cholesterol 7 alpha-hydroxylase and hepatic LDL receptors in inbred mice. J. Lipid. Res. 1993, 34, 923–931. [Google Scholar] [CrossRef]
- Escolà-Gil, J.C.; Llaverias, G.; Julve, J.; Jauhiainen, M.; Méndez-González, J.; Blanco-Vaca, F. The cholesterol content of Western diets plays a major role in the paradoxical increase in high-density lipoprotein cholesterol and upregulates the macrophage reverse cholesterol transport pathway. Arterioscler. Thromb. Vasc. Biol. 2011, 31, 2493–2499. [Google Scholar] [CrossRef] [Green Version]
- Kölker, S.; Okun, J.G.; Hörster, F.; Assmann, B.; Ahlemeyer, B.; Kohlmüller, D.; Exner-Camps, S.; Mayatepek, E.; Krieglstein, J.; Hoffmann, G.F. 3-Ureidopropionate contributes to the neuropathology of 3-ureidopropionase deficiency and severe propionic aciduria: A hypothesis. J. Neurosci. Res. 2001, 66, 666–673. [Google Scholar] [CrossRef]
- Hozyasz, K.K.; Oltarzewski, M.; Lugowska, I.; Szymanski, M.; Surowiec, Z. Whole blood propionylcarnitine in newborns with orofacial cleft. Matern. Child Nutr. 2011, 7, 100–103. [Google Scholar] [CrossRef]
- Wan, X.; Zhou, C.; Kang, X.; Hu, D.; Xue, W.; Li, X.; Bao, H.; Peng, A. Metabolic Profiling of Amino Acids Associated with Mortality in Patients with Acute Paraquat Poisoning. Med. Sci. Monit. 2018, 24, 1397–1407. [Google Scholar] [CrossRef]
- Moffett, J.R.; Arun, P.; Ariyannur, P.S.; Namboodiri, A.M. N-Acetylaspartate reductions in brain injury: Impact on post-injury neuroenergetics, lipid synthesis, and protein acetylation. Front. Neuroenergetics 2013, 5, 11. [Google Scholar] [CrossRef] [PubMed] [Green Version]
- Gustafsson, B.E.; Lanke, L.S. Bilirubin and urobilins in germfree, ex-germfree, and conventional rats. J. Exp. Med. 1960, 112, 975–981. [Google Scholar] [CrossRef] [PubMed] [Green Version]
- Binder, L.; Smith, D.; Kupka, T.; Nelson, B.; Glass, B.; Wainscott, M.; Haynes, J. Failure of prediction of liver function test abnormalities with the urine urobilinogen and urine bilirubin assays. Arch. Pathol. Lab. Med. 1989, 113, 73–76. [Google Scholar] [PubMed]
- Shapiro, S.E.; Lasarev, M.R.; McCauley, L. Factor analysis of Gulf War illness: What does it add to our understanding of possible health effects of deployment? Am. J. Epidemiol. 2002, 156, 578–585. [Google Scholar] [CrossRef] [PubMed]
- Falvo, M.J.; Chen, Y.; Klein, J.C.; Ndirangu, D.; Condon, M.R. Abnormal rheological properties of red blood cells as a potential marker of Gulf War Illness: A preliminary study. Clin. Hemorheol. Microcirc. 2018, 68, 361–370. [Google Scholar] [CrossRef]
- Bell, F.P. Inhibition of adenine nucleotide translocase by oleoylcarnitine, oleoylcoa and oleate in isolated arterial mitochondria. Atherosclerosis 1980, 37, 21–32. [Google Scholar] [CrossRef]
- Tevzadze, G.; Barbakadze, T.; Kvergelidze, E.; Zhuravliova, E.; Shanshiashvili, L.; Mikeladze, D. Gut neurotoxin p-cresol induces brain-derived neurotrophic factor secretion and increases the expression of neurofilament subunits in PC-12 cells. AIMS Neurosci. 2022, 9, 12–23. [Google Scholar] [CrossRef]
- Foster, D.W. The role of the carnitine system in human metabolism. Ann. NY Acad. Sci. 2004, 1033, 1–16. [Google Scholar] [CrossRef]
- Friedman, J.; Alm, E.J. Inferring correlation networks from genomic survey data. PLoS Comput. Biol. 2012, 8, e1002687. [Google Scholar] [CrossRef] [Green Version]
- Fernandez, M.; Riveros, J.D.; Campos, M.; Mathee, K.; Narasimhan, G. Microbial “social networks”. BMC Genom. 2015, 11 (Suppl. 16), S6. [Google Scholar] [CrossRef] [PubMed] [Green Version]
- Faust, K.; Sathirapongsasuti, J.F.; Izard, J.; Segata, N.; Gevers, D.; Raes, J.; Huttenhower, C. Microbial co-occurrence relationships in the human microbiome. PLoS Comput. Biol. 2012, 8, e1002606. [Google Scholar] [CrossRef] [PubMed]


Disclaimer/Publisher’s Note: The statements, opinions and data contained in all publications are solely those of the individual author(s) and contributor(s) and not of MDPI and/or the editor(s). MDPI and/or the editor(s) disclaim responsibility for any injury to people or property resulting from any ideas, methods, instructions or products referred to in the content. |
© 2023 by the authors. Licensee MDPI, Basel, Switzerland. This article is an open access article distributed under the terms and conditions of the Creative Commons Attribution (CC BY) license (https://creativecommons.org/licenses/by/4.0/).
Share and Cite
Bose, D.; Stebliankin, V.; Cickovski, T.; Saha, P.; Trivedi, A.; Roy, S.; More, M.; Tuteja, A.; Mathee, K.; Narasimhan, G.; et al. Microbiome Dysbiosis Shows Strong Association of Gut-Derived Altered Metabolomic Profile in Gulf War Chronic Multisymptom Illness Symptom Persistence Following Western Diet Feeding and Development of Obesity. Int. J. Mol. Sci. 2023, 24, 4245. https://doi.org/10.3390/ijms24044245
Bose D, Stebliankin V, Cickovski T, Saha P, Trivedi A, Roy S, More M, Tuteja A, Mathee K, Narasimhan G, et al. Microbiome Dysbiosis Shows Strong Association of Gut-Derived Altered Metabolomic Profile in Gulf War Chronic Multisymptom Illness Symptom Persistence Following Western Diet Feeding and Development of Obesity. International Journal of Molecular Sciences. 2023; 24(4):4245. https://doi.org/10.3390/ijms24044245
Chicago/Turabian StyleBose, Dipro, Vitalli Stebliankin, Trevor Cickovski, Punnag Saha, Ayushi Trivedi, Subhajit Roy, Madhura More, Ashok Tuteja, Kalai Mathee, Giri Narasimhan, and et al. 2023. "Microbiome Dysbiosis Shows Strong Association of Gut-Derived Altered Metabolomic Profile in Gulf War Chronic Multisymptom Illness Symptom Persistence Following Western Diet Feeding and Development of Obesity" International Journal of Molecular Sciences 24, no. 4: 4245. https://doi.org/10.3390/ijms24044245