
AQP1 in the Gastrointestinal Tract of Mice: Expression Pattern and Impact of AQP1 Knockout on Colonic Function
 , and
, and 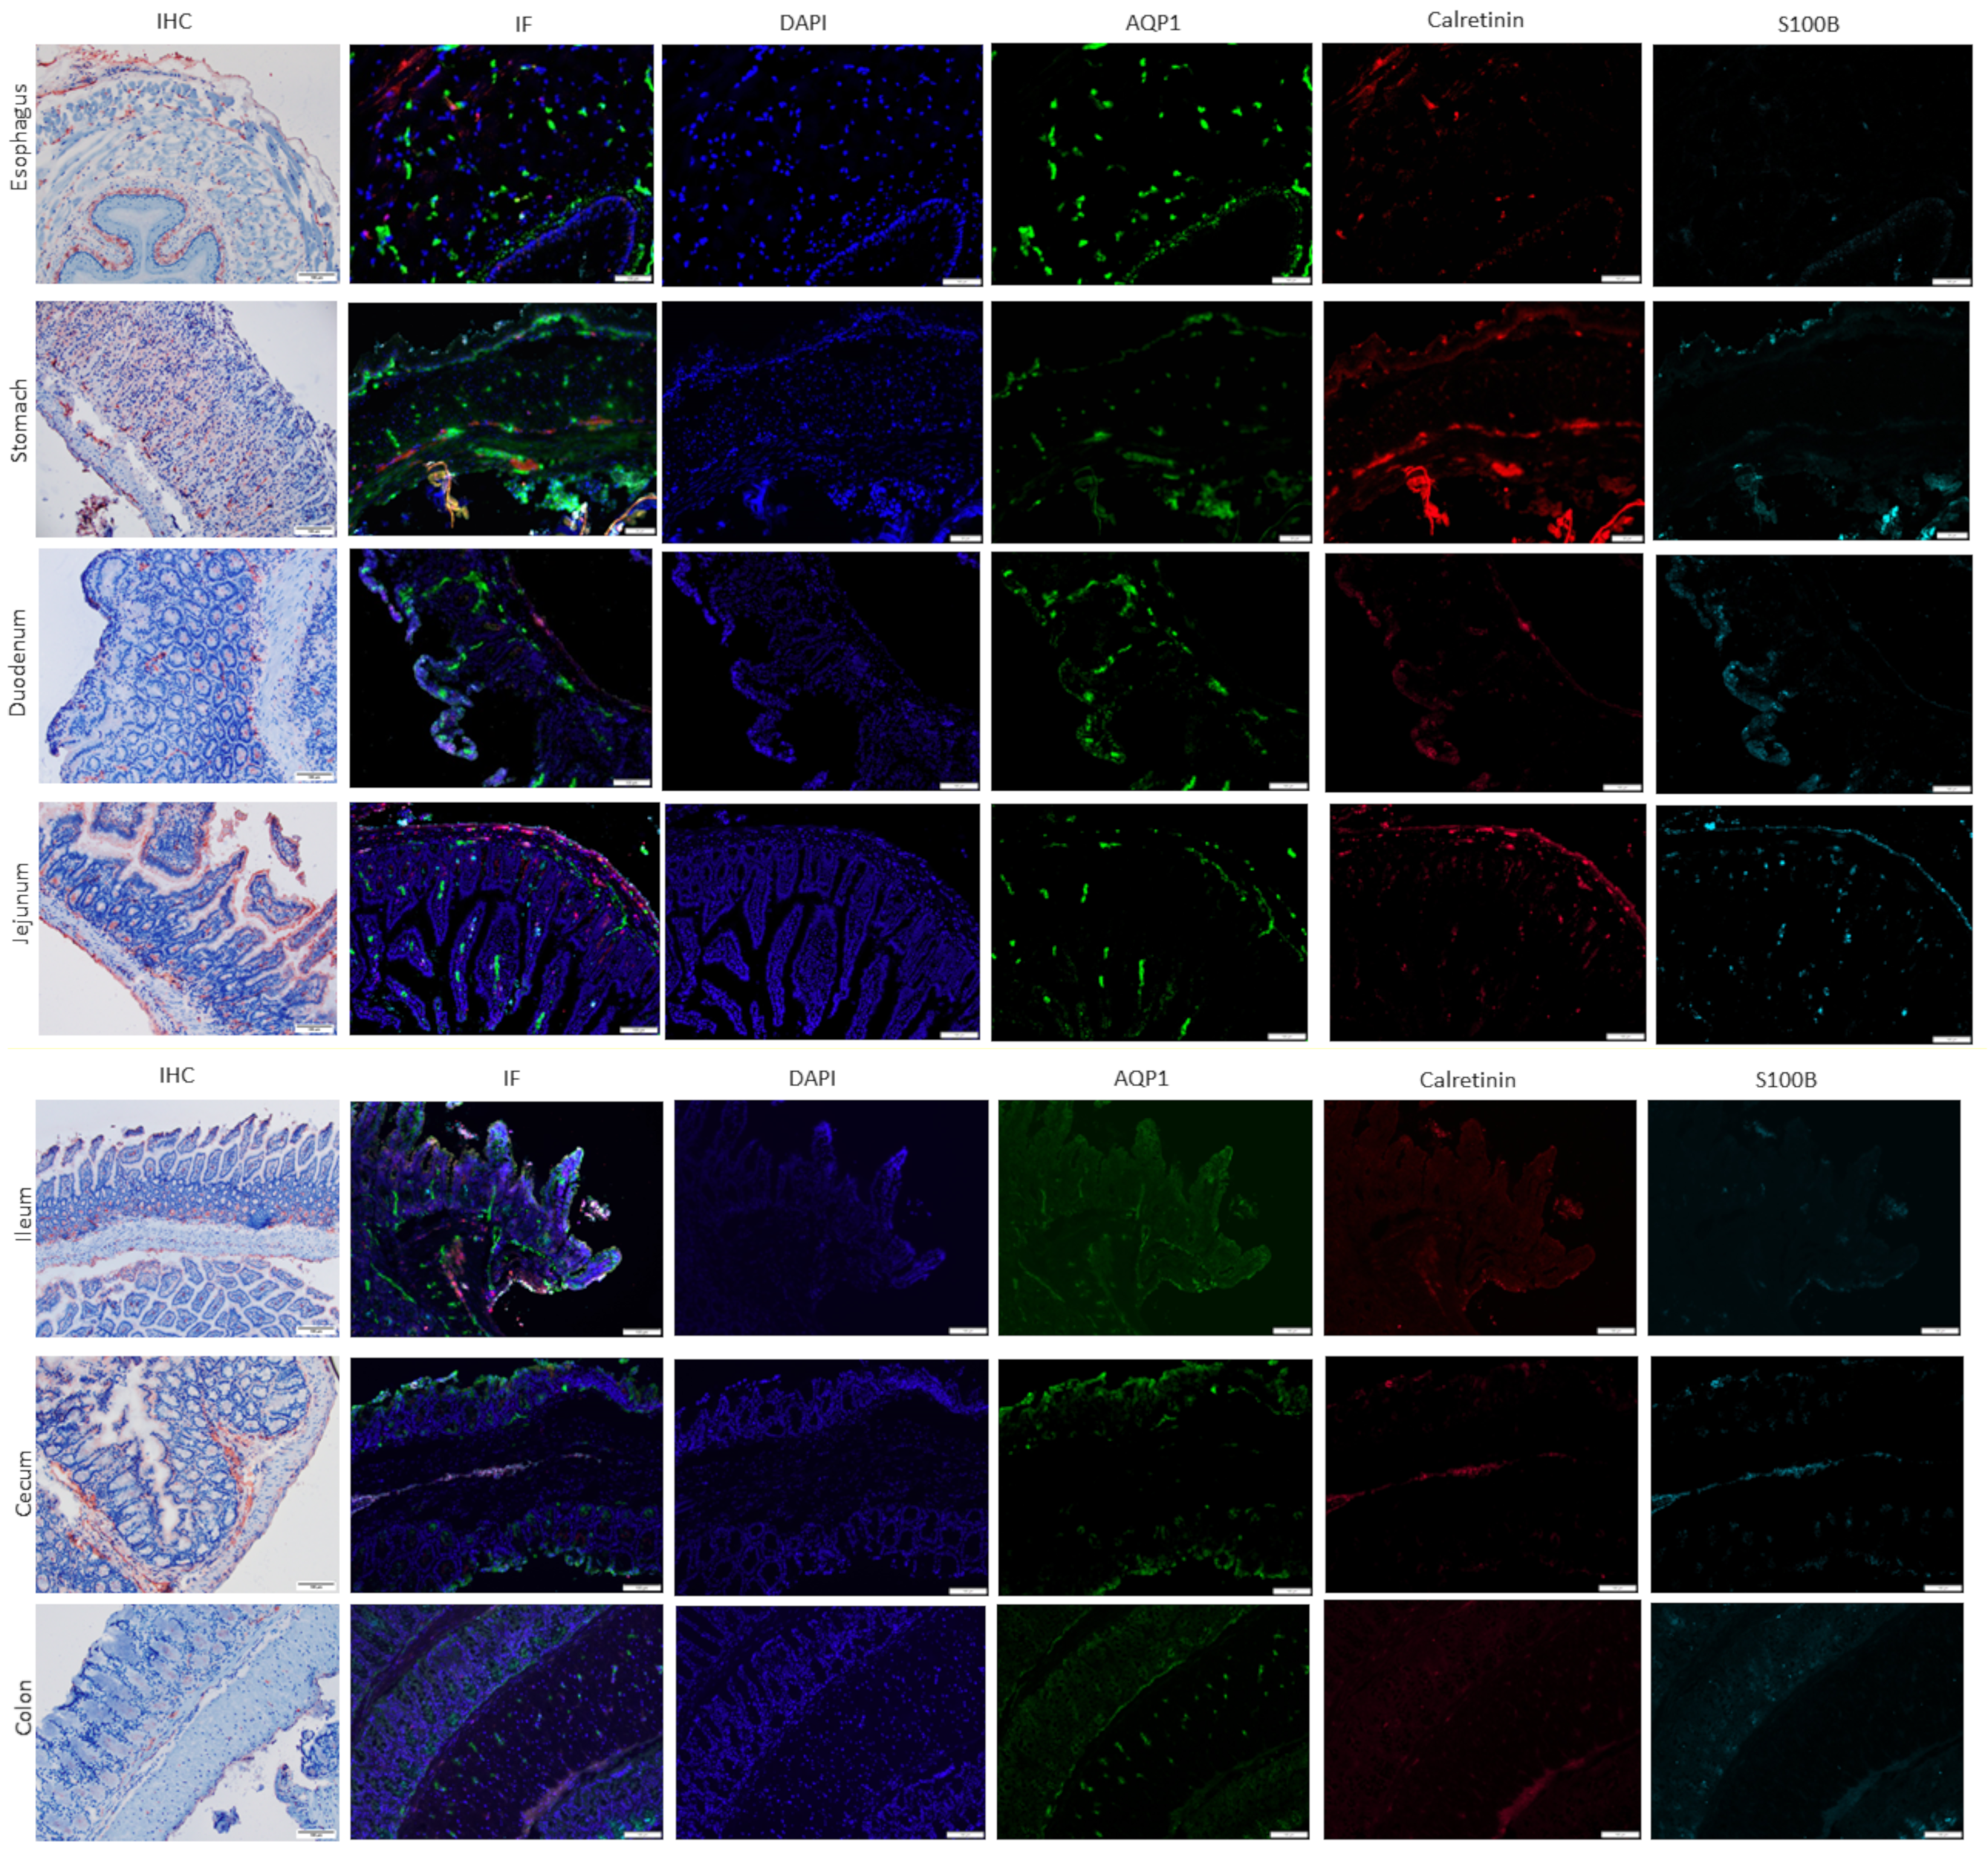
Abstract
:1. Introduction
2. Results
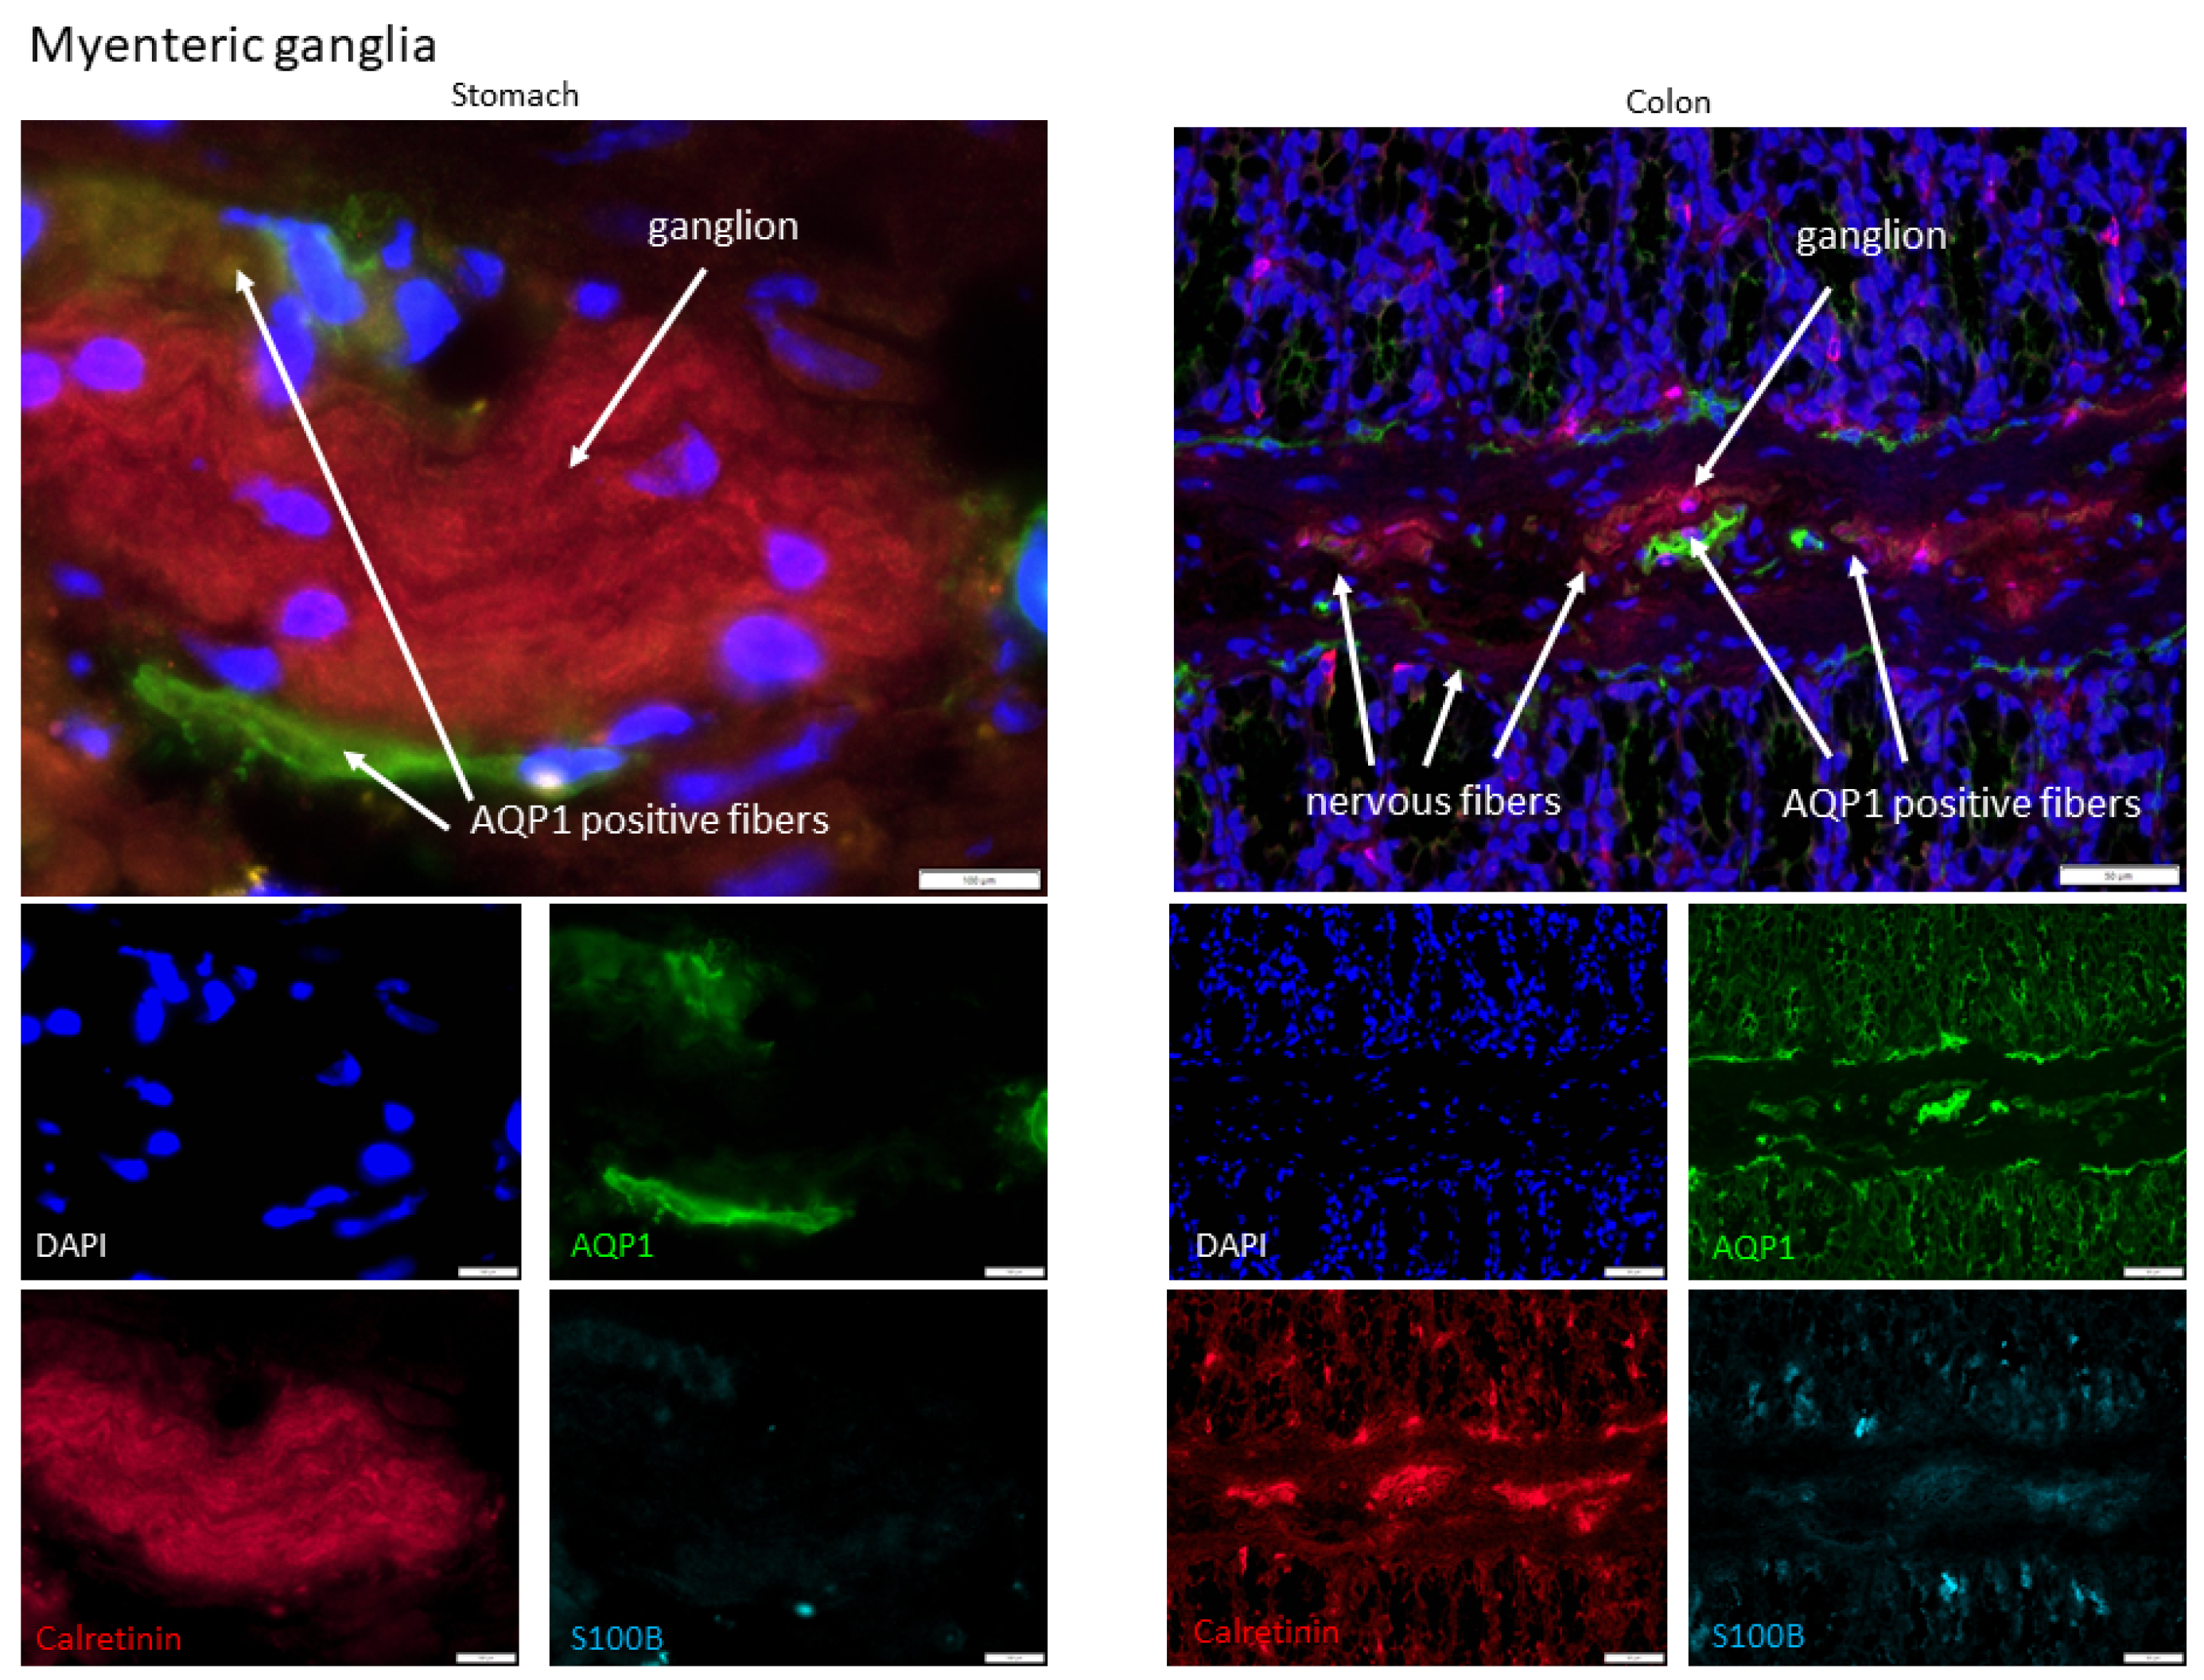
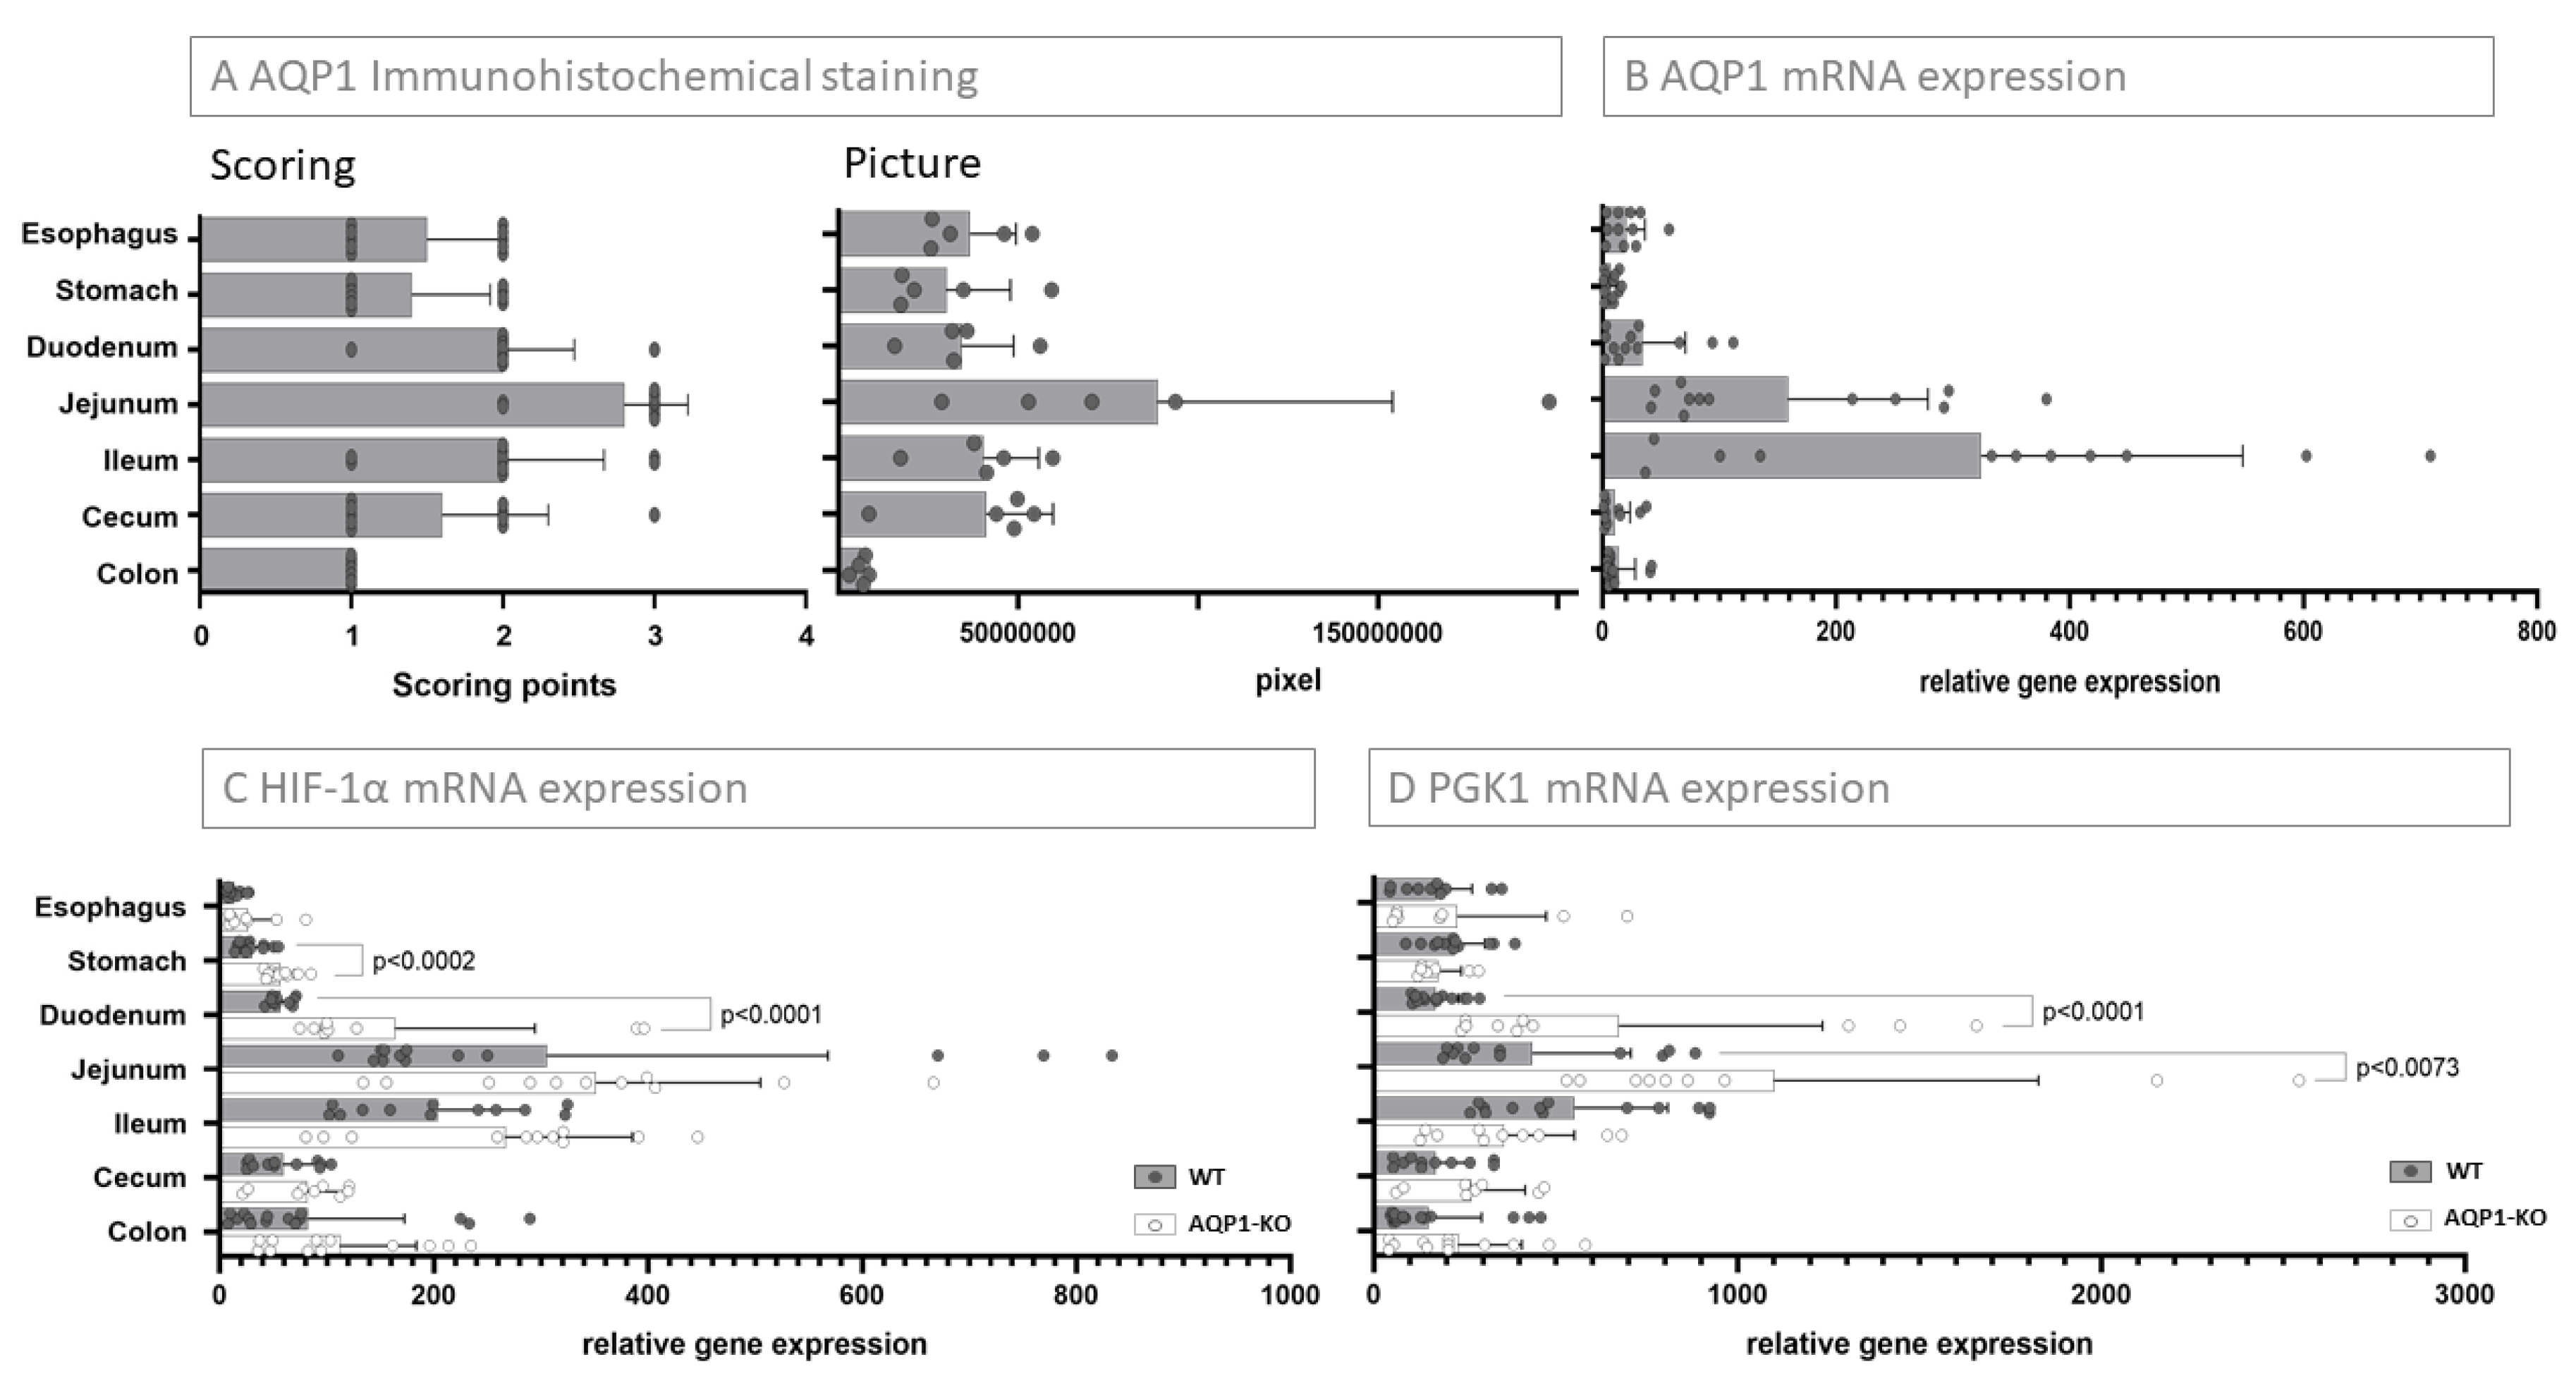
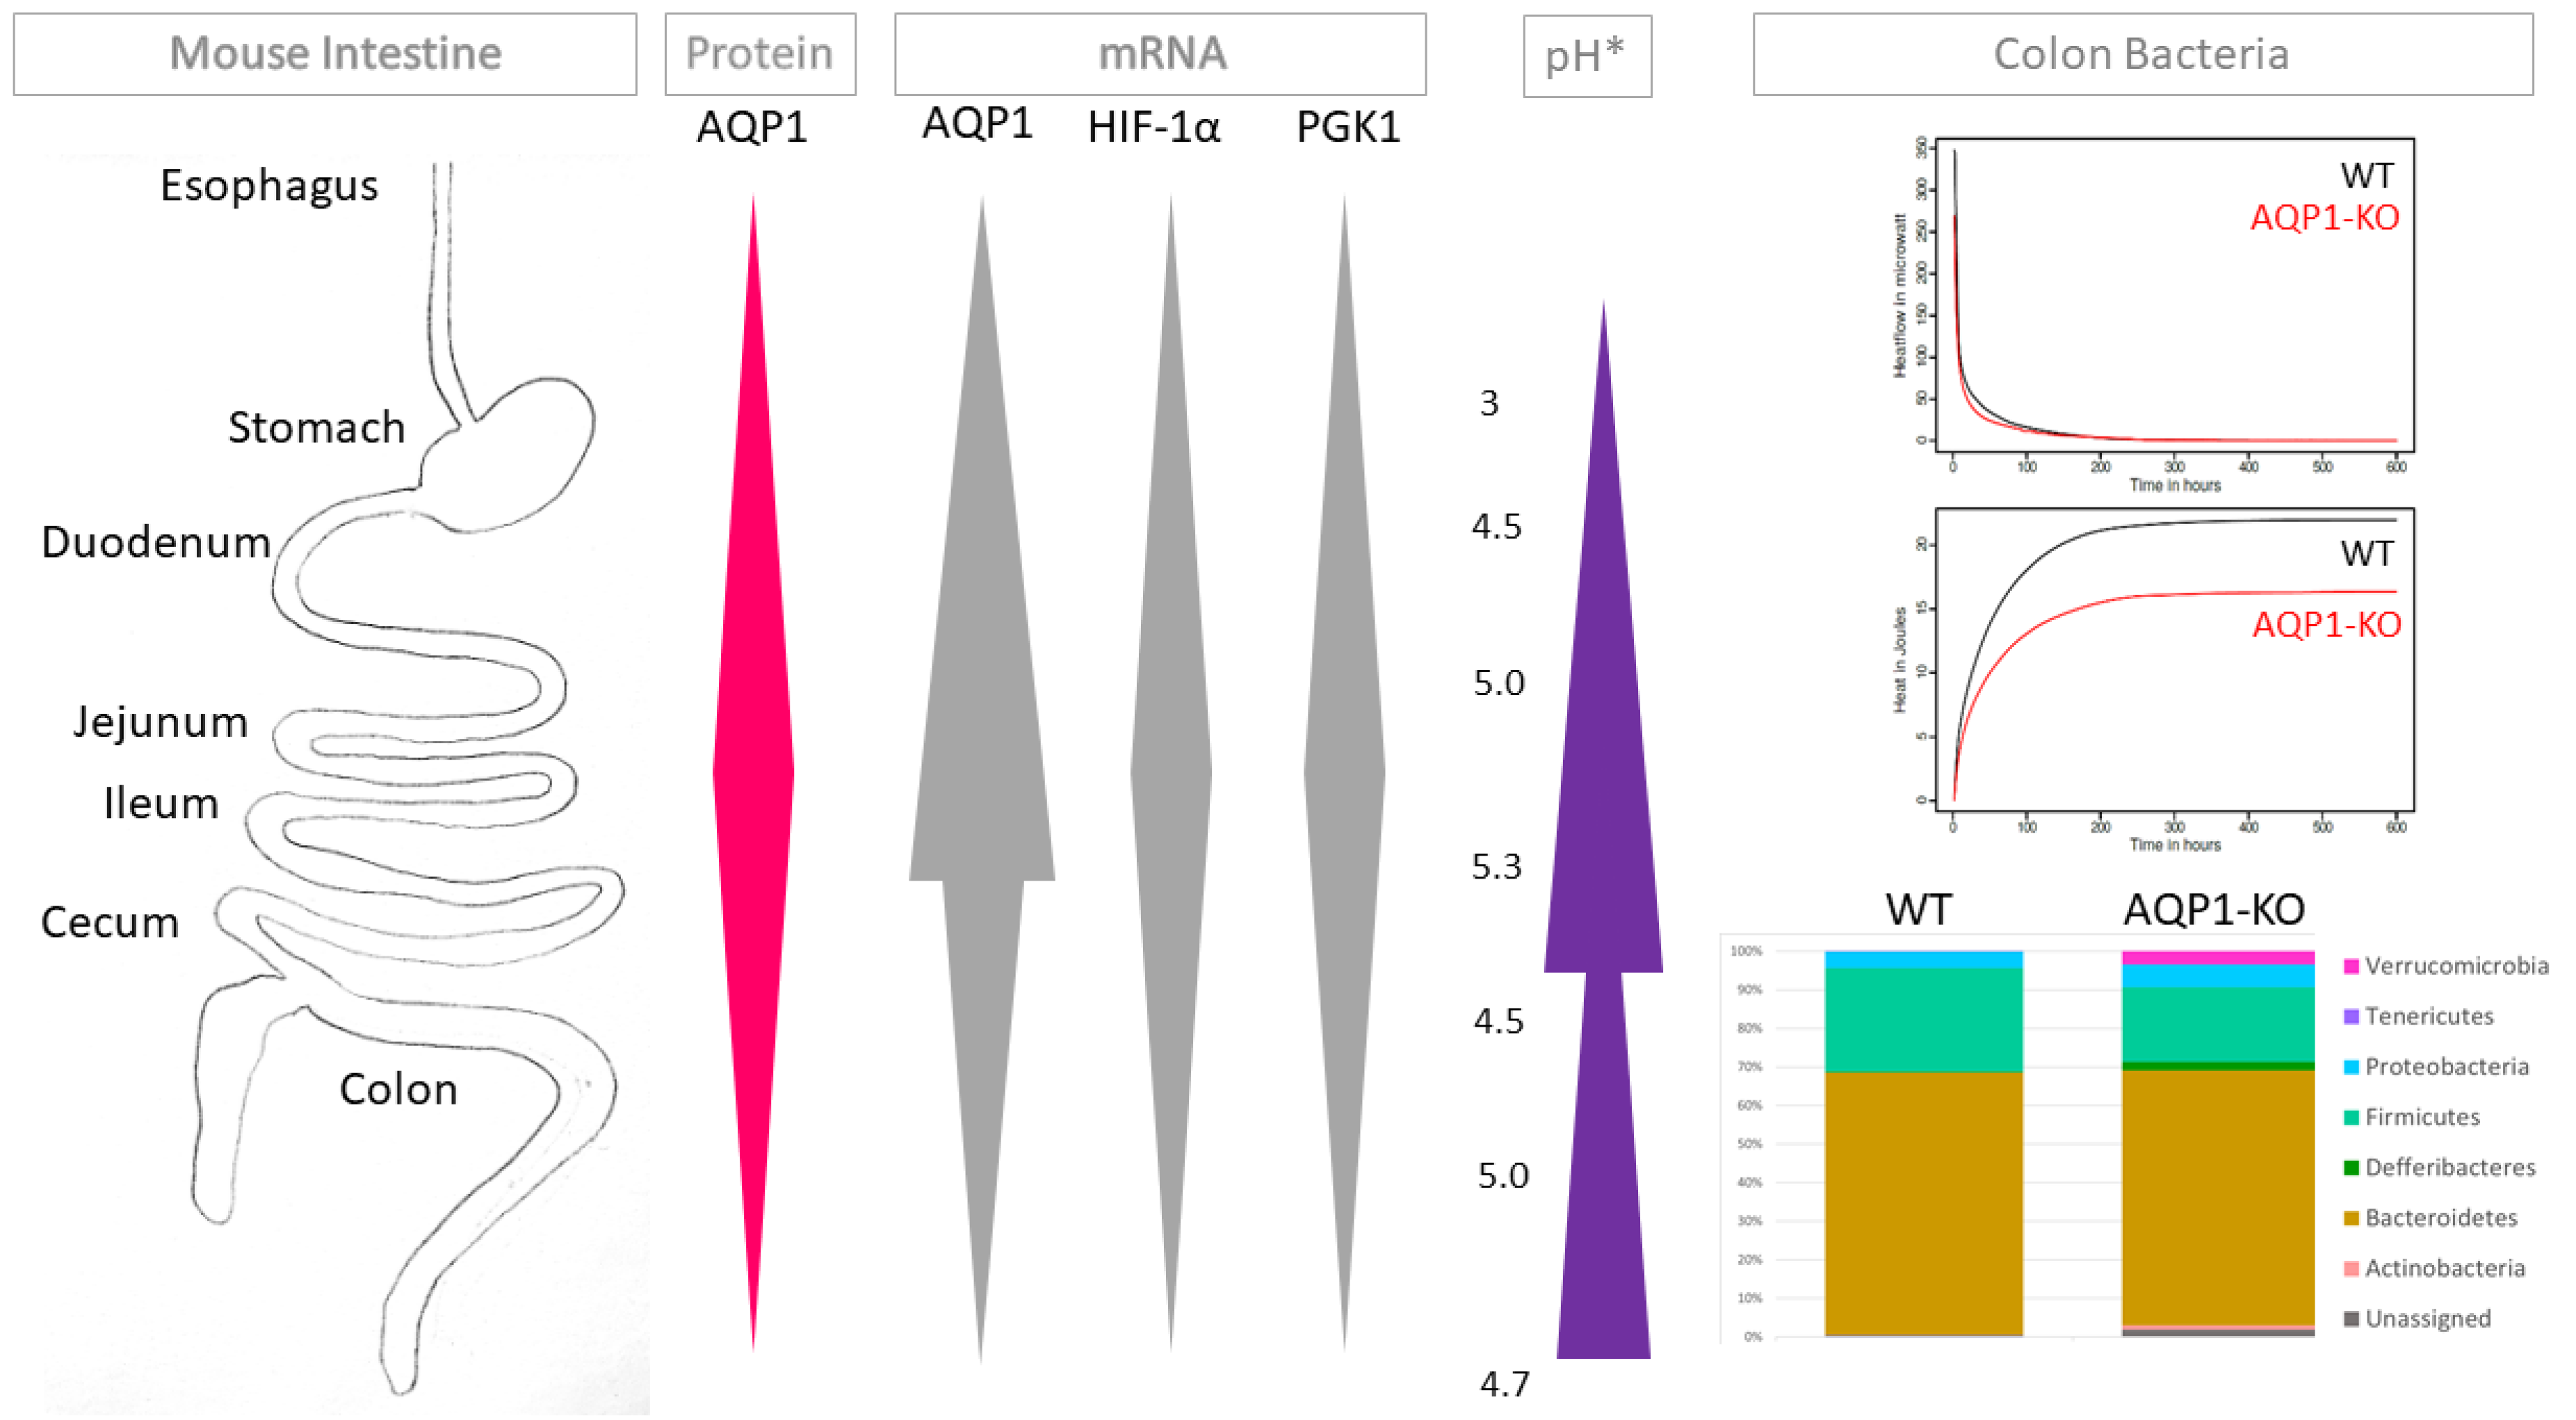
2.1. AQP1 Expression Profile in the Gastrointestinal Tract
2.2. Relation of AQP1 Expression to the Known Regulatory Factor HIF-1α
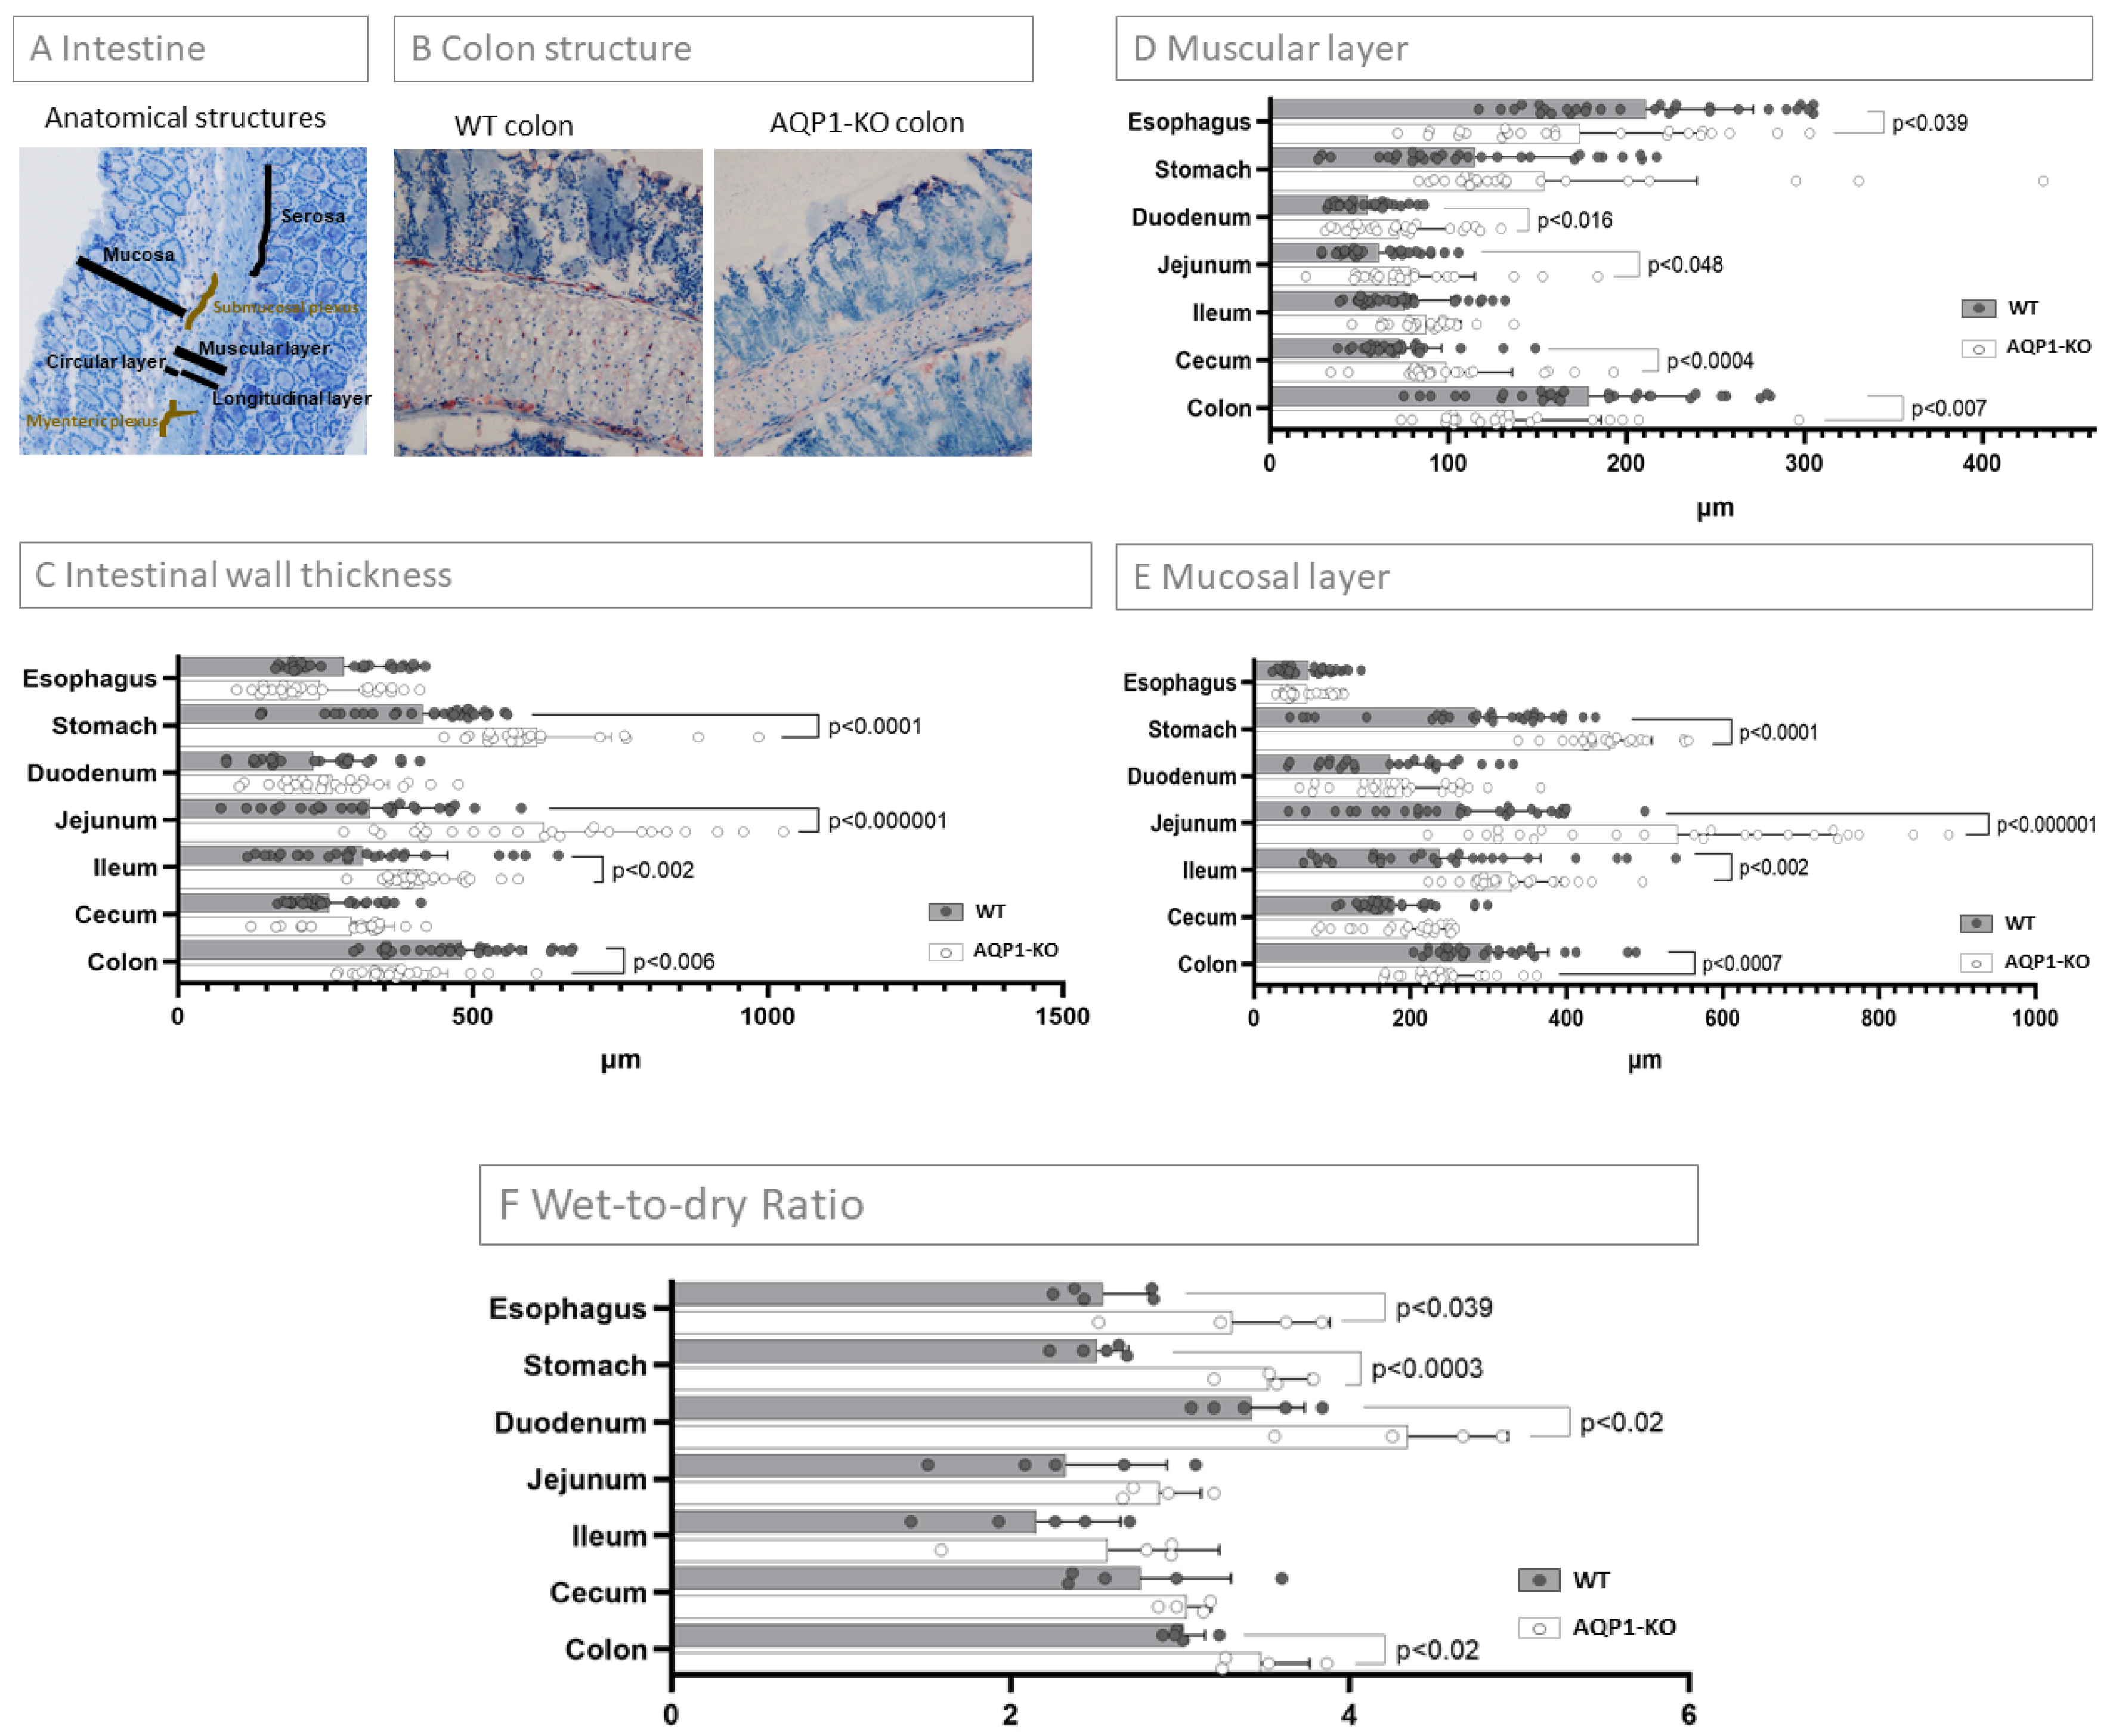
2.3. Characterization of the Intestinal Wall Thickness
2.4. Wet-To-Dry Ratio of Intestinal Segments
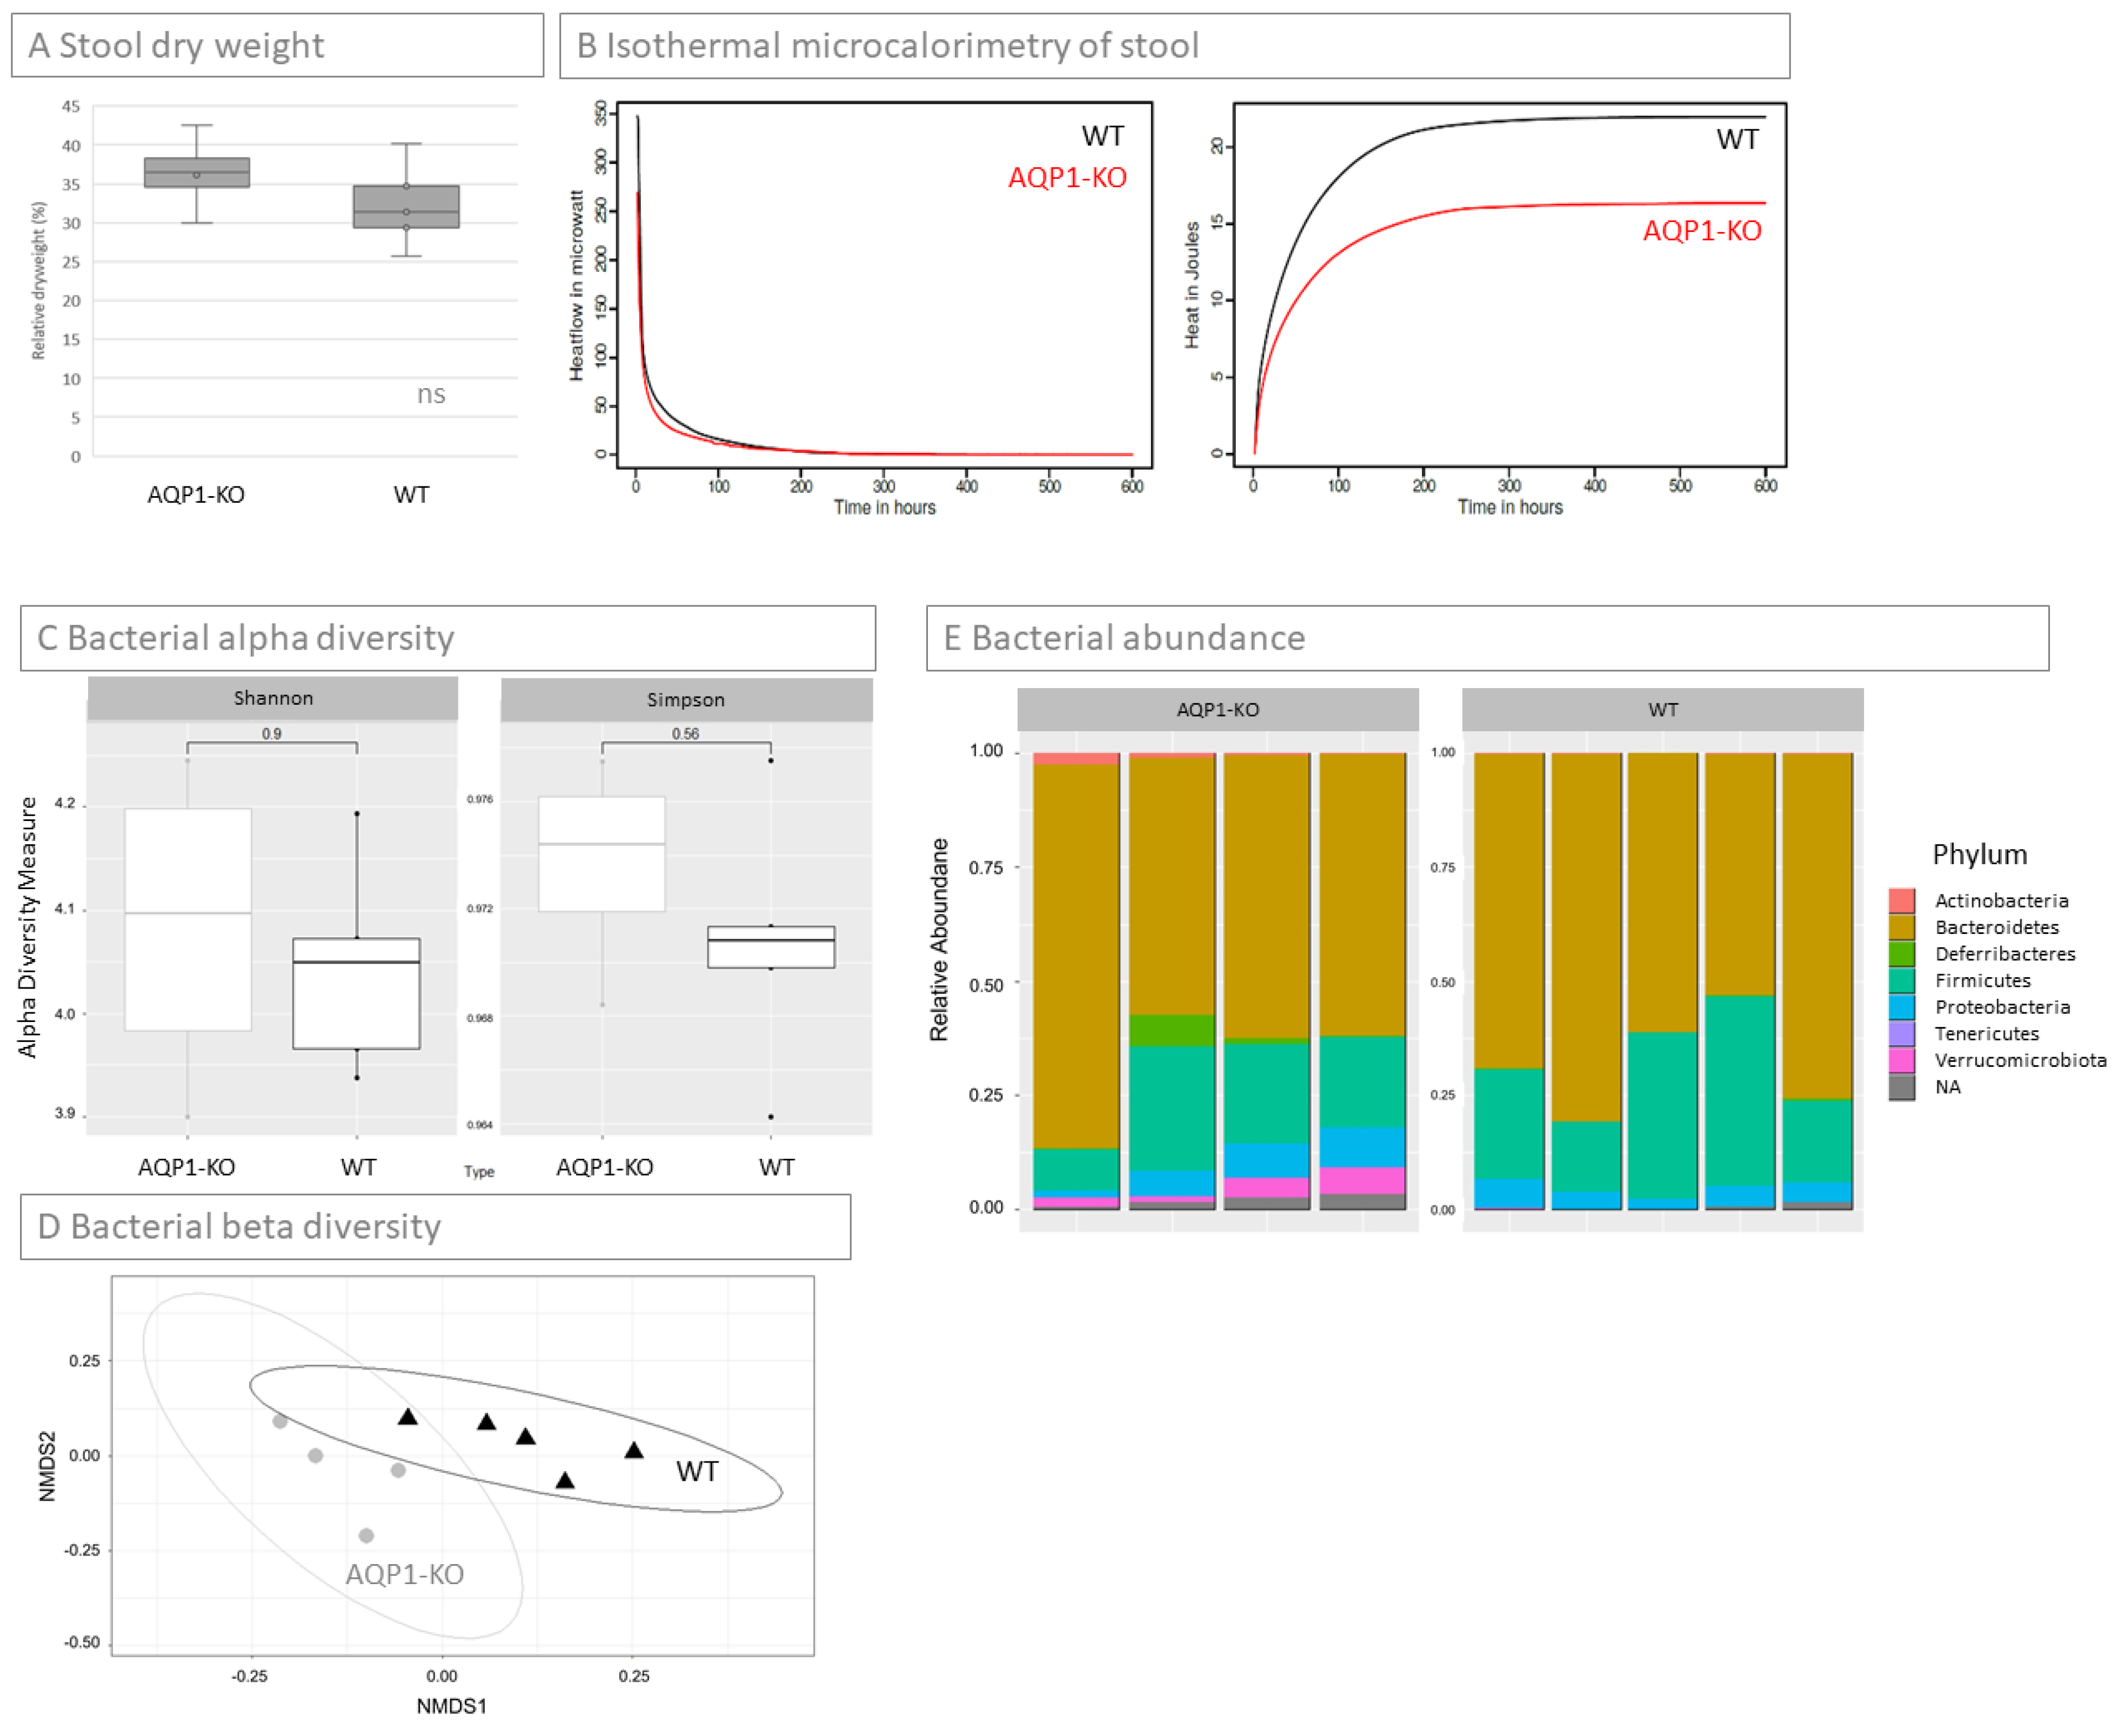
2.5. Concentration of Stool
2.6. Microbiome of Stool
3. Discussion
3.1. Role of AQP1 in the Gastrointestinal Tract Regarding Its Location
3.2. Influence of AQP1-KO in Gastrointestinal Structure
3.3. AQP1 in the Colon
4. Materials and Methods
4.1. Tissue Preparation
4.2. Heterozygous Mouse
4.3. Immunohistochemistry and Immunofluorescence
4.4. Staining Analysis
4.5. Wet-to-Dry Ratio of Intestinal Segments
4.6. RNA Isolation/cDNA Synthesis/qPCR
4.7. Isothermal Microcalorimetry
4.8. Dry Weight Measurement
4.9. Graphs and Statistical Analysis
4.10. Microbiome Analysis
5. Conclusions
Supplementary Materials
Author Contributions
Funding
Institutional Review Board Statement
Informed Consent Statement
Data Availability Statement
Acknowledgments
Conflicts of Interest
References
- Verkman, A.S. Aquaporins in clinical medicine. Annu. Rev. Med. 2012, 63, 303–316. [Google Scholar] [CrossRef] [PubMed]
- Benga, G. Water channel proteins (later called aquaporins) and relatives: Past, present, and future. IUBMB Life 2009, 61, 112–133. [Google Scholar] [CrossRef] [PubMed]
- Tanghe, A.; Van Dijck, P.; Thevelein, J.M. Why do microorganisms have aquaporins? Trends Microbiol. 2006, 14, 78–85. [Google Scholar] [CrossRef] [PubMed]
- Endeward, V.; Cartron, J.P.; Ripoche, P.; Gros, G. RhAG protein of the Rhesus complex is a CO2 channel in the human red cell membrane. FASEB J. Off. Publ. Fed. Am. Soc. Exp. Biol. 2008, 22, 64–73. [Google Scholar] [CrossRef]
- Itel, F.; Al-Samir, S.; Oberg, F.; Chami, M.; Kumar, M.; Supuran, C.T.; Deen, P.M.; Meier, W.; Hedfalk, K.; Gros, G.; et al. CO2 permeability of cell membranes is regulated by membrane cholesterol and protein gas channels. FASEB J. Off. Publ. Fed. Am. Soc. Exp. Biol. 2012, 26, 5182–5191. [Google Scholar] [CrossRef]
- Carbrey, J.M.; Agre, P. Discovery of the aquaporins and development of the field. Handb. Exp. Pharmacol. 2009, 190, 3–28. [Google Scholar] [CrossRef]
- Butkus, A.; Alcorn, D.; Earnest, L.; Moritz, K.; Giles, M.; Wintour, E.M. Expression of aquaporin-1 (AQP1) in the adult and developing sheep kidney. Biol. Cell 1997, 89, 313–320. [Google Scholar] [CrossRef]
- Nielsen, S.; Pallone, T.; Smith, B.L.; Christensen, E.I.; Agre, P.; Maunsbach, A.B. Aquaporin-1 water channels in short and long loop descending thin limbs and in descending vasa recta in rat kidney. Am. J. Physiol. 1995, 268, F1023–F1037. [Google Scholar] [CrossRef]
- Ma, T.; Yang, B.; Gillespie, A.; Carlson, E.J.; Epstein, C.J.; Verkman, A.S. Severely impaired urinary concentrating ability in transgenic mice lacking aquaporin-1 water channels. J. Biol. Chem. 1998, 273, 4296–4299. [Google Scholar] [CrossRef]
- Effros, R.M.; Darin, C.; Jacobs, E.R.; Rogers, R.A.; Krenz, G.; Schneeberger, E.E. Water transport and the distribution of aquaporin-1 in pulmonary air spaces. J. Appl. Physiol. 1997, 83, 1002–1016. [Google Scholar] [CrossRef] [Green Version]
- Verkman, A.S.; Matthay, M.A.; Song, Y. Aquaporin water channels and lung physiology. Am. J. Physiol. Lung Cell. Mol. Physiol. 2000, 278, L867–L879. [Google Scholar] [CrossRef]
- Laforenza, U. Water channel proteins in the gastrointestinal tract. Mol. Asp. Med. 2012, 33, 642–650. [Google Scholar] [CrossRef]
- Zhu, C.; Chen, Z.; Jiang, Z. Expression, Distribution and Role of Aquaporin Water Channels in Human and Animal Stomach and Intestines. Int. J. Mol. Sci. 2016, 17, 1399. [Google Scholar] [CrossRef]
- Sakai, H.; Sagara, A.; Matsumoto, K.; Hasegawa, S.; Sato, K.; Nishizaki, M.; Shoji, T.; Horie, S.; Nakagawa, T.; Tokuyama, S.; et al. 5-Fluorouracil induces diarrhea with changes in the expression of inflammatory cytokines and aquaporins in mouse intestines. PLoS ONE 2013, 8, e54788. [Google Scholar] [CrossRef]
- Wang, K.; Liu, L.; Huang, J.; Yu, H.; Wu, H.; Duan, Y.; Cui, X.; Zhang, X.; Wang, W. Laxative Effects of Total Diterpenoids Extracted from the Roots of Euphorbia pekinensis Are Attributable to Alterations of Aquaporins in the Colon. Molecules 2017, 22, 465. [Google Scholar] [CrossRef]
- Cao, M.; Yang, M.; Ou, Z.; Li, D.; Geng, L.; Chen, P.; Chen, H.; Gong, S. Involvement of aquaporins in a mouse model of rotavirus diarrhea. Virol. Sin. 2014, 29, 211–217. [Google Scholar] [CrossRef]
- Ricanek, P.; Lunde, L.K.; Frye, S.A.; Støen, M.; Nygård, S.; Morth, J.P.; Rydning, A.; Vatn, M.H.; Amiry-Moghaddam, M.; Tønjum, T. Reduced expression of aquaporins in human intestinal mucosa in early stage inflammatory bowel disease. Clin. Exp. Gastroenterol. 2015, 8, 49–67. [Google Scholar] [CrossRef]
- Shen, L.; Zhu, Z.; Huang, Y.; Shu, Y.; Sun, M.; Xu, H.; Zhang, G.; Guo, R.; Wei, W.; Wu, W. Expression profile of multiple aquaporins in human gastric carcinoma and its clinical significance. Biomed. Pharmacother. 2010, 64, 313–318. [Google Scholar] [CrossRef]
- Gao, H.; He, C.; Fang, X.; Hou, X.; Feng, X.; Yang, H.; Zhao, X.; Ma, T. Localization of aquaporin-1 water channel in glial cells of the human peripheral nervous system. Glia 2006, 53, 783–787. [Google Scholar] [CrossRef]
- Ma, T.; Gao, H.; Fang, X.; Yang, H. Water channel proteins in the peripheral nervous system in health and disease. Mol. Asp. Med. 2012, 33, 605–611. [Google Scholar] [CrossRef]
- Arciszewski, M.B.; Stefaniak, M.; Zacharko-Siembida, A.; Calka, J. Aquaporin 1 water channel is expressed on submucosal but not myenteric neurons from the ovine duodenum. Ann. Anat. Anat. Anz. Off. Organ Anat. Ges. 2011, 193, 81–85. [Google Scholar] [CrossRef] [PubMed]
- Nagahama, M.; Ma, N.; Semba, R.; Naruse, S. Aquaporin 1 immunoreactive enteric neurons in the rat ileum. Neurosci. Lett. 2006, 395, 206–210. [Google Scholar] [CrossRef] [PubMed]
- De Luca, A.; Vassalotti, G.; Pelagalli, A.; Pero, M.E.; Squillacioti, C.; Mirabella, N.; Lombardi, P.; Avallone, L. Expression and Localization of Aquaporin-1 Along the Intestine of Colostrum Suckling Buffalo Calves. Anat. Histol. Embryol. 2015, 44, 391–400. [Google Scholar] [CrossRef] [PubMed]
- Oshio, K.; Watanabe, H.; Yan, D.; Verkman, A.S.; Manley, G.T. Impaired pain sensation in mice lacking Aquaporin-1 water channels. Biochem. Biophys. Res. Commun. 2006, 341, 1022–1028. [Google Scholar] [CrossRef] [PubMed]
- Pini, N.; Pfeifle, V.A.; Kym, U.; Keck, S.; Galati, V.; Holland-Cunz, S.; Gros, S.J. Water permeability is a measure of severity in acute appendicitis. J. Enzym. Inhib. Med. Chem. 2017, 32, 1036–1041. [Google Scholar] [CrossRef] [PubMed]
- Ishihara, E.; Nagahama, M.; Naruse, S.; Semba, R.; Miura, T.; Usami, M.; Narita, M. Neuropathological alteration of aquaporin 1 immunoreactive enteric neurons in the streptozotocin-induced diabetic rats. Auton. Neurosci. Basic Clin. 2008, 138, 31–40. [Google Scholar] [CrossRef] [PubMed]
- Trollmann, R.; Gassmann, M. The role of hypoxia-inducible transcription factors in the hypoxic neonatal brain. Brain Dev. 2009, 31, 503–509. [Google Scholar] [CrossRef]
- Kukec, E.; Goričar, K.; Dolžan, V.; Rener-Primec, Z. HIF1A polymorphisms do not modify the risk of epilepsy nor cerebral palsy after neonatal hypoxic-ischemic encephalopathy. Brain Res. 2021, 1757, 147281. [Google Scholar] [CrossRef]
- Huo, Z.; Lomora, M.; Kym, U.; Palivan, C.; Holland-Cunz, S.G.; Gros, S.J. AQP1 Is Up-Regulated by Hypoxia and Leads to Increased Cell Water Permeability, Motility, and Migration in Neuroblastoma. Front. Cell Dev. Biol. 2021, 9, 605272. [Google Scholar] [CrossRef]
- Pini, N.; Huo, Z.; Kym, U.; Holland-Cunz, S.; Gros, S.J. AQP1-Driven Migration Is Independent of Other Known Adverse Factors but Requires a Hypoxic Undifferentiated Cell Profile in Neuroblastoma. Children 2021, 8, 48. [Google Scholar] [CrossRef]
- Echevarria, M.; Munoz-Cabello, A.M.; Sanchez-Silva, R.; Toledo-Aral, J.J.; Lopez-Barneo, J. Development of cytosolic hypoxia and hypoxia-inducible factor stabilization are facilitated by aquaporin-1 expression. J. Biol. Chem. 2007, 282, 30207–30215. [Google Scholar] [CrossRef] [PubMed]
- Abreu-Rodríguez, I.; Sánchez Silva, R.; Martins, A.P.; Soveral, G.; Toledo-Aral, J.J.; López-Barneo, J.; Echevarría, M. Functional and transcriptional induction of aquaporin-1 gene by hypoxia; analysis of promoter and role of Hif-1α. PLoS ONE 2011, 6, e28385. [Google Scholar] [CrossRef] [PubMed]
- Tanaka, A.; Sakurai, K.; Kaneko, K.; Ogino, J.; Yagui, K.; Ishikawa, K.; Ishibashi, T.; Matsumoto, T.; Yokote, K.; Saito, Y. The role of the hypoxia-inducible factor 1 binding site in the induction of aquaporin-1 mRNA expression by hypoxia. DNA Cell Biol. 2011, 30, 539–544. [Google Scholar] [CrossRef] [PubMed]
- Liu, M.; Liu, Q.; Pei, Y.; Gong, M.; Cui, X.; Pan, J.; Zhang, Y.; Liu, Y.; Yuan, X.; Zhou, H.; et al. Aqp-1 Gene Knockout Attenuates Hypoxic Pulmonary Hypertension of Mice. Arterioscler. Thromb. Vasc. Biol. 2019, 39, 48–62. [Google Scholar] [CrossRef] [PubMed]
- Wilson, R.B.; Solass, W.; Archid, R.; Weinreich, F.J.; Königsrainer, A.; Reymond, M.A. Resistance to anoikis in transcoelomic shedding: The role of glycolytic enzymes. Pleura Peritoneum 2019, 4, 20190003. [Google Scholar] [CrossRef] [PubMed]
- Archid, R.; Solass, W.; Tempfer, C.; Königsrainer, A.; Adolph, M.; Reymond, M.A.; Wilson, R.B. Cachexia Anorexia Syndrome and Associated Metabolic Dysfunction in Peritoneal Metastasis. Int. J. Mol. Sci. 2019, 20, 5444. [Google Scholar] [CrossRef]
- Neish, A.S. Microbes in gastrointestinal health and disease. Gastroenterology 2009, 136, 65–80. [Google Scholar] [CrossRef]
- Ghoshal, U.C.; Shukla, R.; Ghoshal, U.; Gwee, K.A.; Ng, S.C.; Quigley, E.M. The gut microbiota and irritable bowel syndrome: Friend or foe? Int. J. Inflamm. 2012, 2012, 151085. [Google Scholar] [CrossRef]
- Qin, J.; Li, R.; Raes, J.; Arumugam, M.; Burgdorf, K.S.; Manichanh, C.; Nielsen, T.; Pons, N.; Levenez, F.; Yamada, T.; et al. A human gut microbial gene catalogue established by metagenomic sequencing. Nature 2010, 464, 59–65. [Google Scholar] [CrossRef]
- Dominguez-Bello, M.G.; Blaser, M.J.; Ley, R.E.; Knight, R. Development of the human gastrointestinal microbiota and insights from high-throughput sequencing. Gastroenterology 2011, 140, 1713–1719. [Google Scholar] [CrossRef]
- Eckburg, P.B.; Bik, E.M.; Bernstein, C.N.; Purdom, E.; Dethlefsen, L.; Sargent, M.; Gill, S.R.; Nelson, K.E.; Relman, D.A. Diversity of the human intestinal microbial flora. Science 2005, 308, 1635–1638. [Google Scholar] [CrossRef]
- O’Donovan, S.M.; Crowley, E.K.; Brown, J.R.; O’Sullivan, O.; O’Leary, O.F.; Timmons, S.; Nolan, Y.M.; Clarke, D.J.; Hyland, N.P.; Joyce, S.A.; et al. Nigral overexpression of α-synuclein in a rat Parkinson’s disease model indicates alterations in the enteric nervous system and the gut microbiome. Neurogastroenterol. Motil. 2020, 32, e13726. [Google Scholar] [CrossRef]
- Benech, N.; Rolhion, N.; Sokol, H. Tryptophan metabolites get the gut moving. Cell Host Microbe 2021, 29, 145–147. [Google Scholar] [CrossRef]
- Ye, L.; Bae, M.; Cassilly, C.D.; Jabba, S.V.; Thorpe, D.W.; Martin, A.M.; Lu, H.Y.; Wang, J.; Thompson, J.D.; Lickwar, C.R.; et al. Enteroendocrine cells sense bacterial tryptophan catabolites to activate enteric and vagal neuronal pathways. Cell Host Microbe 2021, 29, 179–196.e179. [Google Scholar] [CrossRef]
- Koyama, Y.; Yamamoto, T.; Tani, T.; Nihei, K.; Kondo, D.; Funaki, H.; Yaoita, E.; Kawasaki, K.; Sato, N.; Hatakeyama, K.; et al. Expression and localization of aquaporins in rat gastrointestinal tract. Am. J. Physiol. 1999, 276, C621–C627. [Google Scholar] [CrossRef]
- Matsuzaki, T.; Tajika, Y.; Ablimit, A.; Aoki, T.; Hagiwara, H.; Takata, K. Aquaporins in the digestive system. Med. Electron Microsc. 2004, 37, 71–80. [Google Scholar] [CrossRef]
- Hatton, G.B.; Yadav, V.; Basit, A.W.; Merchant, H.A. Animal Farm: Considerations in Animal Gastrointestinal Physiology and Relevance to Drug Delivery in Humans. J. Pharm. Sci. 2015, 104, 2747–2776. [Google Scholar] [CrossRef]
- McConnell, E.L.; Basit, A.W.; Murdan, S. Measurements of rat and mouse gastrointestinal pH, fluid and lymphoid tissue, and implications for in-vivo experiments. J. Pharm. Pharmacol. 2008, 60, 63–70. [Google Scholar] [CrossRef]
- Ruiz-Ederra, J.; Verkman, A.S. Accelerated cataract formation and reduced lens epithelial water permeability in aquaporin-1-deficient mice. Investig. Ophthalmol. Vis. Sci. 2006, 47, 3960–3967. [Google Scholar] [CrossRef]
- Olsen, A.B.; Hetz, R.A.; Xue, H.; Aroom, K.R.; Bhattarai, D.; Johnson, E.; Bedi, S.; Cox, C.S., Jr.; Uray, K. Effects of traumatic brain injury on intestinal contractility. Neurogastroenterol. Motil. 2013, 25, 593-e463. [Google Scholar] [CrossRef] [Green Version]
- Shah, S.K.; Moore-Olufemi, S.D.; Uray, K.S.; Jimenez, F.; Walker, P.A.; Xue, H.; Stewart, R.H.; Laine, G.A.; Cox, C.S., Jr. A murine model for the study of edema induced intestinal contractile dysfunction. Neurogastroenterol. Motil. 2010, 22, 1132-e290. [Google Scholar] [CrossRef] [PubMed]
- Uray, K.S.; Laine, G.A.; Xue, H.; Allen, S.J.; Cox, C.S., Jr. Edema-induced intestinal dysfunction is mediated by STAT3 activation. Shock 2007, 28, 239–244. [Google Scholar] [CrossRef] [PubMed]
- Ablimit, A.; Abdureyim, Z.; Yang, P.; Azmat, R.; Shan, W.; Yao, Q. Testicular AQP1 expression in a rat model of testicular Ischemia-Reperfusion injury. J. Pediatr. Urol. 2021, 17, 169.e1-169.e6. [Google Scholar] [CrossRef] [PubMed]
- Wang, Q.; Li, Y.; Wu, C.; Wang, T.; Wu, M. Aquaporin-1 inhibition exacerbates ischemia-reperfusion-induced lung injury in mouse. Am. J. Med. Sci. 2023, 365, 84–92. [Google Scholar] [CrossRef]
- Tan, J.; Gao, C.; Wang, C.; Ma, L.; Hou, X.; Liu, X.; Li, Z. Expression of Aquaporin-1 and Aquaporin-5 in a Rat Model of High-Altitude Pulmonary Edema and the Effect of Hyperbaric Oxygen Exposure. Dose Response 2020, 18, 1559325820970821. [Google Scholar] [CrossRef]
- Yan, Y.; Huang, J.; Ding, F.; Mei, J.; Zhu, J.; Liu, H.; Sun, K. Aquaporin 1 plays an important role in myocardial edema caused by cardiopulmonary bypass surgery in goat. Int. J. Mol. Med. 2013, 31, 637–643. [Google Scholar] [CrossRef]
- Zhang, H.Z.; Kim, M.H.; Lim, J.H.; Bae, H.R. Time-dependent expression patterns of cardiac aquaporins following myocardial infarction. J. Korean Med. Sci. 2013, 28, 402–408. [Google Scholar] [CrossRef]
- Jänig, W. Physiologie des Menschen; Springer: Berlin/Heidelberg, Germany, 2010. [Google Scholar] [CrossRef]
- Grubišić, V.; Gulbransen, B.D. Enteric glial activity regulates secretomotor function in the mouse colon but does not acutely affect gut permeability. J. Physiol. 2017, 595, 3409–3424. [Google Scholar] [CrossRef]
- Papadopoulos, M.C.; Verkman, A.S. Aquaporin water channels in the nervous system. Nat. Rev. Neurosci. 2013, 14, 265–277. [Google Scholar] [CrossRef] [Green Version]
- Edamana, S.; Login, F.H.; Yamada, S.; Kwon, T.H.; Nejsum, L.N. Aquaporin water channels as regulators of cell-cell adhesion proteins. Am. J. Physiol. Cell Physiol. 2021, 320, C771–C777. [Google Scholar] [CrossRef]
- Yang, Y.W.; Chen, M.K.; Yang, B.Y.; Huang, X.J.; Zhang, X.R.; He, L.Q.; Zhang, J.; Hua, Z.C. Use of 16S rRNA Gene-Targeted Group-Specific Primers for Real-Time PCR Analysis of Predominant Bacteria in Mouse Feces. Appl. Environ. Microbiol. 2015, 81, 6749–6756. [Google Scholar] [CrossRef]
- Lin, X.; Zhao, J.; Zhang, W.; He, L.; Wang, L.; Li, H.; Liu, Q.; Cui, L.; Gao, Y.; Chen, C.; et al. Towards screening the neurotoxicity of chemicals through feces after exposure to methylmercury or inorganic mercury in rats: A combined study using gut microbiome, metabolomics and metallomics. J. Hazard. Mater. 2021, 409, 124923. [Google Scholar] [CrossRef]
- Chantakhow, S.; Khorana, J.; Tepmalai, K.; Boonchooduang, N.; Chattipakorn, N.; Chattipakorn, S.C. Alterations of Gut Bacteria in Hirschsprung Disease and Hirschsprung-Associated Enterocolitis. Microorganisms 2021, 9, 2241. [Google Scholar] [CrossRef]
- Meier-Ruge, W.A.; Bruder, E. Pathology of chronic constipation in pediatric and adult coloproctology. Pathobiol. J. Immunopathol. Mol. Cell. Biol. 2005, 72, 1–102. [Google Scholar]
- R Core Team. R: A Language and Environment for Statistical Computing; R Foundation for Statistical Computing: Vienna, Austria, 2020; Available online: https://www.r-project.org/ (accessed on 14 July 2021).
- Wickham, H. ggplot2: Elegant Graphics for Data Analysis; Springer: New York, NY, USA, 2016. [Google Scholar]
- Kassambara, A. ‘Ggplot2’ Based PublicationReady Plots; R Package Version 0.4.0. 2020. Available online: https://cran.r-project.org/package=ggpubr (accessed on 14 July 2021).
- Legendre, P.; Legendre, L. Numerical Ecology; Elsevier: Amsterdam, The Netherlands, 1998. [Google Scholar]
- Anderson, M.J. A new method for non-parametric multivariate analysis of variance. Austral Ecol. 2001, 26, 32–46. [Google Scholar]
- McMurdie, P.J.; Holmes, S. Phyloseq: An R package for reproducible interactive analysis and graphics of microbiome census data. PLoS ONE 2013, 8, e61217. [Google Scholar] [CrossRef] [Green Version]
- Oksanen, J.; Blanchet, F.G.; Friendly, M.; RoelandKindt; Legendre, P.; McGlinn, D.; Minchin, P.R.; O’Hara, R.B.; Simpson, G.L.; Solymos, P.; et al. Vegan: Community Ecology Package; R Package Version 2.5-7. 2020. Available online: https://cran.r-project.org (accessed on 14 July 2021).


Disclaimer/Publisher’s Note: The statements, opinions and data contained in all publications are solely those of the individual author(s) and contributor(s) and not of MDPI and/or the editor(s). MDPI and/or the editor(s) disclaim responsibility for any injury to people or property resulting from any ideas, methods, instructions or products referred to in the content. |
© 2023 by the authors. Licensee MDPI, Basel, Switzerland. This article is an open access article distributed under the terms and conditions of the Creative Commons Attribution (CC BY) license (https://creativecommons.org/licenses/by/4.0/).
Share and Cite
Volkart, S.; Kym, U.; Braissant, O.; Delgado-Eckert, E.; Al-Samir, S.; Angresius, R.; Huo, Z.; Holland-Cunz, S.; Gros, S.J. AQP1 in the Gastrointestinal Tract of Mice: Expression Pattern and Impact of AQP1 Knockout on Colonic Function. Int. J. Mol. Sci. 2023, 24, 3616. https://doi.org/10.3390/ijms24043616
Volkart S, Kym U, Braissant O, Delgado-Eckert E, Al-Samir S, Angresius R, Huo Z, Holland-Cunz S, Gros SJ. AQP1 in the Gastrointestinal Tract of Mice: Expression Pattern and Impact of AQP1 Knockout on Colonic Function. International Journal of Molecular Sciences. 2023; 24(4):3616. https://doi.org/10.3390/ijms24043616
Chicago/Turabian StyleVolkart, Stefanie, Urs Kym, Olivier Braissant, Edgar Delgado-Eckert, Samer Al-Samir, Rebecca Angresius, Zihe Huo, Stefan Holland-Cunz, and Stephanie J. Gros. 2023. "AQP1 in the Gastrointestinal Tract of Mice: Expression Pattern and Impact of AQP1 Knockout on Colonic Function" International Journal of Molecular Sciences 24, no. 4: 3616. https://doi.org/10.3390/ijms24043616