
The Cellular Abundance of Chemoreceptors, Chemosensory Signaling Proteins, Sensor Histidine Kinases, and Solute Binding Proteins of Pseudomonas aeruginosa Provides Insight into Sensory Preferences and Signaling Mechanisms
 , , , and
Abstract
:1. Introduction

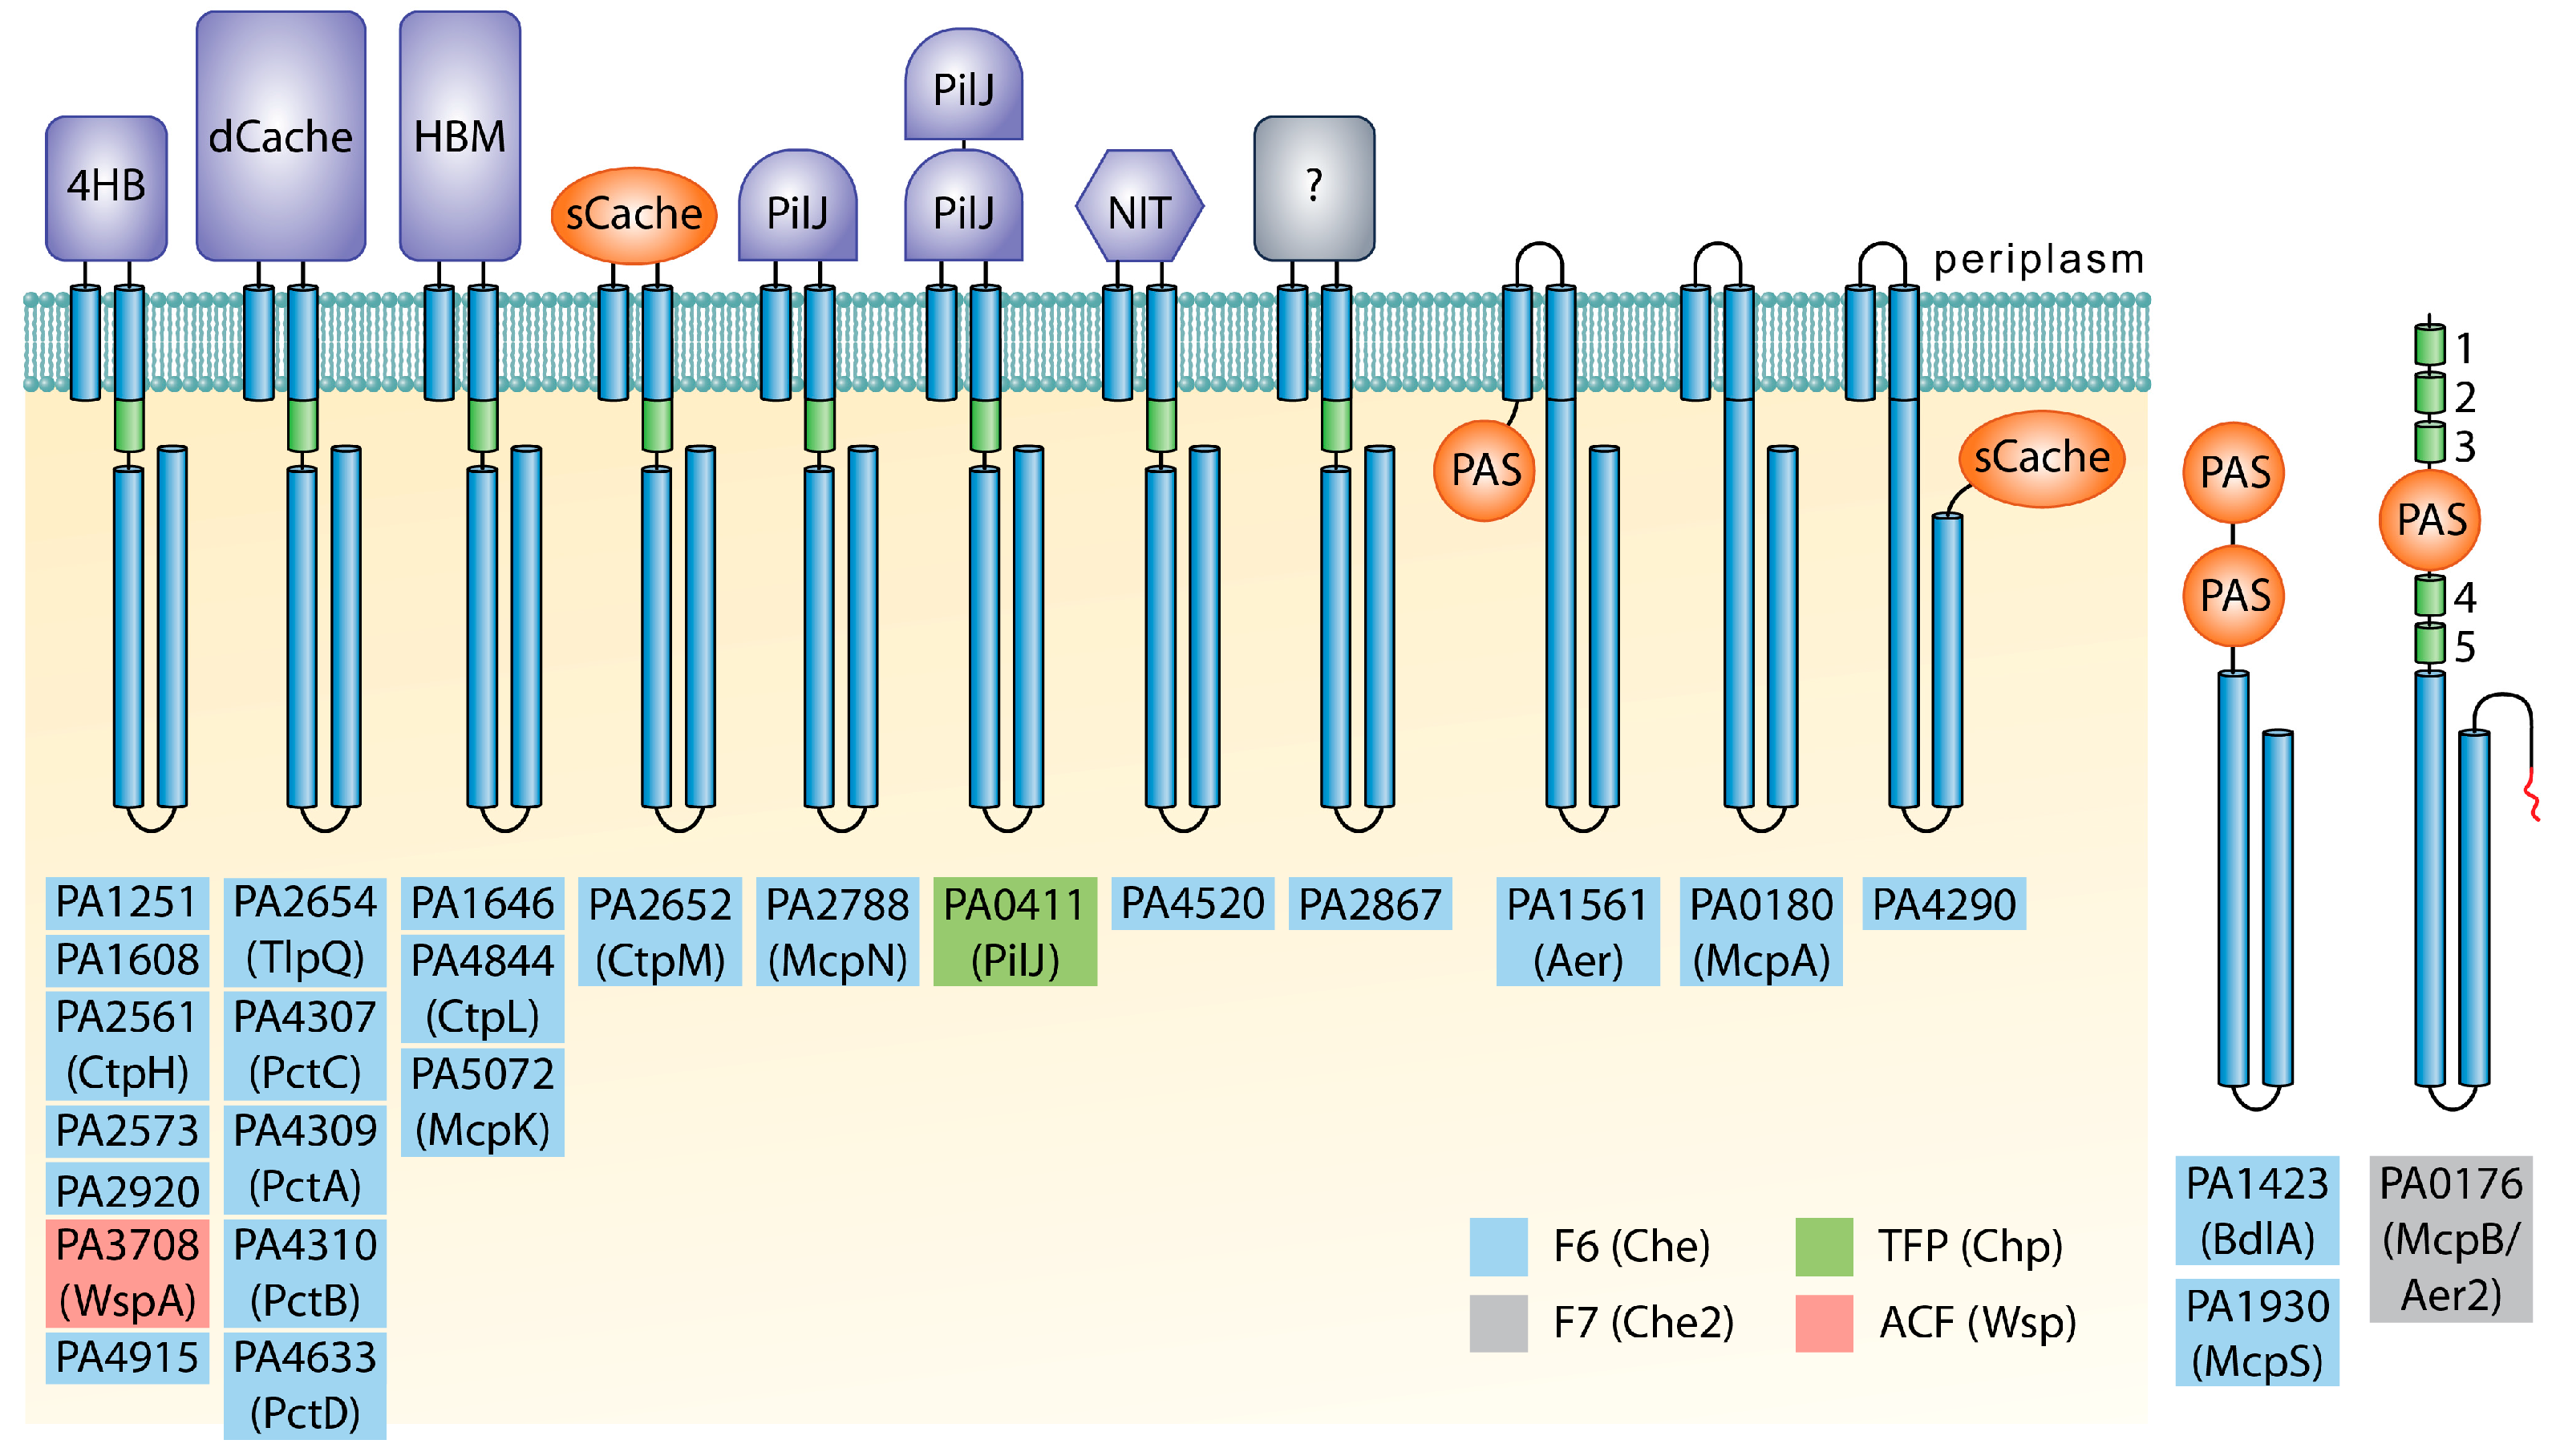
| Locus Tag | Name | Effector (Binding Mode) | Function/Comment | References |
|---|---|---|---|---|
| PA0176 | Aer2/McpB | O2 (direct) | Stimulates the Che2 pathway | [35,50,51,52,53] |
| PA0180 | CttP/McpA | Chloroethylenes (unknown) | Chemotaxis | [54] |
| PA0411 | PilJ | Phosphatidylethanolamine? PilA? | Stimulates the Chp pathway | [55] |
| PA1423 | BdlA | Unknown | Involved in biofilm dispersion | [56,57,58] |
| PA1561 | Aer/TlpC | O2 (unknown) | Aerotaxis | [51,59] |
| PA1930 | McpS | Unknown | Modulates chemotaxis and chemoreceptor clustering | [60] |
| PA2561 | CtpH | Inorganic phosphate (direct) | Chemotaxis | [61] |
| PA2573 | - | Unknown | Involved in virulence | [62] |
| PA2652 | CtpM | Malate, citramalate, methylsuccinate, bromosuccinate, citraconate (direct) | Chemotaxis | [63,64] |
| PA2654 | TlpQ | Histamine, putrescine, cadaverine, spermidine, agmatine, ethylenediamine (direct), ethylene (unknown) | Chemotaxis | [65,66] |
| PA2788 | McpN | Nitrate (direct) | Chemotaxis | [67] |
| PA3708 | WspA | Growth on solid surfaces (unknown), ethanol (unknown) | Stimulates the Wsp pathway | [68,69] |
| PA4307 | PctC | γ-aminobutyrate, histidine, proline (direct), histamine (unknown) | Chemotaxis | [65,70,71,72,73,74,75] |
| PA4309 | PctA | 17 amino acids (direct), histamine (unknown), chloroethylenes, chloroform (unknown) | Chemotaxis | [65,70,71,72,73,75] |
| PA4310 | PctB | 5 amino acids (direct) | Chemotaxis | [65,70,72,73,75] |
| PA4633 | PctD | Acetylcholine and other quaternary amines (direct) | Chemotaxis | [20] |
| PA4844 | CtpL | Inorganic phosphate (indirect, via PstS), chloroaniline, catechol (unknown) | Chemotaxis | [61,76] |
| PA5072 | McpK | α-ketoglutarate (direct) | Chemotaxis | [77] |
2. Results
2.1. Large Differences in Chemoreceptor Protein Amounts
2.2. Excess of Response Regulators over Sensor Histidine Kinases
2.3. Amounts of Chemosensory Signaling Proteins
2.3.1. Overall Abundance of Signaling Proteins from the Four Chemosensory Pathways
2.3.2. Differences in the Ratio of Signaling Proteins with the Individual CheA Homologs
Chemoreceptor:CheA Ratios
Coupling Protein:CheA Ratios
Response Regulator:CheA Ratios
CheR:CheA Ratios
2.4. Amount of Solute Binding Proteins
3. Discussion
4. Materials and Methods
4.1. Proteomics
4.2. Quantitative Capillary Chemotaxis Assays
4.3. Growth Experiments
Supplementary Materials
Author Contributions
Funding
Data Availability Statement
Conflicts of Interest
Abbreviations
References
- Galperin, M.Y. What Bacteria Want. Environ. Microbiol. 2018, 20, 4221–4229. [Google Scholar] [CrossRef] [PubMed] [Green Version]
- Gumerov, V.M.; Ortega, D.R.; Adebali, O.; Ulrich, L.E.; Zhulin, I.B. MiST 3.0: An Updated Microbial Signal Transduction Database with an Emphasis on Chemosensory Systems. Nucleic Acids Res. 2020, 48, D459–D464. [Google Scholar] [CrossRef] [PubMed] [Green Version]
- Wuichet, K.; Zhulin, I.B. Origins and Diversification of a Complex Signal Transduction System in Prokaryotes. Sci. Signal. 2010, 3, ra50. [Google Scholar] [CrossRef] [PubMed] [Green Version]
- Zschiedrich, C.P.; Keidel, V.; Szurmant, H. Molecular Mechanisms of Two-Component Signal Transduction. J. Mol. Biol. 2016, 428, 3752–3775. [Google Scholar] [CrossRef] [PubMed] [Green Version]
- Galperin, M.Y. Diversity of Structure and Function of Response Regulator Output Domains. Curr. Opin. Microbiol. 2010, 13, 150–159. [Google Scholar] [CrossRef] [PubMed] [Green Version]
- Laub, M.T.; Goulian, M. Specificity in Two-Component Signal Transduction Pathways. Annu. Rev. Genet. 2007, 41, 121–145. [Google Scholar] [CrossRef] [Green Version]
- Zusman, D.R.; Scott, A.E.; Yang, Z.; Kirby, J.R. Chemosensory Pathways, Motility and Development in Myxococcus Xanthus. Nat. Rev. Microbiol. 2007, 5, 862–872. [Google Scholar] [CrossRef]
- Ortega, D.R.; Fleetwood, A.D.; Krell, T.; Harwood, C.S.; Jensen, G.J.; Zhulin, I.B. Assigning Chemoreceptors to Chemosensory Pathways in Pseudomonas aeruginosa. Proc. Natl. Acad. Sci. USA 2017, 114, 12809–12814. [Google Scholar] [CrossRef] [Green Version]
- Matilla, M.A.; Martín-Mora, D.; Gavira, J.A.; Krell, T. Pseudomonas aeruginosa as a Model To Study Chemosensory Pathway Signaling. Microbiol. Mol. Biol. Rev. 2021, 85, e00151-20. [Google Scholar] [CrossRef]
- Parkinson, J.S. Signaling Mechanisms of HAMP Domains in Chemoreceptors and Sensor Kinases. Annu. Rev. Microbiol. 2010, 64, 101–122. [Google Scholar] [CrossRef]
- Scharf, B.E.; Hynes, M.F.; Alexandre, G.M. Chemotaxis Signaling Systems in Model Beneficial Plant-Bacteria Associations. Plant Mol. Biol. 2016, 90, 549–559. [Google Scholar] [CrossRef]
- Gumerov, V.M.; Andrianova, E.P.; Zhulin, I.B. Diversity of Bacterial Chemosensory Systems. Curr. Opin. Microbiol. 2021, 61, 42–50. [Google Scholar] [CrossRef]
- Bi, S.; Sourjik, V. Stimulus Sensing and Signal Processing in Bacterial Chemotaxis. Curr. Opin. Microbiol. 2018, 45, 22–29. [Google Scholar] [CrossRef]
- Hazelbauer, G.L.; Engstrom, P.; Harayama, S. Methyl-Accepting Chemotaxis Protein III and Transducer Gene Trg. J. Bacteriol. 1981, 145, 43–49. [Google Scholar] [CrossRef] [Green Version]
- Hazelbauer, G.L.; Engstrom, P. Multiple Forms of Methyl-Accepting Chemotaxis Proteins Distinguished by a Factor in Addition to Multiple Methylation. J. Bacteriol. 1981, 145, 35–42. [Google Scholar] [CrossRef] [PubMed] [Green Version]
- Zatakia, H.M.; Arapov, T.D.; Meier, V.M.; Scharf, B.E. Cellular Stoichiometry of Methyl-Accepting Chemotaxis Proteins in Sinorhizobium meliloti. J. Bacteriol. 2018, 200, e00614-17. [Google Scholar] [CrossRef] [Green Version]
- Cannistraro, V.J.; Glekas, G.D.; Rao, C.V.; Ordal, G.W. Cellular Stoichiometry of the Chemotaxis Proteins in Bacillus subtilis. J. Bacteriol. 2011, 193, 3220–3227. [Google Scholar] [CrossRef] [Green Version]
- Matilla, M.A.; Velando, F.; Martín-Mora, D.; Monteagudo-Cascales, E.; Krell, T. A Catalogue of Signal Molecules That Interact with Sensor Kinases, Chemoreceptors and Transcriptional Regulators. FEMS Microbiol. Rev. 2022, 46, fuab043. [Google Scholar] [CrossRef]
- Reyes-Darias, J.A.; Yang, Y.; Sourjik, V.; Krell, T. Correlation between Signal Input and Output in PctA and PctB Amino Acid Chemoreceptor of Pseudomonas aeruginosa. Mol. Microbiol. 2015, 96, 513–525. [Google Scholar] [CrossRef]
- Matilla, M.A.; Velando, F.; Tajuelo, A.; Martín-Mora, D.; Xu, W.; Sourjik, V.; Gavira, J.A.; Krell, T. Chemotaxis of the Human Pathogen Pseudomonas aeruginosa to the Neurotransmitter Acetylcholine. mBio 2022, 13, e0345821. [Google Scholar] [CrossRef]
- Rico-Jiménez, M.; Roca, A.; Krell, T.; Matilla, M.A. A Bacterial Chemoreceptor That Mediates Chemotaxis to Two Different Plant Hormones. Environ. Microbiol. 2022, 24, 3580–3597. [Google Scholar] [CrossRef] [PubMed]
- Boyeldieu, A.; Ali Chaouche, A.; Mejean, V.; Jourlin-Castelli, C. Combining Two Optimized and Affordable Methods to Assign Chemoreceptors to a Specific Signal. Anal. Biochem. 2021, 620, 114139. [Google Scholar] [CrossRef] [PubMed]
- Hida, A.; Oku, S.; Miura, M.; Matsuda, H.; Tajima, T.; Kato, J. Characterization of Methyl-Accepting Chemotaxis Proteins (MCPs) for Amino Acids in Plant-Growth-Promoting Rhizobacterium Pseudomonas Protegens CHA0 and Enhancement of Amino Acid Chemotaxis by MCP Genes Overexpression. Biosci. Biotechnol. Biochem. 2020, 84, 1948–1957. [Google Scholar] [CrossRef]
- Matilla, M.A.; Ortega, Á.; Krell, T. The Role of Solute Binding Proteins in Signal Transduction. Comput. Struct. Biotechnol. J. 2021, 19, 1786–1805. [Google Scholar] [CrossRef]
- GBD 2019 Antimicrobial Resistance Collaborators. Global Mortality Associated with 33 Bacterial Pathogens in 2019: A Systematic Analysis for the Global Burden of Disease Study 2019. Lancet 2022, 400, 2221–2248. [Google Scholar] [CrossRef]
- Iglewski, B.H. Chapter 27 Pseudomonas. In Medical Microbiology, 4th ed.; Baron, S., Ed.; University of Texas Medical Branch at Galveston: Galveston, TX, USA, 1996. [Google Scholar]
- Kang, C.I.; Kim, S.H.; Kim, H.B.; Park, S.W.; Choe, Y.J.; Oh, M.D.; Kim, E.C.; Choe, K.W. Pseudomonas aeruginosa Bacteremia: Risk Factors for Mortality and Influence of Delayed Receipt of Effective Antimicrobial Therapy on Clinical Outcome. Clin. Infect. Dis. 2003, 37, 745–751. [Google Scholar] [CrossRef] [Green Version]
- Crone, S.; Vives-Flórez, M.; Kvich, L.; Saunders, A.M.; Malone, M.; Nicolaisen, M.H.; Martínez-García, E.; Rojas-Acosta, C.; Catalina Gomez-Puerto, M.; Calum, H.; et al. The Environmental Occurrence of Pseudomonas aeruginosa. APMIS Acta Pathol. Microbiol. Immunol. Scand. 2020, 128, 220–231. [Google Scholar] [CrossRef]
- Moradali, M.F.; Ghods, S.; Rehm, B.H. Pseudomonas aeruginosa Lifestyle: A Paradigm for Adaptation, Survival, and Persistence. Front. Cell. Infect. Microbiol. 2017, 7, 39. [Google Scholar] [CrossRef] [Green Version]
- Walker, T.S.; Bais, H.P.; Deziel, E.; Schweizer, H.P.; Rahme, L.G.; Fall, R.; Vivanco, J.M. Pseudomonas aeruginosa-Plant Root Interactions. Pathogenicity, Biofilm Formation, and Root Exudation. Plant Physiol. 2004, 134, 320–331. [Google Scholar] [CrossRef] [Green Version]
- Rahme, L.G.; Ausubel, F.M.; Cao, H.; Drenkard, E.; Goumnerov, B.C.; Lau, G.W.; Mahajan-Miklos, S.; Plotnikova, J.; Tan, M.W.; Tsongalis, J.; et al. Plants and Animals Share Functionally Common Bacterial Virulence Factors. Proc. Natl. Acad. Sci. USA 2000, 97, 8815–8821. [Google Scholar] [CrossRef]
- Francis, V.I.; Stevenson, E.C.; Porter, S.L. Two-Component Systems Required for Virulence in Pseudomonas aeruginosa. FEMS Microbiol. Lett. 2017, 364, fnx104. [Google Scholar] [CrossRef] [PubMed] [Green Version]
- Orillard, E.; Watts, K.J. Deciphering the Che2 Chemosensory Pathway and the Roles of Individual Che2 Proteins from Pseudomonas aeruginosa. Mol. Microbiol. 2021, 115, 222–237. [Google Scholar] [CrossRef] [PubMed]
- Garvis, S.; Munder, A.; Ball, G.; de Bentzmann, S.; Wiehlmann, L.; Ewbank, J.J.; Tummler, B.; Filloux, A. Caenorhabditis elegans Semi-Automated Liquid Screen Reveals a Specialized Role for the Chemotaxis Gene CheB2 in Pseudomonas aeruginosa Virulence. PLoS Pathog. 2009, 5, e1000540. [Google Scholar] [CrossRef] [Green Version]
- Garcia-Fontana, C.; Vilchez, J.I.; Gonzalez-Requena, M.; Gonzalez-Lopez, J.; Krell, T.; Matilla, M.A.; Manzanera, M. The Involvement of McpB Chemoreceptor from Pseudomonas aeruginosa PAO1 in Virulence. Sci. Rep. 2019, 9, 13166. [Google Scholar] [CrossRef] [Green Version]
- Sanchis-López, C.; Cerna-Vargas, J.P.; Santamaría-Hernando, S.; Ramos, C.; Krell, T.; Rodríguez-Palenzuela, P.; López-Solanilla, E.; Huerta-Cepas, J.; Rodríguez-Herva, J.J. Prevalence and Specificity of Chemoreceptor Profiles in Plant-Associated Bacteria. mSystems 2021, 6, e0095121. [Google Scholar] [CrossRef]
- Francis, V.I.; Waters, E.M.; Finton-James, S.E.; Gori, A.; Kadioglu, A.; Brown, A.R.; Porter, S.L. Multiple Communication Mechanisms between Sensor Kinases Are Crucial for Virulence in Pseudomonas aeruginosa. Nat. Commun. 2018, 9, 2219. [Google Scholar] [CrossRef] [Green Version]
- Fernández, M.; Rico-Jiménez, M.; Ortega, Á.; Daddaoua, A.; García García, A.I.; Martín-Mora, D.; Torres, N.M.; Tajuelo, A.; Matilla, M.A.; Krell, T. Determination of Ligand Profiles for Pseudomonas aeruginosa Solute Binding Proteins. Int. J. Mol. Sci. 2019, 20, 5156. [Google Scholar] [CrossRef] [Green Version]
- Ortega, Á.; Matilla, M.A.; Krell, T. The Repertoire of Solute-Binding Proteins of Model Bacteria Reveals Large Differences in Number, Type, and Ligand Range. Microbiol. Spectr. 2022, 10, e0205422. [Google Scholar] [CrossRef]
- Bains, M.; Fernandez, L.; Hancock, R.E. Phosphate Starvation Promotes Swarming Motility and Cytotoxicity of Pseudomonas aeruginosa. Appl. Environ. Microbiol. 2012, 78, 6762–6768. [Google Scholar] [CrossRef] [Green Version]
- Zaborin, A.; Romanowski, K.; Gerdes, S.; Holbrook, C.; Lepine, F.; Long, J.; Poroyko, V.; Diggle, S.P.; Wilke, A.; Righetti, K.; et al. Red Death in Caenorhabditis Elegans Caused by Pseudomonas aeruginosa PAO1. Proc. Natl. Acad. Sci. USA 2009, 106, 6327–6332. [Google Scholar] [CrossRef]
- Long, J.; Zaborina, O.; Holbrook, C.; Zaborin, A.; Alverdy, J. Depletion of Intestinal Phosphate after Operative Injury Activates the Virulence of P Aeruginosa Causing Lethal Gut-Derived Sepsis. Surgery 2008, 144, 189–197. [Google Scholar] [CrossRef] [PubMed] [Green Version]
- Romanowski, K.; Zaborin, A.; Fernandez, H.; Poroyko, V.; Valuckaite, V.; Gerdes, S.; Liu, D.C.; Zaborina, O.Y.; Alverdy, J.C. Prevention of Siderophore-Mediated Gut-Derived Sepsis Due to P. Aeruginosa Can Be Achieved without Iron Provision by Maintaining Local Phosphate Abundance: Role of PH. BMC Microbiol. 2011, 11, 212. [Google Scholar] [CrossRef] [PubMed] [Green Version]
- Von Kruger, W.M.; Lery, L.M.; Soares, M.R.; de Neves-Manta, F.S.; Batista e Silva, C.M.; Neves-Ferreira, A.G.; Perales, J.; Bisch, P.M. The Phosphate-Starvation Response in Vibrio Cholerae O1 and PhoB Mutant under Proteomic Analysis: Disclosing Functions Involved in Adaptation, Survival and Virulence. Proteomics 2006, 6, 1495–1511. [Google Scholar] [CrossRef]
- Aggarwal, S.; Somani, V.K.; Bhatnagar, R. Phosphate Starvation Enhances the Pathogenesis of Bacillus Anthracis. Int. J. Med. Microbiol. IJMM 2015, 305, 523–531. [Google Scholar] [CrossRef]
- Elliott, S.R.; White, D.W.; Tischler, A.D. Mycobacterium Tuberculosis Requires Regulation of ESX-5 Secretion for Virulence in Irgm1-Deficient Mice. Infect. Immun. 2019, 87, e00660-18. [Google Scholar] [CrossRef] [Green Version]
- Kelliher, J.L.; Radin, J.N.; Kehl-Fie, T.E. PhoPR Contributes to Staphylococcus aureus Growth during Phosphate Starvation and Pathogenesis in an Environment-Specific Manner. Infect. Immun. 2018, 86, e00371-18. [Google Scholar] [CrossRef] [Green Version]
- Köhler, J.R.; Acosta-Zaldívar, M.; Qi, W. Phosphate in Virulence of Candida albicans and Candida glabrata. J. Fungi 2020, 6, 40. [Google Scholar] [CrossRef] [Green Version]
- Matilla, M.A.; Udaondo, Z.; Maaß, S.; Becher, D.; Krell, T. Virulence Induction in Pseudomonas aeruginosa under Inorganic Phosphate Limitation: A Proteomics Perspective. Microbiol. Spectr. 2022, 10, e0259022. [Google Scholar] [CrossRef]
- Airola, M.V.; Huh, D.; Sukomon, N.; Widom, J.; Sircar, R.; Borbat, P.P.; Freed, J.H.; Watts, K.J.; Crane, B.R. Architecture of the Soluble Receptor Aer2 Indicates an In-Line Mechanism for PAS and HAMP Domain Signaling. J. Mol. Biol. 2013, 425, 886–901. [Google Scholar] [CrossRef] [Green Version]
- Hong, C.S.; Kuroda, A.; Ikeda, T.; Takiguchi, N.; Ohtake, H.; Kato, J. The Aerotaxis Transducer Gene Aer, but Not Aer-2, Is Transcriptionally Regulated by the Anaerobic Regulator ANR in Pseudomonas aeruginosa. J. Biosci. Bioeng. 2004, 97, 184–190. [Google Scholar] [CrossRef]
- Sawai, H.; Sugimoto, H.; Shiro, Y.; Ishikawa, H.; Mizutani, Y.; Aono, S. Structural Basis for Oxygen Sensing and Signal Transduction of the Heme-Based Sensor Protein Aer2 from Pseudomonas aeruginosa. Chem. Commun. 2012, 48, 6523–6525. [Google Scholar] [CrossRef] [PubMed]
- Garcia, D.; Orillard, E.; Johnson, M.S.; Watts, K.J. Gas Sensing and Signaling in the PAS-Heme Domain of the Pseudomonas aeruginosa Aer2 Receptor. J. Bacteriol. 2017, 199, e00003-17. [Google Scholar] [CrossRef] [Green Version]
- Kim, H.E.; Shitashiro, M.; Kuroda, A.; Takiguchi, N.; Ohtake, H.; Kato, J. Identification and Characterization of the Chemotactic Transducer in Pseudomonas aeruginosa PAO1 for Positive Chemotaxis to Trichloroethylene. J. Bacteriol. 2006, 188, 6700–6702. [Google Scholar] [CrossRef] [Green Version]
- Kearns, D.B.; Robinson, J.; Shimkets, L.J. Pseudomonas aeruginosa Exhibits Directed Twitching Motility up Phosphatidylethanolamine Gradients. J. Bacteriol. 2001, 183, 763–767. [Google Scholar] [CrossRef] [Green Version]
- Morgan, R.; Kohn, S.; Hwang, S.H.; Hassett, D.J.; Sauer, K. BdlA, a Chemotaxis Regulator Essential for Biofilm Dispersion in Pseudomonas aeruginosa. J. Bacteriol. 2006, 188, 7335–7343. [Google Scholar] [CrossRef] [Green Version]
- Petrova, O.E.; Sauer, K. Dispersion by Pseudomonas aeruginosa Requires an Unusual Posttranslational Modification of BdlA. Proc. Natl. Acad. Sci. USA 2012, 109, 16690–16695. [Google Scholar] [CrossRef] [Green Version]
- Petrova, O.E.; Sauer, K. PAS Domain Residues and Prosthetic Group Involved in BdlA-Dependent Dispersion Response by Pseudomonas aeruginosa Biofilms. J. Bacteriol. 2012, 194, 5817–5828. [Google Scholar] [CrossRef] [Green Version]
- Hong, C.S.; Shitashiro, M.; Kuroda, A.; Ikeda, T.; Takiguchi, N.; Ohtake, H.; Kato, J. Chemotaxis Proteins and Transducers for Aerotaxis in Pseudomonas aeruginosa. FEMS Microbiol. Lett. 2004, 231, 247–252. [Google Scholar] [CrossRef] [Green Version]
- Bardy, S.L.; Maddock, J.R. Polar Localization of a Soluble Methyl-Accepting Protein of Pseudomonas aeruginosa. J. Bacteriol. 2005, 187, 7840–7844. [Google Scholar] [CrossRef] [Green Version]
- Wu, H.; Kato, J.; Kuroda, A.; Ikeda, T.; Takiguchi, N.; Ohtake, H. Identification and Characterization of Two Chemotactic Transducers for Inorganic Phosphate in Pseudomonas aeruginosa. J. Bacteriol. 2000, 182, 3400–3404. [Google Scholar] [CrossRef]
- McLaughlin, H.P.; Caly, D.L.; McCarthy, Y.; Ryan, R.P.; Dow, J.M. An Orphan Chemotaxis Sensor Regulates Virulence and Antibiotic Tolerance in the Human Pathogen Pseudomonas aeruginosa. PLoS ONE 2012, 7, e42205. [Google Scholar] [CrossRef] [PubMed]
- Martín-Mora, D.; Ortega, Á.; Pérez-Maldonado, F.J.; Krell, T.; Matilla, M.A. The Activity of the C4-Dicarboxylic Acid Chemoreceptor of Pseudomonas aeruginosa Is Controlled by Chemoattractants and Antagonists. Sci. Rep. 2018, 8, 2102. [Google Scholar] [CrossRef] [PubMed] [Green Version]
- Alvarez-Ortega, C.; Harwood, C.S. Identification of a Malate Chemoreceptor in Pseudomonas aeruginosa by Screening for Chemotaxis Defects in an Energy Taxis-Deficient Mutant. Appl. Environ. Microbiol. 2007, 73, 7793–7795. [Google Scholar] [CrossRef] [Green Version]
- Corral-Lugo, A.; Matilla, M.A.; Martín-Mora, D.; Silva Jiménez, H.; Mesa Torres, N.; Kato, J.; Hida, A.; Oku, S.; Conejero-Muriel, M.; Gavira, J.A.; et al. High-Affinity Chemotaxis to Histamine Mediated by the TlpQ Chemoreceptor of the Human Pathogen Pseudomonas aeruginosa. mBio 2018, 9, e01894-18. [Google Scholar] [CrossRef] [Green Version]
- Kim, H.E.; Shitashiro, M.; Kuroda, A.; Takiguchi, N.; Kato, J. Ethylene Chemotaxis in Pseudomonas aeruginosa and Other Pseudomonas Species. Microbes Environ. 2007, 22, 186–189. [Google Scholar] [CrossRef] [Green Version]
- Martín-Mora, D.; Ortega, Á.; Matilla, M.A.; Martínez-Rodríguez, S.; Gavira, J.A.; Krell, T. The Molecular Mechanism of Nitrate Chemotaxis via Direct Ligand Binding to the PilJ Domain of McpN. mBio 2019, 10, e02334-18. [Google Scholar] [CrossRef] [Green Version]
- O’Connor, J.R.; Kuwada, N.J.; Huangyutitham, V.; Wiggins, P.A.; Harwood, C.S. Surface Sensing and Lateral Subcellular Localization of WspA, the Receptor in a Chemosensory-like System Leading to c-Di-GMP Production. Mol. Microbiol. 2012, 86, 720–729. [Google Scholar] [CrossRef] [Green Version]
- Chen, A.I.; Dolben, E.F.; Okegbe, C.; Harty, C.E.; Golub, Y.; Thao, S.; Ha, D.G.; Willger, S.D.; O’Toole, G.A.; Harwood, C.S.; et al. Candida Albicans Ethanol Stimulates Pseudomonas aeruginosa WspR-Controlled Biofilm Formation as Part of a Cyclic Relationship Involving Phenazines. PLoS Pathog. 2014, 10, e1004480. [Google Scholar] [CrossRef] [Green Version]
- Taguchi, K.; Fukutomi, H.; Kuroda, A.; Kato, J.; Ohtake, H. Genetic Identification of Chemotactic Transducers for Amino Acids in Pseudomonas aeruginosa. Microbiology 1997, 143, 3223–3229. [Google Scholar] [CrossRef] [Green Version]
- Gavira, J.A.; Gumerov, V.M.; Rico-Jimenez, M.; Petukh, M.; Upadhyay, A.A.; Ortega, A.; Matilla, M.A.; Zhulin, I.B.; Krell, T. How Bacterial Chemoreceptors Evolve Novel Ligand Specificities. mBio 2020, 11, e03066-19. [Google Scholar] [CrossRef]
- Rico-Jiménez, M.; Muñoz-Martínez, F.; García-Fontana, C.; Fernandez, M.; Morel, B.; Ortega, A.; Ramos, J.L.; Krell, T. Paralogous Chemoreceptors Mediate Chemotaxis towards Protein Amino Acids and the Non-Protein Amino Acid Gamma-Aminobutyrate (GABA). Mol. Microbiol. 2013, 88, 1230–1243. [Google Scholar] [CrossRef] [PubMed]
- Kuroda, A.; Kumano, T.; Taguchi, K.; Nikata, T.; Kato, J.; Ohtake, H. Molecular Cloning and Characterization of a Chemotactic Transducer Gene in Pseudomonas aeruginosa. J. Bacteriol. 1995, 177, 7019–7025. [Google Scholar] [CrossRef] [PubMed] [Green Version]
- Reyes-Darias, J.A.; Garcia, V.; Rico-Jimenez, M.; Corral-Lugo, A.; Lesouhaitier, O.; Juarez-Hernandez, D.; Yang, Y.; Bi, S.; Feuilloley, M.; Munoz-Rojas, J.; et al. Specific Gamma-Aminobutyrate (GABA) Chemotaxis in Pseudomonads with Different Lifestyle. Mol. Microbiol. 2015, 96, 513–525. [Google Scholar] [CrossRef]
- Shitashiro, M.; Tanaka, H.; Hong, C.S.; Kuroda, A.; Takiguchi, N.; Ohtake, H.; Kato, J. Identification of Chemosensory Proteins for Trichloroethylene in Pseudomonas aeruginosa. J. Biosci. Bioeng. 2005, 99, 396–402. [Google Scholar] [CrossRef] [Green Version]
- Vangnai, A.S.; Takeuchi, K.; Oku, S.; Kataoka, N.; Nitisakulkan, T.; Tajima, T.; Kato, J. Identification of CtpL as a Chromosomally Encoded Chemoreceptor for 4-Chloroaniline and Catechol in Pseudomonas aeruginosa PAO1. Appl. Environ. Microbiol. 2013, 79, 7241–7248. [Google Scholar] [CrossRef] [Green Version]
- Martin-Mora, D.; Ortega, A.; Reyes-Darias, J.A.; Garcia, V.; Lopez-Farfan, D.; Matilla, M.A.; Krell, T. Identification of a Chemoreceptor in Pseudomonas aeruginosa That Specifically Mediates Chemotaxis Toward Alpha-Ketoglutarate. Front. Microbiol. 2016, 7, 1937. [Google Scholar] [CrossRef] [Green Version]
- Stover, C.K.; Pham, X.Q.; Erwin, A.L.; Mizoguchi, S.D.; Warrener, P.; Hickey, M.J.; Brinkman, F.S.; Hufnagle, W.O.; Kowalik, D.J.; Lagrou, M.; et al. Complete Genome Sequence of Pseudomonas aeruginosa PAO1, an Opportunistic Pathogen. Nature 2000, 406, 959–964. [Google Scholar] [CrossRef] [Green Version]
- Rico-Jimenez, M.; Reyes-Darias, J.A.; Ortega, A.; Diez Pena, A.I.; Morel, B.; Krell, T. Two Different Mechanisms Mediate Chemotaxis to Inorganic Phosphate in Pseudomonas aeruginosa. Sci. Rep. 2016, 6, 28967. [Google Scholar] [CrossRef]
- Li, W.; Lu, C.D. Regulation of Carbon and Nitrogen Utilization by CbrAB and NtrBC Two-Component Systems in Pseudomonas aeruginosa. J. Bacteriol. 2007, 189, 5413–5420. [Google Scholar] [CrossRef] [Green Version]
- Filloux, A.; Bally, M.; Soscia, C.; Murgier, M.; Lazdunski, A. Phosphate Regulation in Pseudomonas aeruginosa: Cloning of the Alkaline Phosphatase Gene and Identification of PhoB- and PhoR-like Genes. Mol. Gen. Genet. MGG 1988, 212, 510–513. [Google Scholar] [CrossRef]
- Faure, L.M.; Llamas, M.A.; Bastiaansen, K.C.; de Bentzmann, S.; Bigot, S. Phosphate Starvation Relayed by PhoB Activates the Expression of the Pseudomonas aeruginosa ΣvreI ECF Factor and Its Target Genes. Microbiology 2013, 159, 1315–1327. [Google Scholar] [CrossRef] [PubMed]
- Francis, V.I.; Porter, S.L. Multikinase Networks: Two-Component Signaling Networks Integrating Multiple Stimuli. Annu. Rev. Microbiol. 2019, 73, 199–223. [Google Scholar] [CrossRef]
- Li, G.-W.; Burkhardt, D.; Gross, C.; Weissman, J.S. Quantifying Absolute Protein Synthesis Rates Reveals Principles Underlying Allocation of Cellular Resources. Cell 2014, 157, 624–635. [Google Scholar] [CrossRef] [Green Version]
- Batchelor, E.; Goulian, M. Robustness and the Cycle of Phosphorylation and Dephosphorylation in a Two-Component Regulatory System. Proc. Natl. Acad. Sci. USA 2003, 100, 691–696. [Google Scholar] [CrossRef] [Green Version]
- Shinar, G.; Milo, R.; Martínez, M.R.; Alon, U. Input Output Robustness in Simple Bacterial Signaling Systems. Proc. Natl. Acad. Sci. USA 2007, 104, 19931–19935. [Google Scholar] [CrossRef] [Green Version]
- Miyashiro, T.; Goulian, M. High Stimulus Unmasks Positive Feedback in an Autoregulated Bacterial Signaling Circuit. Proc. Natl. Acad. Sci. USA 2008, 105, 17457–17462. [Google Scholar] [CrossRef] [Green Version]
- Li, M.; Hazelbauer, G.L. Cellular Stoichiometry of the Components of the Chemotaxis Signaling Complex. J. Bacteriol. 2004, 186, 3687–3694. [Google Scholar] [CrossRef] [Green Version]
- Huang, Z.; Pan, X.; Xu, N.; Guo, M. Bacterial Chemotaxis Coupling Protein: Structure, Function and Diversity. Microbiol. Res. 2019, 219, 40–48. [Google Scholar] [CrossRef]
- Hamer, R.; Chen, P.Y.; Armitage, J.P.; Reinert, G.; Deane, C.M. Deciphering Chemotaxis Pathways Using Cross Species Comparisons. BMC Syst. Biol. 2010, 4, 3. [Google Scholar] [CrossRef] [Green Version]
- Buensuceso, R.N.C.; Daniel-Ivad, M.; Kilmury, S.L.N.; Leighton, T.L.; Harvey, H.; Howell, P.L.; Burrows, L.L. Cyclic AMP-Independent Control of Twitching Motility in Pseudomonas aeruginosa. J. Bacteriol. 2017, 199, e00188-17. [Google Scholar] [CrossRef]
- Silversmith, R.E.; Wang, B.; Fulcher, N.B.; Wolfgang, M.C.; Bourret, R.B. Phosphoryl Group Flow within the Pseudomonas aeruginosa Pil-Chp Chemosensory System: Differential Function of the Eight Phosphotransferase and Three Receiver Domains. J. Biol. Chem. 2016, 291, 17677–17691. [Google Scholar] [CrossRef] [PubMed] [Green Version]
- Parkinson, J.S.; Hazelbauer, G.L.; Falke, J.J. Signaling and Sensory Adaptation in Escherichia coli Chemoreceptors: 2015 Update. Trends Microbiol. 2015, 23, 257–266. [Google Scholar] [CrossRef] [PubMed] [Green Version]
- Elbourne, L.D.; Tetu, S.G.; Hassan, K.A.; Paulsen, I.T. TransportDB 2.0: A Database for Exploring Membrane Transporters in Sequenced Genomes from All Domains of Life. Nucleic Acids Res. 2017, 45, D320–D324. [Google Scholar] [CrossRef] [PubMed]
- Hoshino, T.; Kose-Terai, K.; Sato, K. Solubilization and Reconstitution of the Pseudomonas aeruginosa High Affinity Branched-Chain Amino Acid Transport System. J. Biol. Chem. 1992, 267, 21313–21318. [Google Scholar] [CrossRef] [PubMed]
- Lu, C.D.; Itoh, Y.; Nakada, Y.; Jiang, Y. Functional Analysis and Regulation of the Divergent SpuABCDEFGH-SpuI Operons for Polyamine Uptake and Utilization in Pseudomonas aeruginosa PAO1. J. Bacteriol. 2002, 184, 3765–3773. [Google Scholar] [CrossRef] [Green Version]
- Zhou, L.; Wang, J.; Zhang, L.H. Modulation of Bacterial Type III Secretion System by a Spermidine Transporter Dependent Signaling Pathway. PLoS ONE 2007, 2, e1291. [Google Scholar] [CrossRef]
- Madhusudhan, K.T.; McLaughlin, R.; Komori, N.; Matsumoto, H. Identification of a Major Protein upon Phosphate Starvation of Pseudomonas aeruginosa PAO1. J. Basic Microbiol. 2003, 43, 36–46. [Google Scholar] [CrossRef]
- Pletzer, D.; Lafon, C.; Braun, Y.; Kohler, T.; Page, M.G.; Mourez, M.; Weingart, H. High-Throughput Screening of Dipeptide Utilization Mediated by the ABC Transporter DppBCDF and Its Substrate-Binding Proteins DppA1-A5 in Pseudomonas aeruginosa. PLoS ONE 2014, 9, e111311. [Google Scholar] [CrossRef] [Green Version]
- Colin, R.; Ni, B.; Laganenka, L.; Sourjik, V. Multiple Functions of Flagellar Motility and Chemotaxis in Bacterial Physiology. FEMS Microbiol. Rev. 2021, 45, fuab038. [Google Scholar] [CrossRef]
- Kühn, M.J.; Talà, L.; Inclan, Y.F.; Patino, R.; Pierrat, X.; Vos, I.; Al-Mayyah, Z.; Macmillan, H.; Negrete, J., Jr.; Engel, J.N.; et al. Mechanotaxis Directs Pseudomonas aeruginosa Twitching Motility. Proc. Natl. Acad. Sci. USA 2021, 118, e2101759118. [Google Scholar] [CrossRef]
- Persat, A.; Inclan, Y.F.; Engel, J.N.; Stone, H.A.; Gitai, Z. Type IV Pili Mechanochemically Regulate Virulence Factors in Pseudomonas aeruginosa. Proc. Natl. Acad. Sci. USA 2015, 112, 7563–7568. [Google Scholar] [CrossRef] [Green Version]
- Whitchurch, C.B.; Leech, A.J.; Young, M.D.; Kennedy, D.; Sargent, J.L.; Bertrand, J.J.; Semmler, A.B.; Mellick, A.S.; Martin, P.R.; Alm, R.A.; et al. Characterization of a Complex Chemosensory Signal Transduction System Which Controls Twitching Motility in Pseudomonas aeruginosa. Mol. Microbiol. 2004, 52, 873–893. [Google Scholar] [CrossRef]
- Levit, M.N.; Grebe, T.W.; Stock, J.B. Organization of the Receptor-Kinase Signaling Array That Regulates Escherichia coli Chemotaxis. J. Biol. Chem. 2002, 277, 36748–36754. [Google Scholar] [CrossRef] [Green Version]
- Erbse, A.H.; Falke, J.J. The Core Signaling Proteins of Bacterial Chemotaxis Assemble To Form an Ultrastable Complex. Biochemistry 2009, 48, 6975–6987. [Google Scholar] [CrossRef] [Green Version]
- Briegel, A.; Li, X.; Bilwes, A.M.; Hughes, K.T.; Jensen, G.J.; Crane, B.R. Bacterial Chemoreceptor Arrays Are Hexagonally Packed Trimers of Receptor Dimers Networked by Rings of Kinase and Coupling Proteins. Proc. Natl. Acad. Sci. USA 2012, 109, 3766–3771. [Google Scholar] [CrossRef] [Green Version]
- Bonn, F.; Bartel, J.; Buttner, K.; Hecker, M.; Otto, A.; Becher, D. Picking Vanished Proteins from the Void: How to Collect and Ship/Share Extremely Dilute Proteins in a Reproducible and Highly Efficient Manner. Anal. Chem. 2014, 86, 7421–7427. [Google Scholar] [CrossRef]
- Schwanhausser, B.; Busse, D.; Li, N.; Dittmar, G.; Schuchhardt, J.; Wolf, J.; Chen, W.; Selbach, M. Global Quantification of Mammalian Gene Expression Control. Nature 2011, 473, 337–342. [Google Scholar] [CrossRef] [Green Version]
- Abril, M.A.; Michan, C.; Timmis, K.N.; Ramos, J.L. Regulator and Enzyme Specificities of the TOL Plasmid-Encoded Upper Pathway for Degradation of Aromatic Hydrocarbons and Expansion of the Substrate Range of the Pathway. J. Bacteriol. 1989, 171, 6782–6790. [Google Scholar] [CrossRef] [Green Version]
- Vizcaino, J.A.; Csordas, A.; Del-Toro, N.; Dianes, J.A.; Griss, J.; Lavidas, I.; Mayer, G.; Perez-Riverol, Y.; Reisinger, F.; Ternent, T.; et al. 2016 Update of the PRIDE Database and Its Related Tools. Nucleic Acids Res. 2016, 44, 11033. [Google Scholar] [CrossRef]


| Most/Least Abundant Chemoreceptors | iBAQ Value | Ligand/Comment | Ratio Most/ Least Abundant |
|---|---|---|---|
| Total chemoreceptors in LB | |||
| Most: PA0411 (PilJ) | 4,885,246 | Stimulates Chp pathway | 1370 |
| Least: PA2573 | 3565 | Unknown/involved in virulence | |
| Total chemoreceptors in minimal medium + 1 mM Pi | |||
| Most: PA0176 (McpB/Aer2) | 5,022,589 | Oxygen/stimulates Che2 pathway | 1408 |
| Least: PA1608 | 3566 | Unknown | |
| Total chemoreceptors in minimal medium + 0.2 mM Pi | |||
| Most: PA0176 (McpB/Aer2) | 15,545,568 | Oxygen/stimulates Che2 pathway | 2420 |
| Least: PA1608 | 6.422 | Unknown | |
| Chemotaxis chemoreceptors in LB | |||
| Most: PA1561 (Aer) | 2,111,738 | Oxygen/aerotaxis | 592 |
| Least: PA2573 | 3565 | Unknown/involved in virulence | |
| Chemotaxis chemoreceptors in minimal medium + 1 mM Pi | |||
| Most: PA1423 (BdlA) | 1,185,289 | Unknown/involved in biofilm dispersion | 332 |
| Least: PA1608 | 3566 | Unknown | |
| Chemotaxis chemoreceptors in minimal medium + 0.2 mM Pi | |||
| Most: PA1930 | 763,954 | Unknown | 119 |
| Least: PA1608 | 6422 | Unknown | |
| Signaling Protein | MM + 0.2 mM Pi | MM + 1 mM Pi | LB |
|---|---|---|---|
| Chemoreceptors | |||
| Che receptors vs. CheA1 a | 0.25 | 0.28 | 0.4 |
| McpB/Aer2 vs. CheA2 | 8.2 | 4.3 | 32 |
| PilJ vs. CheA4 | 9.0 | 6.0 | 3.8 |
| Coupling proteins | |||
| CheW1 vs. CheA1 | 5.6 | 3.4 | 3.9 |
| CheV vs. CheA1 | 3.1 | 1.6 | 1.0 |
| CheW2 vs. CheA2 | 0.67 | 0.1 | - b |
| CheW4-1 vs. CheA4 | 16.9 | 3.7 | 5.1 |
| CheW4-2 vs. CheA4 | 26.9 | 4.5 | 5.3 |
| Response regulator homologs | |||
| CheY1 vs. CheA1 | 0.19 | 0.26 | 0.32 |
| CheY2 vs. CheA2 | 1.7 | 0.47 | 4.1 |
| PilG (CheY4-1) vs. CheA4 | 99 | 24 | 24 |
| PilH (CheY4-2) vs. CheA4 | 71 | 17 | 15 |
| CheB1 vs. CheA1 | 0.35 | 0.81 | 0.76 |
| CheB2 vs. CheA2 | 0.16 | 0.38 | - b |
| CheB4 vs. CheA4 | - b | 0.74 | 0.93 |
| CheR | |||
| CheR1 vs. CheA1 | 0.39 | 0.87 | 0.95 |
| CheR4 vs. CheA4 | - b | 0.29 | - b |
Disclaimer/Publisher’s Note: The statements, opinions and data contained in all publications are solely those of the individual author(s) and contributor(s) and not of MDPI and/or the editor(s). MDPI and/or the editor(s) disclaim responsibility for any injury to people or property resulting from any ideas, methods, instructions or products referred to in the content. |
© 2023 by the authors. Licensee MDPI, Basel, Switzerland. This article is an open access article distributed under the terms and conditions of the Creative Commons Attribution (CC BY) license (https://creativecommons.org/licenses/by/4.0/).
Share and Cite
Matilla, M.A.; Genova, R.; Martín-Mora, D.; Maaβ, S.; Becher, D.; Krell, T. The Cellular Abundance of Chemoreceptors, Chemosensory Signaling Proteins, Sensor Histidine Kinases, and Solute Binding Proteins of Pseudomonas aeruginosa Provides Insight into Sensory Preferences and Signaling Mechanisms. Int. J. Mol. Sci. 2023, 24, 1363. https://doi.org/10.3390/ijms24021363
Matilla MA, Genova R, Martín-Mora D, Maaβ S, Becher D, Krell T. The Cellular Abundance of Chemoreceptors, Chemosensory Signaling Proteins, Sensor Histidine Kinases, and Solute Binding Proteins of Pseudomonas aeruginosa Provides Insight into Sensory Preferences and Signaling Mechanisms. International Journal of Molecular Sciences. 2023; 24(2):1363. https://doi.org/10.3390/ijms24021363
Chicago/Turabian StyleMatilla, Miguel A., Roberta Genova, David Martín-Mora, Sandra Maaβ, Dörte Becher, and Tino Krell. 2023. "The Cellular Abundance of Chemoreceptors, Chemosensory Signaling Proteins, Sensor Histidine Kinases, and Solute Binding Proteins of Pseudomonas aeruginosa Provides Insight into Sensory Preferences and Signaling Mechanisms" International Journal of Molecular Sciences 24, no. 2: 1363. https://doi.org/10.3390/ijms24021363