
Cerebral Folate Metabolism in Post-Mortem Alzheimer’s Disease Tissues: A Small Cohort Study

 , ,
, ,  , and
, and 
Abstract
:1. Introduction
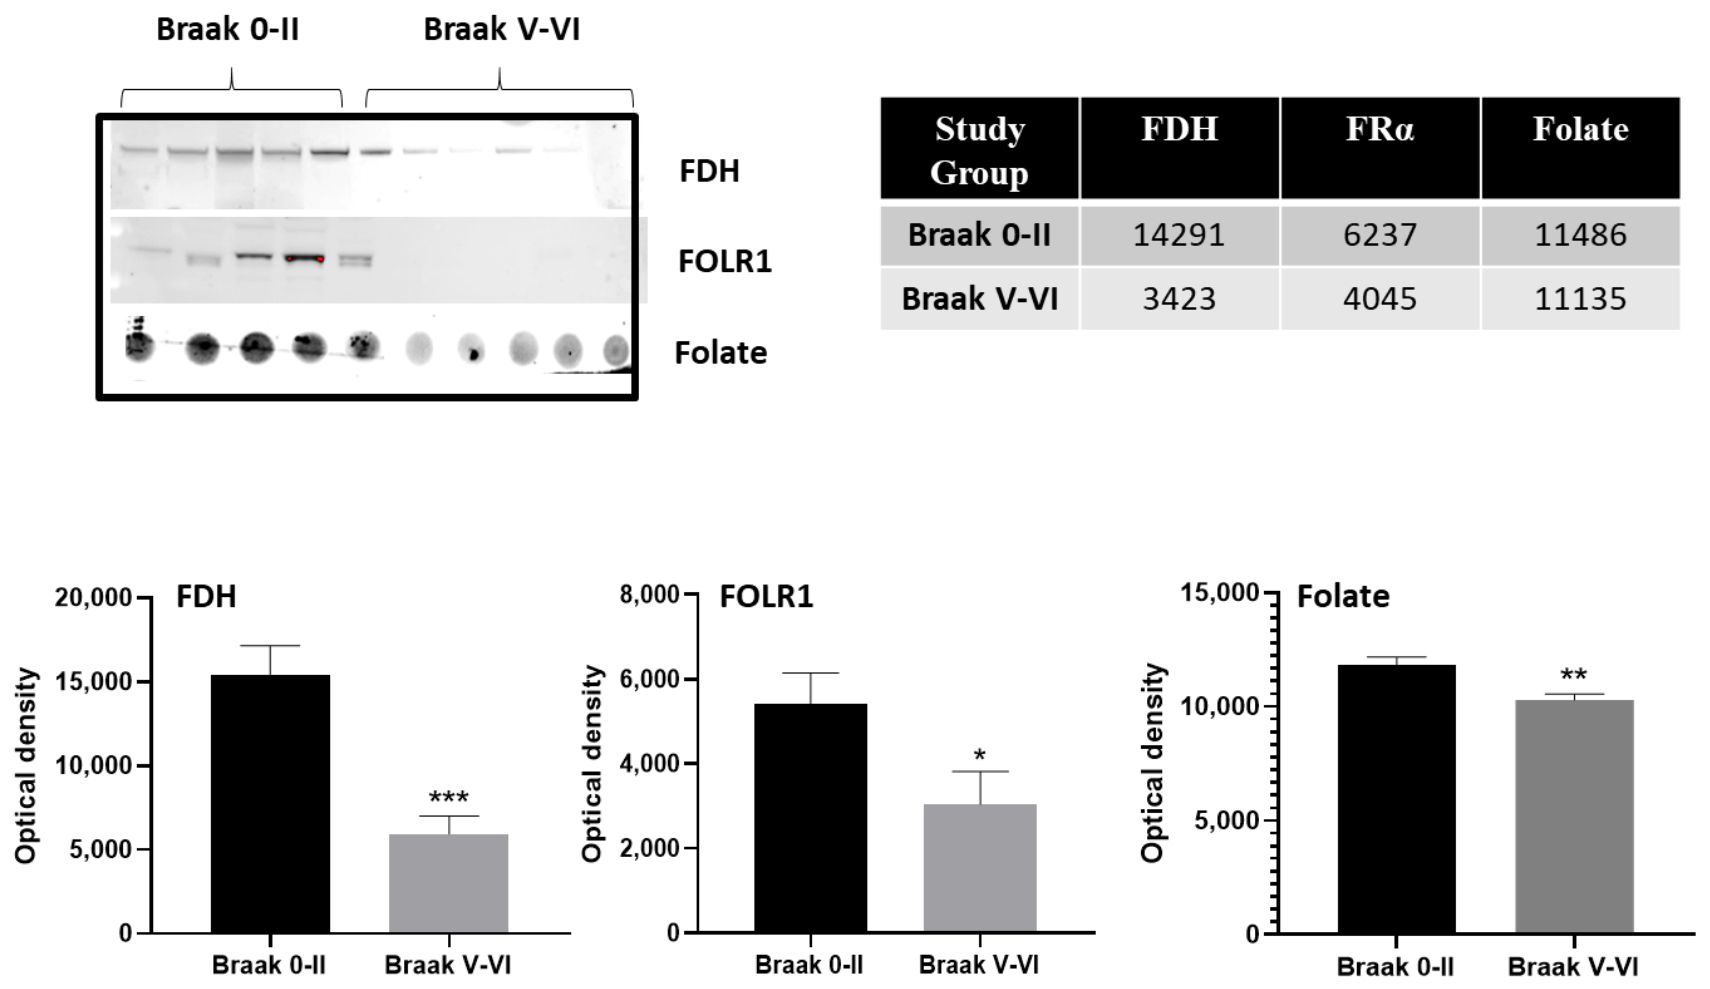
2. Results
2.1. Cerebrospinal Fluid (CSF) Analysis
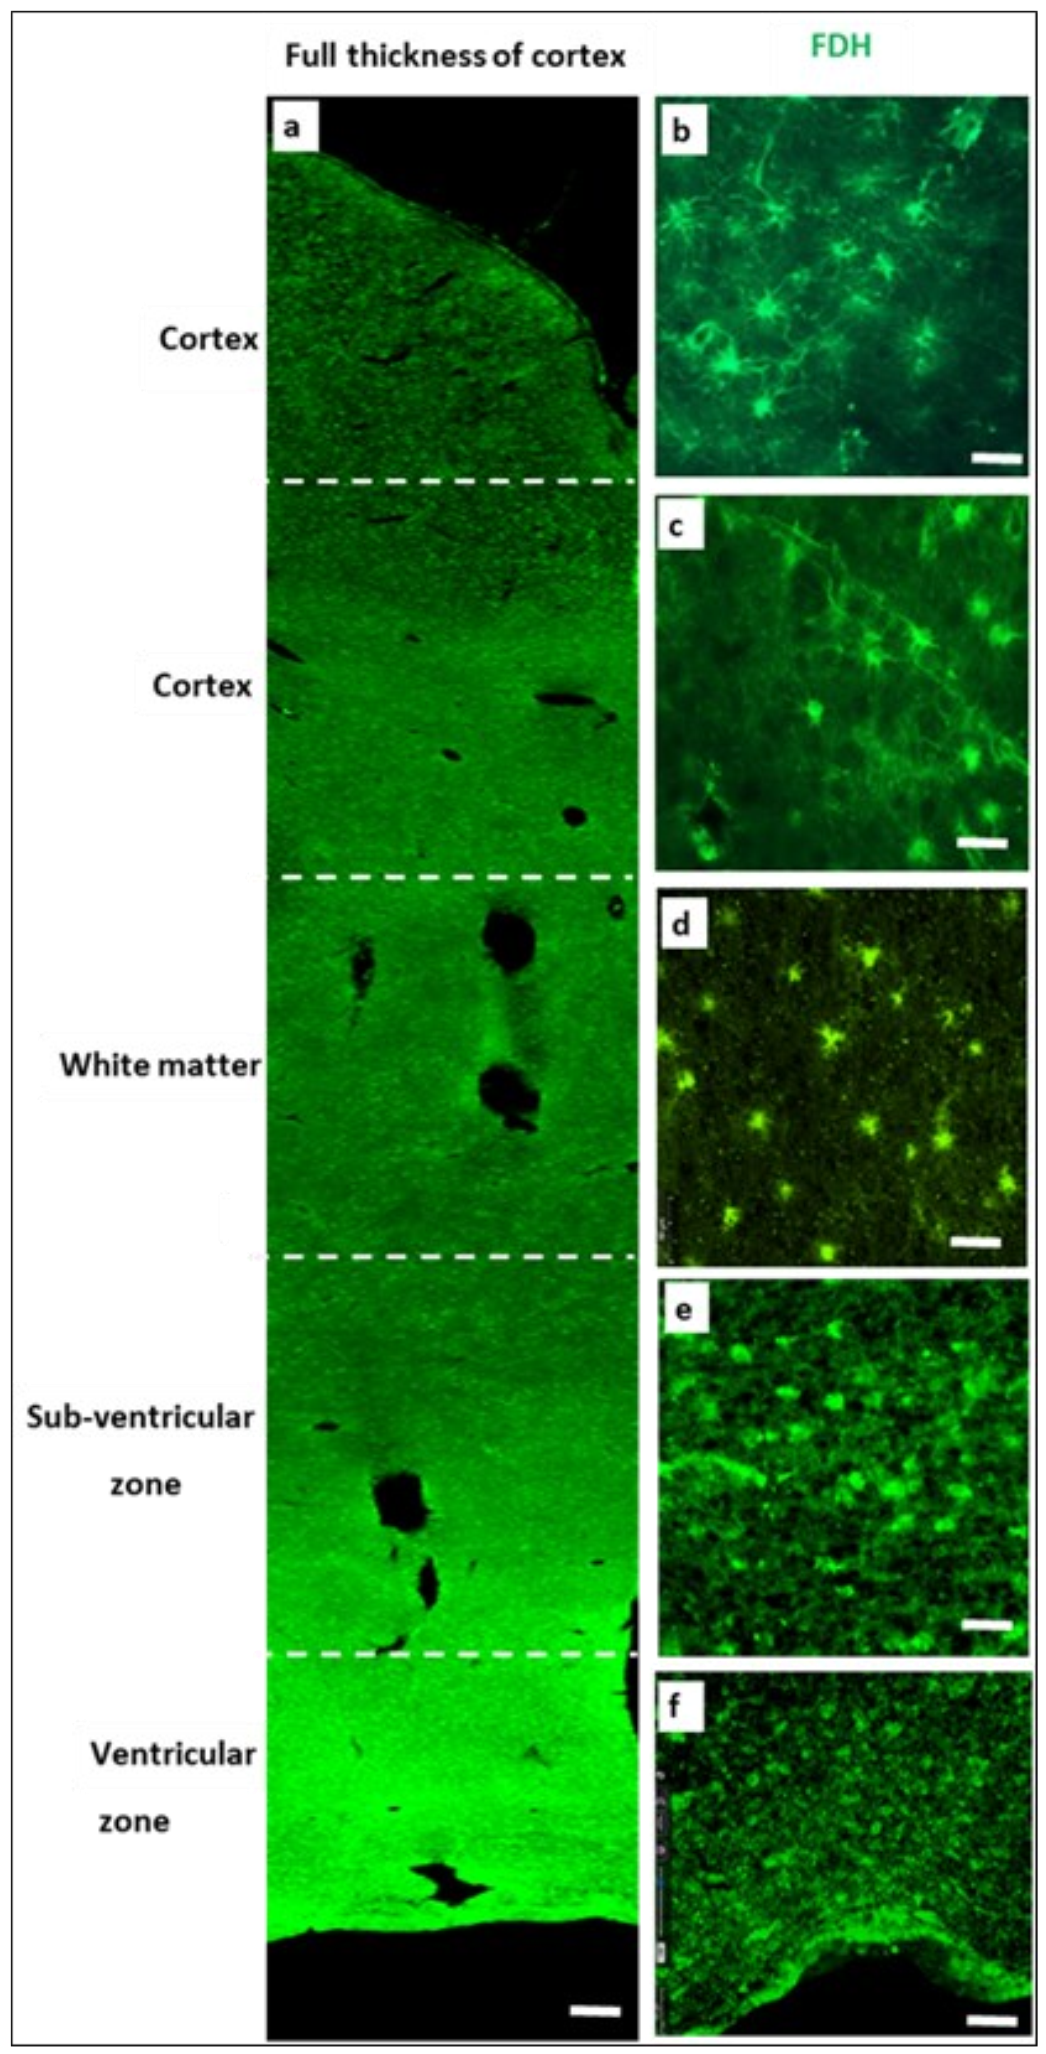
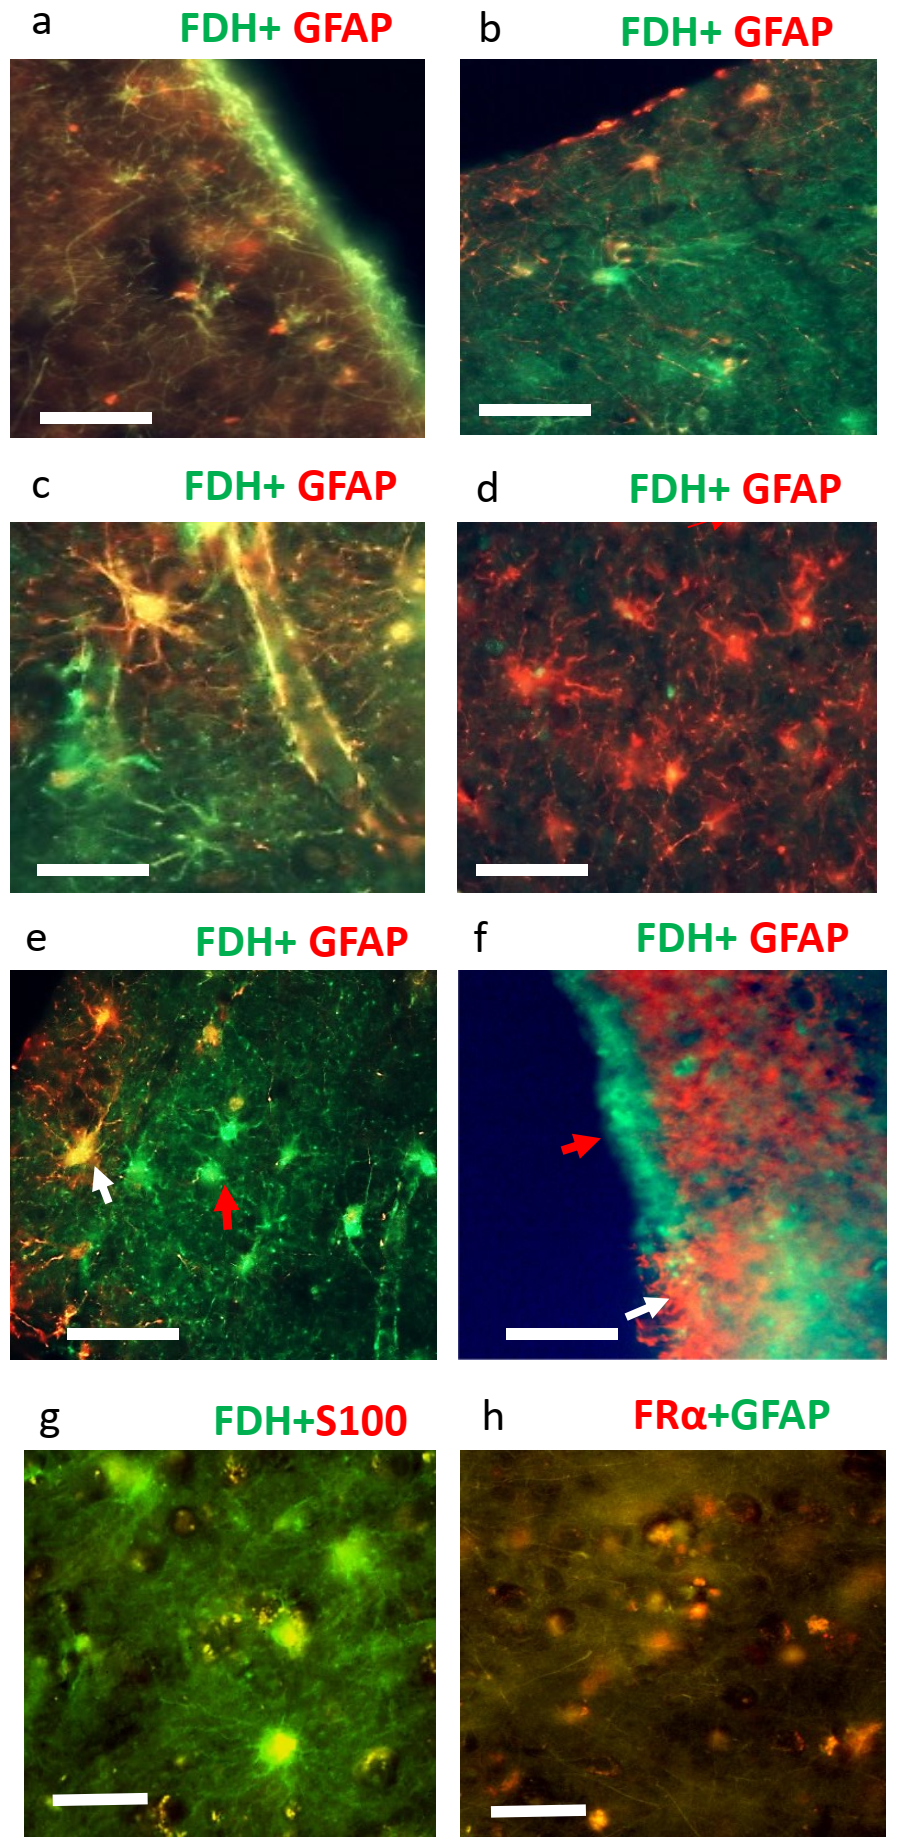
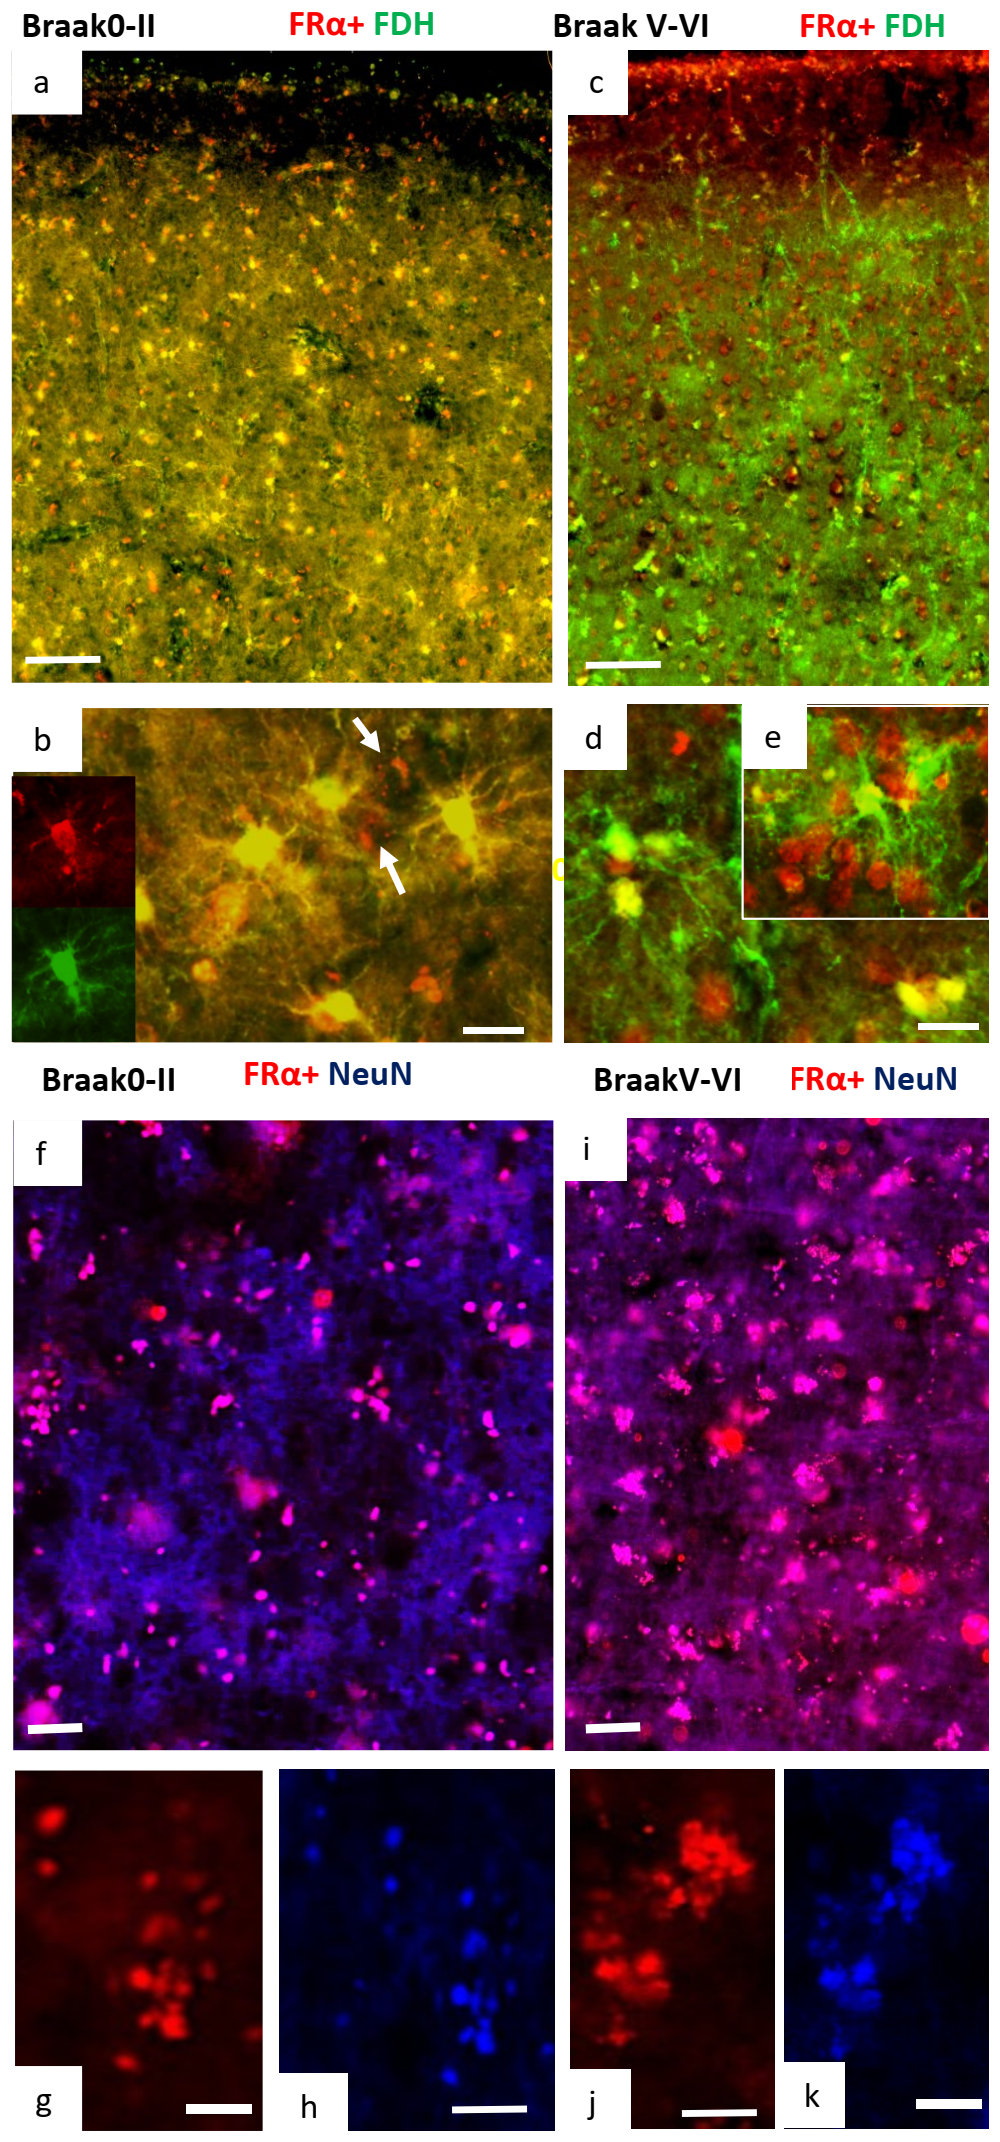
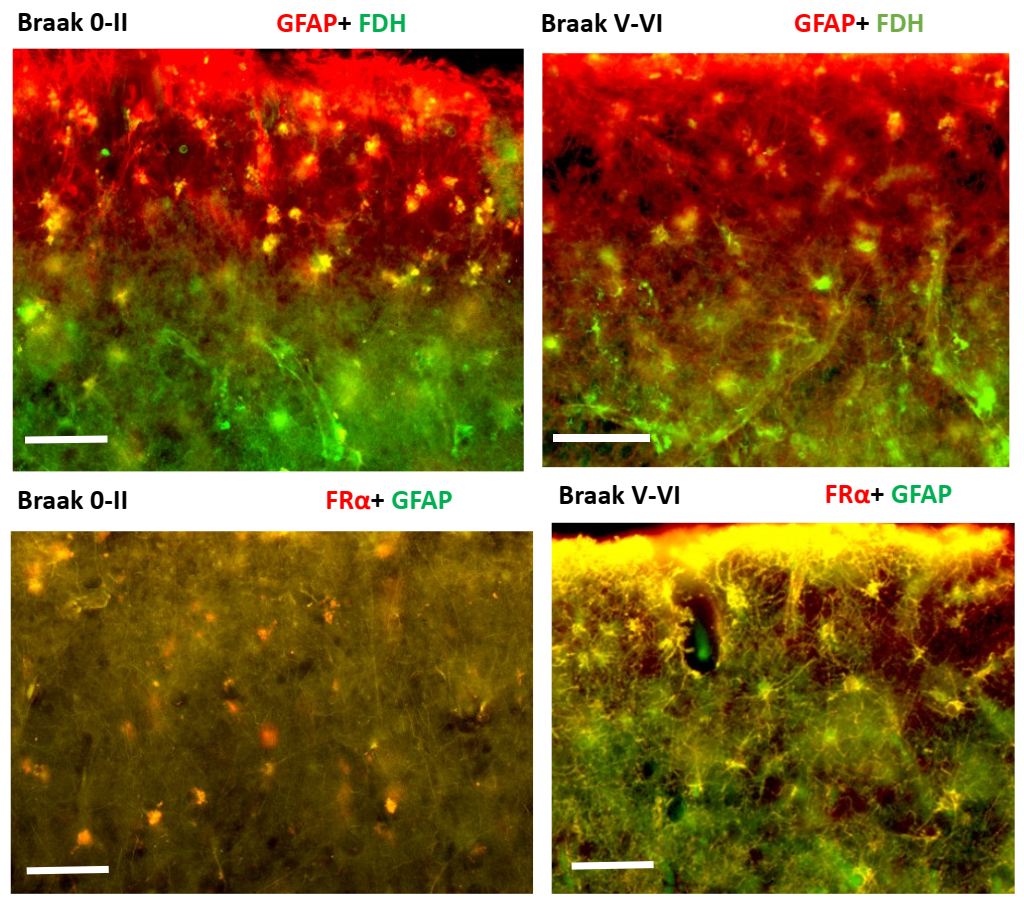
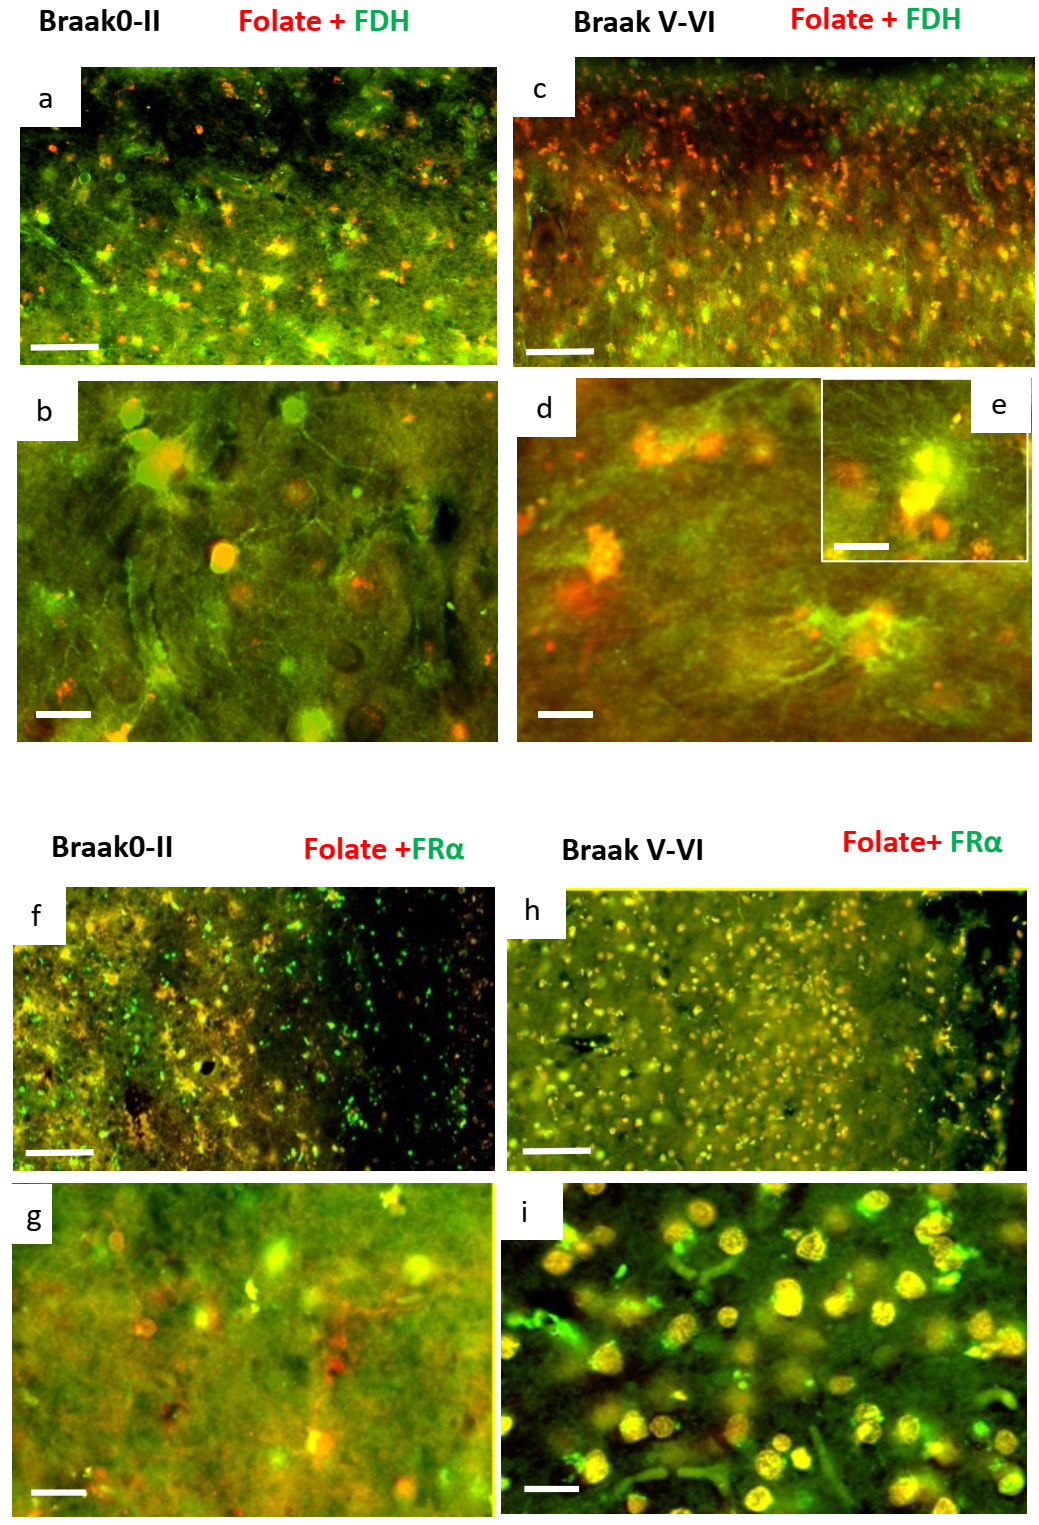
2.2. Immunohistochemistry for Cerebral Cortex
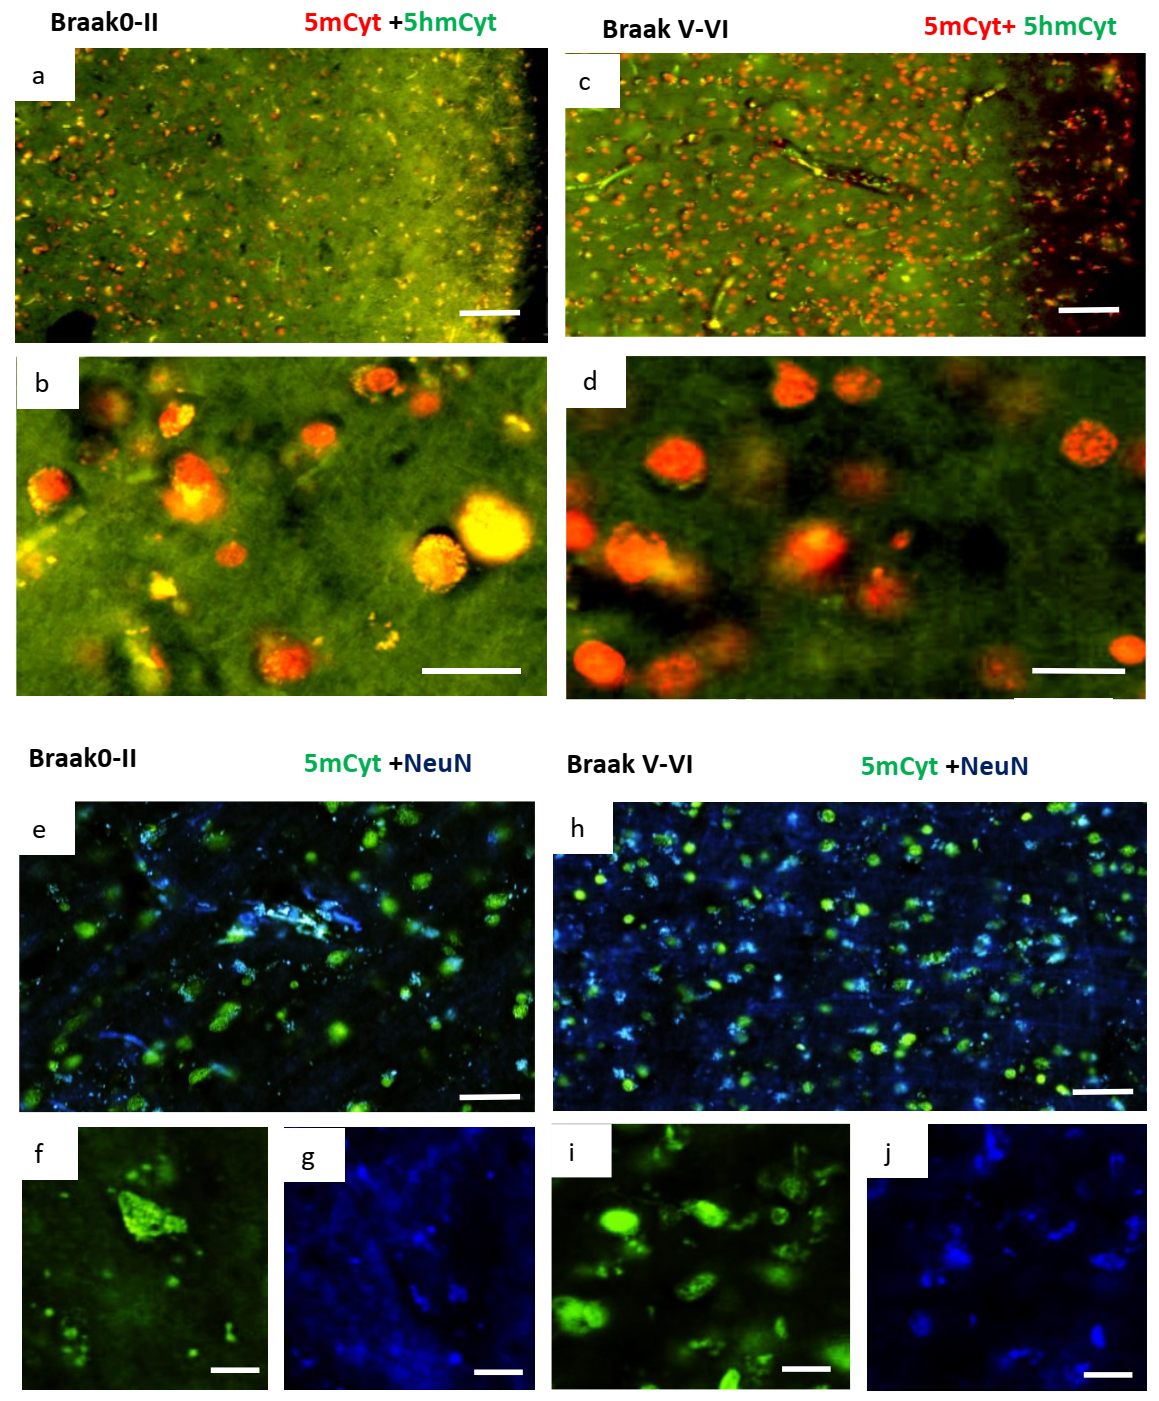
2.3. Changes in Methylation in Neuronal Cells of Alzheimer’s Disease Brain
3. Discussion
4. Materials and Methods
4.1. Brain Tissue
4.2. Western and Dot Blots
4.3. Immunohistochemistry
4.4. Statistical Analysis
5. Conclusions
Limitations of the Current Study
Supplementary Materials
Author Contributions
Funding
Institutional Review Board Statement
Data Availability Statement
Acknowledgments
Conflicts of Interest
Abbreviations
| AD | Alzheimer’s disease |
| FOLR1 and FRα | folate receptor alpha |
| ALDH1L1 and FDH | 10-formyl tetrahydrofolate dehydrogenase |
| MTR | methionine synthase with full name: 5-methyltetrahydrofolate-homocysteine methyltransferase |
| MTRR | methionine synthase reductase, full name: methionine synthase-cobalamin methyltransferase |
| MTHFD1 | methylene tetrahydrofolate dehydrogenase 1 |
| DHFR | dihydrofolate reductase |
| MTHFR | methylene tetrahydrofolate reductase |
| 5mTHF | 5 methyl tetrahydrofolate |
| GFAP | glial fibrillary acidic protein |
| 5mCyt | 5 methyl cytosine |
| 5HmCyt | 5 hydroxy methyl cytosine |
References
- Ferri, C.P.; Prince, M.; Brayne, C.; Brodaty, H.; Fratiglioni, L.; Ganguli, M.; Hall, K.; Hasegawa, K.; Hendrie, H.; Huang, Y.; et al. Global prevalence of dementia: A Delphi consensus study. Lancet 2005, 366, 2112–2117. [Google Scholar] [CrossRef] [PubMed]
- Liu, P.-P.; Xie, Y.; Meng, X.-Y.; Kang, J.-S. History and progress of hypotheses and clinical trials for Alzheimer’s disease. Signal Transduct. Target. Ther. 2019, 4, 1–22. [Google Scholar] [CrossRef] [PubMed] [Green Version]
- Oberman, K.; Gouweleeuw, L.; Hoogerhout, P.; Eisel, U.L.; van Riet, E.; Schoemaker, R.G. Vaccination Prevented Short-Term Memory Loss, but Deteriorated Long-Term Spatial Memory in Alzheimer’s Disease Mice, Independent of Amyloid-beta Pathology. J. Alzheimer’s Dis. Rep. 2020, 4, 261–280. [Google Scholar] [CrossRef] [PubMed]
- Mantile, F.; Prisco, A. Vaccination against β-Amyloid as a Strategy for the Prevention of Alzheimer’s Disease. Biology 2020, 9, 425. [Google Scholar] [CrossRef]
- Stoiljkovic, M.; Horvath, T.L.; Hajós, M. Therapy for Alzheimer’s disease: Missing targets and functional markers? Ageing Res. Rev. 2021, 68, 101318. [Google Scholar] [CrossRef]
- Steinfeld, R.; Grapp, M.; Kraetzner, R.; Dreha-Kulaczewski, S.; Helms, G.; Dechent, P.; Wevers, R.; Grosso, S.; Gärtner, J. Folate Receptor Alpha Defect Causes Cerebral Folate Transport Deficiency: A Treatable Neurodegenerative Disorder Associated with Disturbed Myelin Metabolism. Am. J. Hum. Genet. 2009, 85, 354–363. [Google Scholar] [CrossRef] [Green Version]
- Krupenko, S.A.; Krupenko, N.I. Loss of ALDH1L1 folate enzyme confers a selective metabolic advantage for tumor progression. Chem. Interact. 2019, 302, 149–155. [Google Scholar] [CrossRef]
- Krupenko, S.A.; Krupenko, N.I. ALDH1L1 and ALDH1L2 Folate Regulatory Enzymes in Cancer. Adv. Exp. Med. Biol. 2018, 1032, 127–143. [Google Scholar] [CrossRef]
- Krupenko, S.A.; Horita, D.A. The Role of Single-Nucleotide Polymorphisms in the Function of Candidate Tumor Suppressor ALDH1L1. Front. Genet. 2019, 10, 1013. [Google Scholar] [CrossRef]
- Oleinik, N.V.; Krupenko, N.; A Krupenko, S. ALDH1L1 inhibits cell motility via dephosphorylation of cofilin by PP1 and PP2A. Oncogene 2010, 29, 6233–6244. [Google Scholar] [CrossRef]
- Ramaekers, V.; Segers, K.; Sequeira, J.; Koenig, M.; Van Maldergem, L.; Bours, V.; Kornak, U.; Quadros, E. Genetic assessment and folate receptor autoantibodies in infantile-onset cerebral folate deficiency (CFD) syndrome. Mol. Genet. Metab. 2018, 124, 87–93. [Google Scholar] [CrossRef] [PubMed]
- Ramaekers, V.T.; Quadros, E.V.; Sequeira, J.M. Role of folate receptor autoantibodies in infantile autism. Mol. Psychiatry 2012, 18, 270–271. [Google Scholar] [CrossRef] [PubMed] [Green Version]
- Hasselmann, O.; Blau, N.; Ramaekers, V.T.; Quadros, E.V.; Sequeira, J.; Weissert, M. Cerebral folate deficiency and CNS inflammatory markers in Alpers disease. Mol. Genet. Metab. 2010, 99, 58–61. [Google Scholar] [CrossRef]
- Bonkowsky, J.L.; Ramaekers, V.T.; Quadros, E.V.; Lloyd, M. Progressive encephalopathy in a child with cerebral folate deficiency syndrome. J. Child Neurol. 2008, 23, 1460–1463. [Google Scholar] [CrossRef] [PubMed] [Green Version]
- Ramaekers, V.T.; Blau, N.; Sequeira, J.M.; Nassogne, M.-C.; Quadros, E.V. Folate Receptor Autoimmunity and Cerebral Folate Deficiency in Low-Functioning Autism with Neurological Deficits. Neuropediatrics 2007, 38, 276–281. [Google Scholar] [CrossRef] [Green Version]
- Ramaekers, V.T.; Rothenberg, S.P.; Sequeira, J.M.; Opladen, T.; Blau, N.; Quadros, E.V.; Selhub, J. Autoantibodies to Folate Receptors in the Cerebral Folate Deficiency Syndrome. N. Engl. J. Med. 2005, 352, 1985–1991. [Google Scholar] [CrossRef] [Green Version]
- Frye, R.E.; Delhey, L.; Slattery, J.; Tippett, M.; Wynne, R.; Rose, S.; Kahler, S.G.; Bennuri, S.C.; Melnyk, S.; Sequeira, J.M.; et al. Blocking and Binding Folate Receptor Alpha Autoantibodies Identify Novel Autism Spectrum Disorder Subgroups. Front. Neurosci. 2016, 10, 80. [Google Scholar] [CrossRef] [Green Version]
- Frye, R.E.; Sequeira, J.M.; Quadros, E.V.; James, S.J.; Rossignol, D.A. Cerebral folate receptor autoantibodies in autism spectrum disorder. Mol. Psychiatry 2013, 18, 369–381. [Google Scholar] [CrossRef]
- Cains, S.; Shepherd, A.; Nabiuni, M.; Owen-Lynch, P.J.; Miyan, J. Addressing a Folate Imbalance in Fetal Cerebrospinal Fluid Can Decrease the Incidence of Congenital Hydrocephalus. J. Neuropathol. Exp. Neurol. 2009, 68, 404–416. [Google Scholar] [CrossRef] [Green Version]
- Miyan, J.; Buttercase, C.; Beswick, E.; Miyan, S.; Moshkdanian, G.; Naz, N. Folate Related Pathway Gene Analysis Reveals a Novel Metabolic Variant Associated with Alzheimer’s Disease with a Change in Metabolic Profile. Metabolites 2022, 12, 475. [Google Scholar] [CrossRef]
- Silverberg, G.D. The cerebrospinal fluid production rate is reduced in dementia of the Alzheimer’s type. Neurology 2001, 57, 1763–1766. [Google Scholar] [CrossRef] [PubMed]
- Silverberg, G.; Mayo, M.; Saul, T.; Fellmann, J.; McGuire, D. Elevated cerebrospinal fluid pressure in patients with Alzheimer’s disease. Cereb. Fluid Res. 2006, 3, 7. [Google Scholar] [CrossRef] [Green Version]
- Ott, B.R.; Cohen, R.A.; Gongvatana, A.; Okonkwo, O.C.; Johanson, C.E.; Stopa, E.G.; Donahue, J.E.; Silverberg, G.D. Brain Ventricular Volume and Cerebrospinal Fluid Biomarkers of Alzheimer’s Disease. J. Alzheimer’s Dis. 2010, 20, 647–657. [Google Scholar] [CrossRef] [PubMed] [Green Version]
- Chiu, C.; Miller, M.C.; Caralopoulos, I.N.; Worden, M.S.; Brinker, T.; Gordon, Z.N.; Johanson, C.; Silverberg, G.D. Temporal course of cerebrospinal fluid dynamics and amyloid accumulation in the aging rat brain from three to thirty months. Fluids Barriers CNS 2012, 9, 3. [Google Scholar] [CrossRef] [PubMed] [Green Version]
- Shen, M.D. Cerebrospinal fluid and the early brain development of autism. J. Neurodev. Disord. 2018, 10, 39. [Google Scholar] [CrossRef] [Green Version]
- Shen, M.D.; Nordahl, C.W.; Li, D.D.; Lee, A.; Angkustsiri, K.; Emerson, R.W.; Rogers, S.J.; Ozonoff, S.; Amaral, D.G. Extra-axial cerebrospinal fluid in high-risk and normal-risk children with autism aged 2–4 years: A case-control study. Lancet Psychiatry 2018, 5, 895–904. [Google Scholar] [CrossRef]
- Shen, M.D.; Kim, S.H.; McKinstry, R.C.; Gu, H.; Hazlett, H.C.; Nordahl, C.W.; Emerson, R.W.; Shaw, D.; Elison, J.T.; Swanson, M.R.; et al. Increased Extra-axial Cerebrospinal Fluid in High-Risk Infants Who Later Develop Autism. Biol. Psychiatry 2017, 82, 186–193. [Google Scholar] [CrossRef]
- Movsas, T.Z.; Pinto-Martin, J.A.; Whitaker, A.H.; Feldman, J.F.; Lorenz, J.M.; Korzeniewski, S.J.; Levy, S.E.; Paneth, N. Autism Spectrum Disorder Is Associated with Ventricular Enlargement in a Low Birth Weight Population. J. Pediatr. 2013, 163, 73–78. [Google Scholar] [CrossRef] [Green Version]
- Nestor, S.M.; Rupsingh, R.; Borrie, M.; Smith, M.; Accomazzi, V.; Wells, J.L.; Fogarty, J.; Bartha, R.; Initiative, T.A.D.N. Ventricular enlargement as a possible measure of Alzheimer’s disease progression validated using the Alzheimer’s disease neuroimaging initiative database. Brain 2008, 131, 2443–2454. [Google Scholar] [CrossRef] [Green Version]
- Chou, Y.-Y.; Leporé, N.; Avedissian, C.; Madsen, S.K.; Parikshak, N.; Hua, X.; Shaw, L.M.; Trojanowski, J.Q.; Weiner, M.W.; Toga, A.W.; et al. Mapping correlations between ventricular expansion and CSF amyloid and tau biomarkers in 240 subjects with Alzheimer’s disease, mild cognitive impairment and elderly controls. Neuroimage 2009, 46, 394–410. [Google Scholar] [CrossRef]
- Madsen, S.K.; (Adni), F.T.A.D.N.I.; Gutman, B.A.; Joshi, S.H.; Toga, A.W.; Jack, C.R.; Weiner, M.W.; Thompson, P.M. Mapping Dynamic Changes in Ventricular Volume onto Baseline Cortical Surfaces in Normal Aging, MCI, and Alzheimer’s Disease. Multimodal. Brain Image Anal. 2013, 8159, 84–94. [Google Scholar] [CrossRef] [Green Version]
- Ye, B.S.; Lee, Y.; Kwak, K.; Park, Y.-H.; Ham, J.H.; Lee, J.J.; Shin, N.-Y.; Lee, J.-M.; Sohn, Y.H.; Lee, P.H. Posterior Ventricular Enlargement to Differentiate Dementia with Lewy Bodies from Alzheimer’s Disease. J. Alzheimer’s Dis. 2016, 52, 1237–1243. [Google Scholar] [CrossRef]
- Mahajan, U.V.; Varma, V.R.; Griswold, M.E.; Blackshear, C.T.; An, Y.; Oommen, A.M.; Varma, S.; Troncoso, J.C.; Pletnikova, O.; O’Brien, R.; et al. Dysregulation of multiple metabolic networks related to brain transmethylation and polyamine pathways in Alzheimer disease: A targeted metabolomic and transcriptomic study. PLoS Med. 2020, 17, e1003012. [Google Scholar] [CrossRef]
- Cao, X.; Wolf, A.; Kim, S.-E.; Cabrera, R.M.; Wlodarczyk, B.J.; Zhu, H.; Parker, M.; Lin, Y.; Steele, J.W.; Han, X.; et al. CIC de novo loss of function variants contribute to cerebral folate deficiency by downregulating FOLR1 expression. J. Med. Genet. 2020, 58, 484–494. [Google Scholar] [CrossRef]
- Grapp, M.; Wrede, A.; Schweizer, M.; Hüwel, S.; Galla, H.-J.; Snaidero, N.; Simons, M.; Bückers, J.; Low, P.S.; Urlaub, H.; et al. Choroid plexus transcytosis and exosome shuttling deliver folate into brain parenchyma. Nat. Commun. 2013, 4, 2123. [Google Scholar] [CrossRef] [Green Version]
- Jimenez, A.R.; Naz, N.; Miyan, J. Altered folate binding protein expression and folate delivery are associated with congenital hydrocephalus in the hydrocephalic Texas rat. J. Cereb. Blood Flow Metab. 2018, 39, 2061–2073. [Google Scholar] [CrossRef] [Green Version]
- Naz, N.; Jimenez, A.R.; Sanjuan-Vilaplana, A.; Gurney, M.; Miyan, J. Neonatal hydrocephalus is a result of a block in folate handling and metabolism involving 10-formyltetrahydrofolate dehydrogenase. J. Neurochem. 2016, 138, 610–623. [Google Scholar] [CrossRef] [Green Version]
- Mashayekhi, F.; Draper, C.E.; Bannister, C.M.; Pourghasem, M.; Owen-Lynch, P.J.; Miyan, J.A. Deficient cortical development in the hydrocephalic Texas (H-Tx) rat: A role for CSF. Brain 2002, 125, 1859–1874. [Google Scholar] [CrossRef] [Green Version]
- Owen-Lynch, P.J.; Draper, C.E.; Mashayekhi, F.; Bannister, C.M.; Miyan, J.A. Defective cell cycle control underlies abnormal cortical development in the hydrocephalic Texas rat. Brain 2003, 126, 623–631. [Google Scholar] [CrossRef] [Green Version]
- Coupé, P.; Manjón, J.V.; Lanuza, E.; Catheline, G. Lifespan Changes of the Human Brain in Alzheimer’s Disease. Sci. Rep. 2019, 9, 1–12. [Google Scholar] [CrossRef]
- Saijo, T.; Abe, T.; Someya, Y.; Sassa, T.; Sudo, Y.; Suhara, T.; Shuno, T.; Asai, K.; Okubo, Y. Ten year progressive ventricular enlargement in schizophrenia: An MRI morphometrical study. Psychiatry Clin. Neurosci. 2001, 55, 41–47. [Google Scholar] [CrossRef] [PubMed]
- Jericó, D.; Luis, E.; Cussó, L.; Fernández-Seara, M.; Morales, X.; Córdoba, K.M.; Benito, M.; Sampedro, A.; Larriva-Hormigos, M.; Ramírez, M.J.; et al. Brain ventricular enlargement in human and murine acute intermittent porphyria. Hum. Mol. Genet. 2020, 29, 3211–3223. [Google Scholar] [CrossRef] [PubMed]
- Goukasian, N.; Porat, S.; Blanken, A.; Avila, D.; Zlatev, D.; Hurtz, S.; Hwang, K.S.; Pierce, J.; Joshi, S.H.; Woo, E.; et al. Cognitive Correlates of Hippocampal Atrophy and Ventricular Enlargement in Adults with or without Mild Cognitive Impairment. Dement. Geriatr. Cogn. Disord. Extra 2019, 9, 281–293. [Google Scholar] [CrossRef] [PubMed]
- Zhao, H.; Wei, T.; Li, X.; Ba, T. Early life adversity induced third ventricular enlargement in young adult male patients suffered from major depressive disorder: A study of brain morphology. Folia Morphol. 2018, 77, 428–433. [Google Scholar] [CrossRef] [Green Version]
- Mak, E.; Su, L.; Williams, G.B.; Firbank, M.J.; Lawson, R.A.; Yarnall, A.J.; Duncan, G.W.; Mollenhauer, B.; Owen, A.M.; Khoo, T.K.; et al. Longitudinal whole-brain atrophy and ventricular enlargement in nondemented Parkinson’s disease. Neurobiol. Aging 2017, 55, 78–90. [Google Scholar] [CrossRef] [Green Version]
- Schenning, K.J.; Murchison, C.F.; Mattek, N.C.; Silbert, L.C.; Kaye, J.A.; Quinn, J.F. Surgery is associated with ventricular enlargement as well as cognitive and functional decline. Alzheimer’s Dement. 2015, 12, 590–597. [Google Scholar] [CrossRef] [Green Version]
- Müller, M.; Esser, R.; Kötter, K.; Voss, J.; Müller, A.; Stellmes, P. Third ventricular enlargement in early stages of multiple sclerosis is a predictor of motor and neuropsychological deficits: A cross-sectional study. BMJ Open 2013, 3, e003582. [Google Scholar] [CrossRef] [Green Version]
- Sayo, A.; Jennings, R.G.; Van Horn, J.D. Study factors influencing ventricular enlargement in schizophrenia: A 20year follow-up meta-analysis. NeuroImage 2012, 59, 154–167. [Google Scholar] [CrossRef] [Green Version]
- Apostolova, L.G.; Green, A.E.; Babakchanian, S.; Hwang, K.S.; Chou, Y.-Y.; Toga, A.W.; Thompson, P. Hippocampal Atrophy and Ventricular Enlargement in Normal Aging, Mild Cognitive Impairment (MCI), and Alzheimer Disease. Alzheimer Dis. Assoc. Disord. 2012, 26, 17–27. [Google Scholar] [CrossRef] [Green Version]
- Jackson, D.C.; Irwin, W.; Dabbs, K.; Lin, J.J.; Jones, J.E.; Hsu, D.A.; Stafstrom, C.E.; Seidenberg, M.; Hermann, B.P. Ventricular enlargement in new-onset pediatric epilepsies. Epilepsia 2011, 52, 2225–2232. [Google Scholar] [CrossRef]
- Dalaker, T.O.; Zivadinov, R.; Ramasamy, D.P.; Beyer, M.K.; Alves, G.; Bronnick, K.S.; Tysnes, O.-B.; Aarsland, D.; Larsen, J.P. Ventricular enlargement and mild cognitive impairment in early Parkinson’s disease. Mov. Disord. 2010, 26, 297–301. [Google Scholar] [CrossRef]
- Kempton, M.J.; Stahl, D.; Williams, S.C.; DeLisi, L.E. Progressive lateral ventricular enlargement in schizophrenia: A meta-analysis of longitudinal MRI studies. Schizophr. Res. 2010, 120, 54–62. [Google Scholar] [CrossRef] [Green Version]
- Martola, J.; Stawiarz, L.; Fredrikson, S.; Hillert, J.; Bergström, J.; Flodmark, O.; Aspelin, P.; Wiberg, M.K. Rate of ventricular enlargement in multiple sclerosis: A nine-year magnetic resonance imaging follow-up study. Acta Radiol. 2008, 49, 570–579. [Google Scholar] [CrossRef]
- Guptha, S.H.; Holroyd, E.; Campbell, G. Progressive lateral ventricular enlargement as a clue to Alzheimer’s disease. Lancet 2002, 359, 2040. [Google Scholar] [CrossRef]
- Vita, A.; Dieci, M.; Silenzi, C.; Tenconi, F.; Giobbio, G.M.; Invernizzi, G. Cerebral ventricular enlargement as a generalized feature of schizophrenia: A distribution analysis on 502 subjects. Schizophr. Res. 2000, 44, 25–34. [Google Scholar] [CrossRef]
- Elkis, H.; Friedman, L.; Wise, A.; Meltzer, H.Y. Meta-analyses of studies of ventricular enlargement and cortical sulcal prominence in mood disorders. Comparisons with controls or patients with schizophrenia. Arch. Gen. Psychiatry 1995, 52, 735–746. [Google Scholar] [CrossRef]
- Wang, G.J.; Volkow, N.D.; Roque, C.T.; Cestaro, V.L.; Hitzemann, R.J.; Cantos, E.L.; Levy, A.V.; Dhawan, A.P. Functional importance of ventricular enlargement and cortical atrophy in healthy subjects and alcoholics as assessed with PET, MR imaging, and neuropsychologic testing. Radiology 1993, 186, 59–65. [Google Scholar] [CrossRef]
- Erel, O.; Cannon, T.D.; Hollister, J.M.; Mednick, S.A.; Parnas, J. Ventricular enlargement and premorbid deficits in school-occupational attainment in a high risk sample. Schizophr. Res. 1991, 4, 49–52. [Google Scholar] [CrossRef]
- Jakobsen, J.; Gyldensted, C.; Brun, B.; Bruhn, P.; Helweg-Larsen, S.; Arlien-Søborg, P. Cerebral ventricular enlargement relates to neuropsychological measures in unselected AIDS patients. Acta Neurol. Scand. 1989, 79, 59–62. [Google Scholar] [CrossRef]
- Luxenberg, J.S.; Haxby, J.V.; Creasey, H.; Sundaram, M.; Rapoport, S.I. Rate of ventricular enlargement in dementia of the Alzheimer type correlates with rate of neuropsychological deterioration. Neurology 1987, 37, 1135. [Google Scholar] [CrossRef]
- Scott, M.L.; Golden, C.J.; Ruedrich, S.L.; Bishop, R.J. Ventricular enlargement in major depression. Psychiatry Res. 1983, 8, 91–93. [Google Scholar] [CrossRef]
- Nasrallah, H.A.; McCalley-Whitters, M.; Jacoby, C.G. Cerebral venticular enlargement in young manic males: A controlled CT study. J. Affect. Disord. 1982, 4, 15–19. [Google Scholar] [CrossRef] [PubMed]
- Hubbard, B.M.; Anderson, J.M. Age, senile dementia and ventricular enlargement. J. Neurol. Neurosurg. Psychiatry 1981, 44, 631–635. [Google Scholar] [CrossRef] [PubMed] [Green Version]
- Frye, R.E.; Slattery, J.; Delhey, L.; Furgerson, B.; Strickland, T.; Tippett, M.; Sailey, A.; Wynne, R.; Rose, S.; Melnyk, S.; et al. Folinic acid improves verbal communication in children with autism and language impairment: A randomized double-blind placebo-controlled trial. Mol. Psychiatry 2018, 23, 247–256. [Google Scholar] [CrossRef] [PubMed] [Green Version]
- Ferreira, P.; Luco, S.M.; Sawyer, S.L.; Davila, J.; Boycott, K.M.; Dyment, D.A. Late diagnosis of cerebral folate deficiency: Fewer seizures with folinic acid in adult siblings. Neurol. Genet. 2015, 2, e38. [Google Scholar] [CrossRef] [Green Version]
- Ramaekers, V.; Thöny, B.; Sequeira, J.; Ansseau, M.; Philippe, P.; Boemer, F.; Bours, V.; Quadros, E. Folinic acid treatment for schizophrenia associated with folate receptor autoantibodies. Mol. Genet. Metab. 2014, 113, 307–314. [Google Scholar] [CrossRef]
- Mercimek-Mahmutoglu, S.; Stockler-Ipsiroglu, S. Cerebral Folate Deficiency and Folinic Acid Treatment in Hypomyelination with Atrophy of the Basal Ganglia and Cerebellum (H-ABC) Syndrome. Tohoku J. Exp. Med. 2007, 211, 95–96. [Google Scholar] [CrossRef] [Green Version]
- Karin, I.; Borggraefe, I.; Catarino, C.B.; Kuhm, C.; Hoertnagel, K.; Biskup, S.; Opladen, T.; Blau, N.; Heinen, F.; Klopstock, T. Folinic acid therapy in cerebral folate deficiency: Marked improvement in an adult patient. J. Neurol. 2017, 264, 578–582. [Google Scholar] [CrossRef]
- Al-Baradie, R.S.; Chaudhary, M.W. Diagnosis and management of cerebral folate deficiency. A form of folinic ac-id-responsive seizures. Neurosciences 2014, 19, 312–316. [Google Scholar]
- Moretti, P.; Sahoo, T.; Hyland, K.; Bottiglieri, T.; Peters, S.; Del Gaudio, D.; Roa, B.; Curry, S.; Zhu, H.; Finnell, R.; et al. Cerebral folate deficiency with developmental delay, autism, and response to folinic acid. Neurology 2005, 64, 1088–1090. [Google Scholar] [CrossRef]
- Hansen, F.J.; Blau, N. Cerebral folate deficiency: Life-changing supplementation with folinic acid. Mol. Genet. Metab. 2005, 84, 371–373. [Google Scholar] [CrossRef]
- Frye, R.E.; Donner, E.; Golja, A.; Rooney, C.M. Folinic acid-responsive seizures presenting as breakthrough seizures in a 3-month-old boy. J. Child Neurol. 2003, 18, 562–569. [Google Scholar] [CrossRef]
- Robinson, A.C.; Palmer, L.; Love, S.; Hamard, M.; Esiri, M.; Ansorge, O.; Lett, D.; Attems, J.; Morris, C.; Troakes, C.; et al. Extended post-mortem delay times should not be viewed as a deterrent to the scientific investigation of human brain tissue: A study from the Brains for Dementia Research Network Neuropathology Study Group, UK. Acta Neuropathol. 2016, 132, 753–755. [Google Scholar] [CrossRef] [Green Version]
- Chance, S.A.; Esiri, M.M.; Crow, T.J. Ventricular enlargement in schizophrenia: A primary change in the temporal lobe? Schizophr. Res. 2002, 62, 123–131. [Google Scholar] [CrossRef]
- Horga, G.; Bernacer, J.; Dusi, N.; Entis, J.; Chu, K.; Hazlett, E.A.; Haznedar, M.M.; Kemether, E.; Byne, W.; Buchsbaum, M.S. Correlations between ventricular enlargement and gray and white matter volumes of cortex, thalamus, striatum, and internal capsule in schizophrenia. Eur. Arch. Psychiatry Clin. Neurosci. 2011, 261, 467–476. [Google Scholar] [CrossRef] [Green Version]
- Melzer, L.; Freiman, T.; Derouiche, A. Rab6A as a Pan-Astrocytic Marker in Mouse and Human Brain, and Comparison with Other Glial Markers (GFAP, GS, Aldh1L1, SOX9). Cells 2021, 10, 72. [Google Scholar] [CrossRef]
- Miyan, J.; Cains, S.; Larcombe, S.; Naz, N.; Jimenez, A.R.; Bueno, D.; Gato, A. Subarachnoid cerebrospinal fluid is essential for normal development of the cerebral cortex. Semin. Cell Dev. Biol. 2020, 102, 28–39. [Google Scholar] [CrossRef]
- Reddy, O.C.; Van Der Werf, Y.D. The Sleeping Brain: Harnessing the Power of the Glymphatic System through Lifestyle Choices. Brain Sci. 2020, 10, 868. [Google Scholar] [CrossRef]
- Naganawa, S.; Taoka, T. The Glymphatic System: A Review of the Challenges in Visualizing its Structure and Function with MR Imaging. Magn. Reson. Med Sci. 2022, 21, 182–194. [Google Scholar] [CrossRef]
- Rasmussen, M.K.; Mestre, H.; Nedergaard, M. The glymphatic pathway in neurological disorders. Lancet Neurol. 2018, 17, 1016–1024. [Google Scholar] [CrossRef] [Green Version]
- Alam, C.; Aufreiter, S.; Georgiou, C.J.; Hoque, T.; Finnell, R.H.; O’Connor, D.L.; Goldman, I.D.; Bendayan, R. Upregulation of reduced folate carrier by vitamin D enhances brain folate uptake in mice lacking folate receptor alpha. Proc. Natl. Acad. Sci. USA 2019, 116, 17531–17540. [Google Scholar] [CrossRef] [PubMed]
- Ramaekers, V.T.; Blau, N. Cerebral folate deficiency. Dev. Med. Child Neurol. 2007, 46, 843–851. [Google Scholar] [CrossRef]
- Ramaekers, V.; Sequeira, J.M.; Quadros, E.V. Clinical recognition and aspects of the cerebral folate deficiency syndromes. Clin. Chem. Lab. Med. (CCLM) 2013, 51, 497–511. [Google Scholar] [CrossRef] [PubMed]
- Sadighi, Z.; Butler, I.J.; Koenig, M.K. Adult-Onset Cerebral Folate Deficiency. Arch. Neurol. 2012, 69, 778–779. [Google Scholar] [CrossRef] [PubMed] [Green Version]
- Garcia-Cazorla, A.; Quadros, E.V.; Nascimento, A.; Garcia-Silva, M.T.; Briones, P.; Montoya, J.; Ormazabal, A.; Artuch, R.; Sequeira, J.M.; Blau, N.; et al. Mitochondrial diseases associated with cerebral folate deficiency. Neurology 2008, 70, 1360–1362. [Google Scholar] [CrossRef]
- Serrano, M.; García-Silva, M.T.; Martin-Hernandez, E.; O’Callaghan, M.D.M.; Quijada, P.; Martinez-Aragón, A.; Ormazábal, A.; Blázquez, A.; Martín, M.A.; Briones, P.; et al. Kearns-Sayre syndrome: Cerebral folate deficiency, MRI findings and new cerebrospinal fluid biochemical features. Mitochondrion 2010, 10, 429–432. [Google Scholar] [CrossRef]
- Willemsen, M.A.A.P.; Wevers, R.; Verbeek, M.M.; Vebeek, M.M. Cerebral Folate Deficiency Syndrome. N. Engl. J. Med. 2005, 353, 740. [Google Scholar] [CrossRef] [Green Version]
- Iliff, J.J.; Chen, M.J.; Plog, B.A.; Zeppenfeld, D.M.; Soltero, M.; Yang, L.; Singh, I.; Deane, R.; Nedergaard, M. Impairment of Glymphatic Pathway Function Promotes Tau Pathology after Traumatic Brain Injury. J. Neurosci. 2014, 34, 16180–16193. [Google Scholar] [CrossRef] [Green Version]
- Peng, W.; Achariyar, T.M.; Li, B.; Liao, Y.; Mestre, H.; Hitomi, E.; Regan, S.; Kasper, T.; Peng, S.; Ding, F.; et al. Suppression of glymphatic fluid transport in a mouse model of Alzheimer’s disease. Neurobiol. Dis. 2016, 93, 215–225. [Google Scholar] [CrossRef] [Green Version]
- Lou, Y.; Carlock, C.; Wu, J. Glymphatic Efficiency is a Critical Factor for Using Abnormal Tau in Peripheral Tissues as Biomarker for Alzheimer’s Disease. Biomark. Appl. 2018, 2. [Google Scholar] [CrossRef] [Green Version]
- Harrison, I.F.; Ismail, O.; Machhada, A.; Colgan, N.; Ohene, Y.; Nahavandi, P.; Ahmed, Z.; Fisher, A.; Meftah, S.; Murray, T.K.; et al. Impaired glymphatic function and clearance of tau in an Alzheimer’s disease model. Brain 2020, 143, 2576–2593. [Google Scholar] [CrossRef]
- Lee, Y.; Choi, Y.; Park, E.-J.; Kwon, S.; Kim, H.; Lee, J.Y.; Lee, D.S. Improvement of glymphatic–lymphatic drainage of beta-amyloid by focused ultrasound in Alzheimer’s disease model. Sci. Rep. 2020, 10, 1–14. [Google Scholar] [CrossRef]
- Reeves, B.C.; Karimy, J.K.; Kundishora, A.J.; Mestre, H.; Cerci, H.M.; Matouk, C.; Alper, S.L.; Lundgaard, I.; Nedergaard, M.; Kahle, K.T. Glymphatic System Impairment in Alzheimer’s Disease and Idiopathic Normal Pressure Hydrocephalus. Trends Mol. Med. 2020, 26, 285–295. [Google Scholar] [CrossRef]
- Tice, C.; McDevitt, J.; Langford, D. Astrocytes, HIV and the Glymphatic System: A Disease of Disrupted Waste Management? Front. Cell. Infect. Microbiol. 2020, 10, 523379. [Google Scholar] [CrossRef]


| (a) | ||||||||
|---|---|---|---|---|---|---|---|---|
| Case No. | Braak Grade | MRC ID | Gender | Age at Death | Clinical Diagnosis | Pathological Diagnosis 1 | Pathological Diagnosis 2 | Post Mortem Delay (h) |
| DPM11/29 | II | BBN_3467 | M | 89 | normal | Age changes only | mild SVD | 123 |
| DPM13/07 | 0 | BBN_10263 | F | Na | normal | leptomeningeal Ca infiltration | Normal | 90 |
| DPM14/08 | 0-I | BBN_20005 | M | 85 | Normal | Age changes only | moderate SVD | 98 |
| DPM14/11 | I-II | BBN_20195 | M | 91 | Normal | mild SVD | Na | 43.5 |
| DPM17/09 | I | BBN005.30100 | F | 88 | Control | Normal for age | ARTAG, possible PART | 52.5 |
| DPM17/36 | I-II | BBN005.32382 | F | 94 | Control | Age changes only | Na | 70 |
| DPM18/11 | I-II | BBN005.32822 | F | 90 | Control | Age changes only | Possible ARTAG | 143 |
| DPM16/29 | 0-II | BBN005.29063 | M | 69 | Control | Normal for age | 53 | |
| DPM16/30 | 0-II | BBN005.29167 | F | 95 | Control | Normal for age/incipient AD | Moderate AD changes in temporal lobe | 70.5 |
| DPM16/31 | 0-II | BBN005.29168 | M | 90 | Control | Normal for age | Mild SVD | 155 |
| DPM16/35 | 0-II | BBN005.29398 | M | 84 | Control | Normal ageing | Mild to moderate SVD | 41.5 |
| DPM17/09 | 0-II | BBN005.30100 | F | 88 | Control | Normal for age | ARTAG, possible PART | 52.5 |
| DPM17/23 | 0-II | BBN005.30844 | M | 91 | Control | Normal for age | Na | 88 |
| DPM17/36 | 0-II | BBN005.32382 | F | 94 | Control | Age changes only | Na | 70 |
| DPM17/38 | 0-II | BBN005.32526 | F | 101 | Control | Normal for age | Na | 135.5 |
| DPM16/29 | 0-I | BBN005.29063 | M | 69 | Control | Normal for age | Na | 53 |
| DPM18/03 | 0-I | BBN005.32560 | M | 88 | Control | Normal for age | Na | 39 |
| DPM16/30 | 0-II | BBN005.29167 | F | 95 | Control | Normal for age/incipient AD | Moderate AD changes in temporal lobe | 70.5 |
| DPM16/31 | 0-II | BBN005.29168 | M | 90 | Control | Normal for age | Mild SVD | 155 |
| DPM16/35 | 0-II | BBN005.29398 | M | 84 | Control | Normal ageing | Mild to moderate SVD | 41.5 |
| DPM17/23 | 0-II | BBN005.30844 | M | 91 | Control | Normal for age | Na | 88 |
| DPM14/46 | 0-I | BBN_24316 | F | 94 | control | age changes only | mild SVD | 111 |
| DPM16/30 | II | BBN005.29167 | F | 95 | Control | Normal for age/incipient AD | Na | 70.5 |
| DPM16/35 | II | BBN005.29398 | M | 84 | Control | Normal ageing | Na | 41.5 |
| DPM13/07 | II | BBN_10263 | F | 60 | normal | leptomeningeal Ca infiltration | Na | 90 |
| DPM14/34 | 0 | BBN_24212 | F | 94 | control | age changes only | Na | 74.5 |
| (b) | ||||||||
| Case No. | Braak Grade | MRC ID | Gender | Age at Death | Clinical Diagnosis | Pathological Diagnosis 1 | Pathological Diagnosis 2 | Post Mortem Delay (h) |
| DPM11/28 | VI | BBN_3466 | F | 71 | Alzheimer’s disease | Alzheimer’s disease | 5 | |
| DPM12/01 | V-VI | BBN_3469 | M | 67 | Dementia | Alzheimer’s disease | mild SVD | 84 |
| DPM12/03 | VI | BBN_3470 | M | 72 | Alzheimer’s Disease | Alzheimer’s disease | Na | 81 |
| DPM12/05 | VI | BBN_3472 | M | 73 | Alzheimer’s Disease | Alzheimer’s disease | mod SVD | 5 |
| DPM12/25 | V-VI | BBN_6076 | M | 62 | Semantic Dementia | Alzheimer’s disease | Na | 50.5 |
| DPM12/32 | V-VI | BBN_9480 | M | 73 | Alzheimer’s disease | Alzheimer’s disease | Na | 26 |
| DPM13/10 | V-VI | BBN_11028 | F | 85 | dementia | Alzheimer’s disease | Mild CAA | 24 |
| DPM14/10 | V-VI | BBN_20007 | F | 78 | Alzheimer’s disease | Alzheimer’s disease | CAA with capillary involvement | 70 |
| DPM14/30 | V-VI | BBN_23794 | F | 70 | dementia, learning difficulty | Alzheimer’s disease | Na | 89 |
| DPM14/31 | VI | BBN_23803 | M | 64 | Alzheimer’s Disease | Alzheimer’s disease | moderate SVD | 98.5 |
| DPM14/50 | V-VI | BBN_24361 | F | 63 | Alzheimer’s Disease | Alzheimer’s disease | moderate SVD | 54 |
| DPM15/02 | V-VI | BBN_24373 | M | 78 | Alzheimer’s Disease | Alzheimer’s disease | sec TDP-43 proteinopathy | 173 |
| DPM15/29 | V-VI | BBN_25921 | M | 81 | AD and Vascular dementia | Alzheimer’s disease | mild SVD | 68 |
| DPM16/10 | V-VI | BBN005.28400 | F | 59 | Alzheimer’s Disease | Alzheimer’s disease | Na | 87 |
| DPM18/27 | V-VI | BBN005.33712 | M | 75 | Alzheimer’s Disease | Alzheimer’s disease | Na | 104.5 |
| DPM16/40 | VI | BBN005.29461 | M | 82 | Alzheimer’s Disease | Alzheimer’s disease | Moderate CAA | 25.5 |
| DPM17/37 | V-VI | BBN005.32384 | F | 90 | Alzheimer’s Disease | Alzheimer’s disease | Possible AGD | 76 |
| DPM18/12 | VI | BBN005.32823 | M | 70 | Alzheimer’s Disease | Alzheimer’s disease | Moderate SVD | 120.5 |
| DPM18/39 | VI | BBN005.35131 | F | 75 | Dementia | Alzheimer’s disease | Na | 127.5 |
| DPM19/04 | VI | BBN005.35211 | M | 82 | Alzheimer’s Disease | Alzheimer’s disease | Temporal intra-cortical infarct. Secondary TDP-43. | 124 |
| DPM19/07 | VI | BBN005.35399 | F | 86 | Dementia | Alzheimer’s disease | Severe hippocampal sclerosis. Secondary TDP-43. | 72 |
| DPM20/07 | VI | BBN005.36133 | F | 88 | Alzheimer’s Disease | Alzheimer’s disease | Na | 165.5 |
| DPM10/15 | VI | BBN_5766 | F | 76 | Alzheimer’s disease | Alzheimer’s disease | Na | 52 |
| DPM14/10 | V-VI | BBN_20007 | F | 78 | Alzheimer’s disease | Alzheimer’s disease | Na | 70 |
| DPM11/28 | VI | BBN_3466 | F | 71 | Alzheimer’s disease | Alzheimer’s disease | Na | 64 |
| DPM12/03 | VI | BBN_3470 | M | 72 | Alzheimer’s Disease | Alzheimer’s disease | Na | 81 |
| DPM12/17 | VI | BBN_6068 | M | 76 | Alzheimer’s Disease | Alzheimer’s disease | Na | 96 |
| DPM14/31 | VI | BBN_23803 | M | 64 | Alzheimer’s Disease | Alzheimer’s disease | Na | 98.5 |
| DPM12/01 | V-VI | BBN_3469 | M | 67 | Dementia | Alzheimer’s disease | Na | 84 |
| DPM14/21 | IV | BBN_21006 | M | 72 | FTD | Alzheimer’s disease | Na | 103 |
| DPM13/30 | IV | BBN_15257 | M | 77 | FTD/PNFA | Alzheimer’s disease | Na | 87 |
| Primary Antibodies | Dilution | |||||
|---|---|---|---|---|---|---|
| Target | Species | Source | Ref. No | WB | DB | IHC |
| FDH | Rb anti Human | S.Krupenko | Gift | --- | --- | 1:1000 |
| FDH | Ms-anti-ALDH1L1 | Sigma | SAB 4100141 | --- | --- | 1:1000 |
| FRα | Gt-anti-FOLR1 | R & D System | AF5646 | 1:3000 | --- | 1:1000 |
| Folates | Ms anti Human | Sigma | M-5028 | --- | --- | --- |
| GFAP | Chkn-anti-GFAP | Encor | CPCA-GFAP | --- | --- | 1:3000 |
| S100 | Rb-anti-S100 | Atlas Ab | HPA015768 | --- | --- | 1:1000 |
| 5-HmCyt | Rat-anti-5-HmCyt | Abcam | Ab106918 | --- | --- | 1:1000 |
| 5-mCyt | Rb-anti-5mCyt | Cell Signalling | D3S2Z | --- | --- | 1:1000 |
| Fluorophore-Conjugated Secondary Antibodies for WB/DB | Dilutions | |||||
| Species | Source | Ref. No | WB | DB | ||
| anti Rb | Bio-Rad | 10000068188D | 1:3000 | ---- | ||
| anti Ms | Bio-Rad | 10000086250B | 1:3000 | 1:3000 | ||
| Alexa Fluor Secondary Antibodies for IHC | Dilutions | |||||
| Species | Source | Ref. No | wavelength | IHC | ||
| Anti-Chkn | Abcam | ab150176 | 594 | 1:3000 | ||
| Anti-Rb | Abcam | ab150077 | 488 | 1:1000 | ||
| Anti-Ms | Abcam | ab150120 | 594 | 1:1000 | ||
| Anti-Gt | Abcam | ab150132 | 594 | 1:1000 | ||
| Anti-Ms | Abcam | ab150113 | 488 | 1:1000 | ||
| Anti-Chkn | Abcam | ab150169 | 488 | 1:3000 | ||
| Anti-Rat | Abcam | ab150165 | 488 | 1:1000 | ||
| Anti-Rb | Abcam | ab150080 | 594 | 1:1000 | ||
| Anti-Rb | Abcam | ab150075 | 647 | 1:1000 | ||
| Anti-Gt | Abcam | ab150129 | 488 | 1:1000 | ||
| Anti-Ms | Abcam | ab150110 | 555 | 1:1000 | ||
Disclaimer/Publisher’s Note: The statements, opinions and data contained in all publications are solely those of the individual author(s) and contributor(s) and not of MDPI and/or the editor(s). MDPI and/or the editor(s) disclaim responsibility for any injury to people or property resulting from any ideas, methods, instructions or products referred to in the content. |
© 2022 by the authors. Licensee MDPI, Basel, Switzerland. This article is an open access article distributed under the terms and conditions of the Creative Commons Attribution (CC BY) license (https://creativecommons.org/licenses/by/4.0/).
Share and Cite
Naz, N.; Naqvi, S.F.; Hohn, N.; Whelan, K.; Littler, P.; Roncaroli, F.; Robinson, A.C.; Miyan, J.A. Cerebral Folate Metabolism in Post-Mortem Alzheimer’s Disease Tissues: A Small Cohort Study. Int. J. Mol. Sci. 2023, 24, 660. https://doi.org/10.3390/ijms24010660
Naz N, Naqvi SF, Hohn N, Whelan K, Littler P, Roncaroli F, Robinson AC, Miyan JA. Cerebral Folate Metabolism in Post-Mortem Alzheimer’s Disease Tissues: A Small Cohort Study. International Journal of Molecular Sciences. 2023; 24(1):660. https://doi.org/10.3390/ijms24010660
Chicago/Turabian StyleNaz, Naila, Syeda F. Naqvi, Nadine Hohn, Kiara Whelan, Phoebe Littler, Federico Roncaroli, Andrew C. Robinson, and Jaleel A. Miyan. 2023. "Cerebral Folate Metabolism in Post-Mortem Alzheimer’s Disease Tissues: A Small Cohort Study" International Journal of Molecular Sciences 24, no. 1: 660. https://doi.org/10.3390/ijms24010660