
Metabolic Activation of Benzo[a]pyrene by Human Tissue Organoid Cultures
 , , and
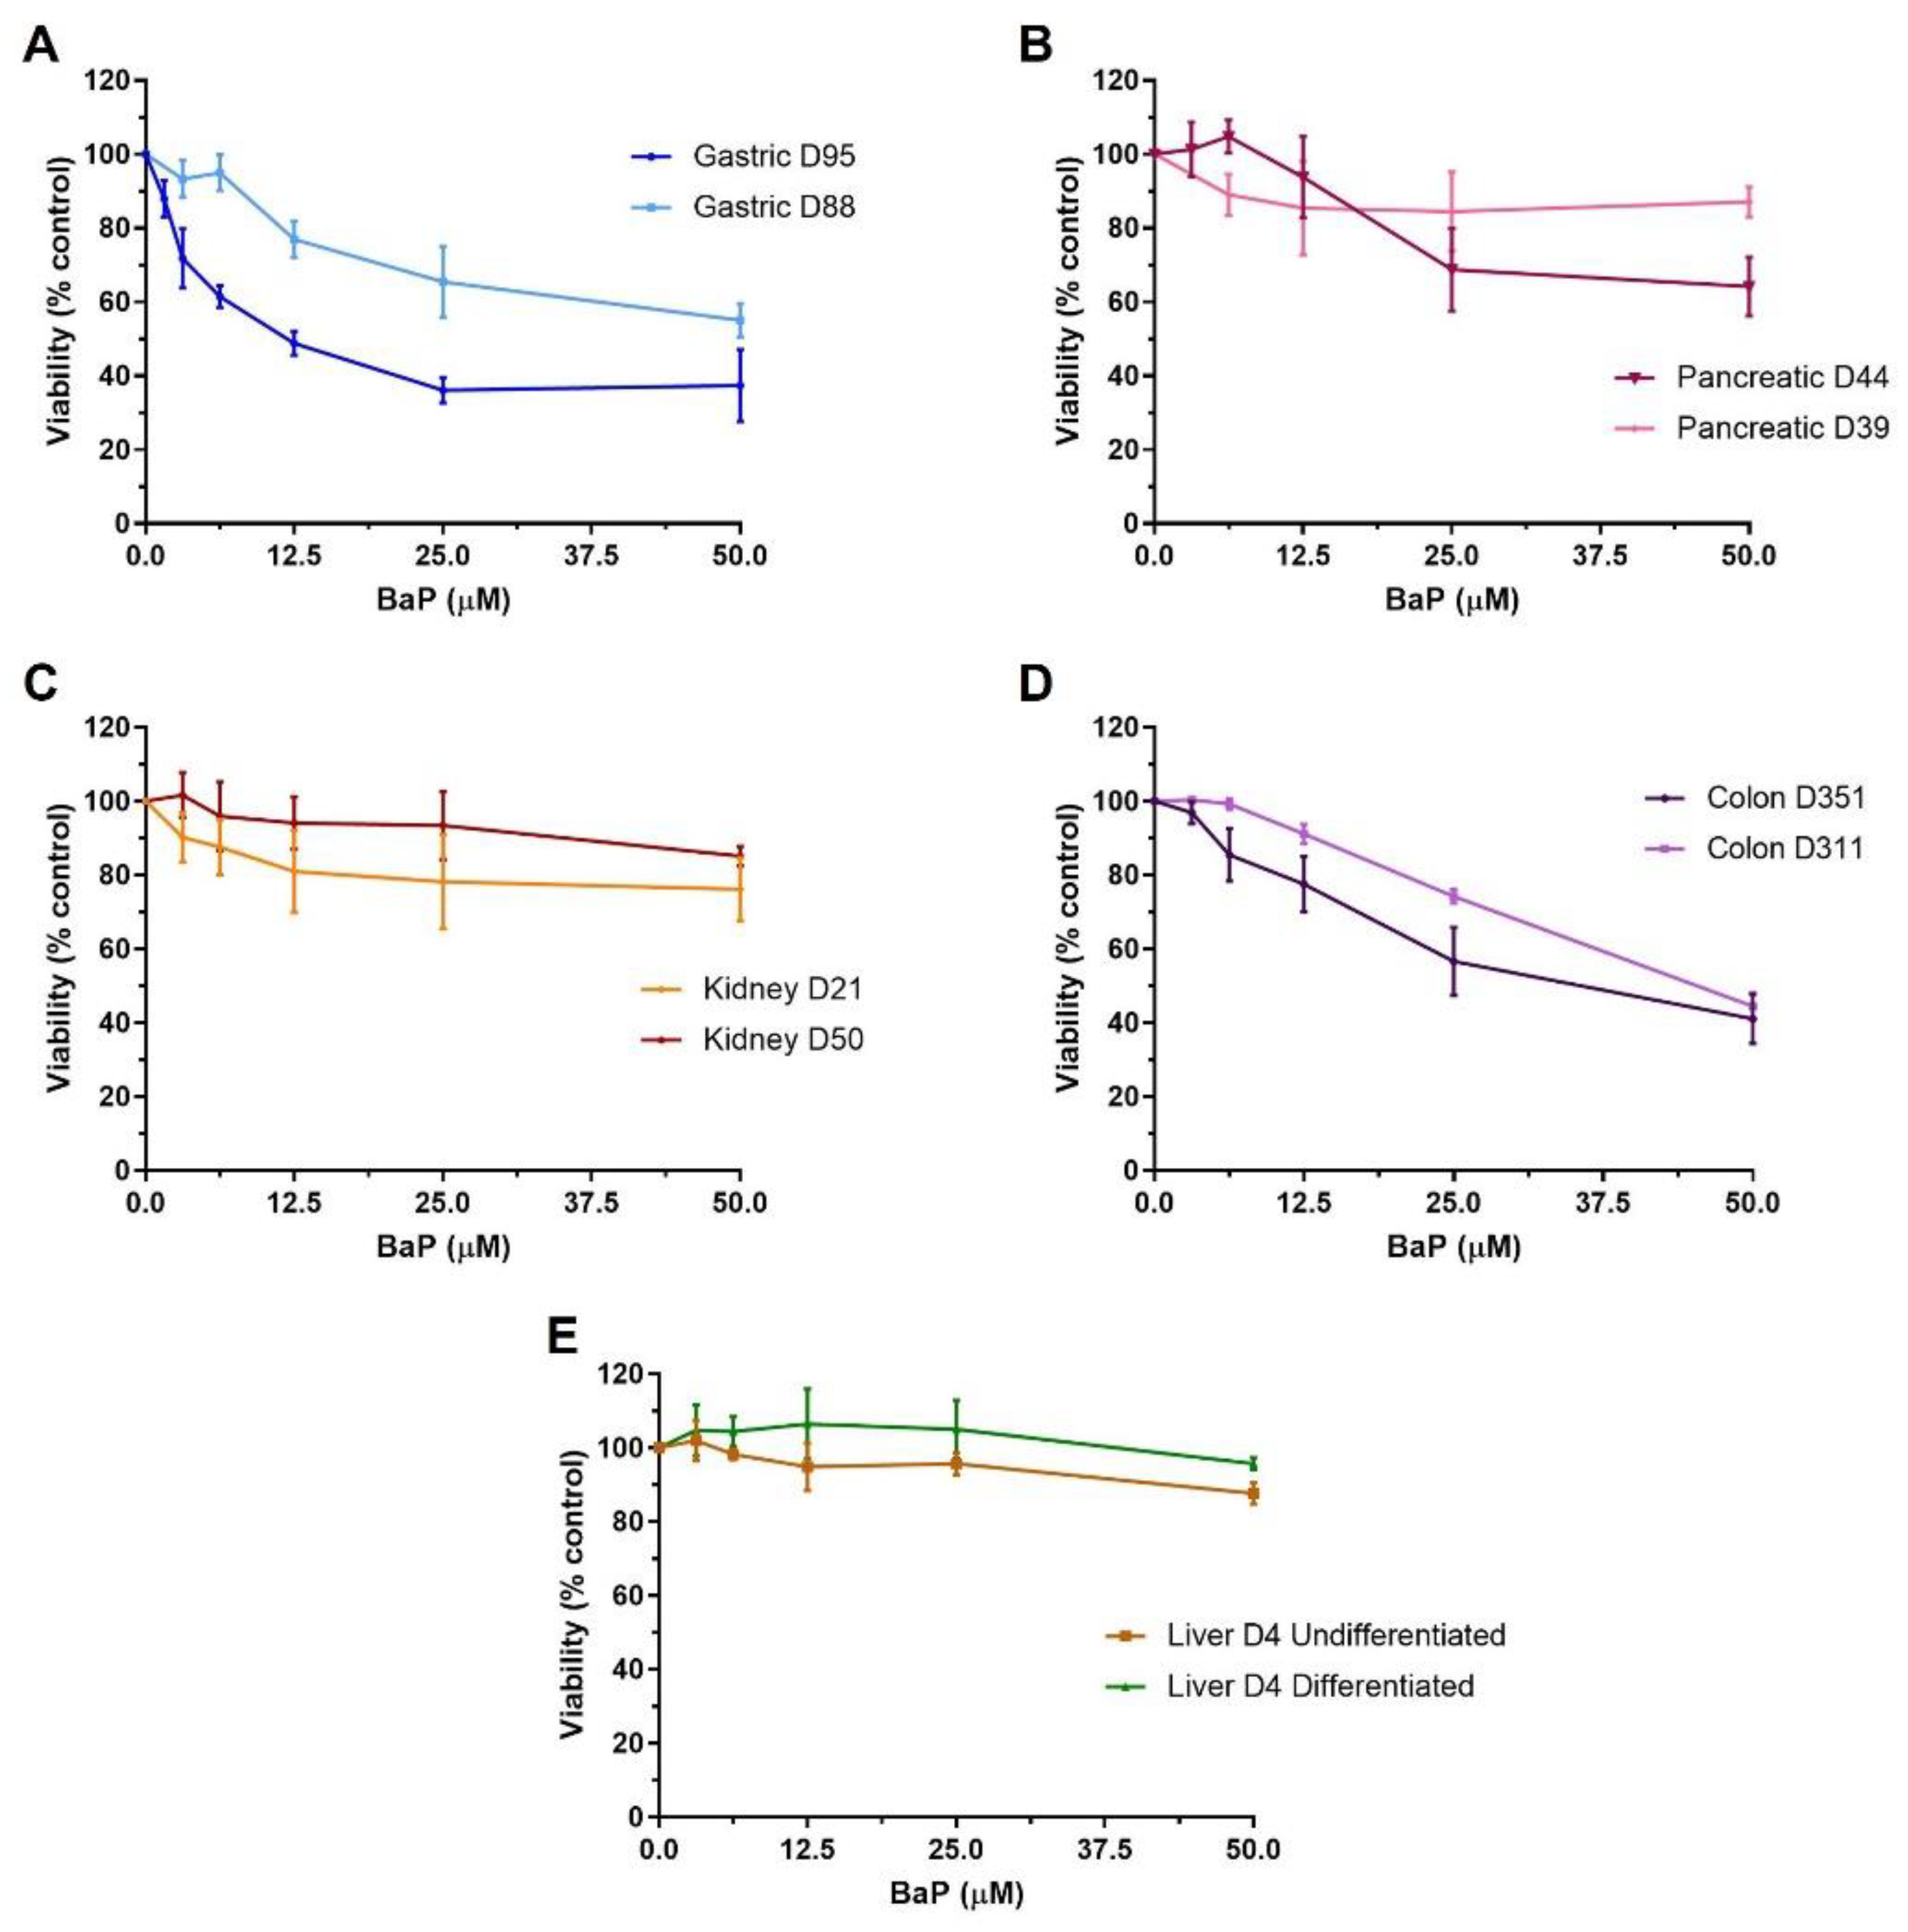
Abstract
:1. Introduction
2. Results
2.1. Cell Viability of Human Tissue Organoids
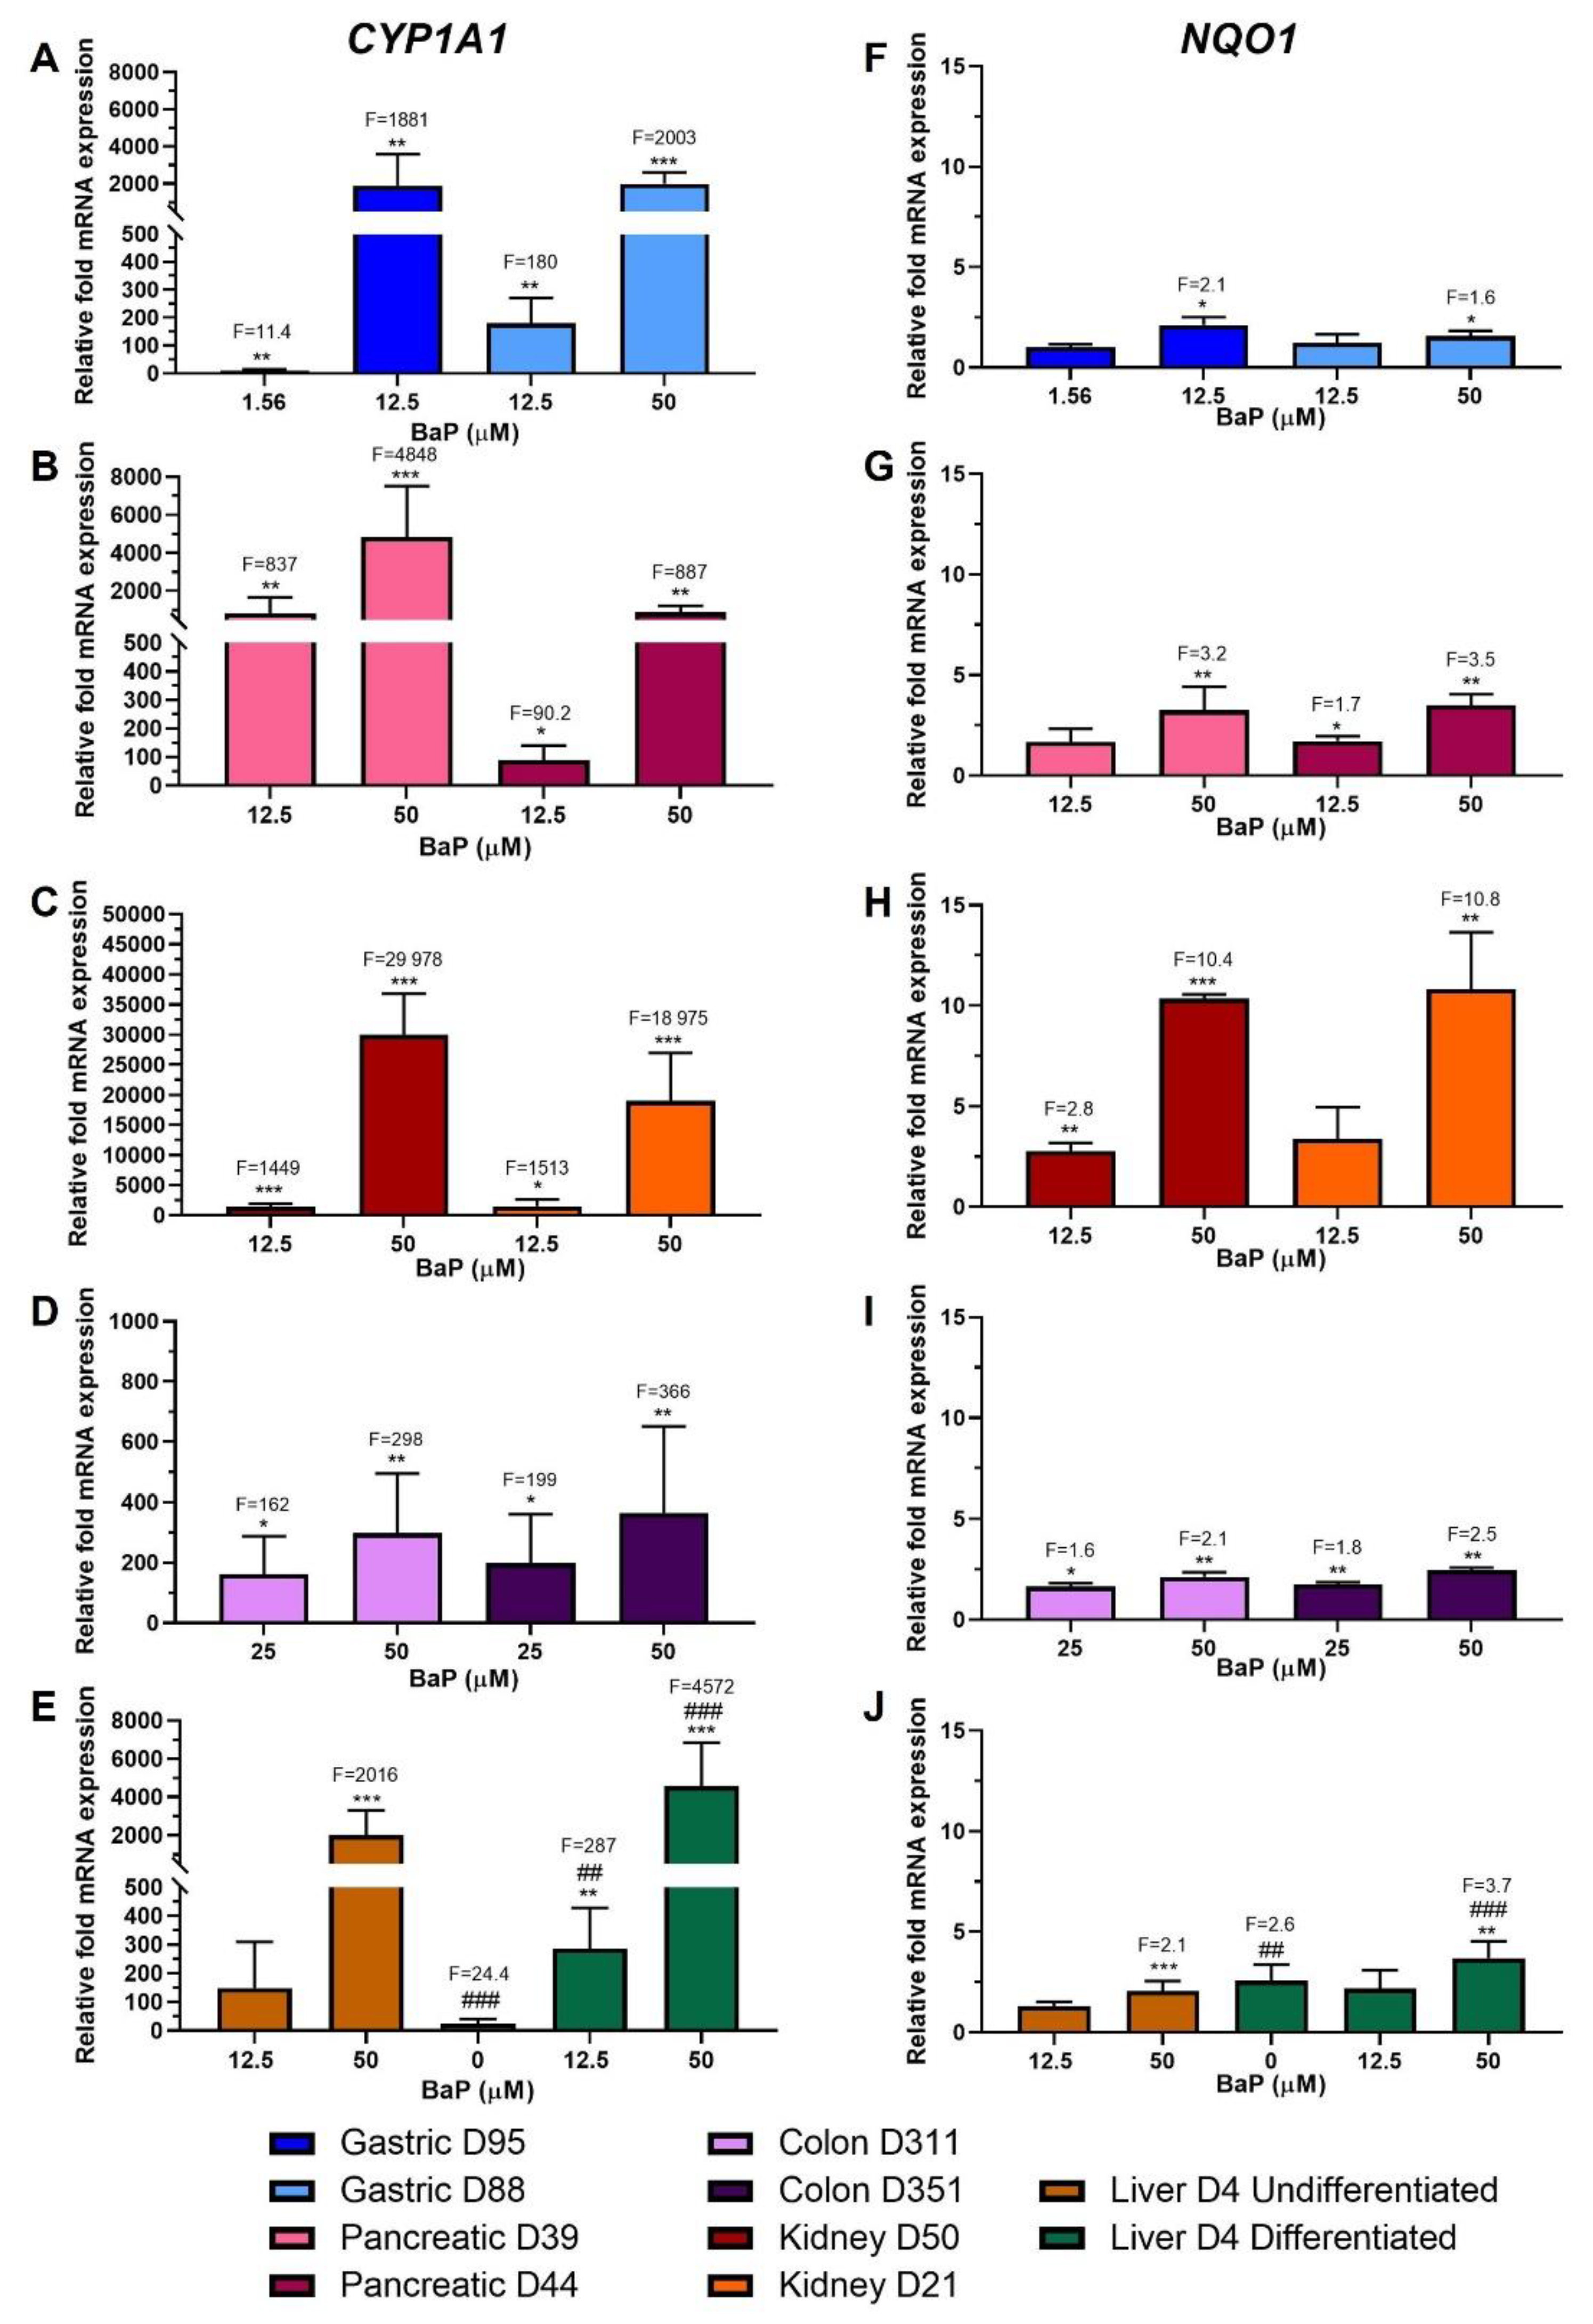
2.2. Xenobiotic-Metabolising Enzyme (XMEs) Expression
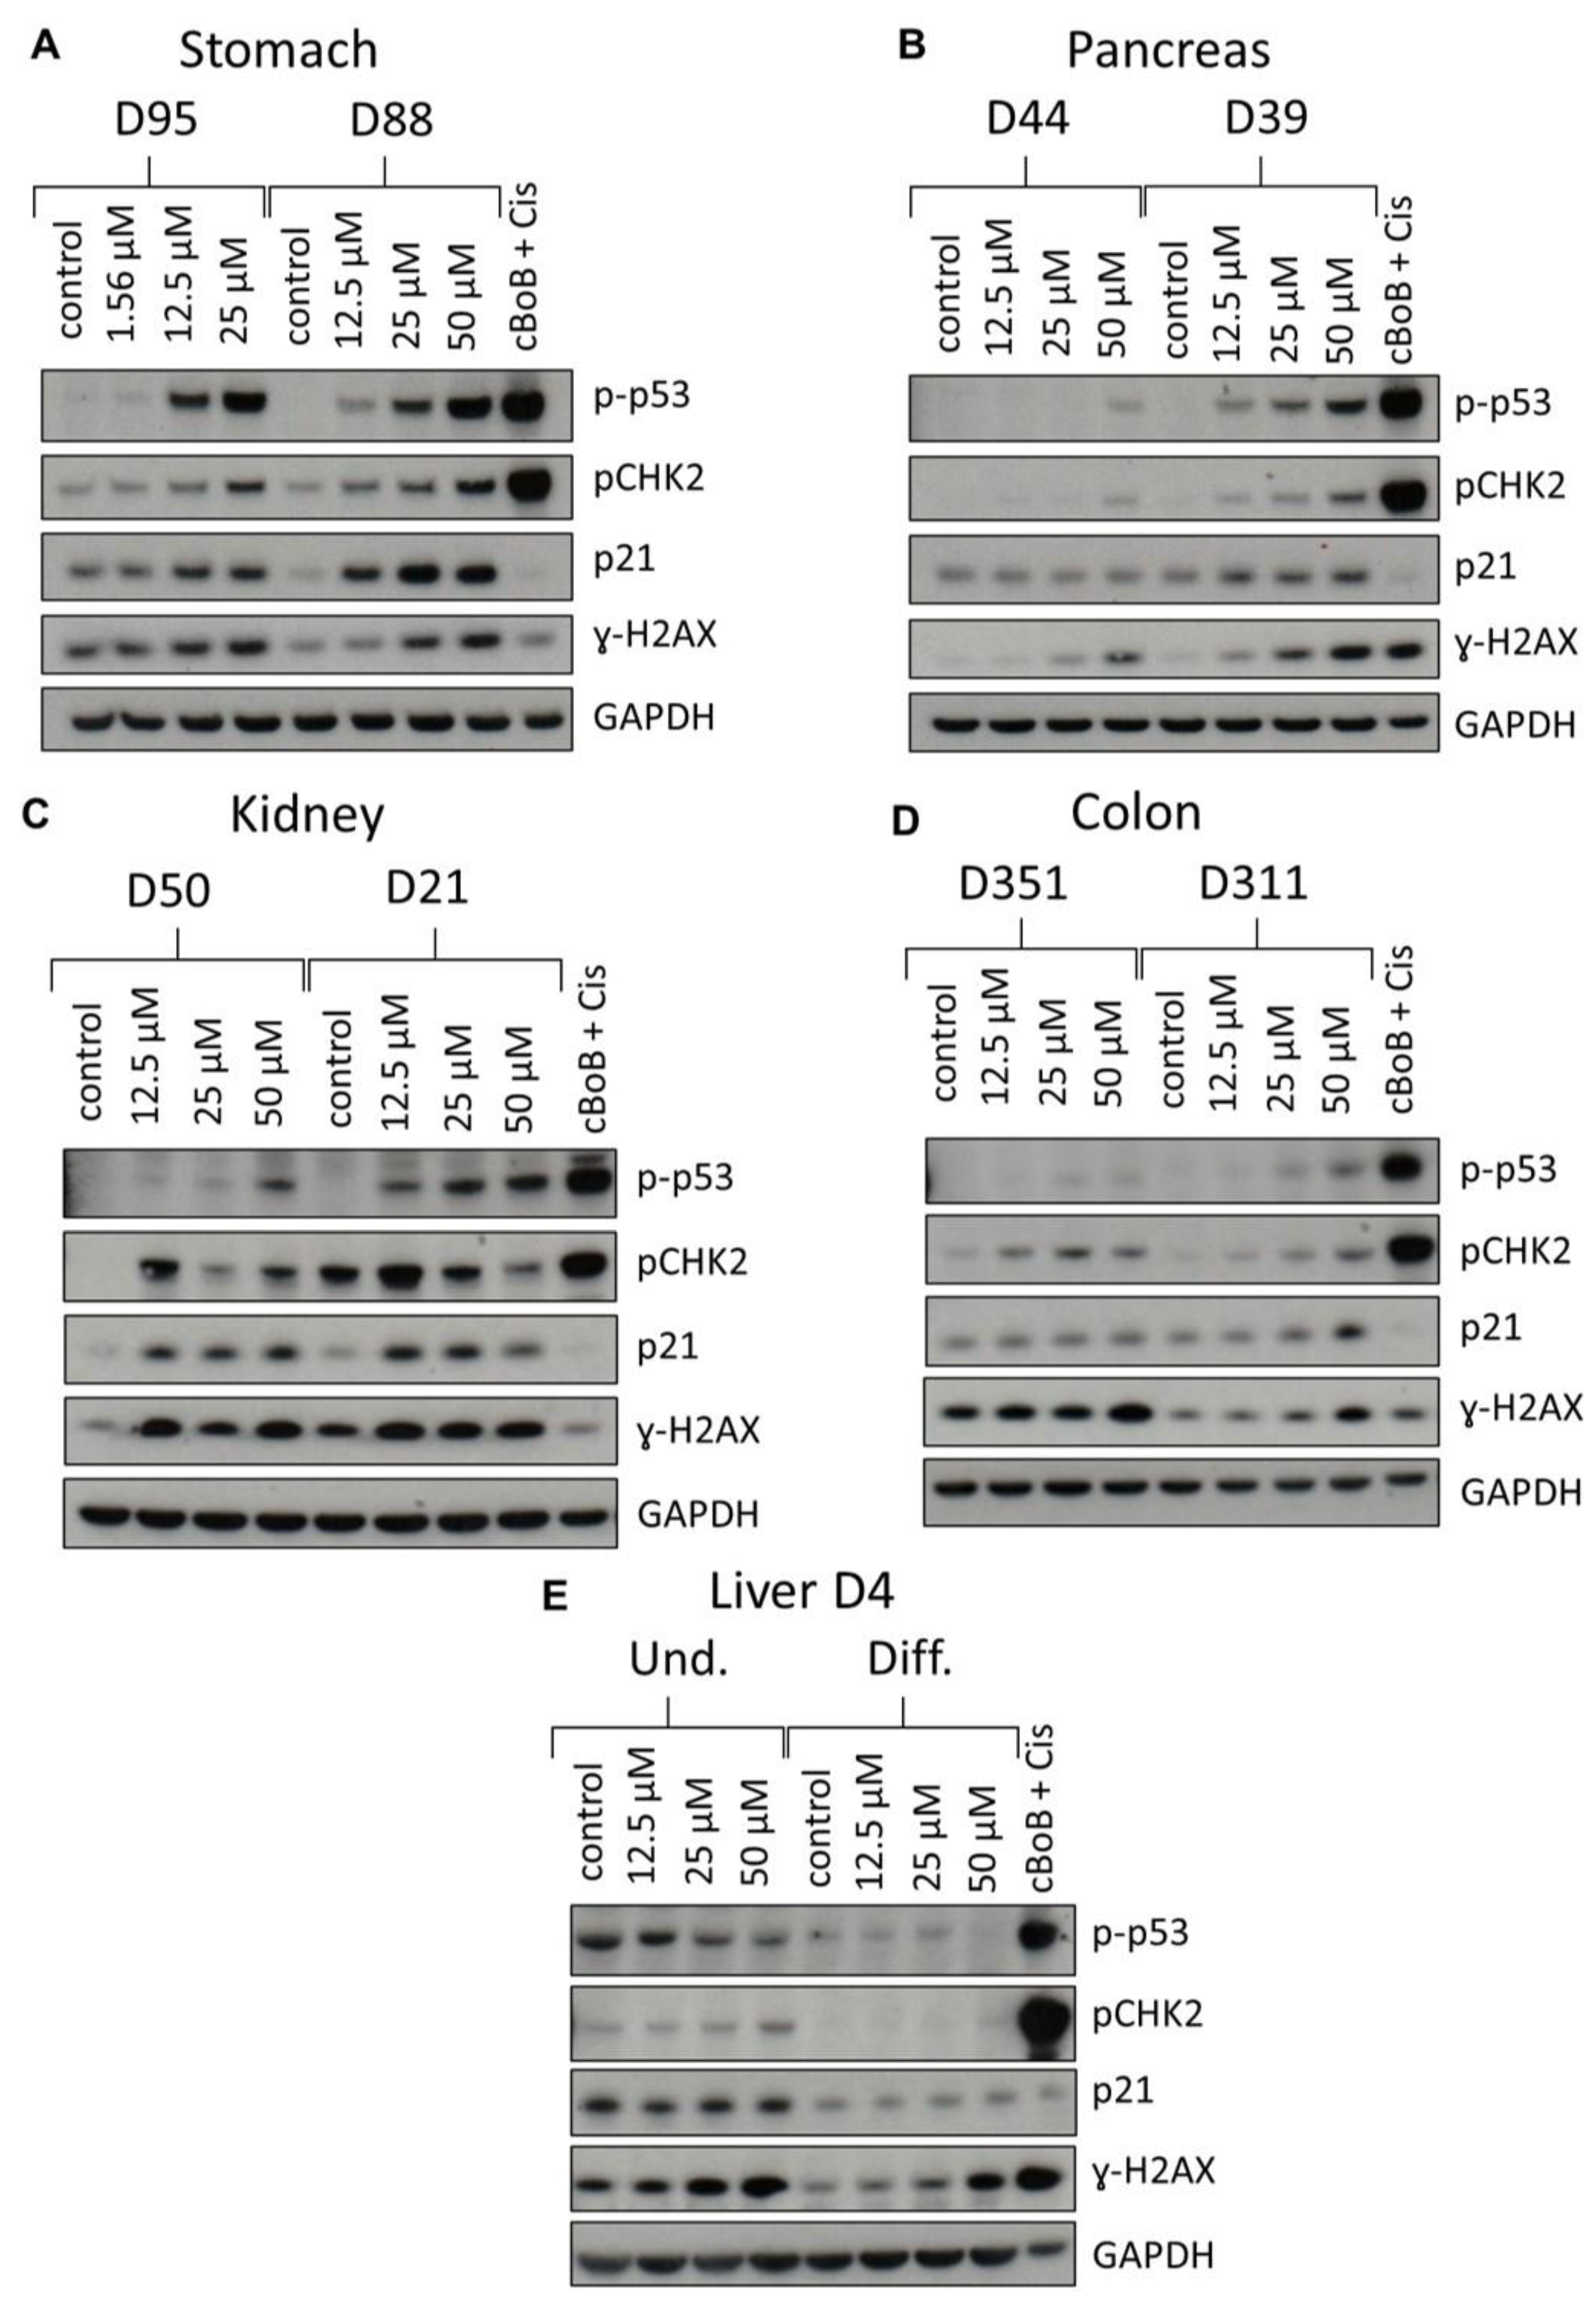
2.3. DDR Protein Induction
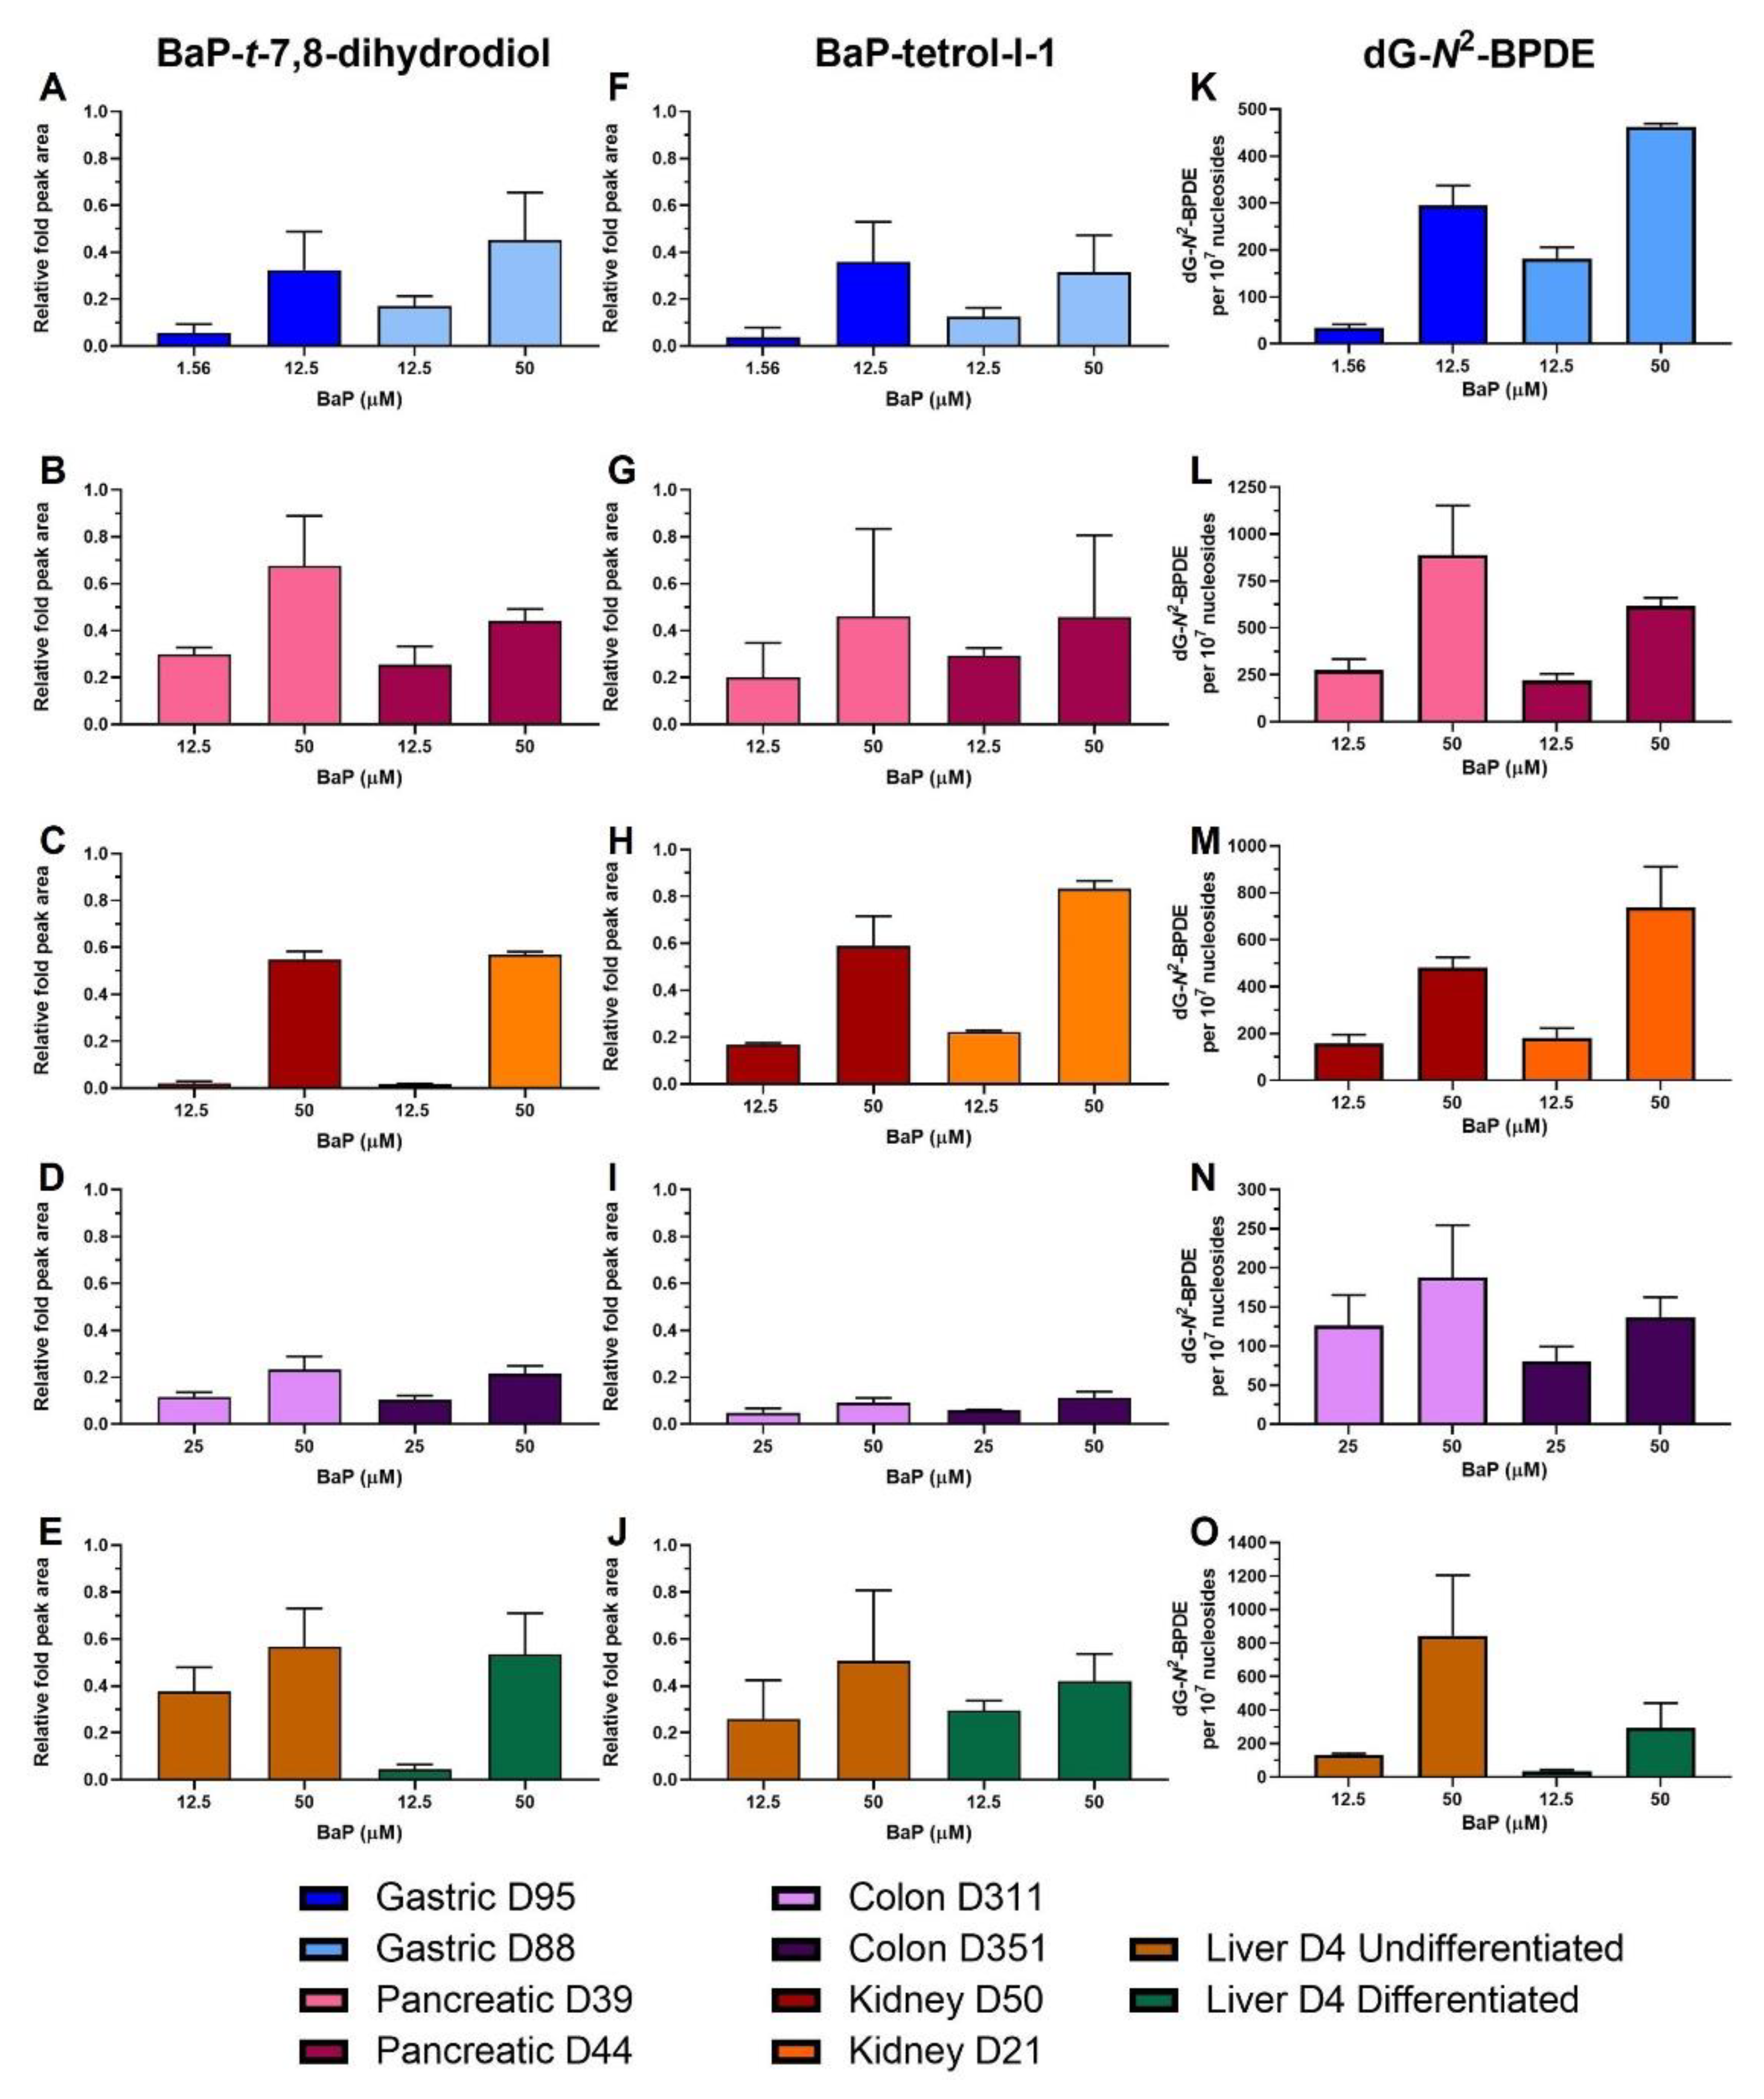
2.4. HPLC Fluorescence Analysis of BaP Metabolites
2.5. BaP-DNA Adduct Formation
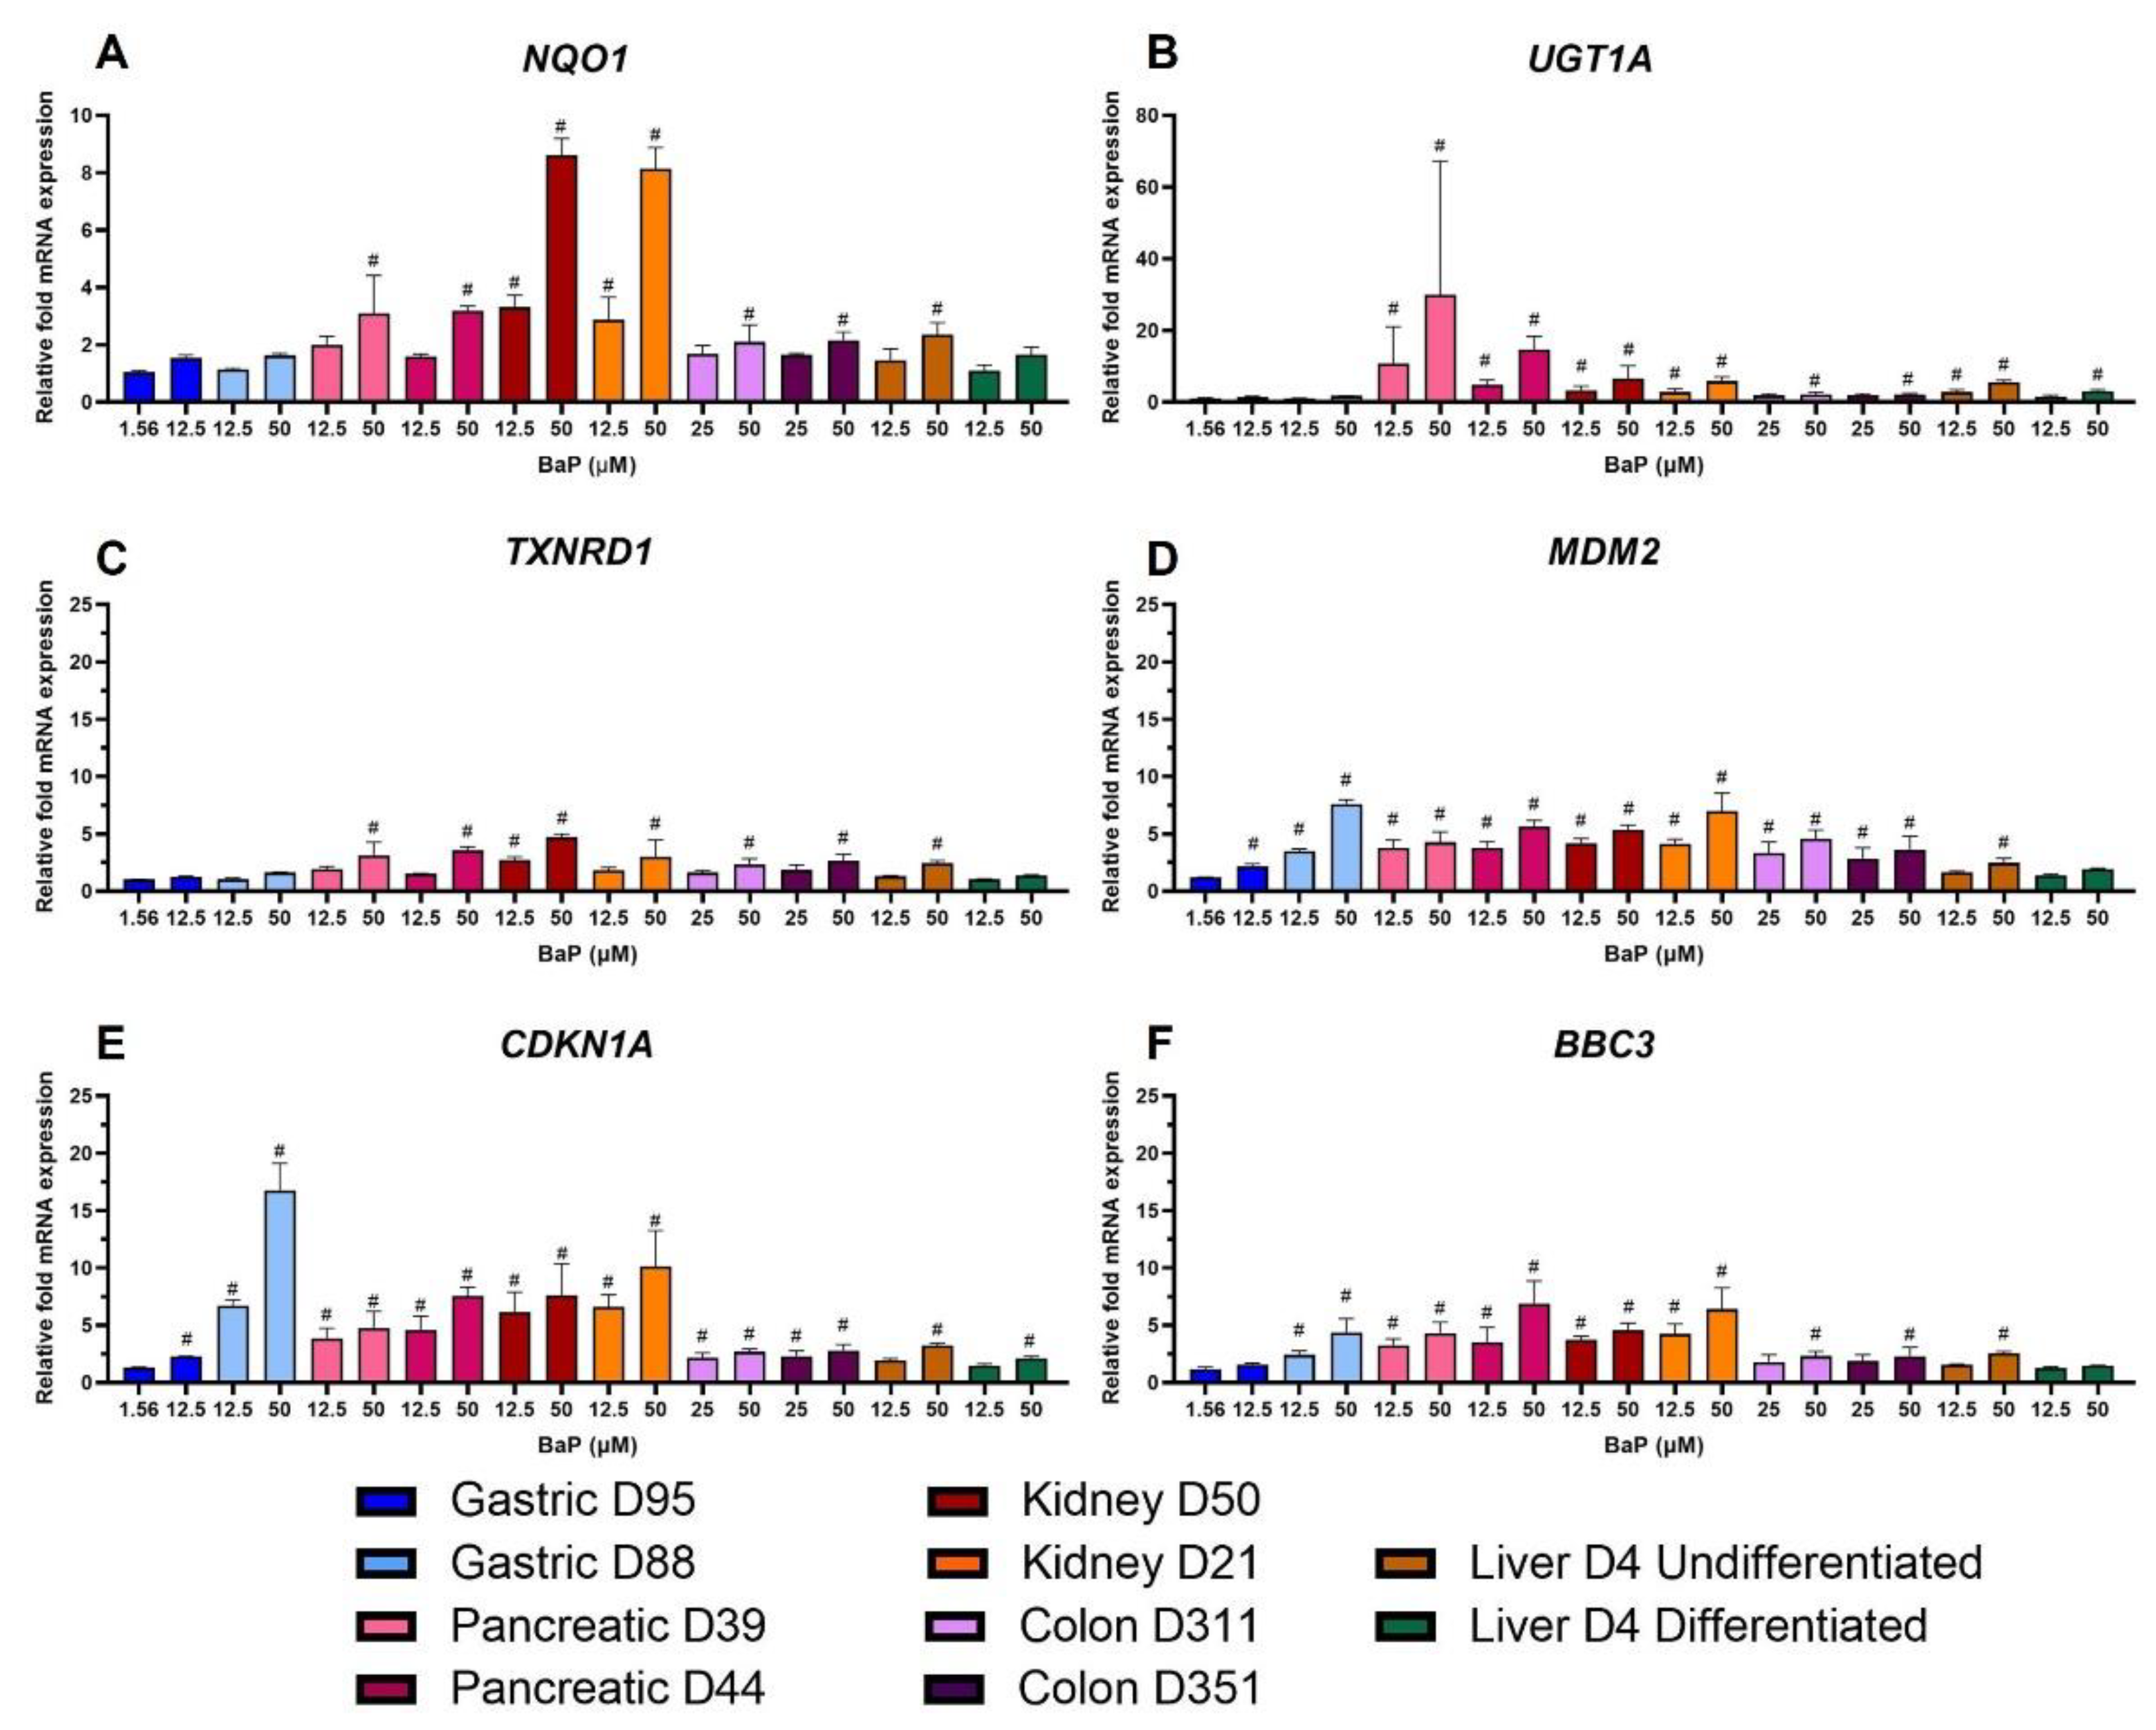
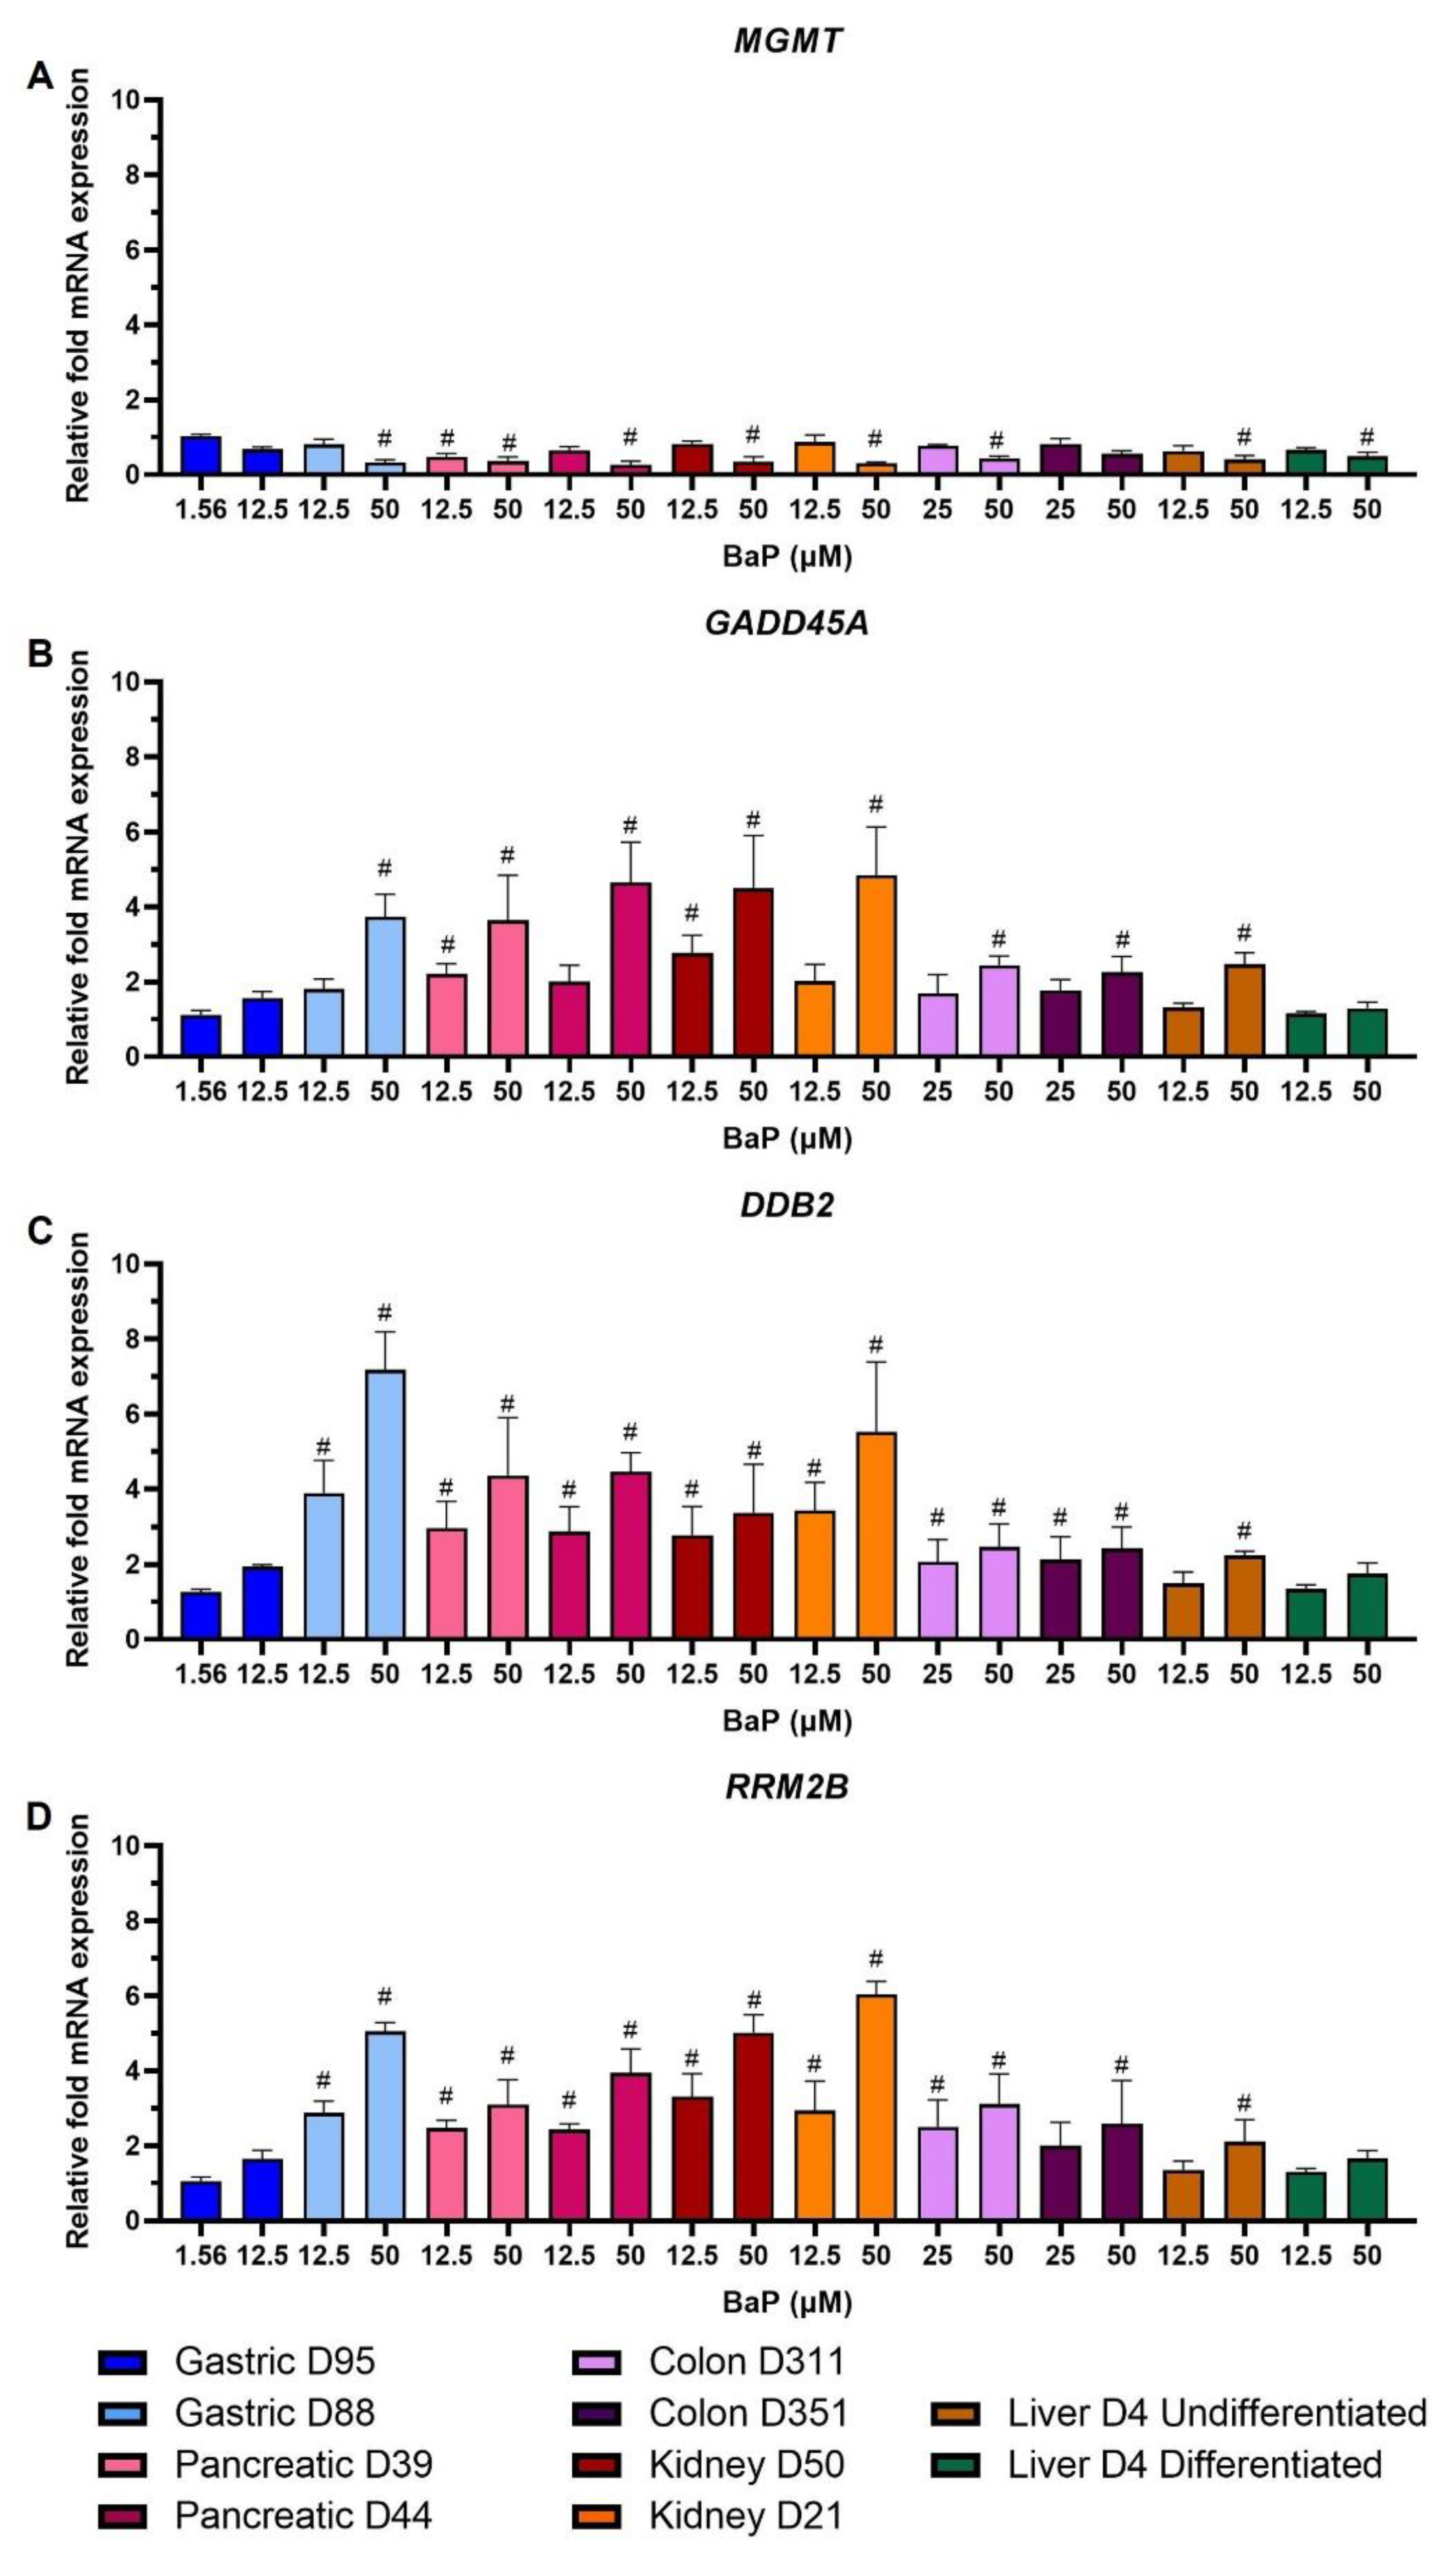
2.6. Gene Expression Changes
3. Discussion
4. Materials and Methods
4.1. Human Material for Organoid Cultures
4.2. Organoid Culture
4.3. BaP Treatment
4.4. Cell Viability Assessment
4.5. RT-qPCR
4.6. Western Blotting
4.7. Metabolite Analysis
4.8. DNA Adduct Analysis by LC-ESI-MS/MS
4.9. Statistical Analysis
Supplementary Materials
Author Contributions
Funding
Institutional Review Board Statement
Informed Consent Statement
Data Availability Statement
Acknowledgments
Conflicts of Interest
References
- IARC. Chemical agents and related occupations. In Monographs on the Evaluation of Carcinogenic Risks to Humans; IARC: Lyon, France, 2012; pp. 111–144. [Google Scholar]
- Boysen, G.; Hecht, S.S. Analysis of DNA and protein adducts of benzo[a]pyrene in human tissues using structure-specific methods. Mutat. Res. Rev. Mutat. Res. 2003, 543, 17–30. [Google Scholar] [CrossRef] [PubMed]
- Boström, C.E.; Gerde, P.; Hanberg, A.; Jernström, B.; Johansson, C.; Kyrklund, T.; Rannug, A.; Törnqvist, M.; Victorin, K.; Westerholm, R. Cancer risk assessment, indicators, and guidelines for polycyclic aromatic hydrocarbons in the ambient air. Environ. Health Perspect. 2002, 110, 451–488. [Google Scholar]
- Arlt, V.M.; Stiborová, M.; Henderson, C.J.; Thiemann, M.; Frei, E.; Aimová, D.; Singh, R.; Gamboa da Costa, G.; Schmitz, O.J.; Farmer, P.B.; et al. Metabolic activation of benzo[a]pyrene in vitro by hepatic cytochrome P450 contrasts with detoxification in vivo: Experiments with hepatic cytochrome P450 reductase null mice. Carcinogenesis 2008, 29, 656–665. [Google Scholar] [CrossRef] [PubMed] [Green Version]
- Baird, W.M.; Hooven, L.A.; Mahadevan, B. Carcinogenic polycyclic aromatic hydrocarbon-DNA adducts and mechanism of action. Environ. Mol. Mutagen. 2005, 45, 106–114. [Google Scholar] [CrossRef] [PubMed]
- Zuo, J.; Brewer, D.S.; Arlt, V.M.; Cooper, C.S.; Phillips, D.H. Benzo[a]pyrene-induced DNA adducts and gene expression profiles in target and non-target organs for carcinogenesis in mice. BMC Genom. 2014, 15, 880. [Google Scholar] [CrossRef] [Green Version]
- Kang, H.J.; Hong, Y.B.; Kim, H.J.; Yi, Y.W.; Nath, R.G.; Chang, Y.S.; Cho, H.-C.; Bae, I. A novel in vitro pancreatic carcinogenesis model. Toxicol. Lett. 2011, 202, 15–22. [Google Scholar] [CrossRef] [PubMed] [Green Version]
- Alexandrov, K.; Rojas, M.; Rolando, C. DNA damage by benzo(a)pyrene in human cells is increased by cigarette smoke and decreased by a filter containing rosemary extract, which lowers free radicals. Cancer Res. 2006, 66, 11938–11945. [Google Scholar] [CrossRef] [Green Version]
- Alexandrov, K.; Rojas, M.; Kadlubar, F.F.; Lang, N.P.; Bartsch, H. Evidence of anti-benzo[α]pyrene diolepoxide-DNA adduct formation in human colon mucosa. Carcinogenesis 1996, 17, 2081–2083. [Google Scholar] [CrossRef]
- Motwani, H.V.; Westberg, E.; Lindh, C.; Abramsson-Zetterberg, L.; Törnqvist, M. Serum albumin adducts, DNA adducts and micronuclei frequency measured in benzo[a]pyrene-exposed mice for estimation of genotoxic potency. Mutat. Res. Genet. Toxicol. Environ. Mutagen. 2020, 849, 503127. [Google Scholar] [CrossRef]
- Krais, A.M.; Speksnijder, E.N.; Melis, J.P.M.; Indra, R.; Moserova, M.; Godschalk, R.W.; van Schooten, F.J.; Seidel, A.; Kopka, K.; Schmeiser, H.H.; et al. The impact of p53 on DNA damage and metabolic activation of the environmental carcinogen benzo[a]pyrene: Effects in Trp53(+/+), Trp53(+/–) and Trp53(−/−) mice. Arch. Toxicol. 2016, 90, 839–851. [Google Scholar] [CrossRef] [Green Version]
- Monien, B.H.; Schumacher, F.; Herrmann, K.; Glatt, H.; Turesky, R.J.; Chesné, C. Simultaneous detection of multiple DNA adducts in human lung samples by isotope-dilution UPLC-MS/MS. Anal. Chem. 2015, 87, 641–648. [Google Scholar] [CrossRef]
- Chang, Y.; Siddens, L.K.; Heine, L.K.; Sampson, D.A.; Yu, Z.; Fischer, K.A.; Löhr, C.V.; Tilton, S.C. Comparative mechanisms of PAH toxicity by benzo[a]pyrene and dibenzo[def,p]chrysene in primary human bronchial epithelial cells cultured at air-liquid interface. Toxicol. Appl. Pharmacol. 2019, 379, 114644. [Google Scholar] [CrossRef] [PubMed]
- Caiment, F.; Gaj, S.; Claessen, S.; Kleinjans, J. High-throughput data integration of RNA-miRNA-circRNA reveals novel insights into mechanisms of benzo[a]pyrene-induced carcinogenicity. Nucleic Acids Res. 2015, 43, 2525–2534. [Google Scholar] [CrossRef] [PubMed] [Green Version]
- Tryndyak, V.; Kindrat, I.; Dreval, K.; Churchwell, M.I.; Beland, F.A.; Pogribny, I.P. Effect of aflatoxin B1, benzo[a]pyrene, and methapyrilene on transcriptomic and epigenetic alterations in human liver HepaRG cells. Food Chem. Toxicol. 2018, 121, 214–223. [Google Scholar] [CrossRef] [PubMed]
- Labib, S.; Yauk, C.; Williams, A.; Arlt, V.M.; Phillips, D.H.; White, P.A.; Halappanavar, S. Subchronic oral exposure to benzo(a)pyrene leads to distinct transcriptomic changes in the lungs that are related to carcinogenesis. Toxicol. Sci. 2012, 129, 213–224. [Google Scholar] [CrossRef] [PubMed]
- Theobald, J.; Ghanem, A.; Wallisch, P.; Banaeiyan, A.A.; Andrade-Navarro, M.A.; Taškova, K.; Haltmeier, M.; Kurtz, A.; Becker, H.; Reuter, S.; et al. Liver-kidney-on-chip to study toxicity of drug metabolites. ACS Biomater. Sci. Eng. 2018, 4, 78–89. [Google Scholar] [CrossRef]
- Štampar, M.; Tomc, J.; Filipič, M.; Žegura, B. Development of in vitro 3D cell model from hepatocellular carcinoma (HepG2) cell line and its application for genotoxicity testing. Arch. Toxicol. 2019, 93, 3321–3333. [Google Scholar] [CrossRef]
- Schlaermann, P.; Toelle, B.; Berger, H.; Schmidt, S.C.; Glanemann, M.; Ordemann, J.; Bartfeld, S.; Mollenkopf, H.J.; Meyer, T.F. A novel human gastric primary cell culture system for modelling Helicobacter pylori infection in vitro. Gut 2016, 65, 202–213. [Google Scholar] [CrossRef] [Green Version]
- Georgakopoulos, N.; Prior, N.; Angres, B.; Mastrogiovanni, G.; Cagan, A.; Harrison, D.; Hindley, C.J.; Arnes-Benito, R.; Liau, S.S.; Curd, A.; et al. Long-term expansion, genomic stability and in vivo safety of adult human pancreas organoids. BMC Dev. Biol. 2020, 20, 4. [Google Scholar] [CrossRef] [PubMed] [Green Version]
- Huch, M.; Gehart, H.; van Boxtel, R.; Hamer, K.; Blokzijl, F.; Verstegen, M.M.A.; Ellis, E.; van Wenum, M.; Fuchs, S.A.; de Ligt, J.; et al. Long-term culture of genome-stable bipotent stem cells from adult human liver. Cell 2015, 160, 299–312. [Google Scholar] [CrossRef] [PubMed] [Green Version]
- Schutgens, F.; Rookmaaker, M.B.; Margaritis, T.; Rios, A.; Ammerlaan, C.; Jansen, J.; Gijzen, L.; Vormann, M.; Vonk, A.; Viveen, M.; et al. Tubuloids derived from human adult kidney and urine for personalized disease modeling. Nat. Biotechnol. 2019, 37, 303–313. [Google Scholar] [CrossRef] [PubMed]
- Howell, K.J.; Kraiczy, J.; Nayak, K.M.; Gasparetto, M.; Ross, A.; Lee, C.; Mak, T.N.; Koo, B.-K.; Kumar, N.; Lawley, T.; et al. DNA methylation and transcription patterns in intestinal epithelial cells from pediatric patients with inflammatory bowel diseases differentiate disease subtypes and associate with outcome. Gastroenterology 2018, 154, 585–598. [Google Scholar] [CrossRef] [PubMed] [Green Version]
- Caipa Garcia, A.L.; Arlt, V.M.; Phillips, D.H. Organoids for toxicology and genetic toxicology: Applications with drugs and prospects for environmental carcinogenesis. Mutagenesis 2022, 37, 143–154. [Google Scholar] [CrossRef] [PubMed]
- Piberger, A.L.; Krüger, C.T.; Strauch, B.M.; Schneider, B.; Hartwig, A. BPDE-induced genotoxicity: Relationship between DNA adducts, mutagenicity in the in vitro PIG-A assay, and the transcriptional response to DNA damage in TK6 cells. Arch. Toxicol. 2018, 92, 541–551. [Google Scholar] [CrossRef] [PubMed] [Green Version]
- Shimada, T. Xenobiotic-metabolizing enzymes involved in activation and detoxification of carcinogenic polycyclic aromatic hydrocarbons. Drug Metab. Pharmacokinet. 2006, 21, 257–276. [Google Scholar] [CrossRef] [PubMed] [Green Version]
- Alotaibi, A.G.; Li, J.V.; Gooderham, N.J. Tumour necrosis factor-α (TNF-α) enhances dietary carcinogen-induced DNA damage in colorectal cancer epithelial cells through activation of JNK signaling pathway. Toxicology 2021, 457, 152806. [Google Scholar] [CrossRef] [PubMed]
- Tung, E.W.Y.; Philbrook, N.A.; Belanger, C.L.; Ansari, S.; Winn, L.M. Benzo[a]pyrene increases DNA double strand break repair in vitro and in vivo: A possible mechanism for benzo[a]pyrene-induced toxicity. Mutat. Res. Genet. Toxicol. Environ. Mutagen. 2014, 760, 64–69. [Google Scholar] [CrossRef]
- Malik, D.; David, R.M.; Gooderham, N.J. Mechanistic evidence that benzo[a]pyrene promotes an inflammatory microenvironment that drives the metastatic potential of human mammary cells. Arch. Toxicol. 2018, 92, 3223–3239. [Google Scholar] [CrossRef] [Green Version]
- Hockley, S.L.; Arlt, V.M.; Brewer, D.; Giddings, I.; Phillips, D.H. Time-and concentration-dependent changes in gene expression induced by benzo(a)pyrene in two human cell lines, MCF-7 and HepG2. BMC Bioinform. 2006, 7, 260. [Google Scholar] [CrossRef] [Green Version]
- Shah, U.K.; Seager, A.L.; Fowler, P.; Doak, S.H.; Johnson, G.E.; Scott, S.J.; Scott, A.D.; Jenkins, G.J.S. A comparison of the genotoxicity of benzo[a]pyrene in four cell lines with differing metabolic capacity. Mutat. Res. Genet. Toxicol. Environ. Mutagen. 2016, 808, 8–19. [Google Scholar] [CrossRef] [Green Version]
- Krais, A.M.; Mühlbauer, K.-R.; Kucab, J.E.; Chinbuah, H.; Cornelius, M.G.; Wei, Q.-X.; Hollstein, M.; Phillips, D.H.; Arlt, V.M.; Schmeiser, H.H. Comparison of the metabolic activation of environmental carcinogens in mouse embryonic stem cells and mouse embryonic fibroblasts. Toxicol. Vitr. 2015, 29, 34–43. [Google Scholar] [CrossRef] [PubMed]
- Arlt, V.M.; Krais, A.M.; Godschalk, R.W.; Riffo-Vasquez, Y.; Mrizova, I.; Roufosse, C.A.; Corbin, C.; Shi, Q.; Frei, E.; Stiborova, M.; et al. Pulmonary inflammation impacts on CYP1A1-mediated respiratory tract DNA damage induced by the carcinogenic air pollutant benzo[a]pyrene. Toxicol. Sci. 2015, 146, 213–225. [Google Scholar] [CrossRef] [PubMed] [Green Version]
- Hamouchene, H.; Arlt, V.M.; Giddings, I.; Phillips, D.H. Influence of cell cycle on responses of MCF-7 cells to benzo[a]pyrene. BMC Genom. 2011, 12, 333. [Google Scholar] [CrossRef] [PubMed]
- Gearhart-Serna, L.M.; Davis, J.B.; Jolly, M.K.; Jayasundara, N.; Sauer, S.J.; di Giulio, R.T.; Devi, G.R. A polycyclic aromatic hydrocarbon-enriched environmental chemical mixture enhances AhR, antiapoptotic signaling and a proliferative phenotype in breast cancer cells. Carcinogenesis 2020, 41, 1648–1659. [Google Scholar] [CrossRef] [PubMed]
- Kucab, J.E.; Zou, X.; Morganella, S.; Joel, M.; Nanda, A.S.; Nagy, E.; Gomez, C.; Degasperi, A.; Harris, R.; Jackson, S.P.; et al. A compendium of mutational signatures of environmental agents. Cell 2019, 177, 821–836.e16. [Google Scholar] [CrossRef] [Green Version]
- Christmann, M.; Boisseau, C.; Kitzinger, R.; Berac, C.; Allmann, S.; Sommer, T.; Aasland, D.; Kaina, B.; Tomicic, M.T. Adaptive upregulation of DNA repair genes following benzo(a)pyrene diol epoxide protects against cell death at the expense of mutations. Nucleic Acids Res. 2016, 44, 10727–10743. [Google Scholar] [CrossRef] [Green Version]
- Liamin, M.; Boutet-Robinet, E.; Jamin, E.L.; Fernier, M.; Khoury, L.; Kopp, B.; le Ferrec, E.; Vignard, J.; Audebert, M.; Sparfel, L. Benzo[a]pyrene-induced DNA damage associated with mutagenesis in primary human activated T lymphocytes. Biochem. Pharmacol. 2017, 137, 113–124. [Google Scholar] [CrossRef]
- Jamin, E.L.; Riu, A.; Douki, T.; Debrauwer, L.; Cravedi, J.P.; Zalko, D.; Audebert, M. Combined genotoxic effects of a polycyclic aromatic hydrocarbon (B(a)P) and a heterocyclic amine (PhIP) in relation to colorectal carcinogenesis. PLoS ONE 2013, 8, e58591. [Google Scholar] [CrossRef]
- Stiborová, M.; Moserová, M.; Černá, V.; Indra, R.; Dračínský, M.; Šulc, M.; Henderson, C.J.; Wolf, C.R.; Schmeiser, H.H.; Phillips, D.H.; et al. Cytochrome b5 and epoxide hydrolase contribute to benzo[a]pyrene-DNA adduct formation catalyzed by cytochrome P450 1A1 under low NADPH:P450 oxidoreductase conditions. Toxicology 2014, 318, 1–12. [Google Scholar] [CrossRef] [Green Version]
- Reed, L.; Mrizova, I.; Barta, F.; Indra, R.; Moserova, M.; Kopka, K.; Schmeiser, H.H.; Wolf, C.R.; Henderson, C.J.; Stiborova, M.; et al. Cytochrome b5 impacts on cytochrome P450-mediated metabolism of benzo[a]pyrene and its DNA adduct formation: Studies in hepatic cytochrome b5/P450 reductase null (HBRN) mice. Arch. Toxicol. 2018, 92, 1625–1638. [Google Scholar] [CrossRef] [Green Version]
- Holme, J.A.; Gorria, M.; Arlt, V.M.; Øvrebø, S.; Solhaug, A.; Tekpli, X.; Landvik, N.E.; Huc, L.; Fardel, O.; Lagadic-Gossmann, D. Different mechanisms involved in apoptosis following exposure to benzo[a]pyrene in F258 and Hepa1c1c7 cells. Chem. Biol. Interact. 2007, 167, 41–55. [Google Scholar] [CrossRef] [PubMed]
- Hockley, S.L.; Arlt, V.M.; Brewer, D.; Te Poele, R.; Workman, P.; Giddings, I.; Phillips, D.H. AHR- and DNA-damage-mediated gene expression responses induced by benzo(a)pyrene in human cell lines. Chem Res. Toxicol. 2007, 20, 1797–1810. [Google Scholar] [CrossRef] [PubMed]
- Long, A.S.; Wills, J.W.; Krolak, D.; Guo, M.; Dertinger, S.D.; Arlt, V.M.; White, P.A. Benchmark dose analyses of multiple genetic toxicity endpoints permit robust, cross-tissue comparisons of MutaMouse responses to orally delivered benzo[a]pyrene. Arch. Toxicol. 2018, 92, 967–982. [Google Scholar] [CrossRef] [PubMed] [Green Version]
- Lemieux, C.L.; Douglas, G.R.; Gingerich, J.; Phonethepswath, S.; Torous, D.K.; Dertinger, S.D.; Phillips, D.H.; Arlt, V.M.; White, P.A. Simultaneous measurement of benzo[a]pyrene-induced Pig-a and lacZ mutations, micronuclei and DNA adducts in MutaTM mouse. Environ. Mol. Mutagen. 2011, 52, 756–765. [Google Scholar] [CrossRef] [Green Version]
- Labib, S.; Guo, C.H.; Williams, A.; Yauk, C.L.; White, P.A.; Halappanavar, S. Toxicogenomic outcomes predictive of forestomach carcinogenesis following exposure to benzo(a)pyrene: Relevance to human cancer risk. Toxicol. Appl. Pharmacol. 2013, 273, 269–280. [Google Scholar] [CrossRef] [Green Version]
- Dreij, K.; Rhrissorrakrai, K.; Gunsalus, K.C.; Geacintov, N.E.; Scicchitano, D.A. Benzo[a]pyrene diol epoxide stimulates an inflammatory response in normal human lung fibroblasts through a p53 and JNK mediated pathway. Carcinogenesis 2010, 31, 1149. [Google Scholar] [CrossRef] [PubMed] [Green Version]
- Hölzl-Armstrong, L.; Nævisdal, A.; Cox, J.A.; Long, A.S.; Chepelev, N.L.; Phillips, D.H.; White, P.A.; Arlt, V.M. In vitro mutagenicity of selected environmental carcinogens and their metabolites in MutaMouse FE1 lung epithelial cells. Mutagenesis 2020, 35, 453–463. [Google Scholar] [CrossRef]
- Baker, S.C.; Arlt, V.M.; Indra, R.; Joel, M.; Stiborová, M.; Eardley, I.; Ahmad, N.; Otto, W.; Burger, M.; Rubenwolf, P.; et al. Differentiation-associated urothelial cytochrome P450 oxidoreductase predicates the xenobiotic-metabolizing activity of “luminal” muscle-invasive bladder cancers. Mol. Carcinog. 2018, 57, 606–618. [Google Scholar] [CrossRef] [Green Version]
- Villalta, P.W.; Hochalter, J.B.; Hecht, S.S. Ultrasensitive high-resolution mass spectrometric analysis of a DNA adduct of the carcinogen benzo[a]pyrene in human lung. Anal. Chem. 2017, 89, 12735–12742. [Google Scholar] [CrossRef]


Disclaimer/Publisher’s Note: The statements, opinions and data contained in all publications are solely those of the individual author(s) and contributor(s) and not of MDPI and/or the editor(s). MDPI and/or the editor(s) disclaim responsibility for any injury to people or property resulting from any ideas, methods, instructions or products referred to in the content. |
© 2022 by the authors. Licensee MDPI, Basel, Switzerland. This article is an open access article distributed under the terms and conditions of the Creative Commons Attribution (CC BY) license (https://creativecommons.org/licenses/by/4.0/).
Share and Cite
Caipa Garcia, A.L.; Kucab, J.E.; Al-Serori, H.; Beck, R.S.S.; Fischer, F.; Hufnagel, M.; Hartwig, A.; Floeder, A.; Balbo, S.; Francies, H.; et al. Metabolic Activation of Benzo[a]pyrene by Human Tissue Organoid Cultures. Int. J. Mol. Sci. 2023, 24, 606. https://doi.org/10.3390/ijms24010606
Caipa Garcia AL, Kucab JE, Al-Serori H, Beck RSS, Fischer F, Hufnagel M, Hartwig A, Floeder A, Balbo S, Francies H, et al. Metabolic Activation of Benzo[a]pyrene by Human Tissue Organoid Cultures. International Journal of Molecular Sciences. 2023; 24(1):606. https://doi.org/10.3390/ijms24010606
Chicago/Turabian StyleCaipa Garcia, Angela L., Jill E. Kucab, Halh Al-Serori, Rebekah S. S. Beck, Franziska Fischer, Matthias Hufnagel, Andrea Hartwig, Andrew Floeder, Silvia Balbo, Hayley Francies, and et al. 2023. "Metabolic Activation of Benzo[a]pyrene by Human Tissue Organoid Cultures" International Journal of Molecular Sciences 24, no. 1: 606. https://doi.org/10.3390/ijms24010606