Article

Mitochonic Acid 5 Improves Duchenne Muscular Dystrophy and Parkinson’s Disease Model of Caenorhabditis elegans

1
Graduate School of Life Sciences, Tohoku University, Sendai 980-8577, Japan
2
Biomedical Research Core, Tohoku University Graduate School of Medicine, Sendai 980-0872, Japan
3
Department of Clinical Biology and Hormonal Regulation, Tohoku University Graduate School of Medicine, Sendai 980-0872, Japan
*
Author to whom correspondence should be addressed.
Int. J. Mol. Sci. 2022, 23(17), 9572; https://doi.org/10.3390/ijms23179572
Submission received: 18 July 2022 / Revised: 9 August 2022 / Accepted: 23 August 2022 / Published: 24 August 2022

Abstract

:
Mitochonic Acid 5 (MA-5) enhances mitochondrial ATP production, restores fibroblasts from mitochondrial disease patients and extends the lifespan of the disease model “Mitomouse”. Additionally, MA-5 interacts with mitofilin and modulates the mitochondrial inner membrane organizing system (MINOS) in mammalian cultured cells. Here, we used the nematode Caenorhabditis elegans to investigate whether MA-5 improves the Duchenne muscular dystrophy (DMD) model. Firstly, we confirmed the efficient penetration of MA-5 in the mitochondria of C. elegans. MA-5 also alleviated symptoms such as movement decline, muscular tone, mitochondrial fragmentation and Ca2+ accumulation of the DMD model. To assess the effect of MA-5 on mitochondria perturbation, we employed a low concentration of rotenone with or without MA-5. MA-5 significantly suppressed rotenone-induced mitochondria reactive oxygen species (ROS) increase, mitochondrial network fragmentation and nuclear destruction in body wall muscles as well as endogenous ATP levels decline. In addition, MA-5 suppressed rotenone-induced degeneration of dopaminergic cephalic (CEP) neurons seen in the Parkinson’s disease (PD) model. Furthermore, the application of MA-5 reduced mitochondrial swelling due to the immt-1 null mutation. These results indicate that MA-5 has broad mitochondrial homing and MINOS stabilizing activity in metazoans and may be a therapeutic agent for these by ameliorating mitochondrial dysfunction in DMD and PD.

1. Introduction

We have developed a mitochondrial homing drug, Mitochonic Acid 5 (MA-5: 4-(2,4-difluorophenyl)-2-(1H-indol-3-yl)-4-oxobutanoic acid), which was synthesized as a derivative of the plant hormone, indole-3-acetic acid (IAA) [1]. Interestingly, IAA is also found in human organs at micromolar concentrations and accumulates in patients with renal failure [2,3,4]. MA-5 was screened as a derivative that increases cellular ATP levels [1]. It also reduces mitochondrial reactive oxygen species (ROS) production, protects cells with mitochondrial dysfunction from fibroblast death and prolongs the survival of a mitochondrial disease model mouse “Mitomouse”, that contains a mtDNA deletion mutation [1,5,6,7].
The most severe and common muscular dystrophy, Duchenne muscular dystrophy (DMD), is a serious progressive muscle disease caused by mutations in the DMD (dystrophin-encoding) gene. In the meantime, Parkinson’s disease (PD) is the second most prevalent neurodegenerative disease in the world. There is increasing evidence that mitochondrial dysfunction leads to progressive deterioration in patients with DMD or PD [8,9]. The underlying pathophysiologies of DMD and PD are complex, but mitochondrial dysfunction is a prominent early consequence established in both [10,11]. At present, treatments of these diseases are largely targeted at controlling the symptoms and focus on maximizing quality of life. Current standard pharmaceutical treatments such as the corticosteroid prednisone for DMD, and L-DOPA and dopamine agonists for PD are also associated with several undesirable side effects [12,13]. Therefore, although there are still no satisfactory therapies available for mitochondrial disorders, pharmaceutical treatments that enhance mitochondrial function or treat the consequences of mitochondrial dysfunction are considered to be effective not only for mitochondrial diseases but also for DMD and PD. Therefore, the novel MA-5, which is effective against mitochondrial disease models [1,5,6,7], is also expected to be effective against skeletal muscle dysfunction in DMD and dopaminergic neurodegeneration in PD.
The nematode Caenorhabditis elegans (C. elegans) provides the advantage of conducting aging and disease model studies due to the homology it shares with human genome [14]. C. elegans has approximately 20,000 protein-coding genes, about the same number as humans, and most proteins involved in basic cell function and metabolism are mammalian homologues [15]. In particular, many genes associated with human diseases such as dys-1 (an ortholog of human DMD) and pdr-1 (an ortholog of human PRKN) are highly conserved in nematodes at the molecular level [16,17]. Furthermore, green fluorescent protein (GFP)-based live-imaging techniques can visualize neuromuscular dysfunctions in C. elegans. As an example, in studying PD, the administration of the neurotoxins 6-hydroxydopamine (6-OHDA) leads to the visualization of dopaminergic neurodegeneration in the dat-1p::GFP transgenic C. elegans TG2435 [18,19]. Similarly, chronic exposure to low concentration (2–4 μM) of rotenone, an inhibitor of mitochondrial electron transport chain (ETC) complex I, causes dopaminergic neurodegeneration not only in rodents but also in C. elegans [19,20,21,22,23,24]. Moreover, in C. elegans upon overexpression of human mutant α-synuclein, similar dopaminergic neurodegeneration can be visualized in an age-dependent manner [25]. Recently, using Cas-CRISPR technology, if there is in sufficient conservation in the C. elegans homologue, the target protein can be replaced by one encoded by the human gene [26,27]. These disease and aging models have been used to develop novel drugs [15,28,29,30,31,32]. In this study, we evaluated whether MA-5 could alleviate the manifestations in body wall muscle (BWM) cells in a C. elegans DMD model and alleviate the changes in dopaminergic neurons in a C. elegans PD model.

2. Results

2.1. Penetration and Homing Activity of MA-5 into Intact C. elegans Mitochondria

In normal human fibroblasts, fluorescence-labeled MA-5 (BODIPY-MA-5) efficiently penetrates mitochondria as mitochondrial homing activity [5]. To confirm the penetration of MA-5 into C. elegans, wild-type adult hermaphrodites were treated with BODIPY-MA-5 solution for 30 min. The green fluorescent signals of BODIPY-MA-5 were observed on mitochondria in BWM cells, germ cells and intestine and closely matched the blue fluorescent signals of AIE™ Mitochondria Blue (Figure 1A,B). In contrast, BODIPY on its own effectively stained intestinal lipid droplets and germ cell membranes [33] (Figure 1A). These clearly show that MA-5 can penetrate almost all mitochondria in intact living C. elegans.
Administration of MA-5 at a final concentration of at least 20 μM even increased the median lifespan of ATU3301 animals by about 1 day, but the change was not significant (Table 1). Subsequent experiments were treated at a final concentration of 10 μM, as used in human patient fibroblasts [1].

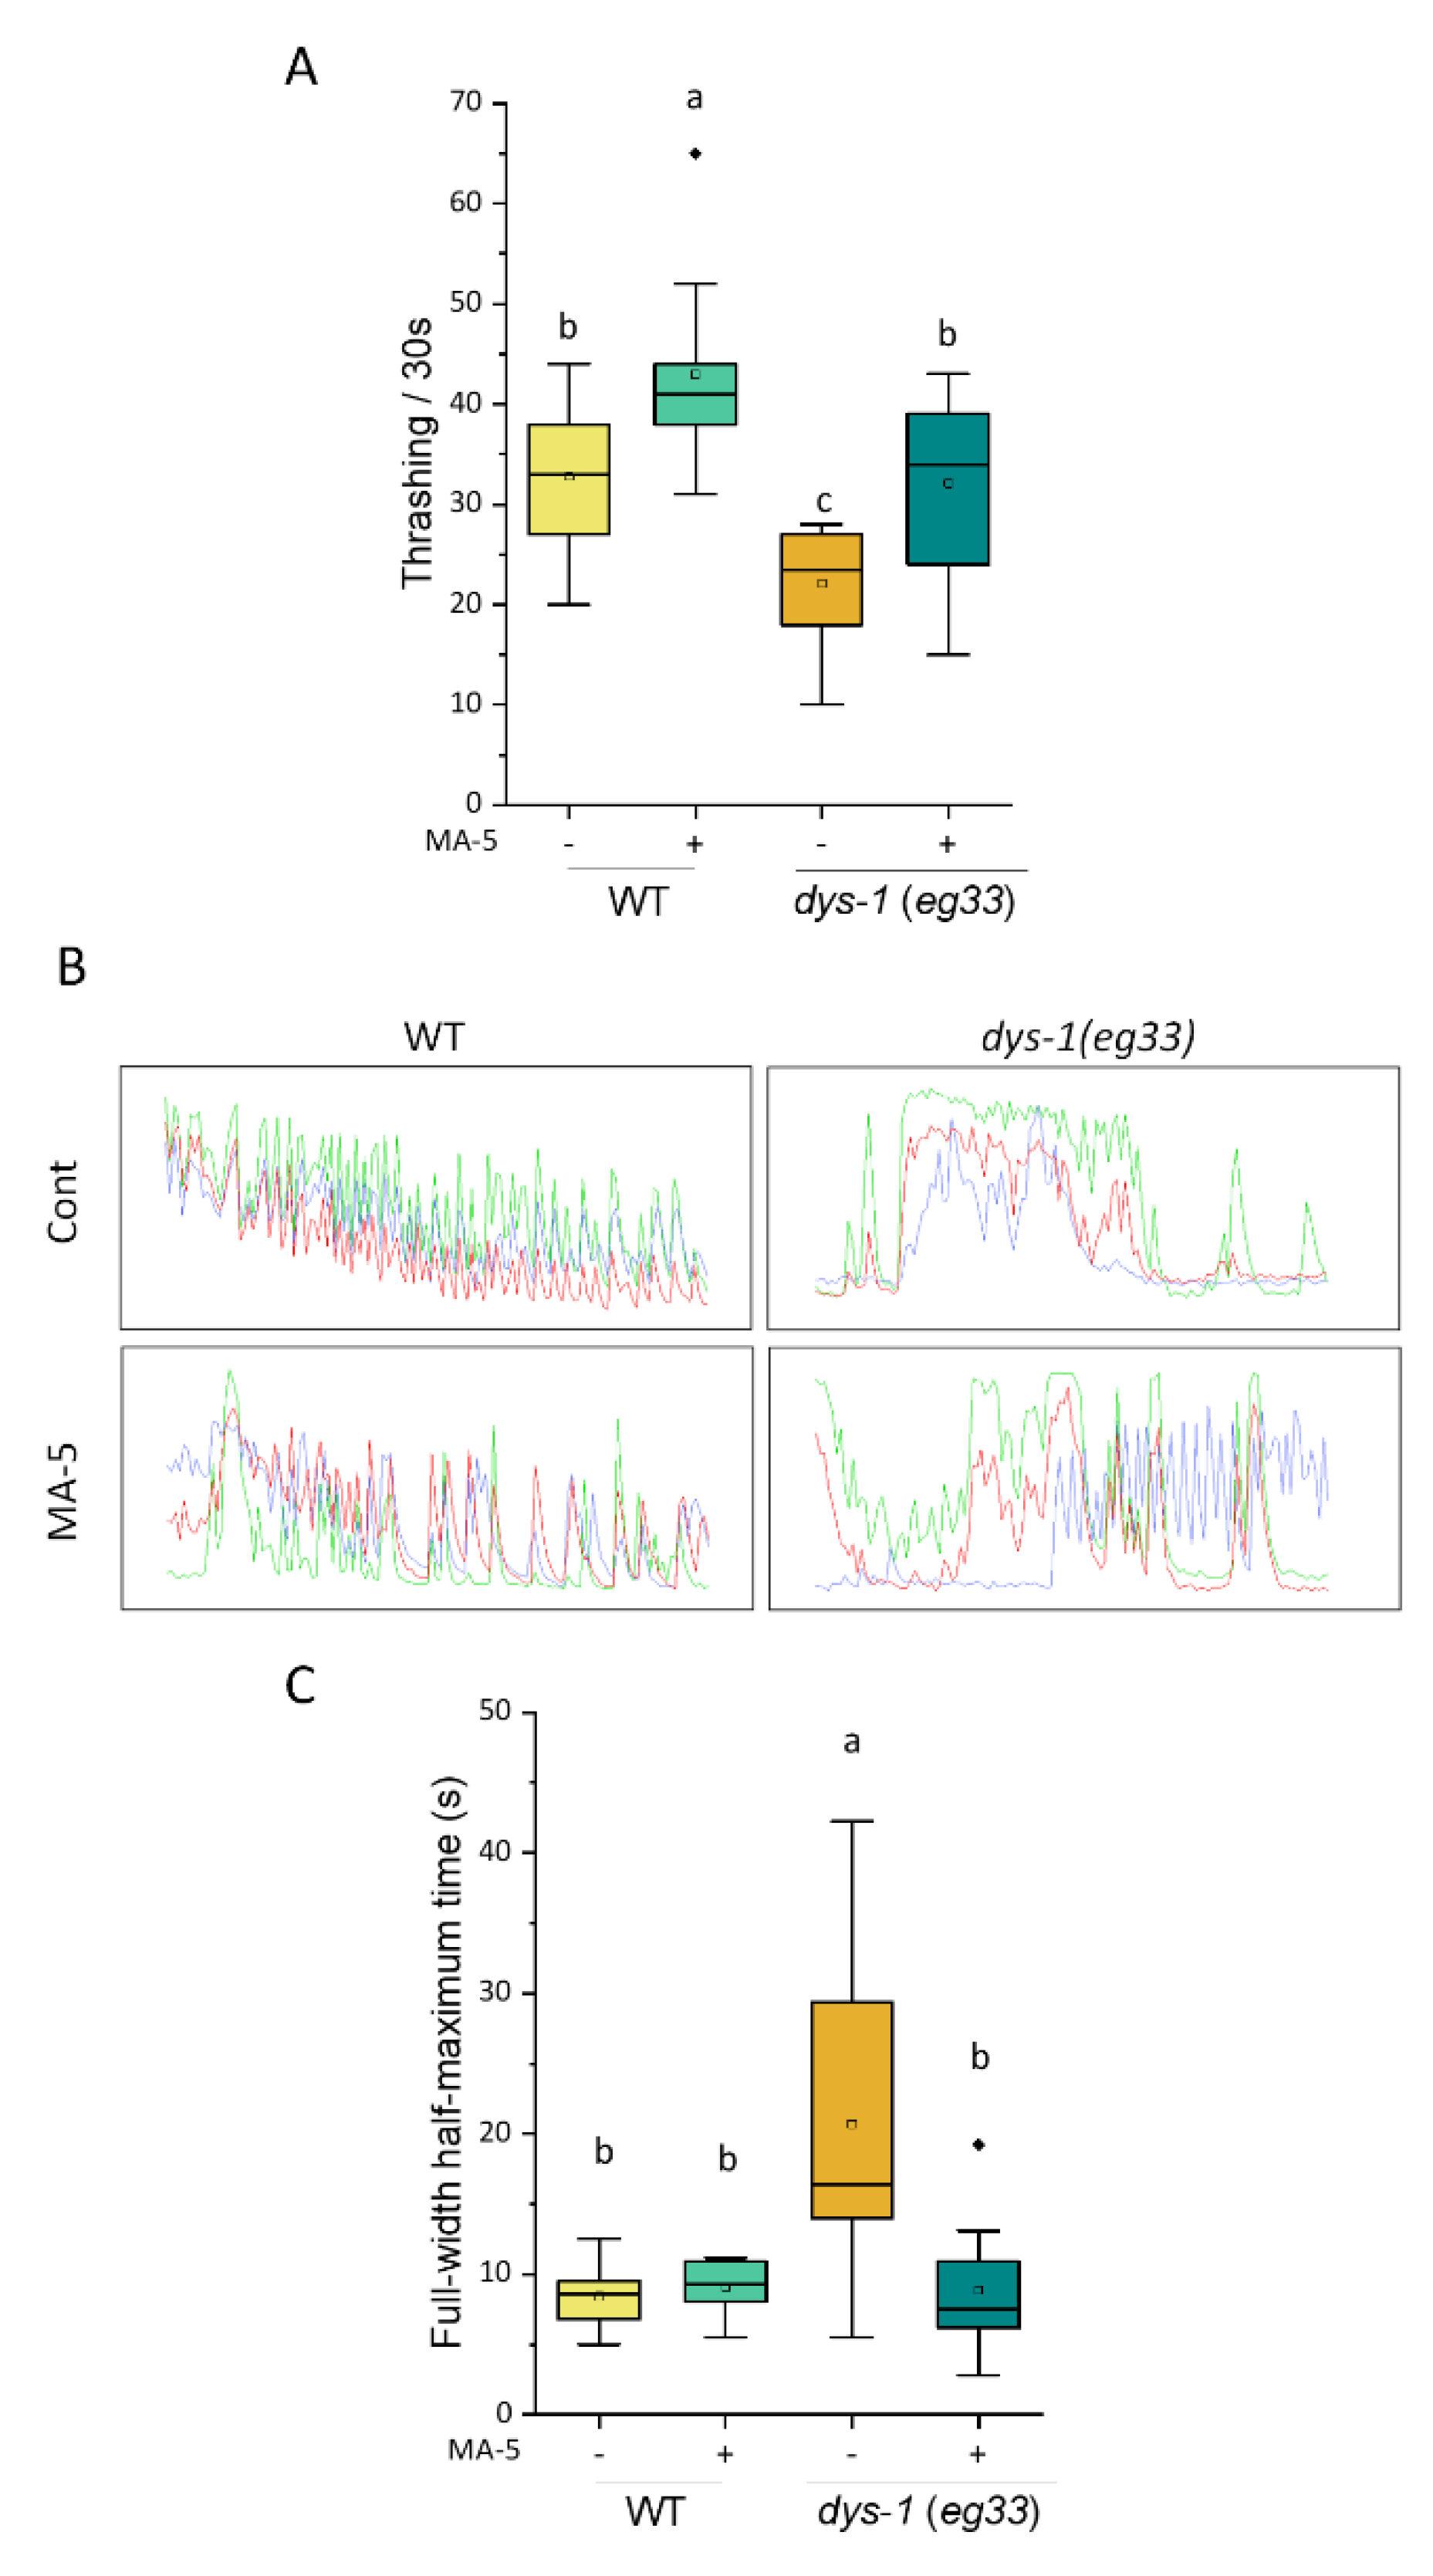
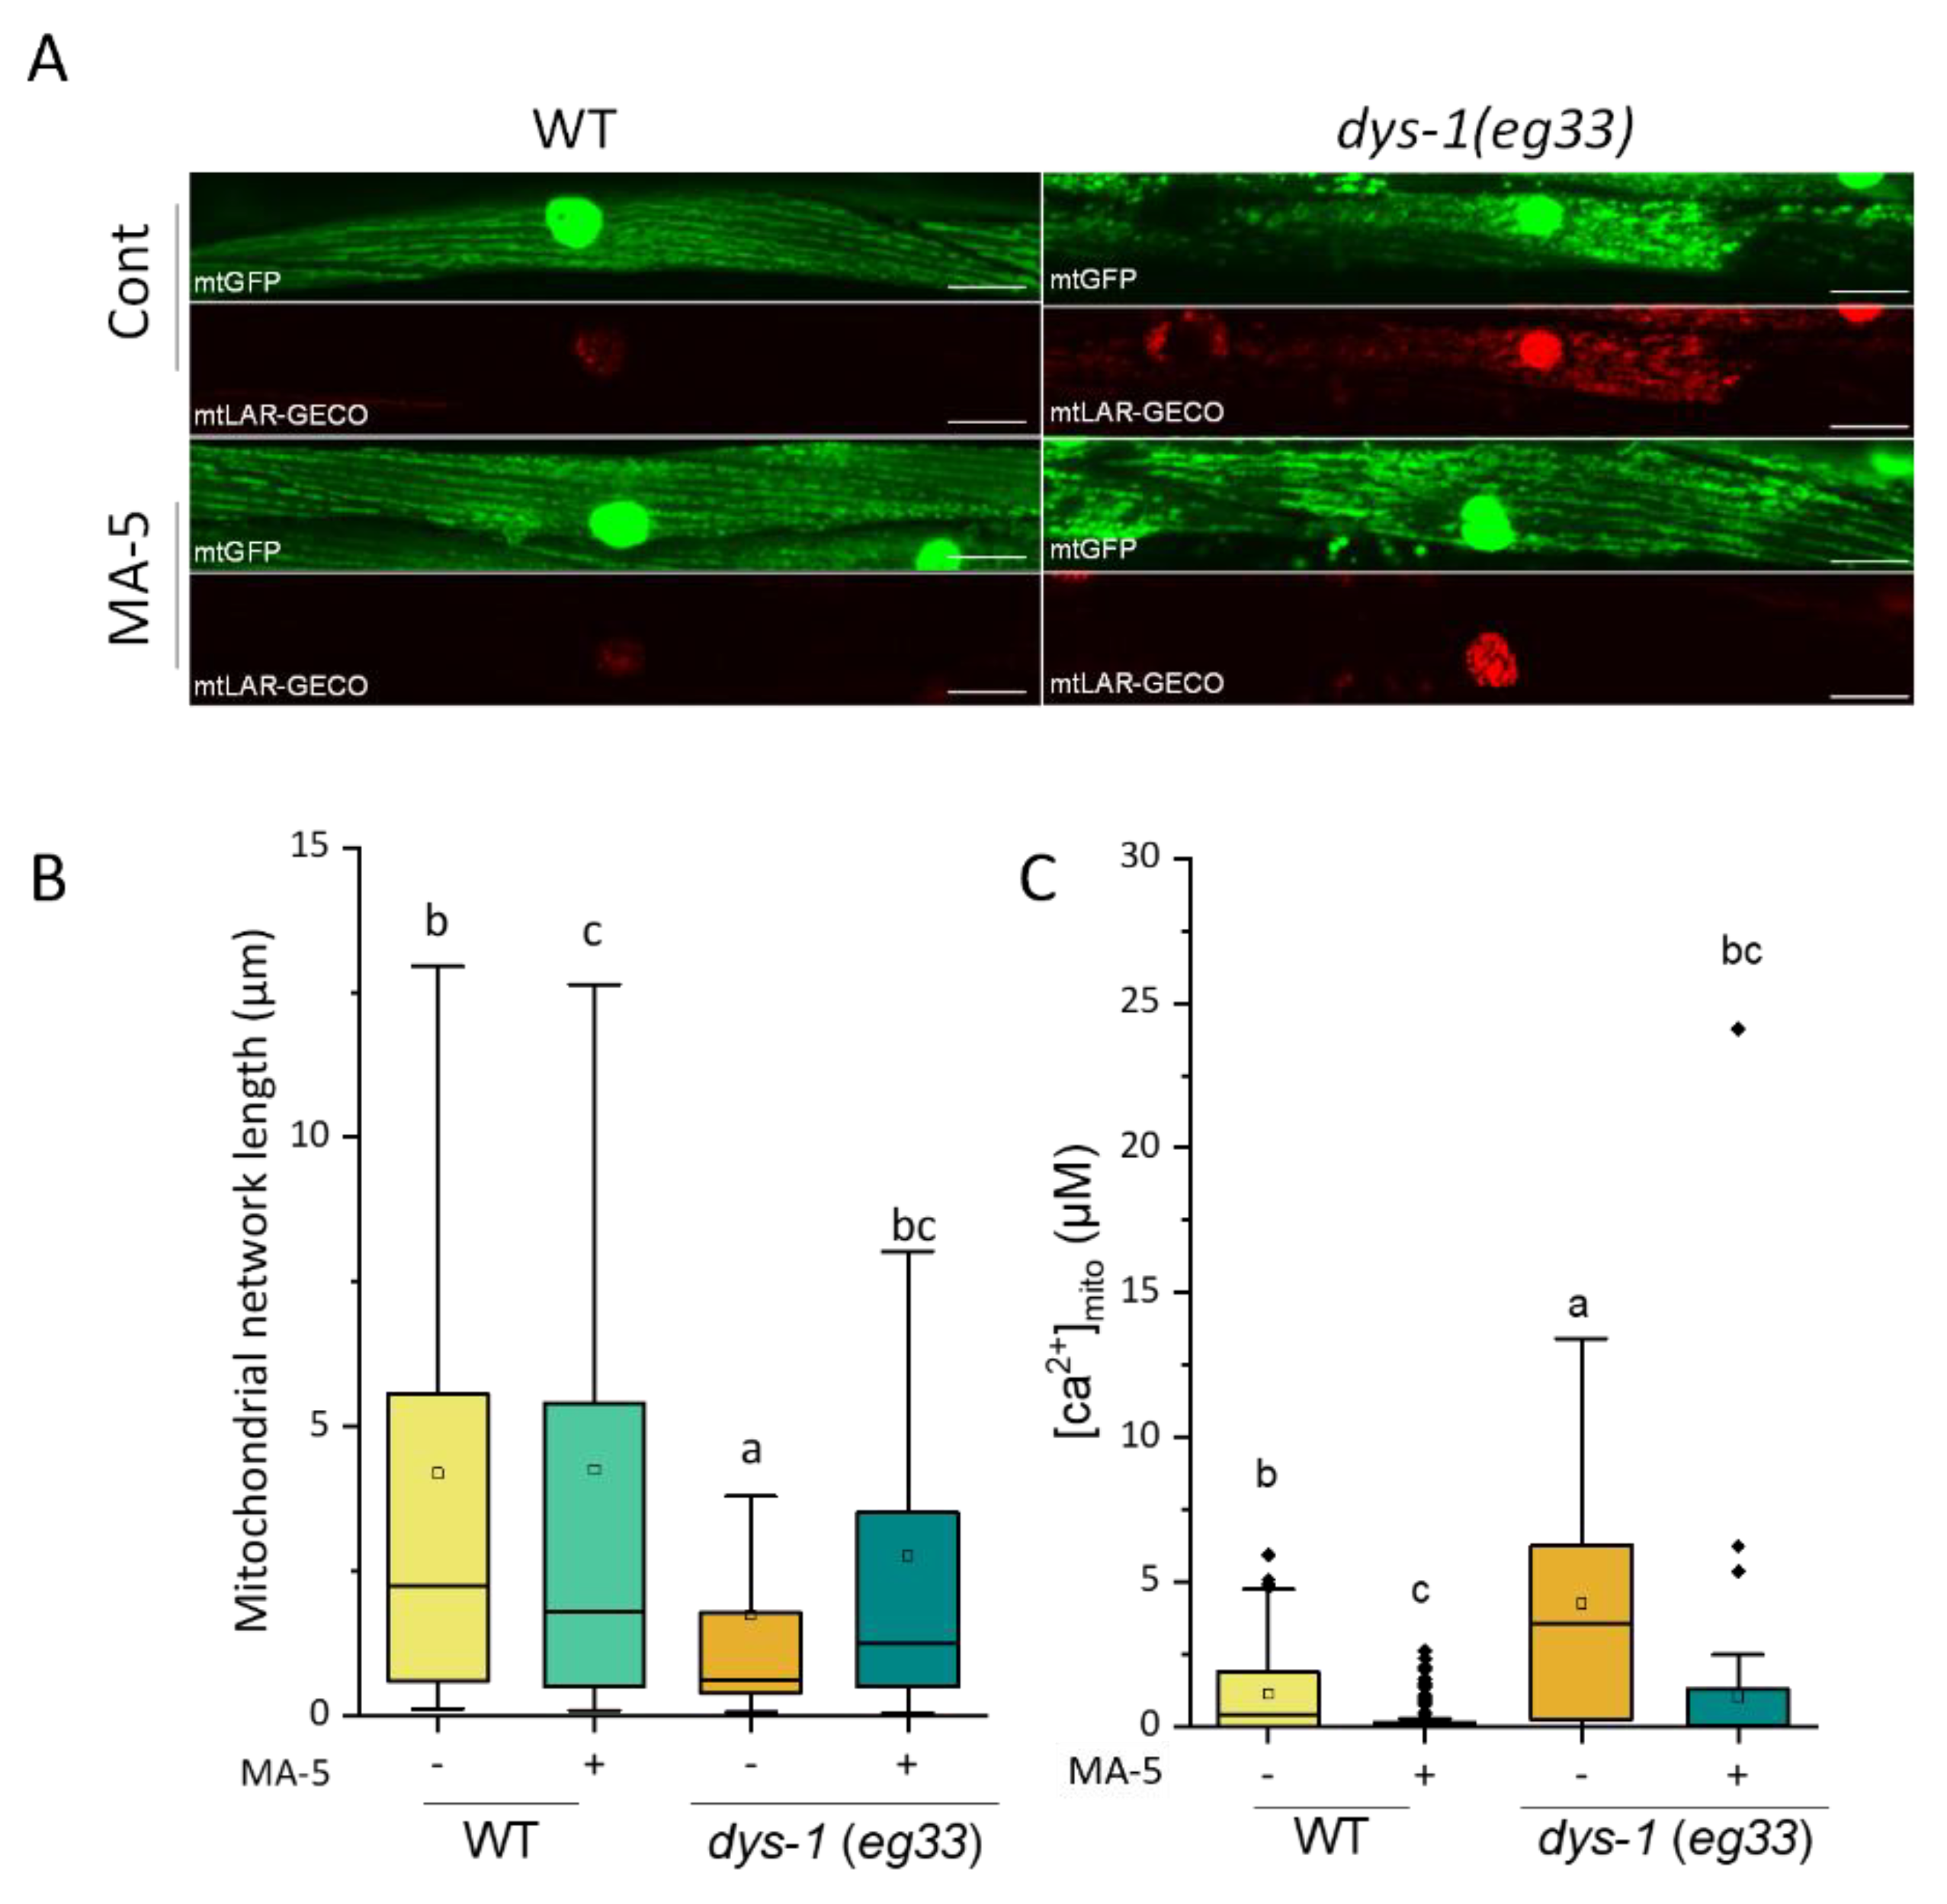
2.2. Alleviation of C. elegans DMD Model Symptom by MA-5

Similar to the human DMD, the C. elegans dys-1 (eg33) mutation synthesizes a C-terminal truncated dystrophin protein that loses scaffolding function [35]. In the dys-1 (eg33) mutant adults synchronized on day 2, a decrease in motility (thrashing rate) was significantly attenuated by treatment with MA-5 (Figure 2A). In addition, the movement of wild-type (WT) worms was slightly but significantly increased by MA-5 treatment. Next, using the goeIs GCaMP sensor, we studied muscular cytoplasmic Ca2+ ([Ca2+]cyto) cycling with contraction and relaxation. In the BWM cells of a WT worm immobilized with microspheres, the full-width half-maximum (FWHM) time of delta [Ca2+]cyto was around 10 s for each cycle (Figure 2B,C, Supplementary Movie S1). On the other hand, the FWHM of dys-1 mutants was broadened to more than 20 s, indicating that the dys-1 mutant had a longer accumulation of [Ca2+]cyto, similar to typical human muscular dystrophy [36,37]. Intriguingly, the MA-5 treatment significantly improved the expanded FWHM (Figure 2C). This suggests that in the DMD model, the administration of MA-5 smoothed the movement of muscle contraction and relaxation cycle and increased the thrash rate.
For the dys-1 (eg33) mutants, a severely fragmented mitochondrial network shown in the BWM cells of young adults, was improved by prednisone and NaGYY treatments, and restored to motility [31,38]. We, therefore, tested the effect of MA-5 on improvements in mitochondrial structure. As shown in Figure 3A,B, the fragmented network (1.74 ± 0.08 μm) was significantly improved by MA-5 treatment (2.76 ± 0.12 μm). Furthermore, it was confirmed that the accumulation of Ca2+ in the mitochondria ([Ca2+]mito), due to the dys-1 defect, also improved with MA-5 treatment (Figure 3A,C). These results indicated that MA-5 could improve the health of C. elegans DMD model.

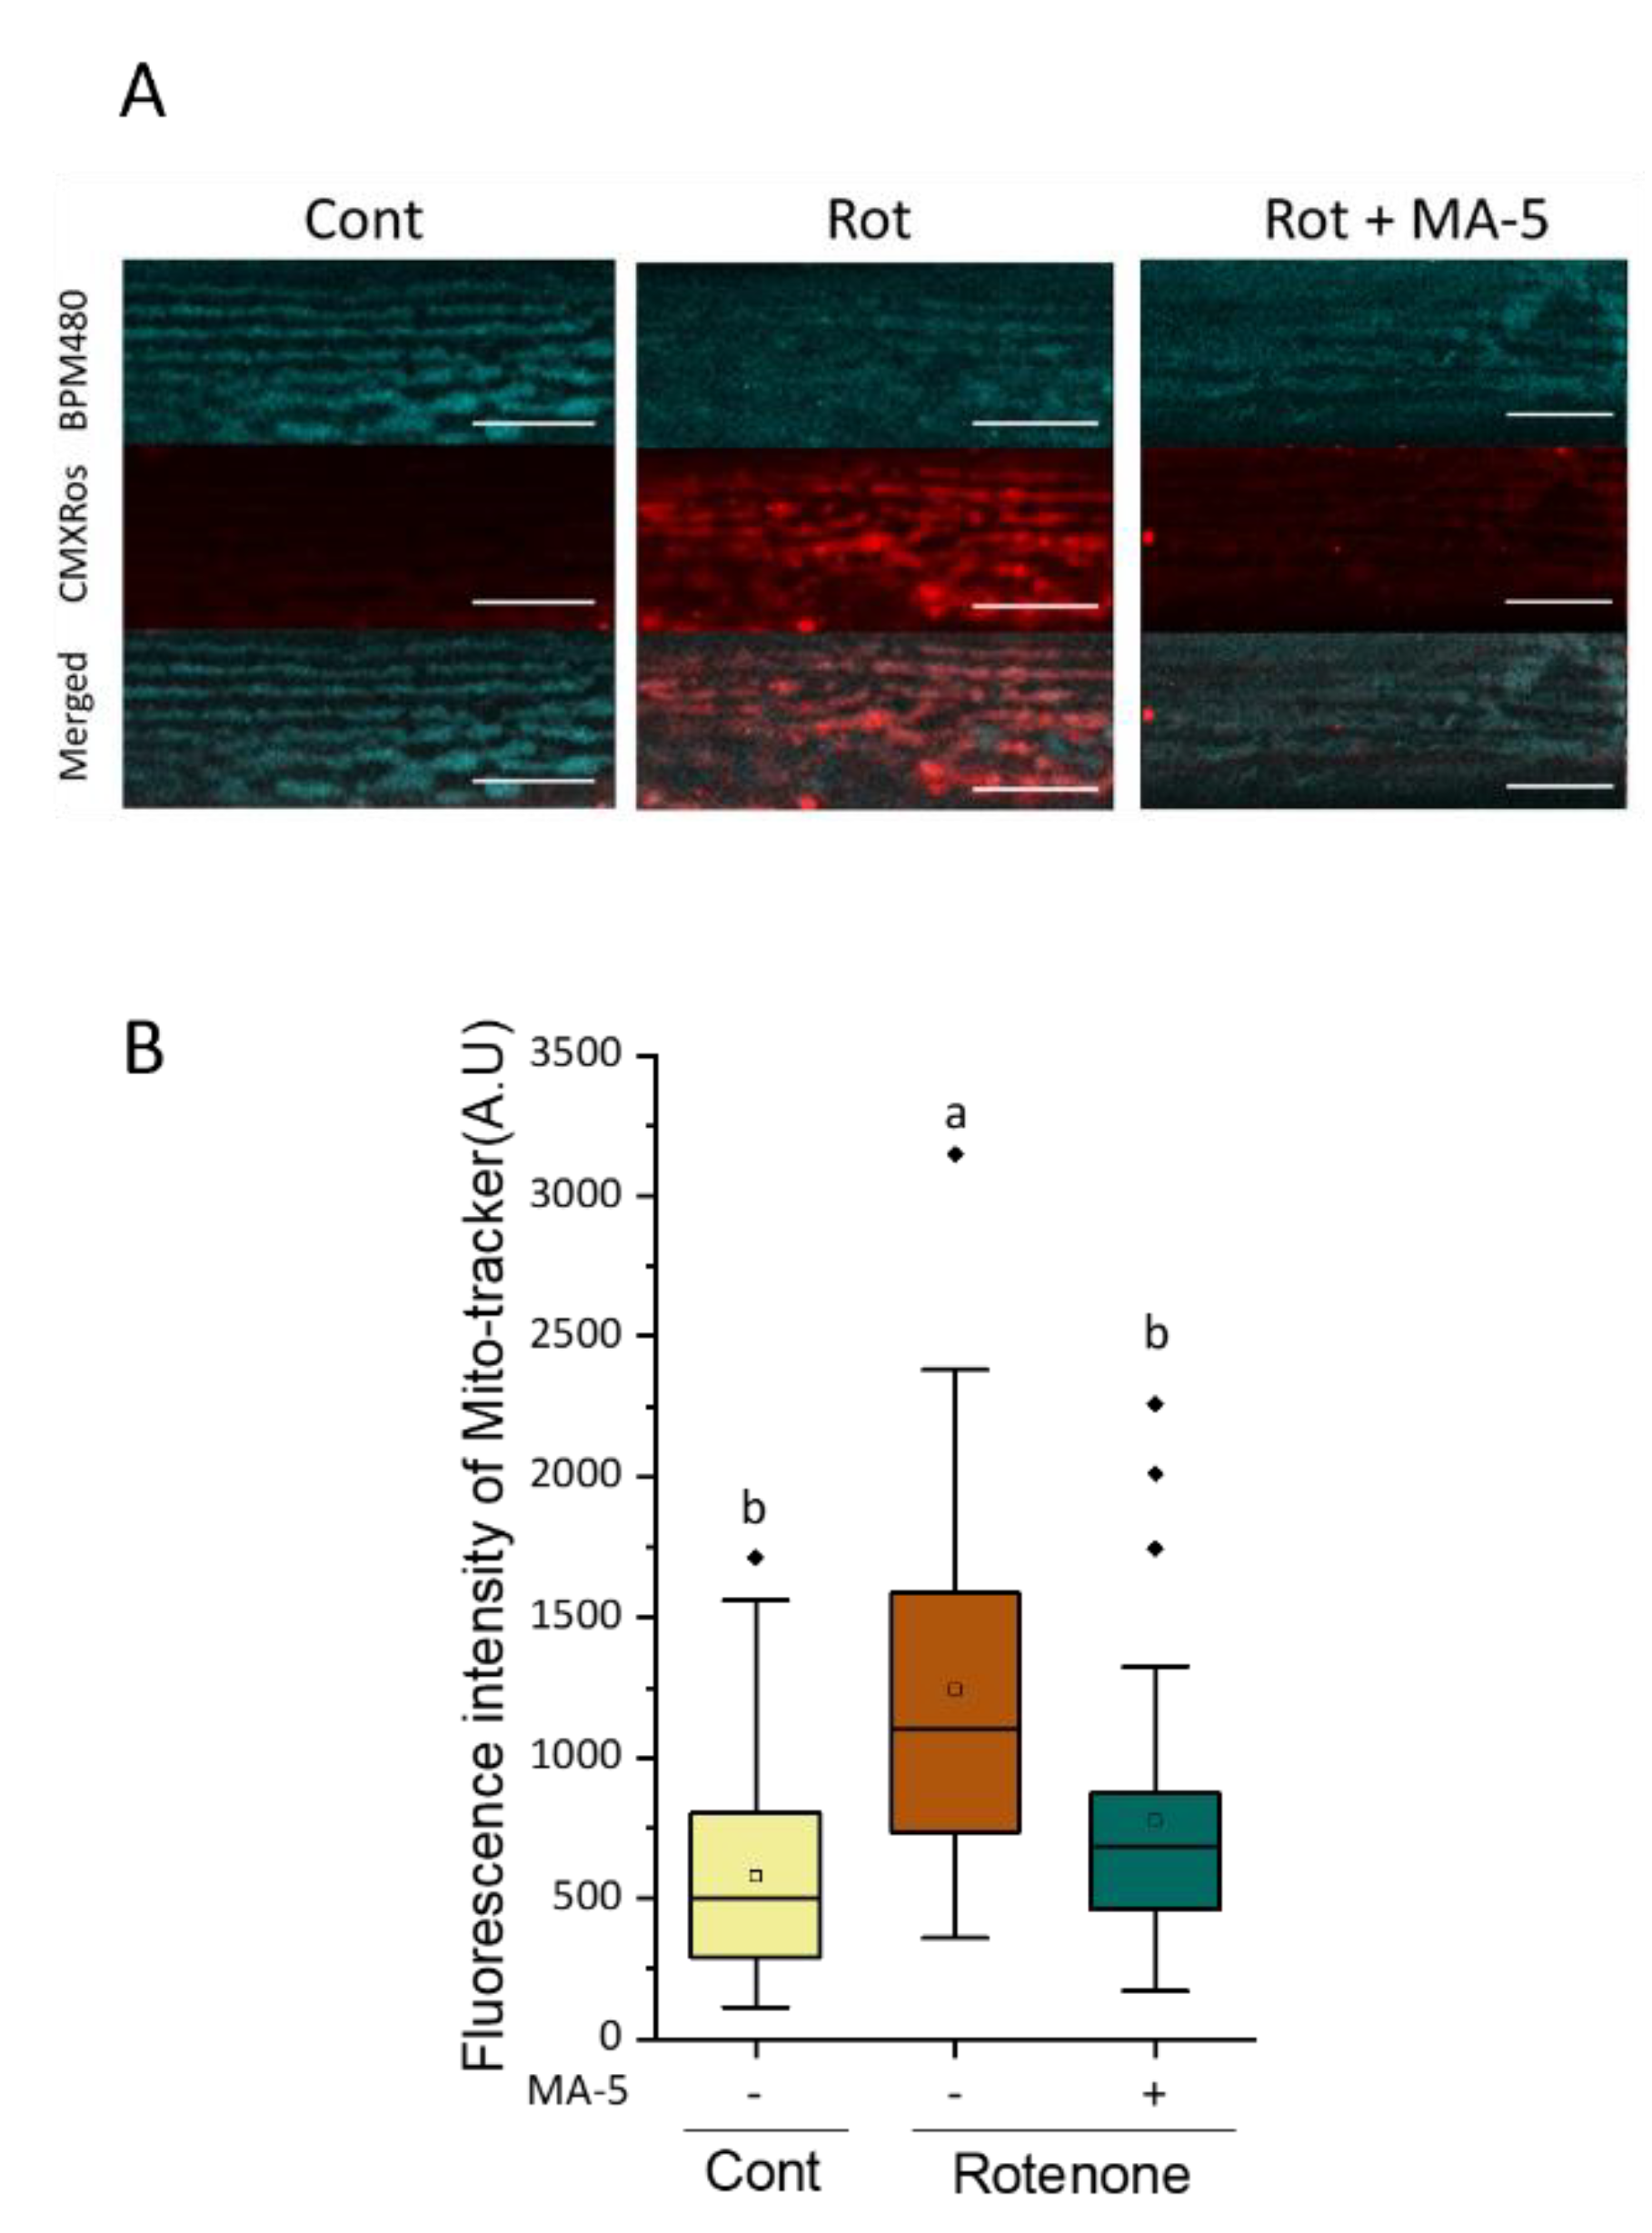
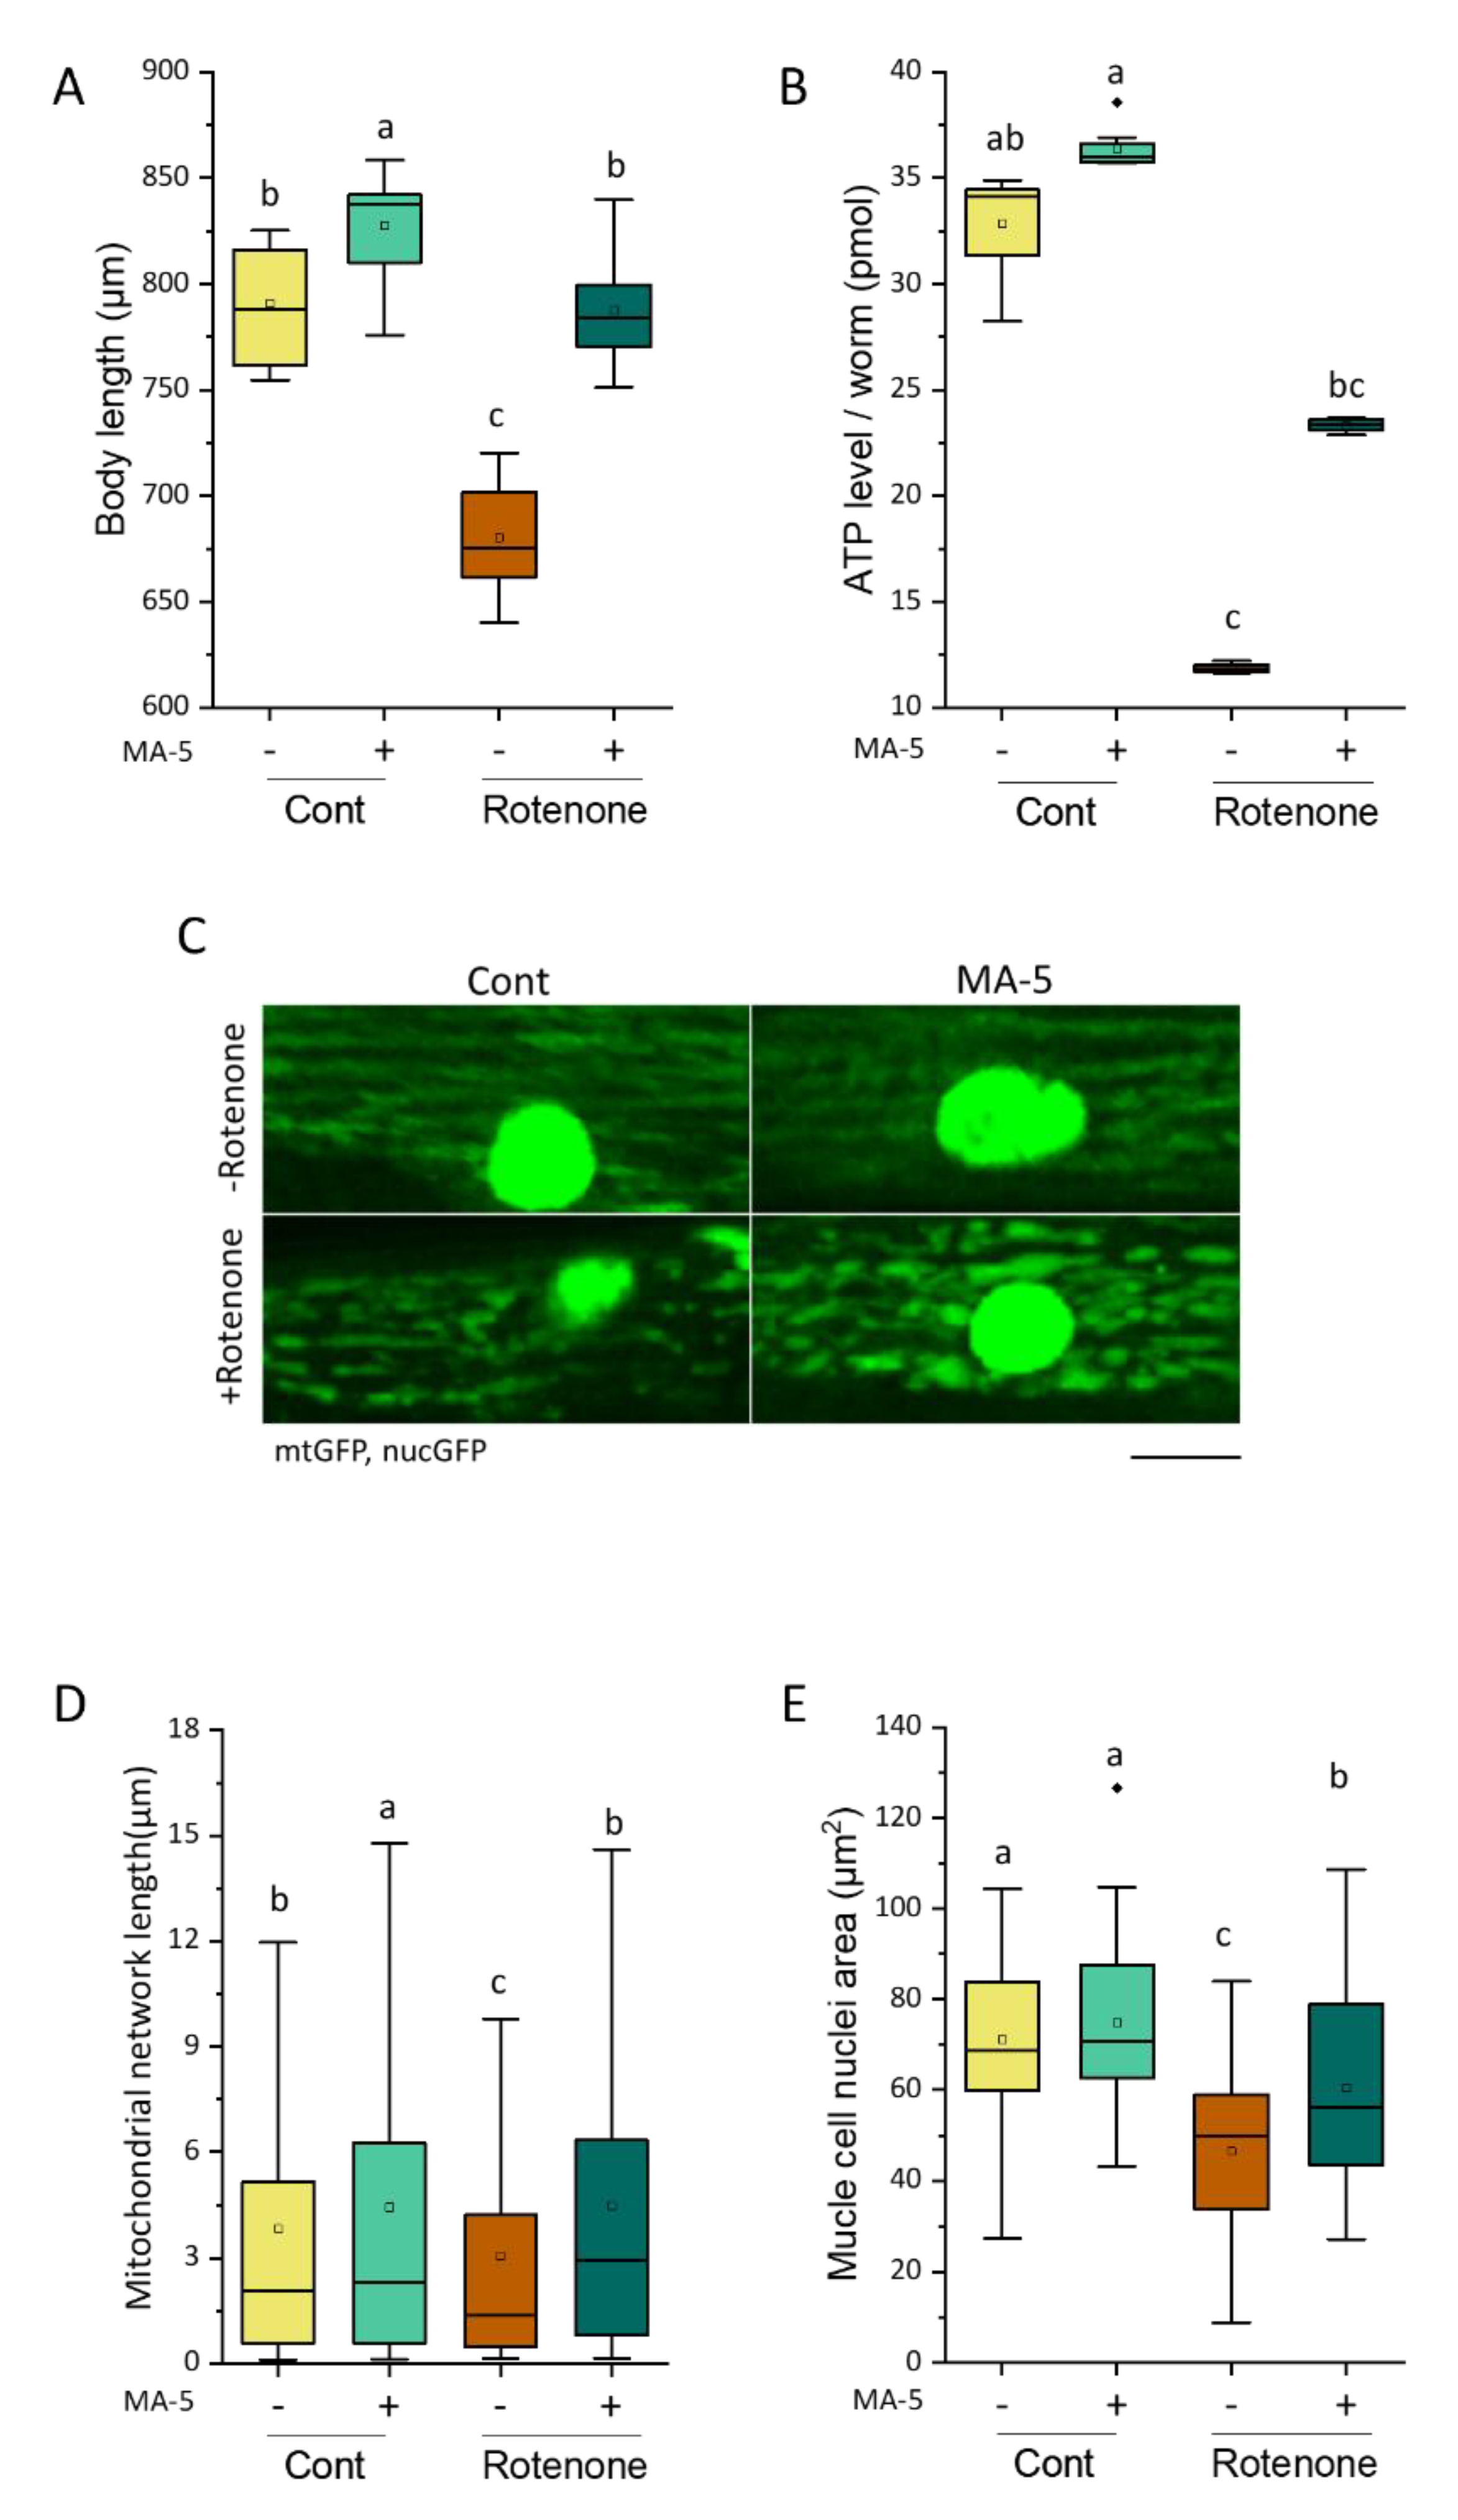
2.3. MA-5 Ameliorates Muscular Mitochondrial Perturbations with Rotenone Treatment

To evaluate the effect of MA-5 on mitochondrial perturbations in BWM cells, WT adults synchronized on day 1 (D1) were treated with a low concentration of 2 μM rotenone, an inhibitor of ETC complex I. The fluorescent signals of the mitochondria-specific ROS generation with MitoTracker Red CMXRos significantly increased after exposure to rotenone for 6 h (Figure 4). In contrast, the addition of MA-5 at the same time as rotenone exposure significantly reduced the subsequent ROS production from the mitochondria of the BWM cells (Figure 4).
Continuous treatment of the SD1347 wild-type strain carrying the ccIs4251 transgene, mtGFP and nuclear targeted GFP (nucGFP), with 2 μM rotenone from synchronous D1 adulthood for 48 h significantly suppressed body growth associated with increased muscle mass (Figure 5A). Using confocal fluorescent microscopy, mitochondrial network fragmentation and nuclear destruction were also observed in BWM cells (Figure 5C–E). However, the administration of MA-5 significantly improved not only body growth retardation but also mitochondrial and nuclear damage (Figure 5A,C–E). In addition, rotenone reduced the total amount of endogenous ATP to one-third of WT, whereas MA-5 treatment was able to rescue it to two-thirds of WT (Figure 5B).

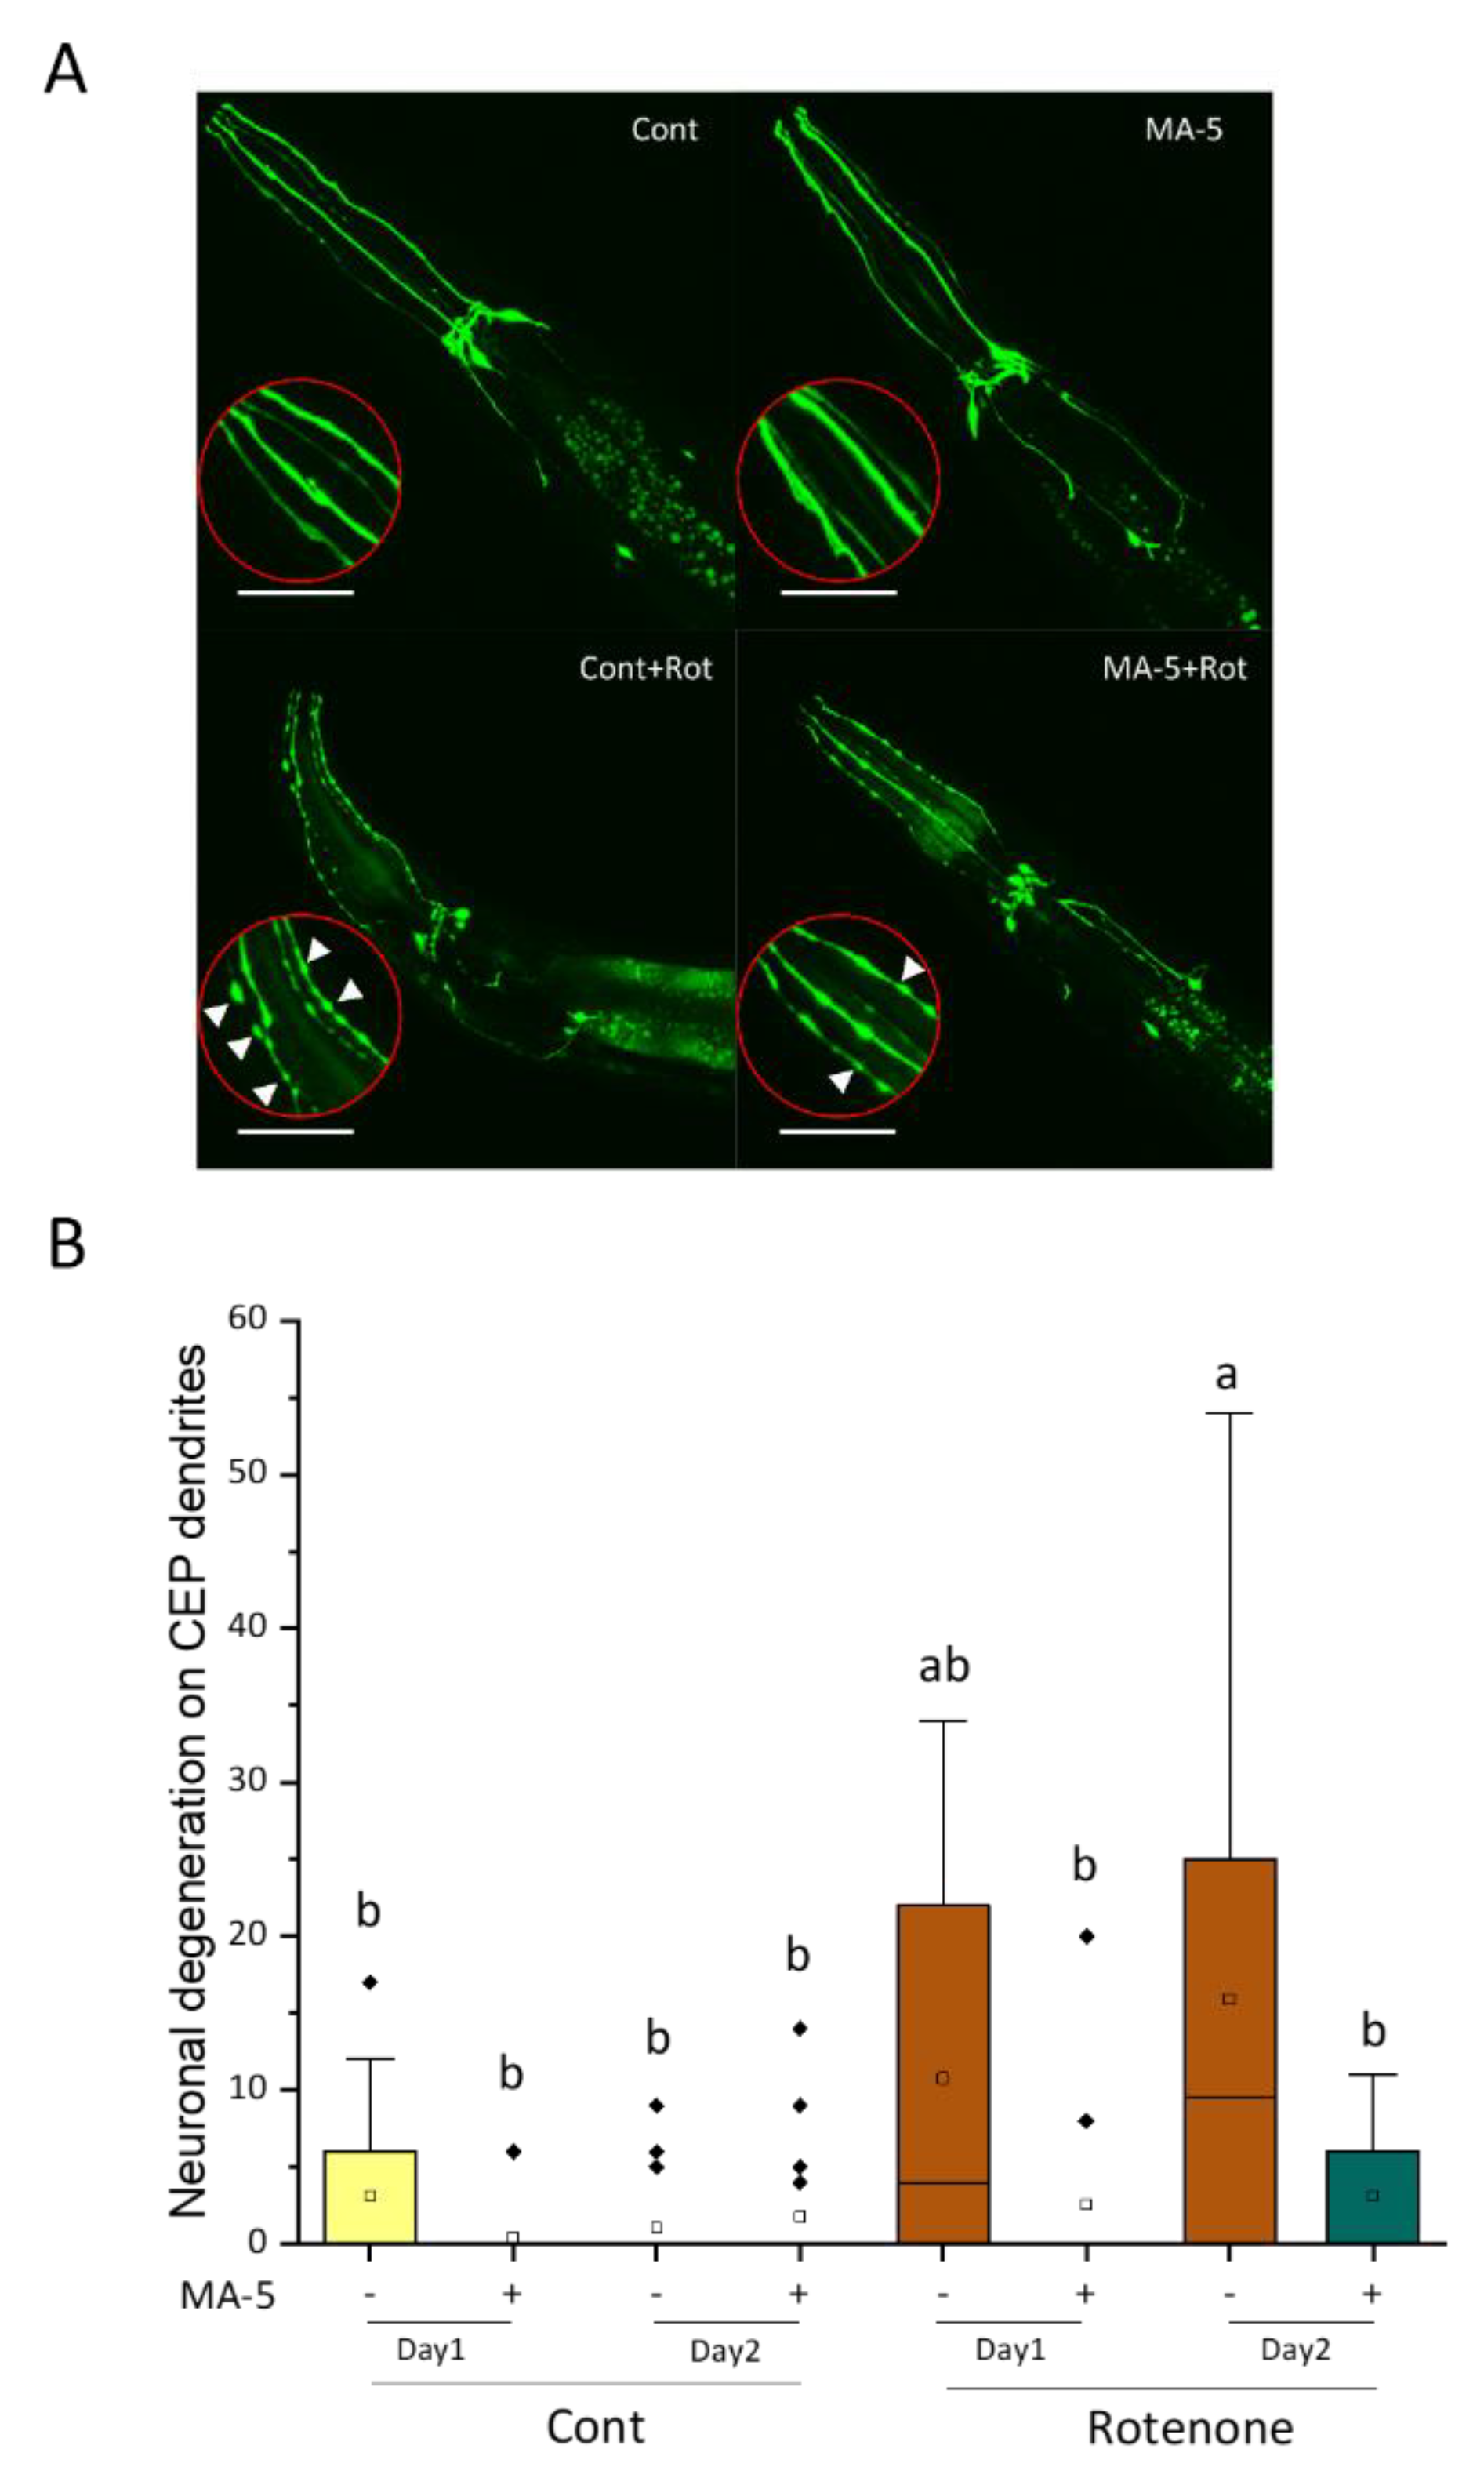
2.4. Alleviation of PD Model Progression by MA-5

Low concentrations of rotenone and 6-OHDA are known to be the PD stressors in mammals [21,22,23,24]. Rotenone and 6-OHDA have also been reported to induce C. elegans dopaminergic neurodegeneration visualized in the TG2435 strain carrying dat-1p::GFP as PD models [18,19,20]. Here, we confirmed the appearance of GFP fluorescence puncta in dopaminergic CEP neurons 24 and 48 h after treatment of synchronized L4 larvae with 2 μM rotenone (Figure 6). The number of puncta increased with the exposure time, indicating that 2 μM rotenone exposure caused the progression of dopaminergic neurodegeneration in C. elegans as a PD model (Figure 6B). On the other hand, rotenone-induced neurodegeneration was significantly suppressed by the administration of MA-5, suggesting that MA-5 alleviates not only muscle damage but also neuronal dysfunction that arises with chronic mitochondrial perturbation (Figure 6A,B).

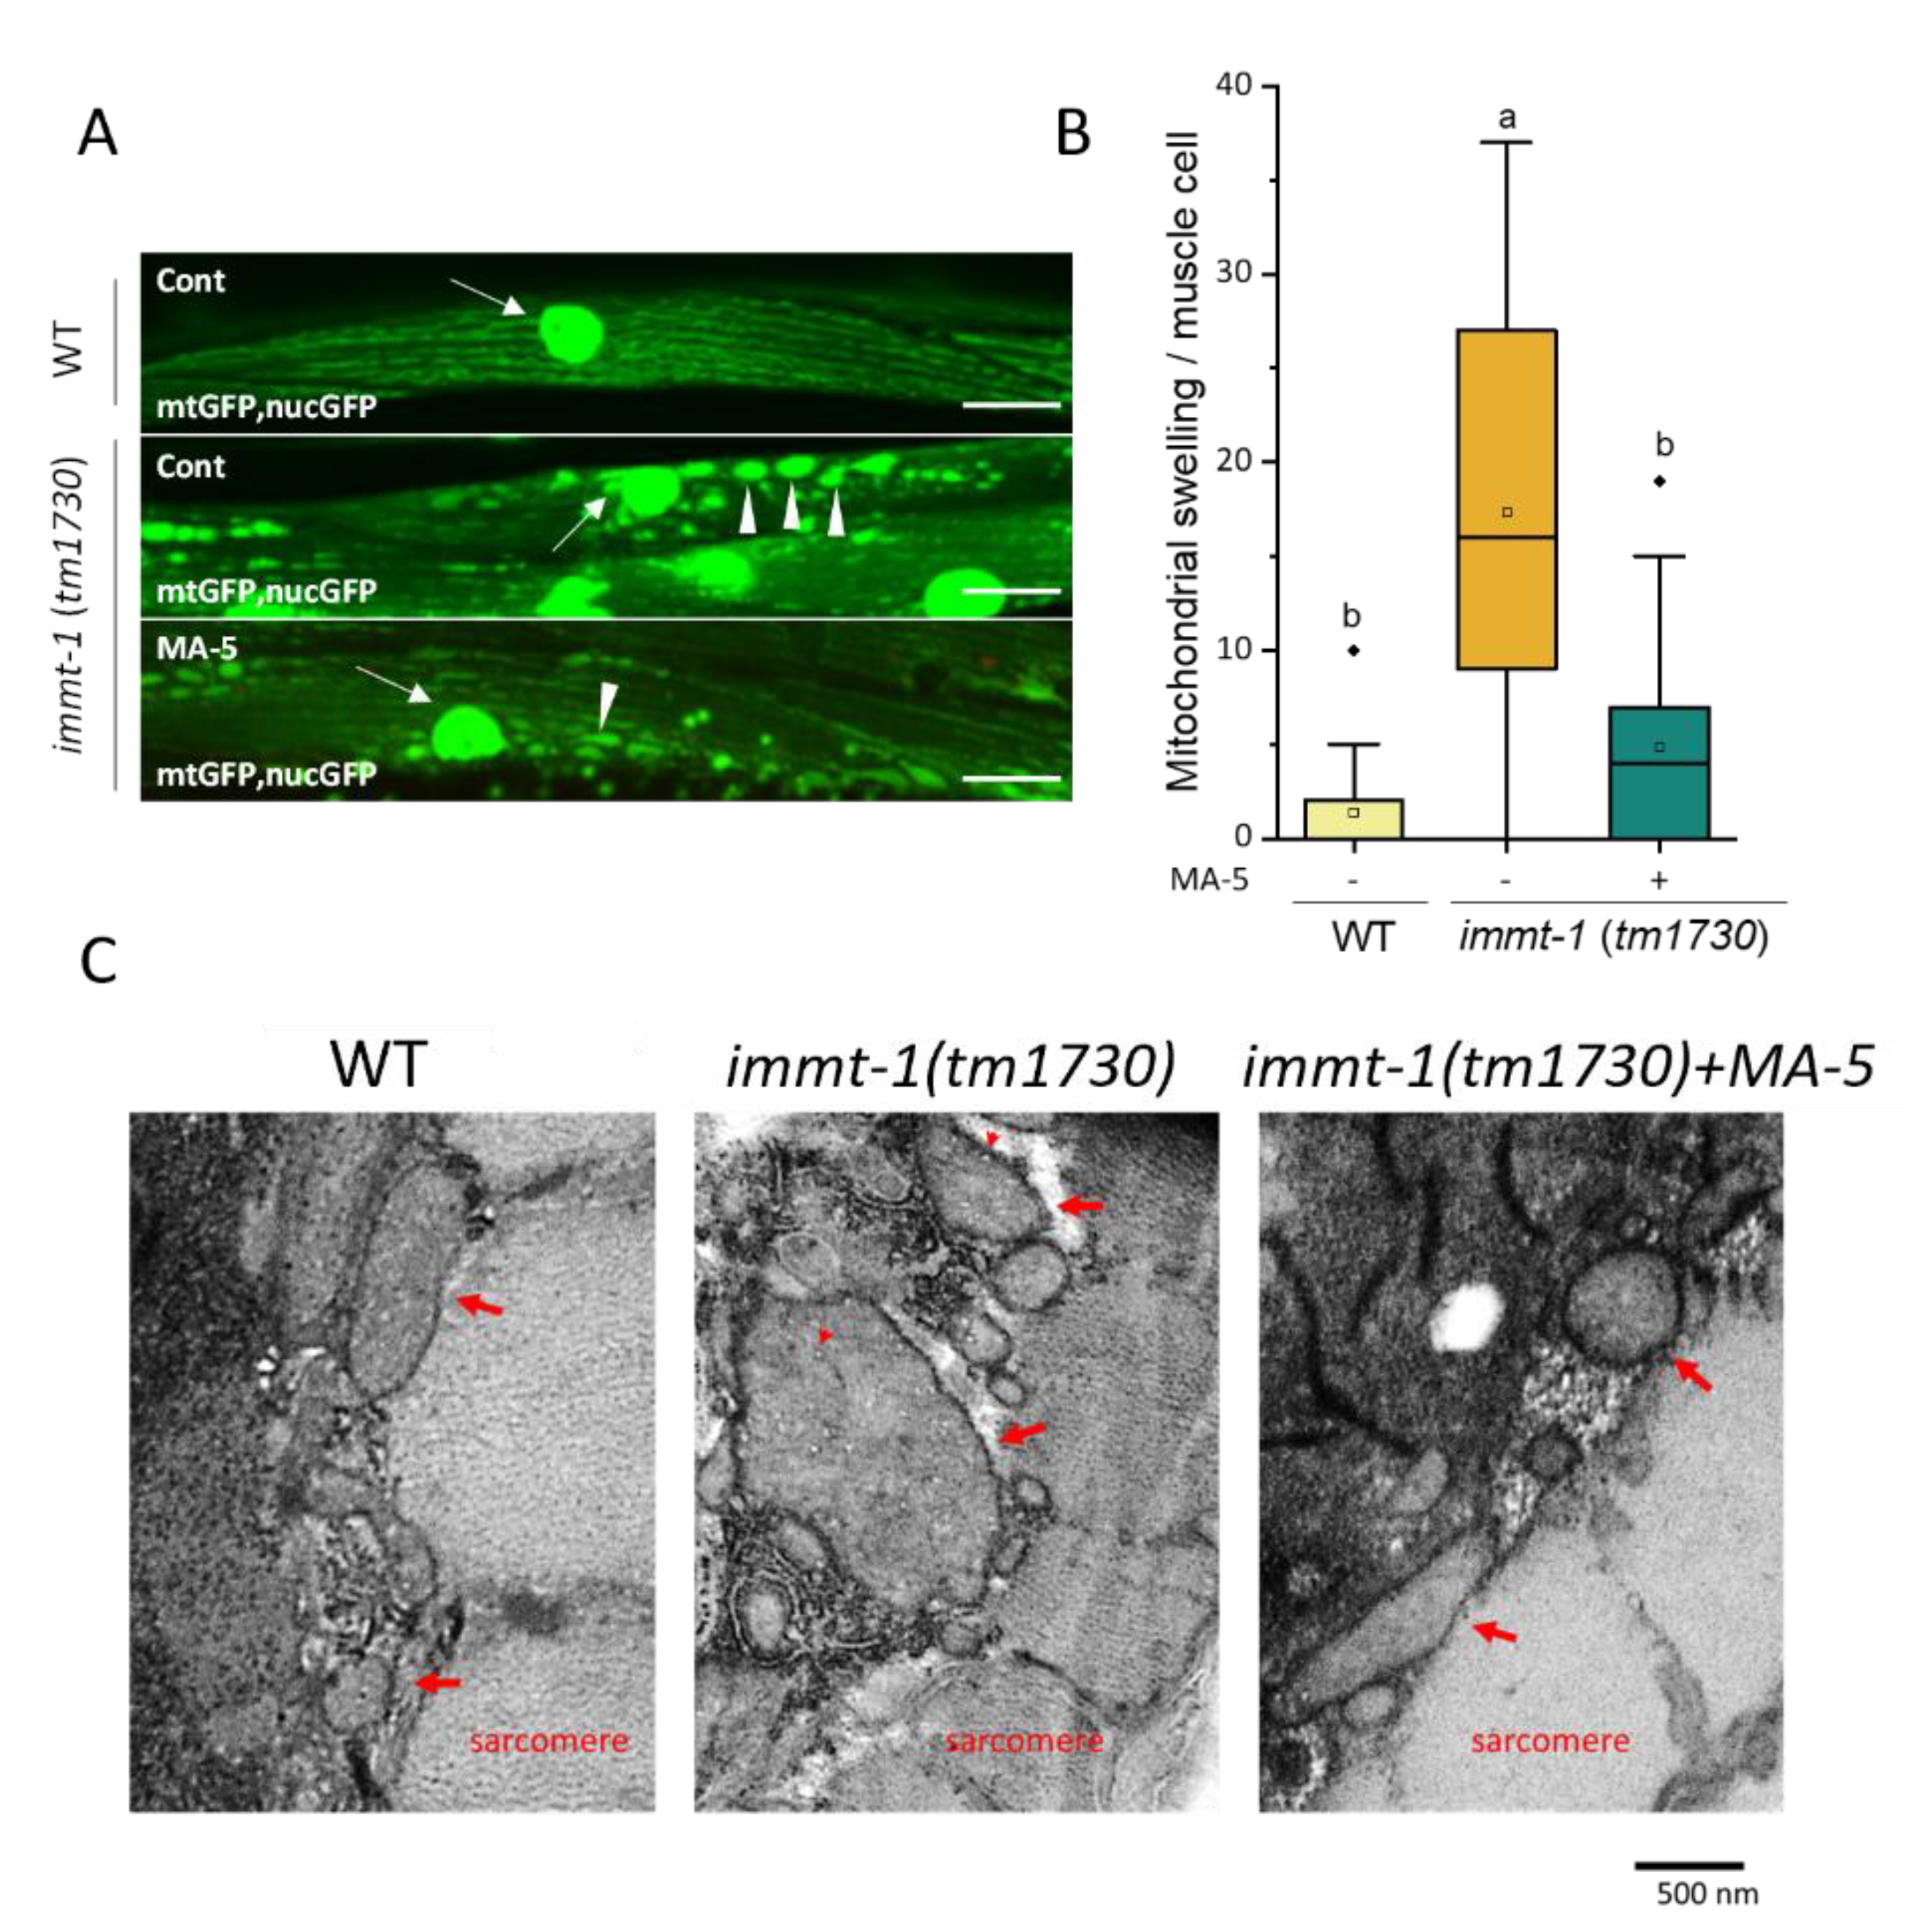
2.5. Suppression of Mitochondrial Swelling in C. elegans Mitofilin immt-1 Mutant with MA-5

C. elegans. has two homologs of mitofilin, IMMT-1 and IMMT-2. These are not redundant, as each mutation affects the mitochondrial morphologies of the same cell and the effects of double mutations are additive [39,40]. In particular, immt-1 defects cause severe local swelling of the mitochondria by disrupting the cristae morphology. In mammalian cells, MA-5 interacts with mitofilin and modulates the mitochondrial inner membrane organizing system (MINOS) [5]. We, therefore, investigated whether MA-5 could suppress the mitochondrial swelling caused by immt-1 mutant in C. elegans. Muscle mitochondria visualized with the ccIs4251 transgene mtGFP showed that irregularly enlarged mitochondria were increased in the immt-1 mutant compared to the wild type (Figure 7A,B). When the immt-1 mutants were cultured on NGM-plates containing MA-5 from L4 larvae to adulthood, the number of enlarged mitochondria were significantly reduced (Figure 7A,B). In addition, transmission electron microscopy showed that not only was the mitochondrial diameter suppressed but the deformation of the cristae morphology in the immt-1 mutant was also suppressed by MA-5 treatment (Figure 7C). These results suggest that MA-5 functions stabilize and repair MINOS in C. elegans. muscles.

3. Discussion

Human DMD is an X-linked muscle-wasting disease caused by the loss of dystrophin protein, a rod-shaped cytoskeletal protein that is primarily expressed in muscles. In the absence of dystrophin, the structural integrity of the sarcolemma is lost and leads to disruption in skeletal muscle signaling, such as nitric oxide, ROS production pathways and Ca2+ cycles [41]. In particular, Ca2+ cycling between the sarcoplasmic reticulum (SR) and the cytoplasm is essential for the normal muscle contraction and relaxation cycle. It is also reported that in cardiomyocytes from mdx mice, an animal model of DMD, elevated [Ca2+]mito is associated with the excessive opening of the mitochondrial permeability transition pore (mPTP), loss of mitochondrial membrane potential and mitochondrial depolarization [42]. It leads to substantial structural damage to the mitochondria and ultimately promotes cell death. Similar to human muscular dystrophy, an abnormal increase in [Ca2+]cyto is observed in the C. elegans. dys-1 mutants, which in turn activates various matrix metalloproteinase-mediated extracellular matrix degradation [30,43]. First of all, the fluorescent MA-5, BODIPY-MA-5, was used to evaluate the efficiency and predominant penetration into the mitochondria of the C. elegans. tissues (muscle, germline, intestine and mammalian cells) [5] (Figure 1). Here, we also confirmed a muscle tone disorder in which [Ca2+]cyto accumulates longer in the dys-1 (eg33) mutants immobilized with microspheres (Figure 2, Supplementary Movie S1). In addition, the over-accumulation of [Ca2+]mito levels in BWM cells of the dys-1 mutant was observed with mitochondrial fragmentation (Figure 3).
Intriguingly, we found that the mitochondrial homing drug MA-5 significantly improved elevated [Ca2+]mito and mitochondrial fragmentation in the BWM cells of dys-1 mutants (Figure 3). In addition, prolonged [Ca2+]cyto cycles and decreased thrash movements were recovered by the administration of MA-5 (Figure 2). These suggest that MA-5 is a potential therapeutic agent that works by ameliorating mitochondrial dysfunction in DMD, as demonstrated using the DMD model of C. elegans. Ellwood et al. [31] have identified that the use of hydrogen sulfide (H2S) supplementation (GY4137 and AP39) acts similar to prednisone and improves neuromuscular health using the C. elegans DMD model. They also find a decline in total sulfide and H2S-producing enzymes in dystrophin/utrophin knockout mice, suggesting the deficit with H2S may contribute to DMD pathology. On the other hand, the loss of Ca2+ homeostasis in C. elegans DMD model does not appear to be corrected by either prednisone or H2S supplementation [31]. Therefore, MA-5 may act by a different mechanism than H2S supplementation and prednisone. Interestingly, pharmacological activation of Sarco/endoplasmic reticulum Ca2+-ATPase (SERCA) with CDN1163 ameliorates dystrophic phenotypes in mdx mice [44]. The administration of CDN1163 reduced [Ca2+]cyto levels in vitro and ex vivo, reversed the mitochondrial swelling, increased OCR and reduced ROS production in isolated mitochondria of mdx mice. Taking together, controlling Ca2+ homeostasis in muscular mitochondria and cytoplasm by MA-5 and CND1163 is effective in treating and alleviating muscular dystrophy.
The mitochondria generate ROS as an intrinsic by-product of ATP synthesis. The generation of ATP and ROS in healthy mitochondria is generally coupled [45,46]. On the other hand, mitochondrial dysfunction causes two detrimental consequences, decreased ATP synthesis and increased ROS production. To artificially cause such disorders, low concentrations of rotenone chronic exposure were applied in this study. MA-5 significantly suppressed the increase in mitochondrial ROS and the decrease in endogenous ATP levels (Figure 4 and Figure 5B). In addition, rotenone-induced the fragmentation of the mitochondrial network and the nuclear destruction of BWM cells was suppressed (Figure 5C–E). Moreover, chronic exposure of rotenone causes dopaminergic neurodegeneration in C. elegans as a PD model [19,20]. MA-5 alleviated dopaminergic neurodegeneration in the rotenone-treated PD model (Figure 6). In cultured mammalian neuronal cells, a recent mechanism has reported that rotenone (as one of the PD stressors) promotes the translocation of Parkin to mitochondria and increases the interaction between Parkin and mitofilin [24]. It finally causes ubiquitination-induced mitofilin degradation. Previously, we have shown that MA-5 binds directly to mitofilin and stabilizes the cristae structure. This promotes the oligomerization of ATP synthase and supercomplex formation, thereby increasing local ATP production as a mitochondrial-homing activity [6]. Thus, this pharmacological effect of MA-5 may be widely conserved in metazoans, from nematodes to humans. MA-5 may bind to another C. elegans mitofilin, IMMT-2 molecules, because the immt-1-deficient mutation also improved mitochondrial hypertrophy and cristae deformity (Figure 7). Taken together, MA-5 mitochondrial homing activity increases ATP production and reduces ROS levels, and MA-5 mitofilin binding may suppress the ubiquitination or degradation of mitofilin by Parkin even in the presence of PD stressors. Further work on the verification of this working hypothesis is needed in the future.
In conclusion, it is becoming increasingly clear that mitochondrial dysfunction plays a causal role in a number of neuromuscular diseases including DMD, PD, mitochondrial myopathy, amyotrophic lateral sclerosis and Alzheimer’s disease. This work demonstrates the beneficial effect of MA-5 on C. elegans DMD and PD models. We also found that the mitochondrial homing drug MA-5 significantly improves mitochondria Ca2+ homeostasis, in addition to the previously known ATP production and ROS reduction. MA-5 may act by a unique mechanism through its interaction with mitofilin and may be more beneficial when used in combination with other agents, such as H2S donors and prednisone.

4. Materials and Methods

4.1. C. elegans Strains and Culture Conditions

The standard procedures for C. elegans maintenance were followed using nematode growth media (NGM) agar plates with Escherichia coli OP50 as a food source and incubator at 20 °C [47]. MA-5 (Hayashi K-I, Okayama University of Science) and the ETC inhibitor rotenone (Millipore Sigma, Burlington, MA, USA) were applied to plates at a final concentration of 10 and 2 μM, respectively. Worms were age-synchronized from the eggs and allowed to grow to the designated day. The strains used in this study are as follows: wild-type N2, TG2435: vtIs1 [dat-1p::GFP + rol-6(su1006)] V, ATU2301: goeIs3 [myo-3p::SL1::GCamP3.35::SL2::unc54 3’UTR + unc-119(+)] V, acels1[myo-3p::mitochondrial LAR-GECO+myo-2p::RFP] II, ATU2305: dys-1(eg33) goeIs3 [Pmyo3::GCaMP3.35::unc-54-3’utr, unc-119(+)], aceIs1[Pmyo3::mitochondrial LAR-GECO + Pmyo2::RFP] [34], ATU3301: ccIs4251 [(pSAK2) myo-3p::GFP::LacZ::NLS + (pSAK4)myo-3p::mitochondrialGFP+dpy-20(+)] I, acels1 II, ATU3305::dys-1(eg33) ccIs4251 [Pmyo3::nucGFP-LacZ + Pmyo-3::mitochondrial GFP], aceIs1 [Pmyo-3::mitochondrial LAR-GECO+ Pmyo2::RFP], SD1347: ccIs4251 [(pSAK2) myo-3p::GFP::LacZ::NLS+ (pSAK4) myo-3p::mitochondrial GFP + dpy-20(+)] I and ATU3307: ccIs4251 I, acels1 II, immt-1 (tm1730) X.

4.2. BODIPY-Based Fluorescent-Conjugated MA-5 Contents in Mitochondria Assay

AIE™ Mitochondria Blue (AIEgen Biotech Co., Limited, Hong Kong), which stains mitochondrial with blue fluorescence at final concentration 25 μM was performed with 1 μM BODIPY-MA-5 [5] or 1 μM BODIPY (Fisher Scientific, Schwerte, Germany) for 30 min in adult wild-type (N2) worms on day 1. M9 buffer was used for washing C. elegans. The Z-stack images of BODIPY-MA-5, BODIPY, and AIE™ Mitochondria Blue fluorescence were presented using confocal microscopy. Fluorescent excitation and emission wavelengths were under 490/504, 490/504, 359/461, respectively.

4.3. Measurement of Body Length

The worms were synchronized, and their movement was recorded using stereomicroscopy (SMZ18; Nikon, Tokyo, Japan), a device camera (DP74; Olympus, Tokyo, Japan) and an imaging software (cellSens Standard 2.2; Olympus, Tokyo, Japan). Body length was measured from images captured by the software.

4.4. Thrashing Speed

To determine the body bending of the worms in the liquid, the thrashing speed of synchronized adult worms was measured in 1 mL of M9 buffer for 30 s. In total, 10 worms were measured for each treatment.

4.5. Microscopic Imaging

C. elegans BWM cells and their mitochondrial images were obtained using confocal laser-scanning microscopy (FluoView Olympus FV10i; Olympus, Tokyo, Japan). For observation, synchronized worms were washed with M9 buffer and mounted on a microscope slide (6.5 mm square, 20 μm deep well made with a water-repellent coating (Matsunami Glass Ind., Ltd., Osaka, Japan)) with 100 mM NaN3 solution. Muscular mitochondrial volume and length of mitochondrial networks were analyzed by Image J software (National Institutes of Health, Bethesda, MD, USA).
For the live imaging of the cytoplasmic Ca2+ cycling in BWM cells using GCaMP fluorescence (goeIs3 transgene), the synchronized worms were washed and mounted with 2.5% polystyrene microspheres (0.10 μm, Polysciences Inc. Warrington, PA, USA). Time-lapse confocal images of cytosolic GCaMP fluorescence were acquired at room temperature (20~22 °C) by FV10i.
To examine BWM mitochondrial structures by transmission electron microscopy (TEM), four-day-old adult hermaphrodites of wild-type and immt-1 mutants treated with or without MA-5 were used. Worms were fixed in 2% paraformaldehyde and 2.5% glutaraldehyde in 0.1 M cacodylate buffer (pH 7.4) at 4 °C, then washed 2 times in 0.1 M cacodylate buffer for 15 min each and fixed in 1% osmium tetroxide on ice for 90 min. They were dehydrated through a 50–95% ethanol series for 10 min each and 100% ethanol for 20 min three times, rinsed twice for 10 min in propylene oxide and embedded in resin containing TAAB Epon 812 (TAAB, Reading, UK) for 48 h at 60 °C. Ultra-thin sections (70 nm) cut with a diamond knife on an ultramicrotome (Leica Microsystems, Wetzlar, Germany) were mounted on copper grids, stained with 2% uranyl acetate at room temperature for 15 min, secondary-stained with lead stain solution (Sigma-Aldrich, Burlington, MA, United States) at room temperature for 3 min and then examined by TEM (H-7600, Hitachi, Ltd., Tokyo, Japan).

4.6. Measurement of Mitochondrial Ca2+ Levels

Mitochondrial Ca2+ and cytoplasmic Ca2+ in BWM cells were, respectively, observed by measuring the expression of the transgenes aceIs1 and goeIs3 as described recently from our group [34]. The Ca2+ concentration in muscle mitochondria ([Ca2+]mito) was calculated using the following equation [48].
[Ca2+]mito = Kd·(R − Rmin)/(Rmax − R)
where Kd (12 μM) indicates the dissociation constant between Ca2+ and the LAR-GECO probe [49] and R indicates the ratio of fluorescence intensity of mtGECO to that of mtGFP of ccIs4251 transgene in a constant area.

4.7. Dopamine Neuron Degeneration Measurement

Age-synchronized two-day-old adult worms with dat-1p::GFP (TG2435) were used in this experiment. Approximately 12 worms were analyzed for each condition. Images were obtained using confocal microscopy and ImageJ software was used to calculate the number of beads in all four cephalic (CEP) neurons [50].

4.8. Mitochondrial ROS Measurement

Wild-type (N2) one-day-old adult nematodes were incubated with rotenone for 6 h in the presence or absence of MA-5. Subsequently, worms were treated with 0.5 µM MitoTracker® Red CMXRos (Fisher Scientific, Schwerte, Germany) and 25 μM AIE™ Mitochondria Blue (AIEgen Biotech Co., Limited, Hong Kong, China) for 3 h. Nematodes were then transferred to fresh NGM agar plates and incubated overnight. Images were obtained using confocal microscopy and fluorescence intensity was analyzed using FV10-ASW Viewer software (Olympus, Tokyo, Japan).

4.9. ATP Detection

Wild-type (N2) worms on two-day-old adults were collected in 100 µM M9 buffer for further ATP assays. An ATP determination kit (Molecular Probes, Eugene, OR, USA) was used to measure endogenous ATP levels, as previously reported for rotenone treatment [51].

4.10. Analysis of mitofilin/immt-1gene Mutation Mitochondrial Morphology

The synchronized immt-1 mutant (ATU3307) on a four-day-old adult was used in this experiment. Approximately 50 muscle cell images were taken from 10 worms for each treatment. Images of mitochondrial morphology were observed using confocal microscopy and analyzed using ImageJ software.

4.11. Statistical Analysis

The one-way ANOVA with post hoc Tukey’s HSD and Dunn’s test were used for comparisons between groups as appropriate (R or Origin software). All data points including outliers were used for means and statistical significance. A p value of < 0.05 was considered significant. Different letters indicate significant differences between the groups.

Supplementary Materials

The following supporting information can be downloaded at: https://www.mdpi.com/article/10.3390/ijms23179572/s1.

Author Contributions

X.W., T.A. and A.H. conceived and designed the study. X.W., S.N., K.M. and A.H. conducted experiments and analyzed the data. A.H. constructed a series of ATU strains. M.U. prepared TEM samples. C.S. and T.A. supervised the MA-5 project and pharmacological function. X.W. and A.H. wrote the manuscript. All authors have read and agreed to the published version of the manuscript.

Funding

The CGC was funded by the Office of Research Infrastructure Programs, National Institutes of Health (P40 OD010440). This work was supported in part by Japan Agency for Medical Research and Development (AMED) Grant Number JP22zf0127001 and AMED-CREST 16814305.

Institutional Review Board Statement

Not applicable.

Informed Consent Statement

Not applicable.

Data Availability Statement

Not applicable.

Acknowledgments

We would like to thank Takeshi Kobayashi and Yukihiko Kubota for the construction of the aceIs1 transgene and Sudevan Surbhi for English proofreading. The Caenorhabditis elegans strains immt-1 (tm1730), and TG2435 (vtIs1) and SD1347 (ccIs4251) were provided by Professor Shohei Mitani (NBRP and Tokyo Women’s Medical University School of Medicine, Tokyo, Japan) and the Caenorhabditis Genetics Center (CGC), respectively. X.T-W is grateful to the Ministry of Education, Culture, Sports, Science and Technology (MEXT) Scholarship.

Conflicts of Interest

The authors declare no conflict of interest.

References

  1. Suzuki, T.; Yamaguchi, H.; Kikusato, M.; Matsuhashi, T.; Matsuo, A.; Sato, T.; Oba, Y.; Watanabe, S.; Minaki, D.; Saigusa, D.; et al. Mitochonic Acid 5 (MA-5), a Derivative of the Plant Hormone Indole-3-Acetic Acid, Improves Survival of Fibroblasts from Patients with Mitochondrial Diseases. Tohoku J. Exp. Med. 2015, 236, 225–232. [Google Scholar] [CrossRef]
  2. de Melo, M.P.; Curi, T.C.P.; Miyasaka, C.K.; Palanch, A.C.; Curi, R. Effect of Indole Acetic Acid on Oxygen Metabolism in Cultured Rat Neutrophil. Gen. Pharmacol. Vasc. Syst. 1998, 31, 573–578. [Google Scholar] [CrossRef]
  3. Salopek-Sondi, B.; Piljac-Žegarac, J.; Magnus, V.; Kopjar, N. Free Radical–Scavenging Activity and DNA Damaging Potential of Auxins IAA and 2-Methyl-IAA Evaluated in Human Neutrophils by the Alkaline Comet Assay. J. Biochem. Mol. Toxicol. 2010, 24, 165–173. [Google Scholar] [CrossRef]
  4. Toyohara, T.; Akiyama, Y.; Suzuki, T.; Takeuchi, Y.; Mishima, E.; Tanemoto, M.; Momose, A.; Toki, N.; Sato, H.; Nakayama, M.; et al. Metabolomic Profiling of Uremic Solutes in CKD Patients. Hypertens. Res. 2010, 33, 944–952. [Google Scholar] [CrossRef]
  5. Suzuki, T.; Yamaguchi, H.; Kikusato, M.; Hashizume, O.; Nagatoishi, S.; Matsuo, A.; Sato, T.; Kudo, T.; Matsuhashi, T.; Murayama, K.; et al. Mitochonic Acid 5 Binds Mitochondria and Ameliorates Renal Tubular and Cardiac Myocyte Damage. J. Am. Soc. Nephrol. 2016, 27, 1925–1932. [Google Scholar] [CrossRef]
  6. Matsuhashi, T.; Sato, T.; Kanno, S.I.; Suzuki, T.; Matsuo, A.; Oba, Y.; Kikusato, M.; Ogasawara, E.; Kudo, T.; Suzuki, K.; et al. Mitochonic Acid 5 (MA-5) Facilitates ATP Synthase Oligomerization and Cell Survival in Various Mitochondrial Diseases. EBioMedicine 2017, 20, 27–38. [Google Scholar] [CrossRef]
  7. Oikawa, Y.; Izumi, R.; Koide, M.; Hagiwara, Y.; Kanzaki, M.; Suzuki, N.; Kikuchi, K.; Matsuhashi, T.; Akiyama, Y.; Ichijo, M.; et al. Mitochondrial Dysfunction Underlying Sporadic Inclusion Body Myositis Is Ameliorated by the Mitochondrial Homing Drug MA-5. PLoS ONE 2020, 15, e0231064. [Google Scholar] [CrossRef]
  8. Vila, M.C.; Rayavarapu, S.; Hogarth, M.W.; van der Meulen, J.H.; Horn, A.; Defour, A.; Takeda, S.; Brown, K.J.; Hathout, Y.; Nagaraju, K.; et al. Mitochondria Mediate Cell Membrane Repair and Contribute to Duchenne Muscular Dystrophy. Cell Death Differ. 2016, 24, 330–342. [Google Scholar] [CrossRef]
  9. Hattori, N.; Mizuno, Y. Mitochondrial Dysfunction in Parkinson’s Disease. Exp. Neurobiol. 2015, 24, 103. [Google Scholar] [CrossRef]
  10. Prasuhn, J.; Davis, R.L.; Kumar, K.R. Targeting Mitochondrial Impairment in Parkinson’s Disease: Challenges and Opportunities. Front. Cell Dev. Biol. 2021, 8, 1704. [Google Scholar] [CrossRef]
  11. Moore, T.M.; Lin, A.J.; Strumwasser, A.R.; Cory, K.; Whitney, K.; Ho, T.; Ho, T.; Lee, J.L.; Rucker, D.H.; Nguyen, C.Q.; et al. Mitochondrial Dysfunction Is an Early Consequence of Partial or Complete Dystrophin Loss in Mdx Mice. Front. Physiol. 2020, 11, 690. [Google Scholar] [CrossRef] [PubMed]
  12. Kim, S.; Campbell, K.A.; Fox, D.J.; Matthews, D.J.; Valdez, R. Corticosteroid Treatments in Males with Duchenne Muscular Dystrophy: Treatment Duration and Time to Loss of Ambulation. J. Child. Neurol 2015, 30, 1275. [Google Scholar] [CrossRef] [PubMed]
  13. Iarkov, A.; Barreto, G.E.; Grizzell, J.A.; Echeverria, V. Strategies for the Treatment of Parkinson’s Disease: Beyond Dopamine. Front. Aging Neurosci. 2020, 12, 4. [Google Scholar] [CrossRef]
  14. Gaffney, C.J.; Pollard, A.; Barratt, T.F.; Constantin-Teodosiu, D.; Greenhaff, P.L.; Szewczyk, N.J. Greater Loss of Mitochondrial Function with Ageing Is Associated with Earlier Onset of Sarcopenia in C. Elegans. Aging 2018, 10, 3382–3396. [Google Scholar] [CrossRef]
  15. Mack, H.I.D.; Heimbucher, T.; Murphy, C.T. DISEASE The Nematode Caenorhabditis Elegans as a Model for Aging Research. Drug Discov. Today Dis. Models 2018, 27, 3–13. [Google Scholar] [CrossRef]
  16. Culetto, E.; Sattelle, D.B. A Role for Caenorhabditis Elegans in Understanding the Function and Interactions of Human Disease Genes. Hum. Mol. Genet. 2000, 9, 869–877. [Google Scholar] [CrossRef] [PubMed]
  17. Kaletta, T.; Hengartner, M.O. Finding Function in Novel Targets: C. Elegans as a Model Organism. Nat. Rev. Drug Discov. 2006, 5, 387–399. [Google Scholar] [CrossRef]
  18. Nass, R.; Hall, D.H.; Miller, D.M.; Blakely, R.D. Neurotoxin-Induced Degeneration of Dopamine Neurons in Caenorhabditis Elegans. Proc. Natl. Acad. Sci. USA 2002, 99, 3264–3269. [Google Scholar] [CrossRef]
  19. Maulik, M.; Mitra, S.; Bult-Ito, A.; Taylor, B.E.; Vayndorf, E.M. Behavioral Phenotyping and Pathological Indicators of Parkinson’s Disease in C. Elegans Models. Front. Genet. 2017, 8, 77. [Google Scholar] [CrossRef]
  20. Zhou, S.; Wang, Z.; Klaunig, J.E. Caenorhabditis Elegans Neuron Degeneration and Mitochondrial Suppression Caused by Selected Environmental Chemicals. Int. J. Biochem. Mol. Biol. 2013, 4, 191. [Google Scholar]
  21. Betarbet, R.; Sherer, T.B.; MacKenzie, G.; Garcia-Osuna, M.; Panov, A.V.; Greenamyre, J.T. Chronic Systemic Pesticide Exposure Reproduces Features of Parkinson’s Disease. Nat. Neurosci. 2000, 3, 1301–1306. [Google Scholar] [CrossRef] [PubMed] [Green Version]
  22. Sherer, T.B.; Betarbet, R.; Testa, C.M.; Seo, B.B.; Richardson, J.R.; Kim, J.H.; Miller, G.W.; Yagi, T.; Matsuno-Yagi, A.; Greenamyre, J.T. Mechanism of Toxicity in Rotenone Models of Parkinson’s Disease. J. Neurosci. 2003, 23, 10756–10764. [Google Scholar] [CrossRef] [PubMed]
  23. Xiong, N.; Long, X.; Xiong, J.; Jia, M.; Chen, C.; Huang, J.; Ghoorah, D.; Kong, X.; Lin, Z.; Wang, T. Mitochondrial Complex I Inhibitor Rotenone-Induced Toxicity and Its Potential Mechanisms in Parkinson’s Disease Models. Crit. Rev. Toxicol. 2012, 42, 613–632. [Google Scholar] [CrossRef] [PubMed]
  24. Aliagan, A.D.I.; Ahwazi, M.D.; Tombo, N.; Feng, Y.; Bopassa, J.C. Parkin Interacts with Mitofilin to Increase Dopaminergic Neuron Death in Response to Parkinson’s Disease-Related Stressors. Am. J. Transl. Res. 2020, 12, 7542. [Google Scholar]
  25. Cooper, J.F.; Dues, D.J.; Spielbauer, K.K.; Machiela, E.; Senchuk, M.M.; van Raamsdonk, J.M. Delaying Aging Is Neuroprotective in Parkinson’s Disease: A Genetic Analysis in C. Elegans Models. Npj. Parkinson Dis. 2015, 1, 1–12. [Google Scholar] [CrossRef]
  26. McDiarmid, T.A.; Au, V.; Loewen, A.D.; Liang, J.; Mizumoto, K.; Moerman, D.G.; Rankin, C.H. CRISPR-Cas9 Human Gene Replacement and Phenomic Characterization in Caenorhabditis Elegans to Understand the Functional Conservation of Human Genes and Decipher Variants of Uncertain Significance. DMM Dis. Models Mech. 2018, 11, dmm036517. [Google Scholar] [CrossRef]
  27. Vicencio, J.; Cerón, J. A Living Organism in Your CRISPR Toolbox: Caenorhabditis Elegans Is a Rapid and Efficient Model for Developing CRISPR-Cas Technologies. CRISPR J. 2021, 4, 32–42. [Google Scholar] [CrossRef]
  28. Artal-Sanz, M.; de Jong, L.; Tavernarakis, N. Caenorhabditis Elegans: A Versatile Platform for Drug Discovery. Biotechnol. J. 2006, 1, 1405–1418. [Google Scholar] [CrossRef]
  29. O’Reilly, L.P.; Luke, C.J.; Perlmutter, D.H.; Silverman, G.A.; Pak, S.C.C. Elegans in High-Throughput Drug Discovery. Adv. Drug Deliv. Rev. 2014, 69–70, 247–253. [Google Scholar] [CrossRef]
  30. Sudevan, S.; Takiura, M.; Kubota, Y.; Higashitani, N.; Cooke, M.; Ellwood, R.A.; Etheridge, T.; Szewczyk, N.J.; Higashitani, A. Mitochondrial Dysfunction Causes Ca2+ Overload and ECM Degradation–Mediated Muscle Damage in C. Elegans. FASEB J. 2019, 8, 9540–9550. [Google Scholar] [CrossRef]
  31. Ellwood, R.A.; Hewitt, J.E.; Torregrossa, R.; Philp, A.M.; Hardee, J.P.; Hughes, S.; van de Klashorst, D.; Gharahdaghi, N.; Anupom, T.; Slade, L.; et al. Mitochondrial Hydrogen Sulfide Supplementation Improves Health in the C. Elegans Duchenne Muscular Dystrophy Model. Proc. Natl. Acad. Sci. USA 2021, 118, e2018342118. [Google Scholar] [CrossRef] [PubMed]
  32. Weinkove, D.; Zavagno, G. Applying C. Elegans to the Industrial Drug Discovery Process to Slow Aging. Front. Aging 2021, 2, 740582. [Google Scholar] [CrossRef] [PubMed]
  33. Klapper, M.; Ehmke, M.; Palgunow, D.; Böhme, M.; Matthäus, C.; Bergner, G.; Dietzek, B.; Popp, J.; Döring, F. Fluorescence-Based Fixative and Vital Staining of Lipid Droplets in Caenorhabditis Elegans Reveal Fat Stores Using Microscopy and Flow Cytometry Approaches. J. Lipid Res. 2011, 52, 1281–1293. [Google Scholar] [CrossRef] [PubMed]
  34. Higashitani, A.; Teranishi, M.; Nakagawa, Y.; Itoh, Y.; Sudevan, S.; Szewczyk, N.J.; Kubota, Y.; Abe, T.; Kobayashi, T. Increased Mitochondrial Ca2+ Contributes to Health Decline with Age and Duchene Muscular Dystrophy in C. Elegans. bioRxiv 2022. [Google Scholar] [CrossRef]
  35. Ellwood, R.A.; Piasecki, M.; Szewczyk, N.J. Caenorhabditis Elegans as a Model System for Duchenne Muscular Dystrophy. Int. J. Mol. Sci. 2021, 22, 4891. [Google Scholar] [CrossRef]
  36. Epstein, F.H.; Ptacek, L.J.; Johnson, K.J.; Griggs, R.C. Genetics and Physiology of the Myotonic Muscle Disorders. N. Engl. J. Med. 1993, 328, 482–489. [Google Scholar] [CrossRef]
  37. Kurihara, T. New Classification and Treatment for Myotonic Disorders. Intern. Med. 2005, 44, 1027–1032. [Google Scholar] [CrossRef]
  38. Hewitt, J.E.; Pollard, A.K.; Lesanpezeshki, L.; Deane, C.S.; Gaffney, C.J.; Etheridge, T.; Szewczyk, N.J.; Vanapalli, S.A. Muscle Strength Deficiency and Mitochondrial Dysfunction in a Muscular Dystrophy Model of Caenorhabditis Elegans and Its Functional Response to Drugs. DMM Dis. Models Mech. 2018, 11, dmm036137. [Google Scholar] [CrossRef]
  39. Mun, J.Y.; Lee, T.H.; Kim, J.H.; Yoo, B.H.; Bahk, Y.Y.; Koo, H.S.; Han, S.S. Caenorhabditis Elegans Mitofilin Homologs Control the Morphology of Mitochondrial Cristae and Influence Reproduction and Physiology. J. Cell. Physiol. 2010, 224, 748–756. [Google Scholar] [CrossRef]
  40. Head, B.P.; Zulaika, M.; Ryazantsev, S.; van der Bliek, A.M. A Novel Mitochondrial Outer Membrane Protein, MOMA-1, that Affects Cristae Morphology in Caenorhabditis Elegans. Mol. Biol. Cell 2011, 22, 831–841. [Google Scholar] [CrossRef]
  41. Allen, D.G.; Whitehead, N.P.; Froehner, S.C. Absence of Dystrophin Disrupts Skeletal Muscle Signaling: Roles of Ca2+, Reactive Oxygen Species, and Nitric Oxide in the Development of Muscular Dystrophy. Physiol. Rev. 2016, 96, 253–305. [Google Scholar] [CrossRef] [PubMed]
  42. Kyrychenko, V.; Poláková, E.; Janíček, R.; Shirokova, N. Mitochondrial Dysfunctions during Progression of Dystrophic Cardiomyopathy. Cell Calcium 2015, 58, 186–195. [Google Scholar] [CrossRef] [PubMed]
  43. Hughes, K.J.; Rodriguez, A.; Flatt, K.M.; Ray, S.; Schuler, A.; Rodemoyer, B.; Veerappan, V.; Cuciarone, K.; Kullman, A.; Lim, C.; et al. Physical Exertion Exacerbates Decline in the Musculature of an Animal Model of Duchenne Muscular Dystrophy. Proc. Natl. Acad. Sci. USA 2019, 116, 3508–3517. [Google Scholar] [CrossRef] [PubMed]
  44. Nogami, K.; Maruyama, Y.; Sakai-Takemura, F.; Motohashi, N.; Elhussieny, A.; Imamura, M.; Miyashita, S.; Ogawa, M.; Noguchi, S.; Tamura, Y.; et al. Pharmacological Activation of SERCA Ameliorates Dystrophic Phenotypes in Dystrophin-Deficient Mdx Mice. Hum. Mol. Genet. 2021, 30, 1006–1019. [Google Scholar] [CrossRef] [PubMed]
  45. Giorgio, M.; Trinei, M.; Migliaccio, E.; Pelicci, P.G. Hydrogen Peroxide: A Metabolic by-Product or a Common Mediator of Ageing Signals? Nat. Rev. Mol. Cell Biol. 2007, 8, 722–728. [Google Scholar] [CrossRef]
  46. Murphy, M.P. How Mitochondria Produce Reactive Oxygen Species. Biochem. J. 2009, 417, 1–13. [Google Scholar] [CrossRef]
  47. Brenner, S. The Genetics of Caenorabditis elegans. Genetics 1974, 77, 71–94. [Google Scholar] [CrossRef]
  48. Grynkiewicz, G.; Poenie, M.; Tsienb, R.Y. A New Generation of Ca2+ Indicators with Greatly Improved Fluorescence Properties. J. Biol. Chem. 1985, 260, 3440–3450. [Google Scholar] [CrossRef]
  49. Wu, J.; Prole, D.L.; Shen, Y.; Lin, Z.; Gnanasekaran, A.; Liu, Y.; Chen, L.; Zhou, H.; Chen, S.R.W.; Usachev, Y.M.; et al. Red Fluorescent Genetically Encoded Ca2+ Indicators for Use in Mitochondria and Endoplasmic Reticulum. Biochem. J. 2014, 464, 13–22. [Google Scholar] [CrossRef]
  50. Sudevan, S.; Muto, K.; Higashitani, N.; Hashizume, T.; Higashibata, A.; Ellwood, R.A.; Deane, C.S.; Rahman, M.; Vanapalli, S.A.; Etheridge, T.; et al. Loss of Physical Contact in Space Alters the Dopamine System in C. Elegans. iScience 2022, 25, 103762. [Google Scholar] [CrossRef]
  51. Momma, K.; Homma, T.; Isaka, R.; Sudevan, S.; Higashitani, A. Heat-Induced Calcium Leakage Causes Mitochondrial. Genetics 2017, 206, 1985–1994. [Google Scholar] [CrossRef] [PubMed]
Figure 1. Penetration and homing activity of MA-5 into intact C. elegans mitochondria. (A) Differences between BODIPY-MA-5 and BODIPY. Fluorescent signals of BODIPY-MA-5 on mitochondria are indicated in muscle, germ cell and intestine (white arrows). BODIPY staining signals show in intestinal lipid droplets and germ cell membranes. (B) The z-stack images of body wall muscle cells of wild-type (N2) adults on day 2 were monitored by confocal microscopy. Localization of MA-5-BODIPY in mitochondria (indicated as green), Mitochondrial Maker AIE mitochondria blue (indicated as blue) and merged image demonstrating mitochondrial localization (indicated as cyan). Fluorescent excitation and emission wavelengths (nm) are indicated as numbers in each picture excitation⁄ emission (nm). Scale bars represent 10 µm.
Ijms 23 09572 g001
Figure 2. MA-5 suppressed DMD disease model symptoms on motor activity reduction and extension of cytoplasmic Ca2+ oscillations with muscle contraction. (A) Movement capacity of ATU3305 worms in liquid media. Locomotory performances were determined in 1ml M9 for each 30 s (n = 10 worms/treatment). Different letters indicate significant differences (p ≤ 0.05) by one-way ANOVA and Tukey’s HSD test with all data points including outliers. Transgenic C. elegans dys-1 null mutation ATU3305 (dys-1(eg33) ccIs4251 [Pmyo3::nucGFP-LacZ + Pmyo-3::mitochondrial GFP] aceIs1 [Pmyo-3::mitochondrial LAR-GECO+ Pmyo2::RFP]) and wild-type ATU3301 (ccIs4251 [(pSAK2) myo-3p::GFP::LacZ::NLS+(pSAK4)myo-3p::mitochondrialGFP + dpy-20(+)] I, acels1 II) were monitored on day 2 of adulthood. (B) Cytoplasmic Ca2+ oscillations with muscle contraction in different three muscle cells (indicated as green, red and blue) with wild-type (ATU2301) and dys-1 null mutant (ATU2305) in the presence or absence of MA-5 treatment for 300 s. Transgenic C. elegans dys-1 null mutation ATU2305 (goeIs3 V, aceIs1 II, dys-1 (eg33) I) and wild-type ATU2301 (goeIs3; aceIs1) were monitored on day 2 of adulthood. (C) Peak width measured as the full width at half maximum (FWHM) of cytoplasmic Ca2+ was analyzed (n = 12–25/treatment). Different letters indicate significant differences (p ≤ 0.05) by Dunn’s test with all data points including outliers. Data are shown as box plots to indicate median (central line) and mean (square mark). Cont: control treated with 0.1% DMSO; MA-5: 10 μM; WT: wild type (strain ATU3301); Diamond mark: outlier data.
Ijms 23 09572 g002
Figure 3. MA-5 suppressed DMD disease model symptoms on mitochondrial fragmentation and mitochondrial Ca2+ levels increase. (A) Representative images of the mitochondrial morphologies (indicated as green), mitochondrial calcium signal (indicated as red) and merged observed. (Scale bar: 20 µm). Transgenic C. elegans dys-1(eg33) null mutant ATU3305 expressing mitochondria-targeted GFP (mtGFP) and mitochondrial calcium-targeted LAR-GECO (mtLAR-GECO) in body wall muscle cells were monitored on day 2 of adulthood. (B) The mitochondria network length in each muscle cell (n ≥ 900 mitochondria from 5–7 worms/treatment) treated with or without MA-5 of 2-day-old ATU3305 adults. Different letters indicate significant differences (p ≤ 0.05) by Dunn’s test. (C) Concentration of mitochondrial calcium in worms (n ≥ 60 from 6–12 worms/treatment). Different letters indicate significant differences (p ≤ 0.05) by Dunn’s test with all data points including outliers. Data are shown as box plots to indicate median (central line) and mean (square mark). Cont: control treated with 0.1% DMSO; MA-5: 10 μM; WT: wild type (strain ATU3301); Diamond mark: outlier data.
Ijms 23 09572 g003
Figure 4. MA-5 suppressed rotenone-induced reactive oxygen species (ROS) levels after 6 h of treatment. Wild-type (N2) adult worms treated with rotenone applied with or without MA-5 on day 2. (A) Representative images of mitochondria stained by AIE™ Mitochondria Blue (indicated as blue) and MitoTracker® Red CMXRos (indicated as red) and merged (scale bar: 10 µm). MitoTracker® Red CMXRos was applied to evaluate the mitochondrial site of ROS generation and AIE™ Mitochondria Blue to determine the mitochondrial location in body muscle cells. (B) The intensity of MitoTracker® Red CMXRos fluorescence as an indicator of ROS production (n ≥ 30 mitochondria from 6–14 worms/treatment). Data are shown as box plots to indicate median (central line) and mean (square mark). Different letters indicate significant differences (p ≤ 0.05) using Dunn’s test with all data points including outliers. Cont: control treated with 0.6% of DMSO; MA-5: 10 μM; Rot: 2 μM Rotenone; Mitoblue: AIE™ Mitochondria Blue; CMXRos: MitoTracker® Red CMXRos; Diamond mark: outlier data.
Ijms 23 09572 g004
Figure 5. MA-5 suppressed rotenone-induced growth retardation, ATP level decline, mitochondrial fragmentation and nuclear breakdown. (A) The body length of N2 worms following rotenone treatment with or without MA-5 (n = 11–20 worms/treatment) was monitored after 48 h. Different letters indicate significant differences (p ≤ 0.05) by one-way ANOVA and Tukey’s HSD test. (B) ATP levels in N2 worms following rotenone treatment with or without MA-5 (n = 12–18 worms/treatment) were monitored after 48 h. ATP levels were assessed using an ATP determination kit (Molecular Probes, Eugene, OR, USA). Different letters indicate significant differences (p ≤ 0.05) using the Dunn’s test with all data points including outliers. (C) Representative images of mitochondrial and nuclear morphology after 48 h treatment (scale bar: 8 μm). Synchronized SD1347 worms (ccIs4251 [(pSAK2) myo-3p::GFP::LacZ::NLS+ (pSAK4) myo-3p::mitochondrial GFP + dpy-20(+)]) I following rotenone treatment with or without MA-5 were monitored after 48 h. (D) The mitochondrial network length (n ≥ 600 mitochondria from 5–8 worms/treatment) and (E) muscle cell nuclei area in SD1347 worms following rotenone treatment with or without MA-5 (n ≥ 20 nuclei from 6–8 worms/treatment) were monitored after 48 h. Different letters indicate significant differences (p ≤ 0.05) by one-way ANOVA and Tukey’s HSD test with all data points including outliers. Data are shown as box plots to indicate median (central line) and mean (square mark). Cont: control treated with 0.1% of DMSO; MA-5: 10 μM; Rotenone: 2 μM; Diamond mark: outlier data.
Ijms 23 09572 g005
Figure 6. MA-5 suppresses rotenone-induced neurodegeneration in dopaminergic cephalic (CEP) neurons. Transgenic C. elegans. TG2435 (vtIs1 [dat-1p::GFP + rol-6(su1006)] V) expressing dopaminergic neurons tagged with a green fluorescent protein (GFP) following rotenone treatment with or without MA-5 were monitored after 24 and 48 h. (A) Representative images of dopamine neuron degeneration under different treatments for 48 h. (Scale bar: 50 µm). White arrowheads in the enlarged red circles indicate neuronal processes that exhibit abnormally discontinuous GFP signals. (B) Frequency of the four CEP blebs along the dendrites in animals (n = 18–20/treatment). Data are shown as box plots to indicate median (central line) and mean (square mark). Different letters indicate significant differences (p ≤ 0.05) using one-way ANOVA and Tukey’s HSD test with all data points including outliers. Cont: control treated with 0.1% of DMSO; MA-5: 10 μM; Rot: 2 μM rotenone; Diamond mark: outlier data.
Ijms 23 09572 g006
Figure 7. MA-5-induced suppression in mitofilin/immt-1 gene mutation against abnormal mitochondrial morphology. immt-1 (tm1730) null mutation ATU3307 worms expressing mitochondria-targeted green fluorescent protein (mtGFP) and nuclear-targeted GFP–LacZ (nucGFP) in body wall muscle cells were treated with or without MA-5 from L4 to adult stage on day 4. (A) Representative images of mitochondrial morphologies are shown (scale bar: 20 µm). White arrows indicate body wall muscle cell nuclei, and white arrowheads indicate abnormally swollen mitochondria. (B) The number of abnormal mitochondria in each muscle cell (n ≥ 35 from 6–8 worms/treatment). Data are shown as box plots to indicate median (central line) and mean (square mark). Different letters indicate significant differences (p ≤ 0.05) using Dunn’s test with all data points including outliers. (C) Observation of the mitochondria using transmission electron microscopy (scale bar: 500 nm). Red arrows indicate abnormal mitochondria and red arrowheads indicate abnormal cristae. WT: wild-type strain ATU3301 as mentioned before; Cont: control treated with 0.1% DMSO; MA-5: 10 μM; Diamond mark: outlier data.
Ijms 23 09572 g007
Table 1. Median lifespan of ATU3301 animals a treated with MA-5.
MA-5 Final ConcentraationMedian Lifespan (Days) b
control (0 μM)13.6 ± 0.6
5 μM15.3 ± 0.5
10 μM14.8 ± 0.4
20 μM14.8 ± 0.3
a ATU3301 (ccIs4251 [(pSAK2) myo-3p::GFP::LacZ::NLS + (pSAK4) myo-3p::mitochondrial GFP + dpy-20(+)] I, acels1 [myo-3p::mitochondrial LAR-GECO + myo-2p::RFP]II) in N2 wild-type background [34]. b Median life expectancy is the age at which half of the population died. One test plot was approximately n = 50, and each experiment was performed in triplicate. There is no significant difference between control and every MA-5 treatment.
Publisher’s Note: MDPI stays neutral with regard to jurisdictional claims in published maps and institutional affiliations.

