
Plastomes of Bletilla (Orchidaceae) and Phylogenetic Implications
by
 ,
,
Shiyun Han
1,†,
Rongbin Wang
2,3,†,
Xin Hong
4,
Cuilian Wu
1,3,
Sijia Zhang
1,3 and
Xianzhao Kan
1,3,* 1
Anhui Provincial Key Laboratory of the Conservation and Exploitation of Biological Resources, Wuhu 241000, China
2
Institute of Chinese Medicine Resources, Anhui College of Traditional Chinese Medicine, Wuhu 241002, China
3
Institute of Bioinformatics, College of Life Sciences, Anhui Normal University, Wuhu 241000, China
4
Anhui Provincial Engineering Laboratory of Wetland Ecosystem Protection and Restoration, School of Resources and Environmental Engineering, Anhui University, Hefei 230601, China
*
Author to whom correspondence should be addressed.
†
These authors contributed equally to this work.
Int. J. Mol. Sci. 2022, 23(17), 10151; https://doi.org/10.3390/ijms231710151
Submission received: 30 July 2022
/
Revised: 22 August 2022
/
Accepted: 2 September 2022
/
Published: 5 September 2022
(This article belongs to the Special Issue Investigate the Genome and Functional Variation/Mechanism of Plant Organelles on Individual and Population Levels)
Abstract
:The genus Bletilla is a small genus of only five species distributed across Asia, including B. chartacea, B. foliosa, B. formosana, B. ochracea and B. striata, which is of great medicinal importance. Furthermore, this genus is a member of the key tribe Arethuseae (Orchidaceae), harboring an extremely complicated taxonomic history. Recently, the monophyletic status of Bletilla has been challenged, and the phylogenetic relationships within this genus are still unclear. The plastome, which is rich in both sequence and structural variation, has emerged as a powerful tool for understanding plant evolution. Along with four new plastomes, this work is committed to exploring plastomic markers to elucidate the phylogeny of Bletilla. Our results reveal considerable plastomic differences between B. sinensis and the other three taxa in many aspects. Most importantly, the specific features of the IR junction patterns, novel pttRNA structures and codon aversion motifs can serve as useful molecular markers for Bletilla phylogeny. Moreover, based on maximum likelihood and Bayesian inference methods, our phylogenetic analyses based on two datasets of Arethuseae strongly imply that Bletilla is non-monophyletic. Accordingly, our findings from this study provide novel potential markers for species identification, and shed light on the evolution of Bletilla and Arethuseae.
1. Introduction
As one of the most species-rich families in vascular plants, Orchidaceae possesses approximately 28,000 species from 736 recognized genera [1,2]. Over the years, numerous studies have been performed on the phylogeny of Orchidaceae [3,4,5,6,7,8]. To date, within the family, the following five subfamilies are currently recognized: Apostasioideae, Vanilloideae, Cypripedioideae, Orchidoideae and Epidendroideae [9]. Among the five subfamilies, Epidendroideae is the largest and most diverse, containing approximately 14 tribes [4,10]. Within the subfamily Epidendroideae, Arethuseae is a key tribe, undergoing variable taxonomic revisions, and currently consists of two subtribes (Arethusinae and Coelogyninae) [8,10,11,12].
Bletilla (subtribe Coelogyninae), with great medicinal importance, is a small genus of only five species distributed in Asia, including B. chartacea, B. foliosa, B. formosana, B. ochracea and B. striata [13,14,15]. Interestingly, despite the small number of species, this genus has a complicated taxonomic history, due to morphological similarities with other genera, e.g., Arethusa and Bletia [15]. As shown in Table 1, the genus Bletilla was subsequently included within the subtribe Bletieae, Bletilleae [16], Bletillinae [17], Bletiinae [10,12] and Coelogyninae [8], respectively. Among them, the most widely convincing taxonomic system for Bletilla is that of van den Berg et al. [4,8,9,18]. In this system, Arethuseae only included two subtribes (Arethusinae and Coelogyninae), and Bletilla was nested within Coelogyninae instead of Bletiinae.
Nevertheless, although most studies have focused on the systematic status of Bletilla, only a few reports have involved its internal branching patterns. Based on nrDNA-ITS and plastid gene matK, Li et al. [19] observed that the genus Bletilla was monophyletic, with B. ochracea being a sister to the remaining species of this clade; Feng et al. [20] found that B. formosana was a sister to B. striata + B. ochracea. Moreover, the monophyletic status of Bletilla has been challenged by a recent study from Huang et al. [18]. In this work, with combined morphological and molecular data, the species B. foliosa (a synonym of B. sinensis) has been treated as a new monotypic genus Mengzia. The monophyletic status of Bletilla and the phylogenetic relationships within this genus are still unclear. Thus, more evidences and further investigations are needed to clarify these issues.
As we know, the plastid genome (plastome), which is rich in both sequence and structural variation, has emerged as a powerful tool for understanding plant evolution [21,22,23,24,25,26,27,28]. In particular, with the rapid development of high-throughput sequencing technologies, numerous studies have enriched plastomic resources, such as the genomic composition, structural variation, high diversity regions [29,30,31]. Additionally, there are still several important characteristics of plastome, which harbor phylogenetic implications, that need to be explored further. For instance, studying plastomic tRNA (pttRNA), which accumulated multiple mutation events, is one point for delving into the plastid evolution [32]. It is becoming widely recognized that tRNAs possess highly conserved clover leaf-like structures [33]. Interestingly, our recent study surprisingly found some novel structures in the pttRNAs of the Macaronesian species (Crassulaceae) [28]. We further identified these secondary structural variations as genus-specific markers. Accordingly, exploring the pttRNAs’ secondary structure in Bletilla greatly benefit a better understanding of the phylogeny of this genus.
In addition, codon usage bias (CUB), referring to the unbalanced utilization of synonymous codons in coding DNA, can be analyzed for getting insights into the evolutionary patterns of both taxa and genes [34,35,36,37,38]. By the statistical analysis of CUB, we can speculate which factor is mainly responsible for bias pattern, usually mutational bias or natural selection [39,40,41]. It should also be noted that the CUB pattern has been reported to be highly associated with gene expression level [42,43]. Based on that, a codon that has a distinct positive relationship between its frequency and gene expression is defined as the optimal codon [44,45]. Codon optimality was attributed as a major determinant of mRNA stability [46,47,48]. Additionally, codon aversion motifs (CAM), presented as the nonuse of codons in genes, has recently been found to be a novel marker for phylogeny studies [49,50]. Definitely, the phylogenetic implications obtained from the analyses of the codon usage and aversion will improve our understanding of the phylogeny of Bletilla.
In this work, aiming to explore the interspecific differences of the genus Bletilla, four new plastomes were reported. Through comprehensive analyses, we are committed to address (1) the compositional variations of plastomes among the members of Bletilla; (2) the differences in novel secondary structures of pttRNAs; and (3) the phylogenetic relationships within the genus Bletilla. Ultimately, our findings of this study will shed light on the evolution of Bletilla and Arethuseae.
2. Results
2.1. Plastomic Organizations and Structural Features
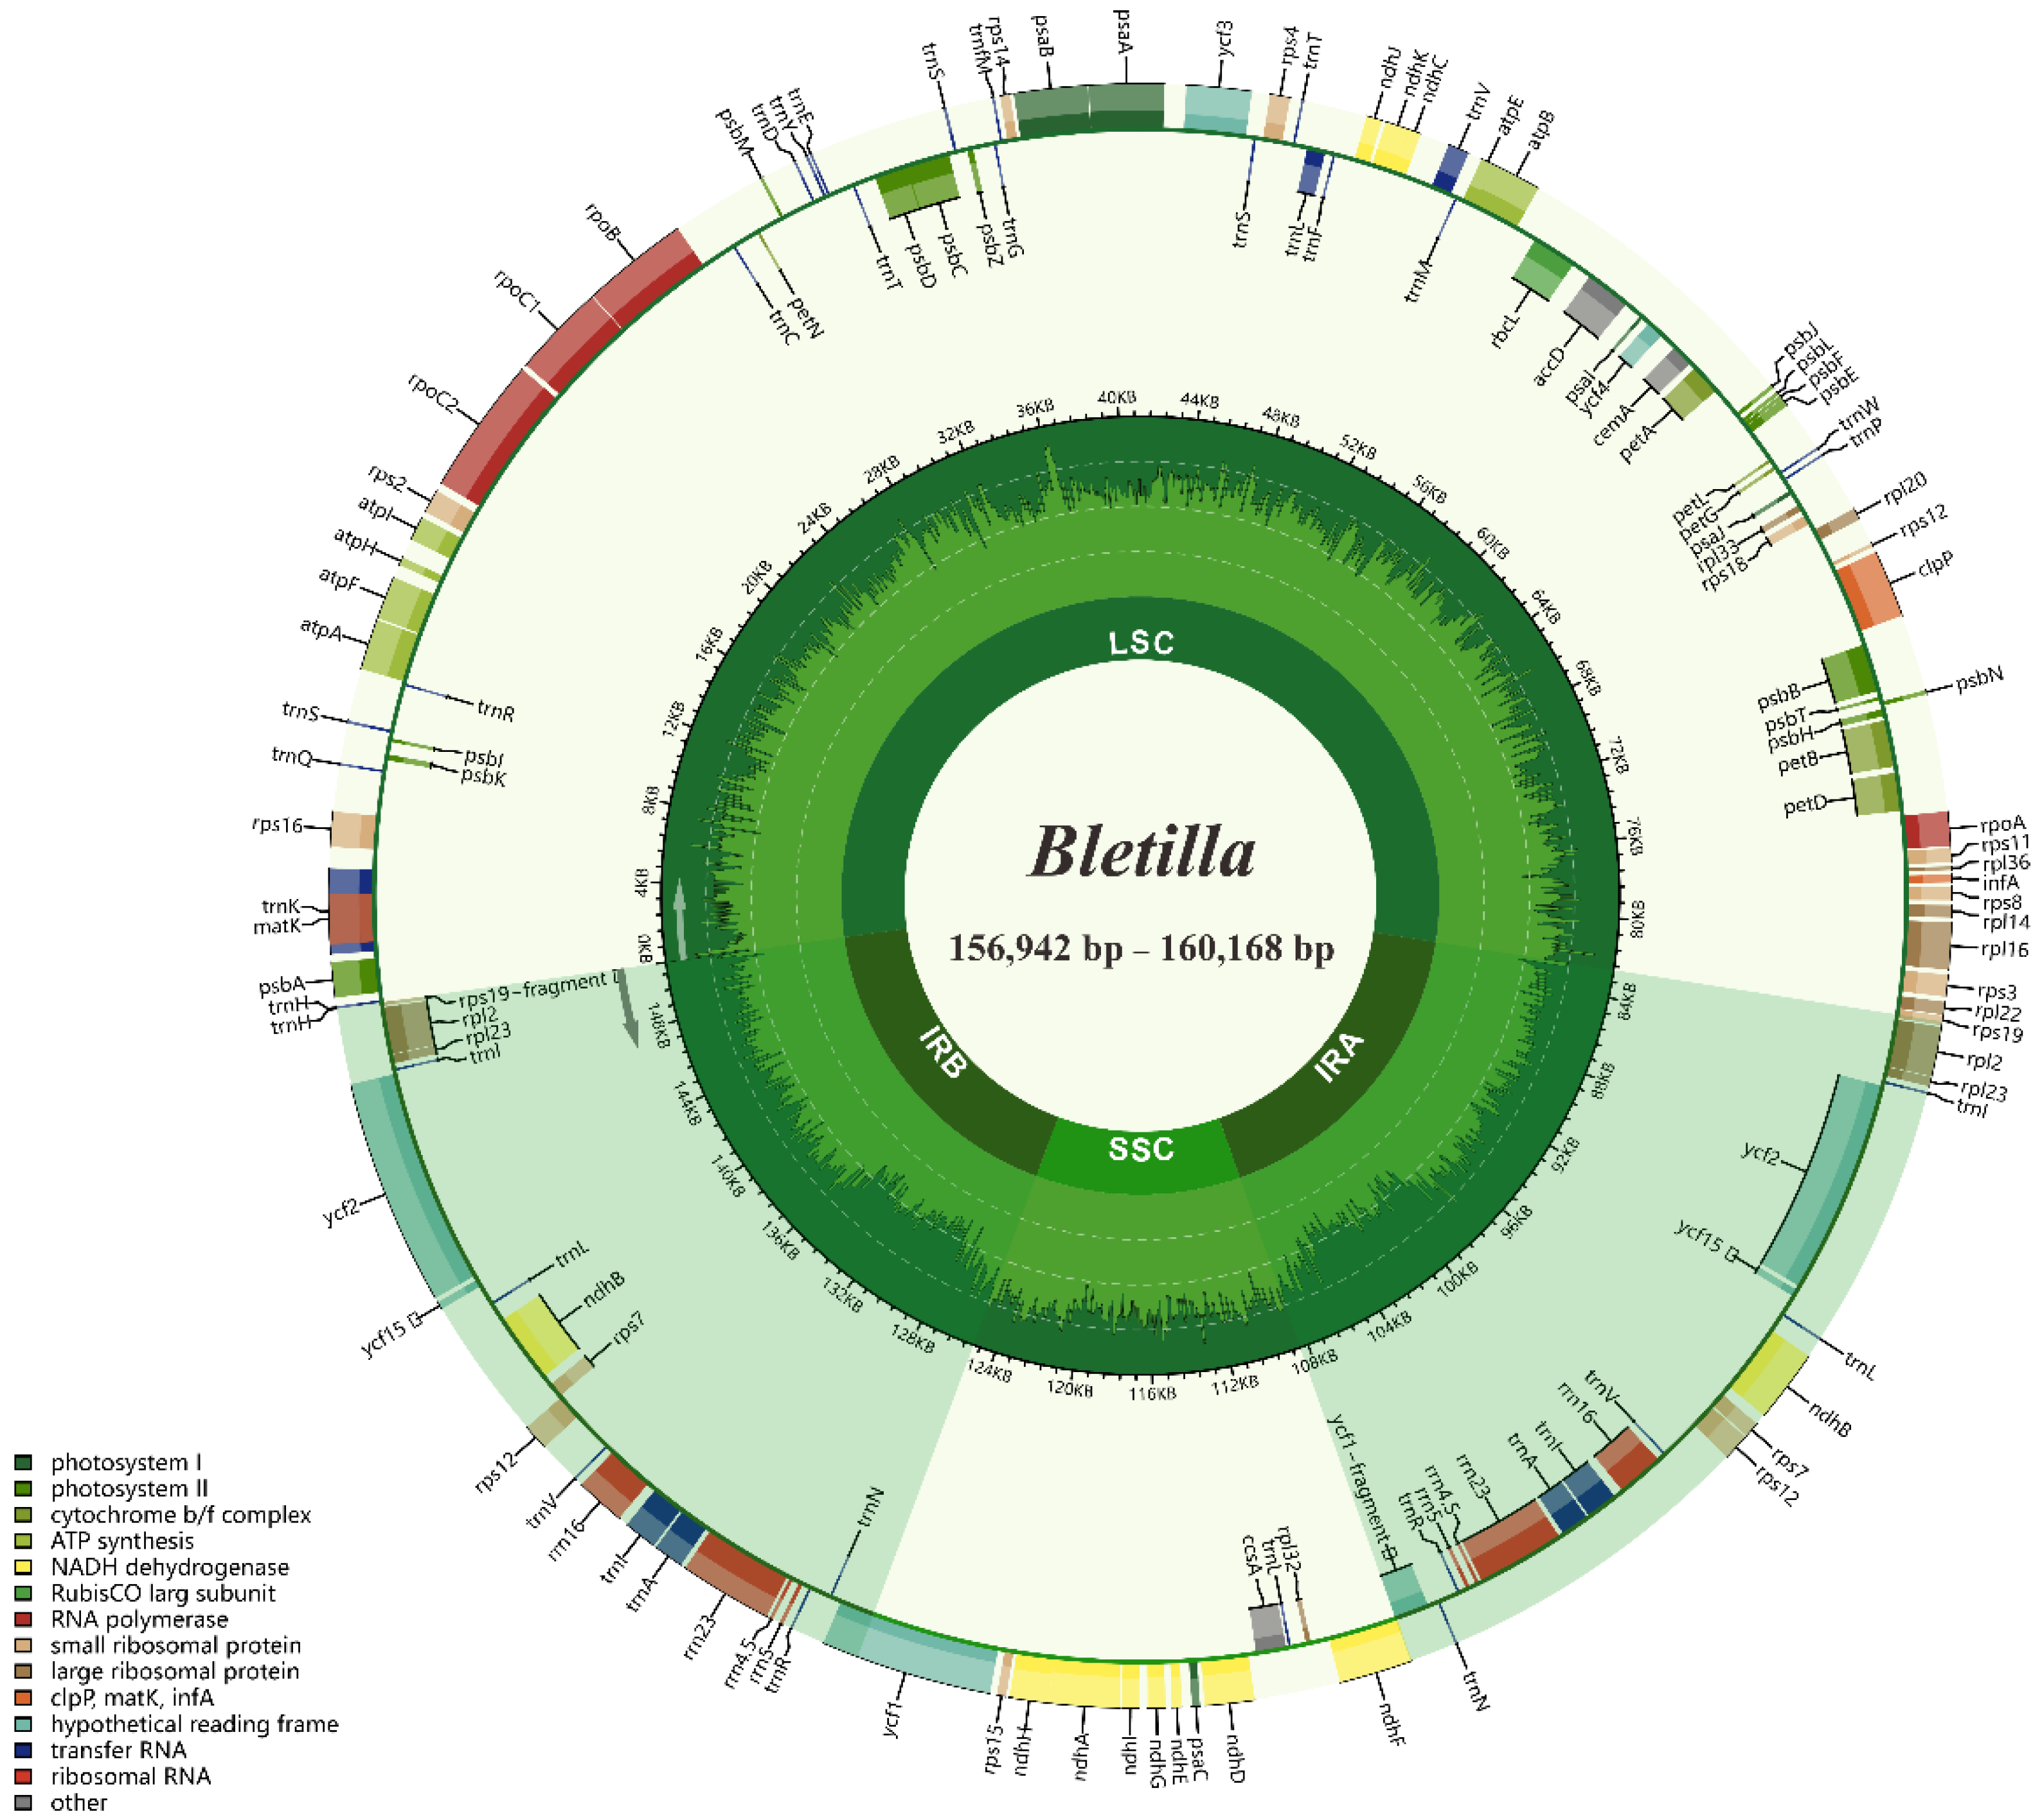
The size of four complete plastome sequences of Bletilla ranged from 156,942 (B. sinensis) to 160,168 bp (B. ochracea), with typical quadripartite structures, containing LSC regions (86,289–87,746 bp) and SSC regions (18,249–18,804 bp) separated by two IR regions (26,202–26,809 bp each) (Figure 1, Table 2). The four plastomes were extremely conserved in GC contents and gene numbers, sharing the highest GC content in IR (43.2%), followed by LSC (35.0–35.1%) and SSC (30.2–30.4%). All investigated plastomes possessed 135 genes, containing 86 protein-coding genes (PCG), 8 rRNAs, 38 tRNAs and 3 pseudogenes (Table S1).
As shown in Figure 2, the four Bletilla species displayed similar structures at JSA (junction IRA/SSC) and JSB (junction IRB/SSC), where ycf1 (functional copy) and ndhF genes spanned these two junctions, respectively. Additionally, a 55 bp overlap between ycf1 (pseudo copy) and ndhF was found at JSB in all four plastomes. Most notably, upon further analysis, we found that B. sinensis had several unique features. For instance, compared with the rather high similarity of plastome size among the three other species of Bletilla (159,484–160,022 bp), B. sinensis featured a much smaller size (156,942 bp). Moreover, we also detected that rpl22 of B. sinensis completely existed in LSC regions, whereas this gene in the other three species was all across LSC and IRb. To better understand the structural variation of IR-LSC junctions, we further investigated a total of 16 well-annotated plastomes from the tribe Arethuseae. Additionally, the results show that the same location of rpl22 was found in B. sinensis and all species in node 1. Meanwhile, all species in node 2 and 3, together with Arundina graminifolia, shared the same expansion of IR in rpl22 gene (Figure 2). Moreover, we also observed that each IR of Arethuseae had a trnH-rps19 gene cluster near both JSA and JSB.
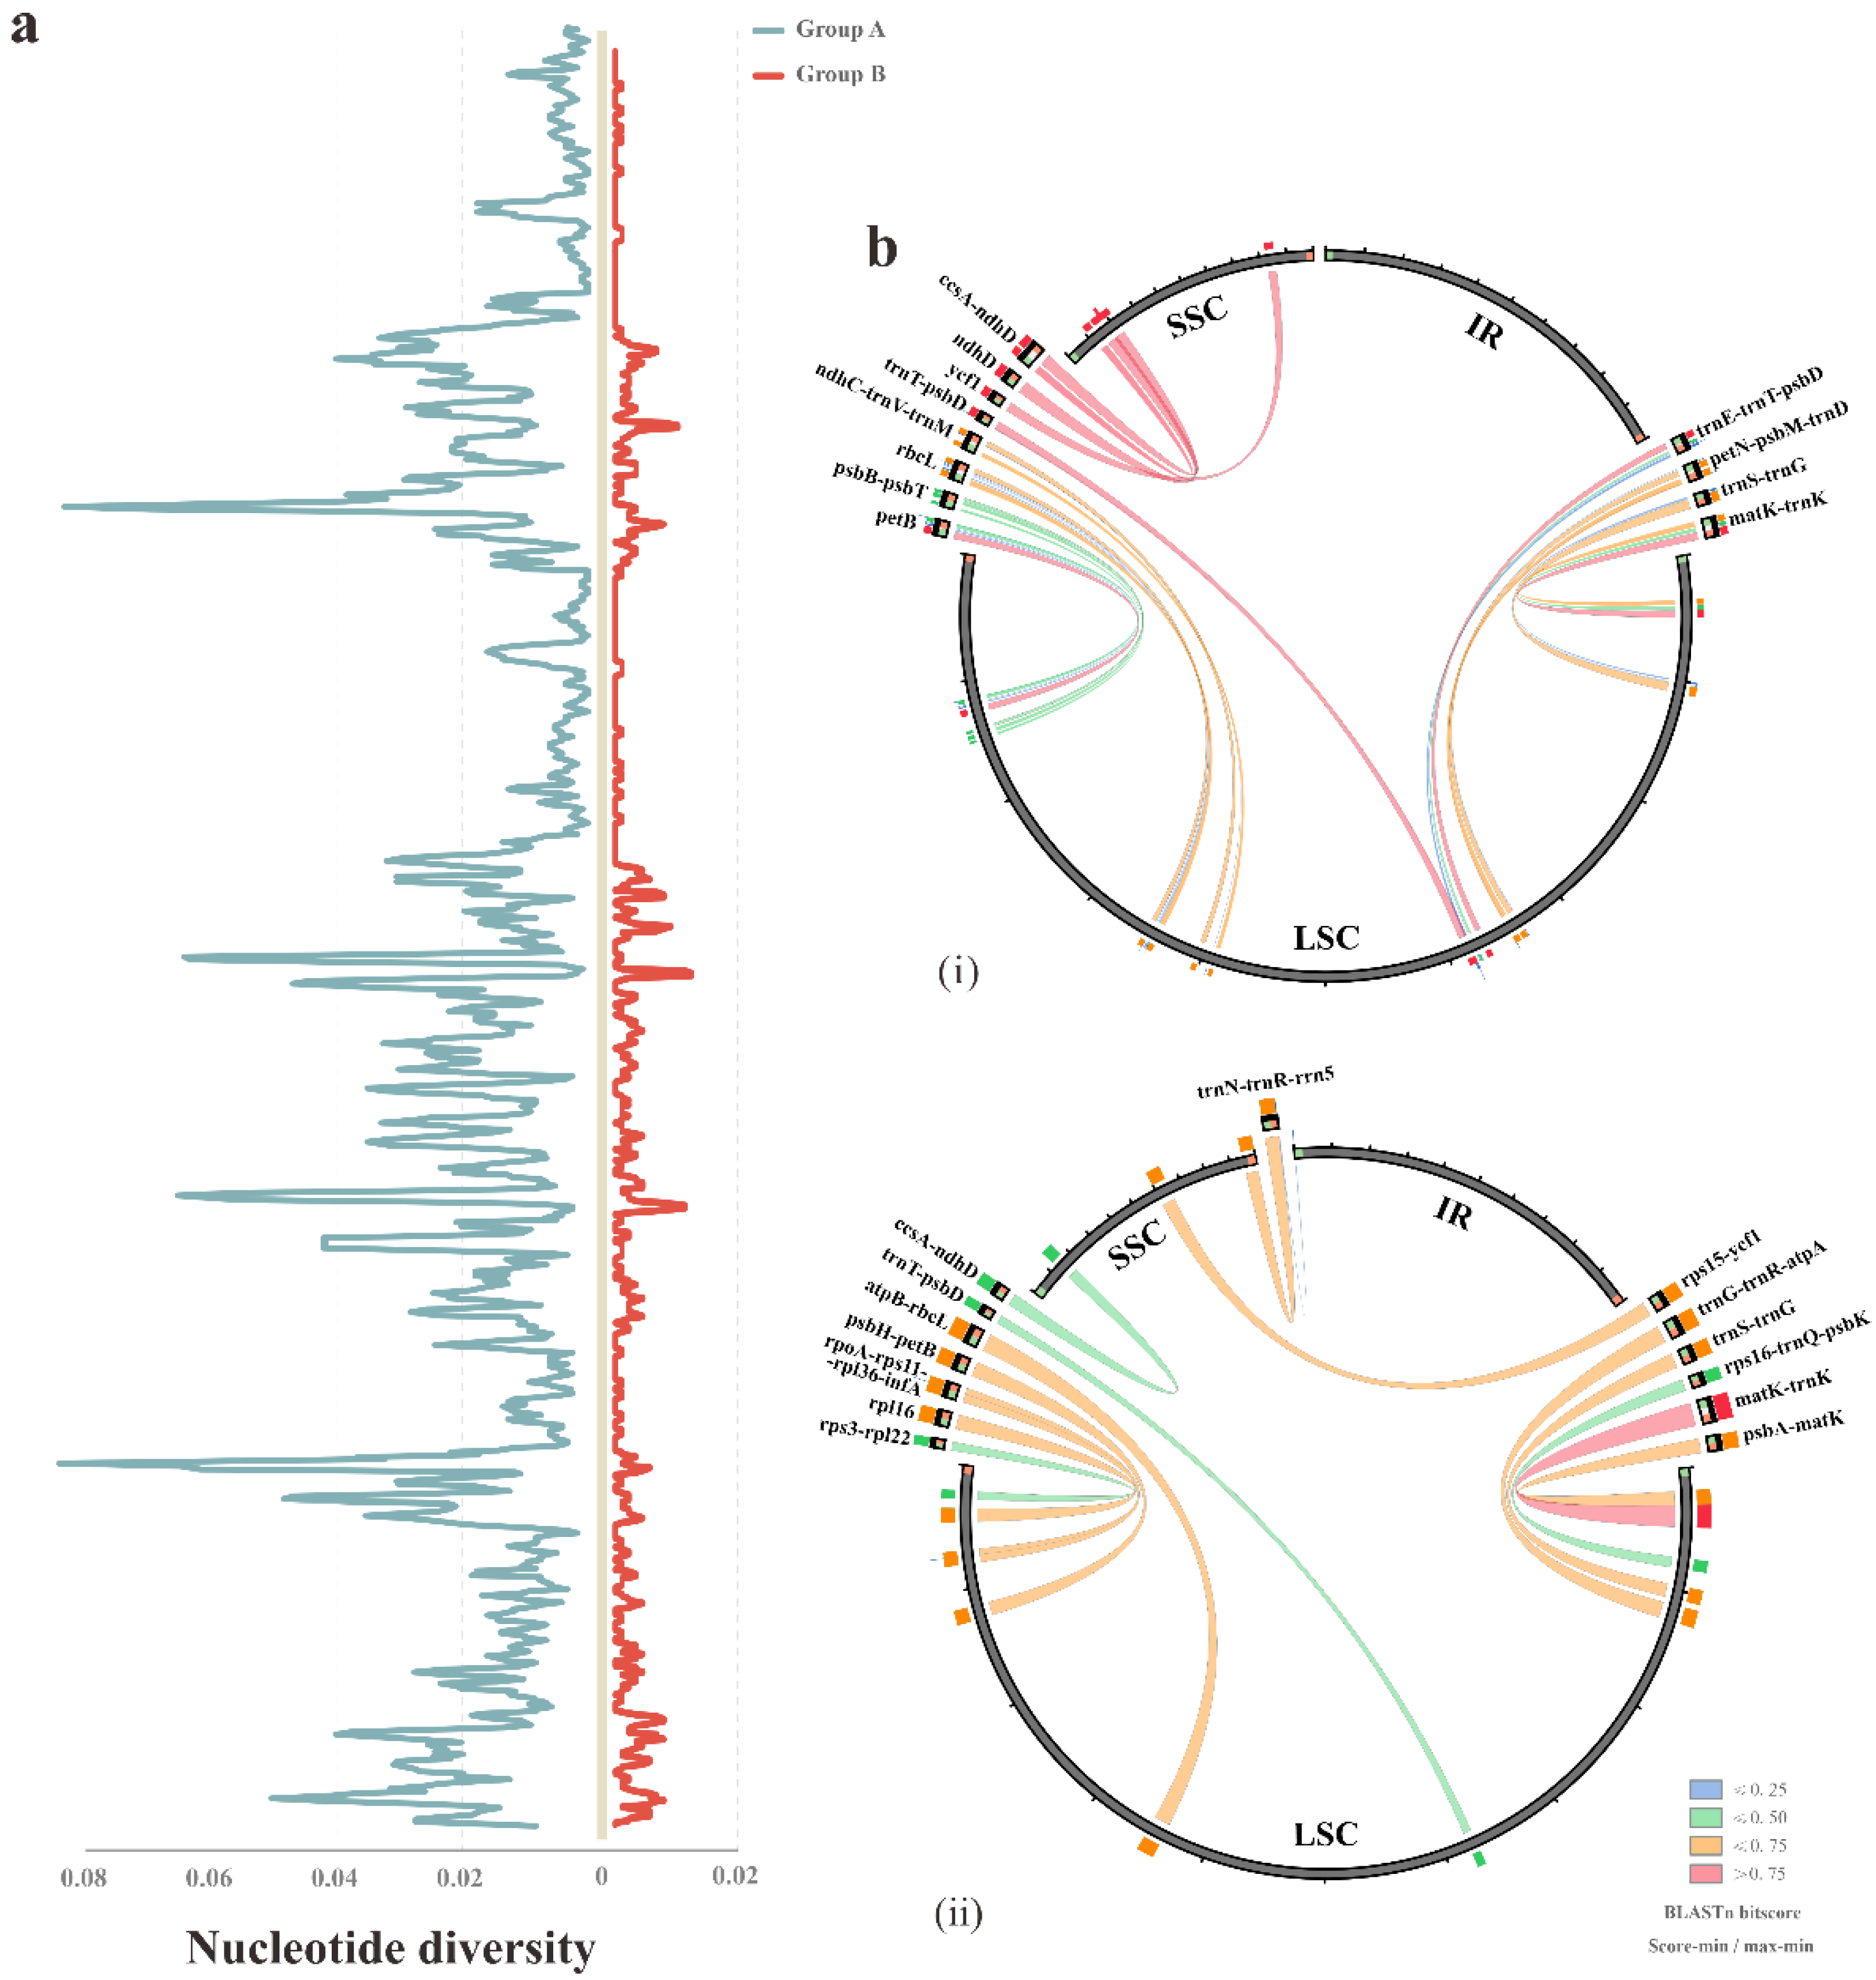
In addition to coding regions, the diversity might also occur in the non-coding regions of the plastomes. Hence, we further analyzed DNA polymorphism among the four plastomes of Bletilla. To detect the intrageneric divergence, the calculation was conducted in two groups: all four Bletilla taxa (group A) and three Bletilla species (excluding B. sinensis) (group B). The identified highly polymorphic regions (HPR) of each group displayed a high degree of variation (Figure 3). In group A, a total of 12 regions were identified with the nucleotide divergence (Pi) ranging from 0.03667 to 0.07028 and 44–353 mutation sites. In comparison, group B possessed 14 HPRs featuring Pi in 0.00556–0.01185 and different sites in 5–33 (Table 3). Most interestingly, only four regions were shared by the two groups, and the Pi values of group A were overall almost 7 times larger than those of group B. Complicated relationships within Bletilla could be inferred by all the above divergence, and the unique patterns of the IR junction and HPR might serve as specific markers for this genus.
2.2. High-Informative Patterns of pttRNAs’ Secondary Structures
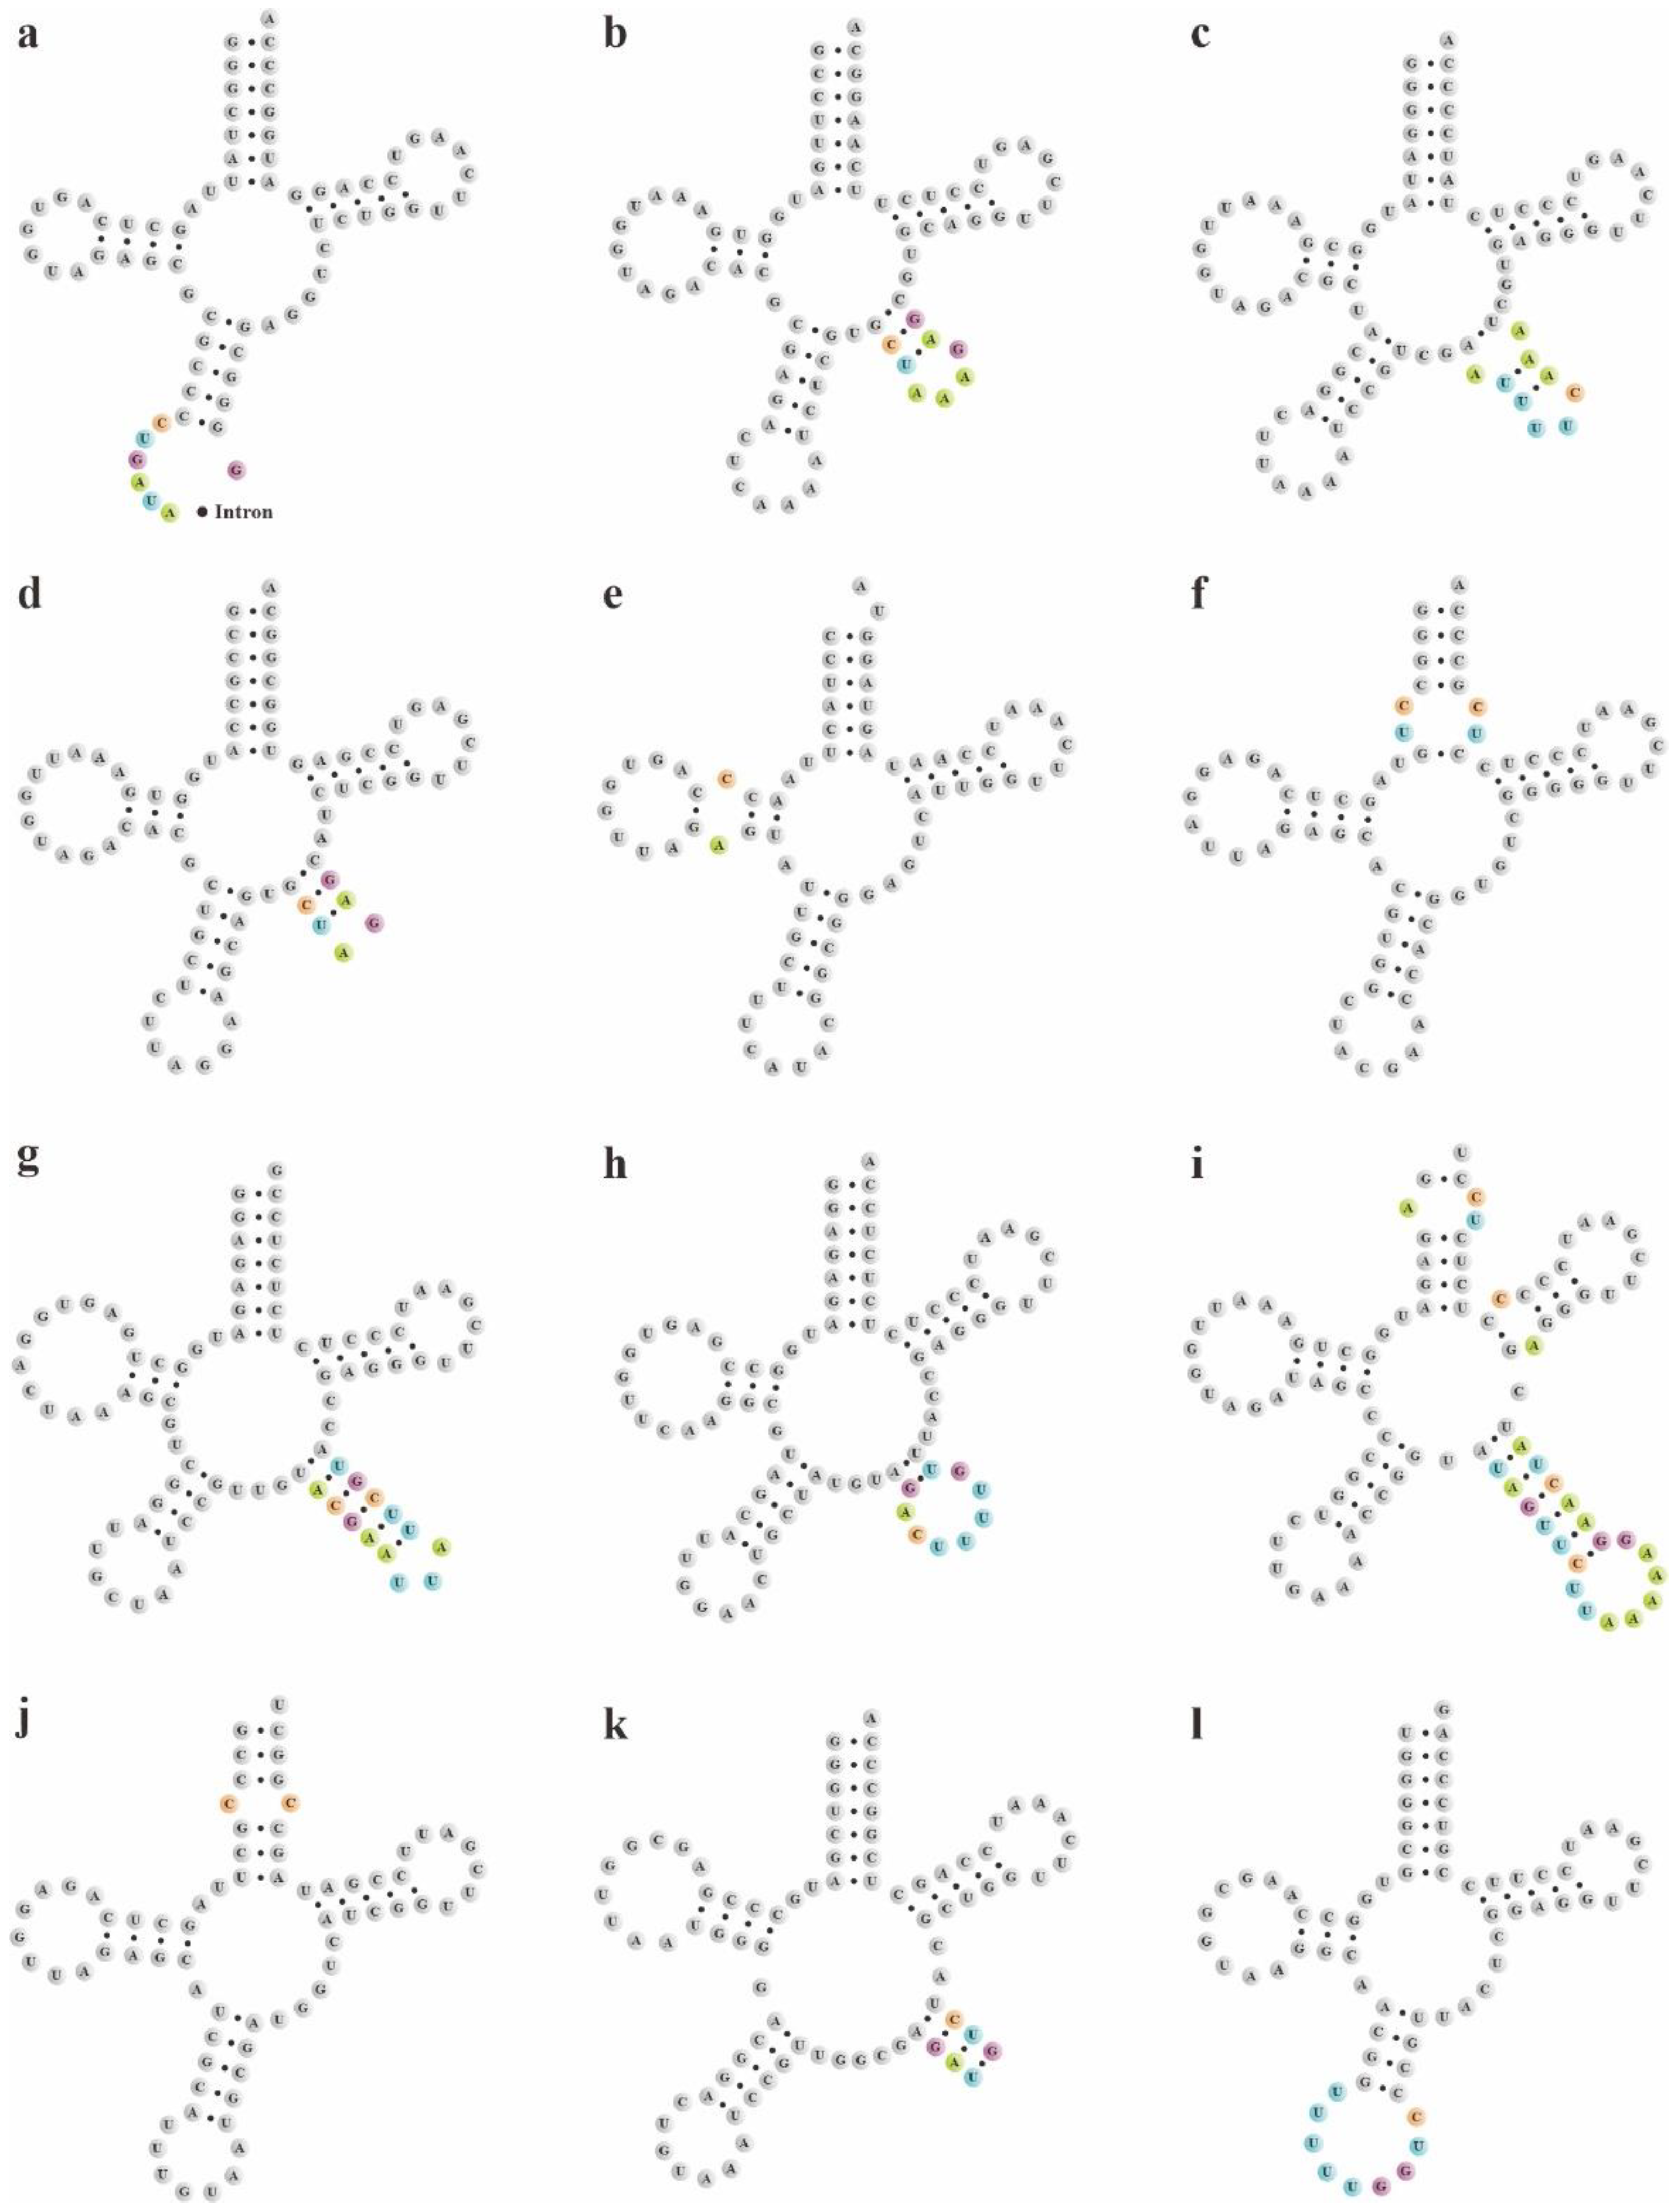
The secondary structures of pttRNAs were identified and compared among four plastomes of Bletilla. In 38 tRNA genes, a total of 12 novel putative pttRNA structures were detected (Figure 4) and were clustered into five groups: (1) pttRNA with one novel loop located in the accept stem: tRNAArg-ACG and tRNAThr-UGU; (2) pttRNA with one novel loop located in the D arm: tRNAMet-CAU; (3) pttRNA with novel variations in the anticodon arm: tRNAIle-GAU harbored an intron in all four Bletilla species and tRNAGln-UUG in B. sinensis contained an expanded anticodon loop; (4) pttRNA with novel structures in the variable loop: tRNATyr-GUA (with a 3-bp stem), as well as tRNALeu-CAA, tRNALeu-UAA, tRNALeu-UAG, tRNASer-GCU and tRNASer-GGA (with new loops); (5) pttRNA with new structures in multiple regions: tRNASer-UGA had one new loop in the acceptor arm, T arm and variable loop, respectively.
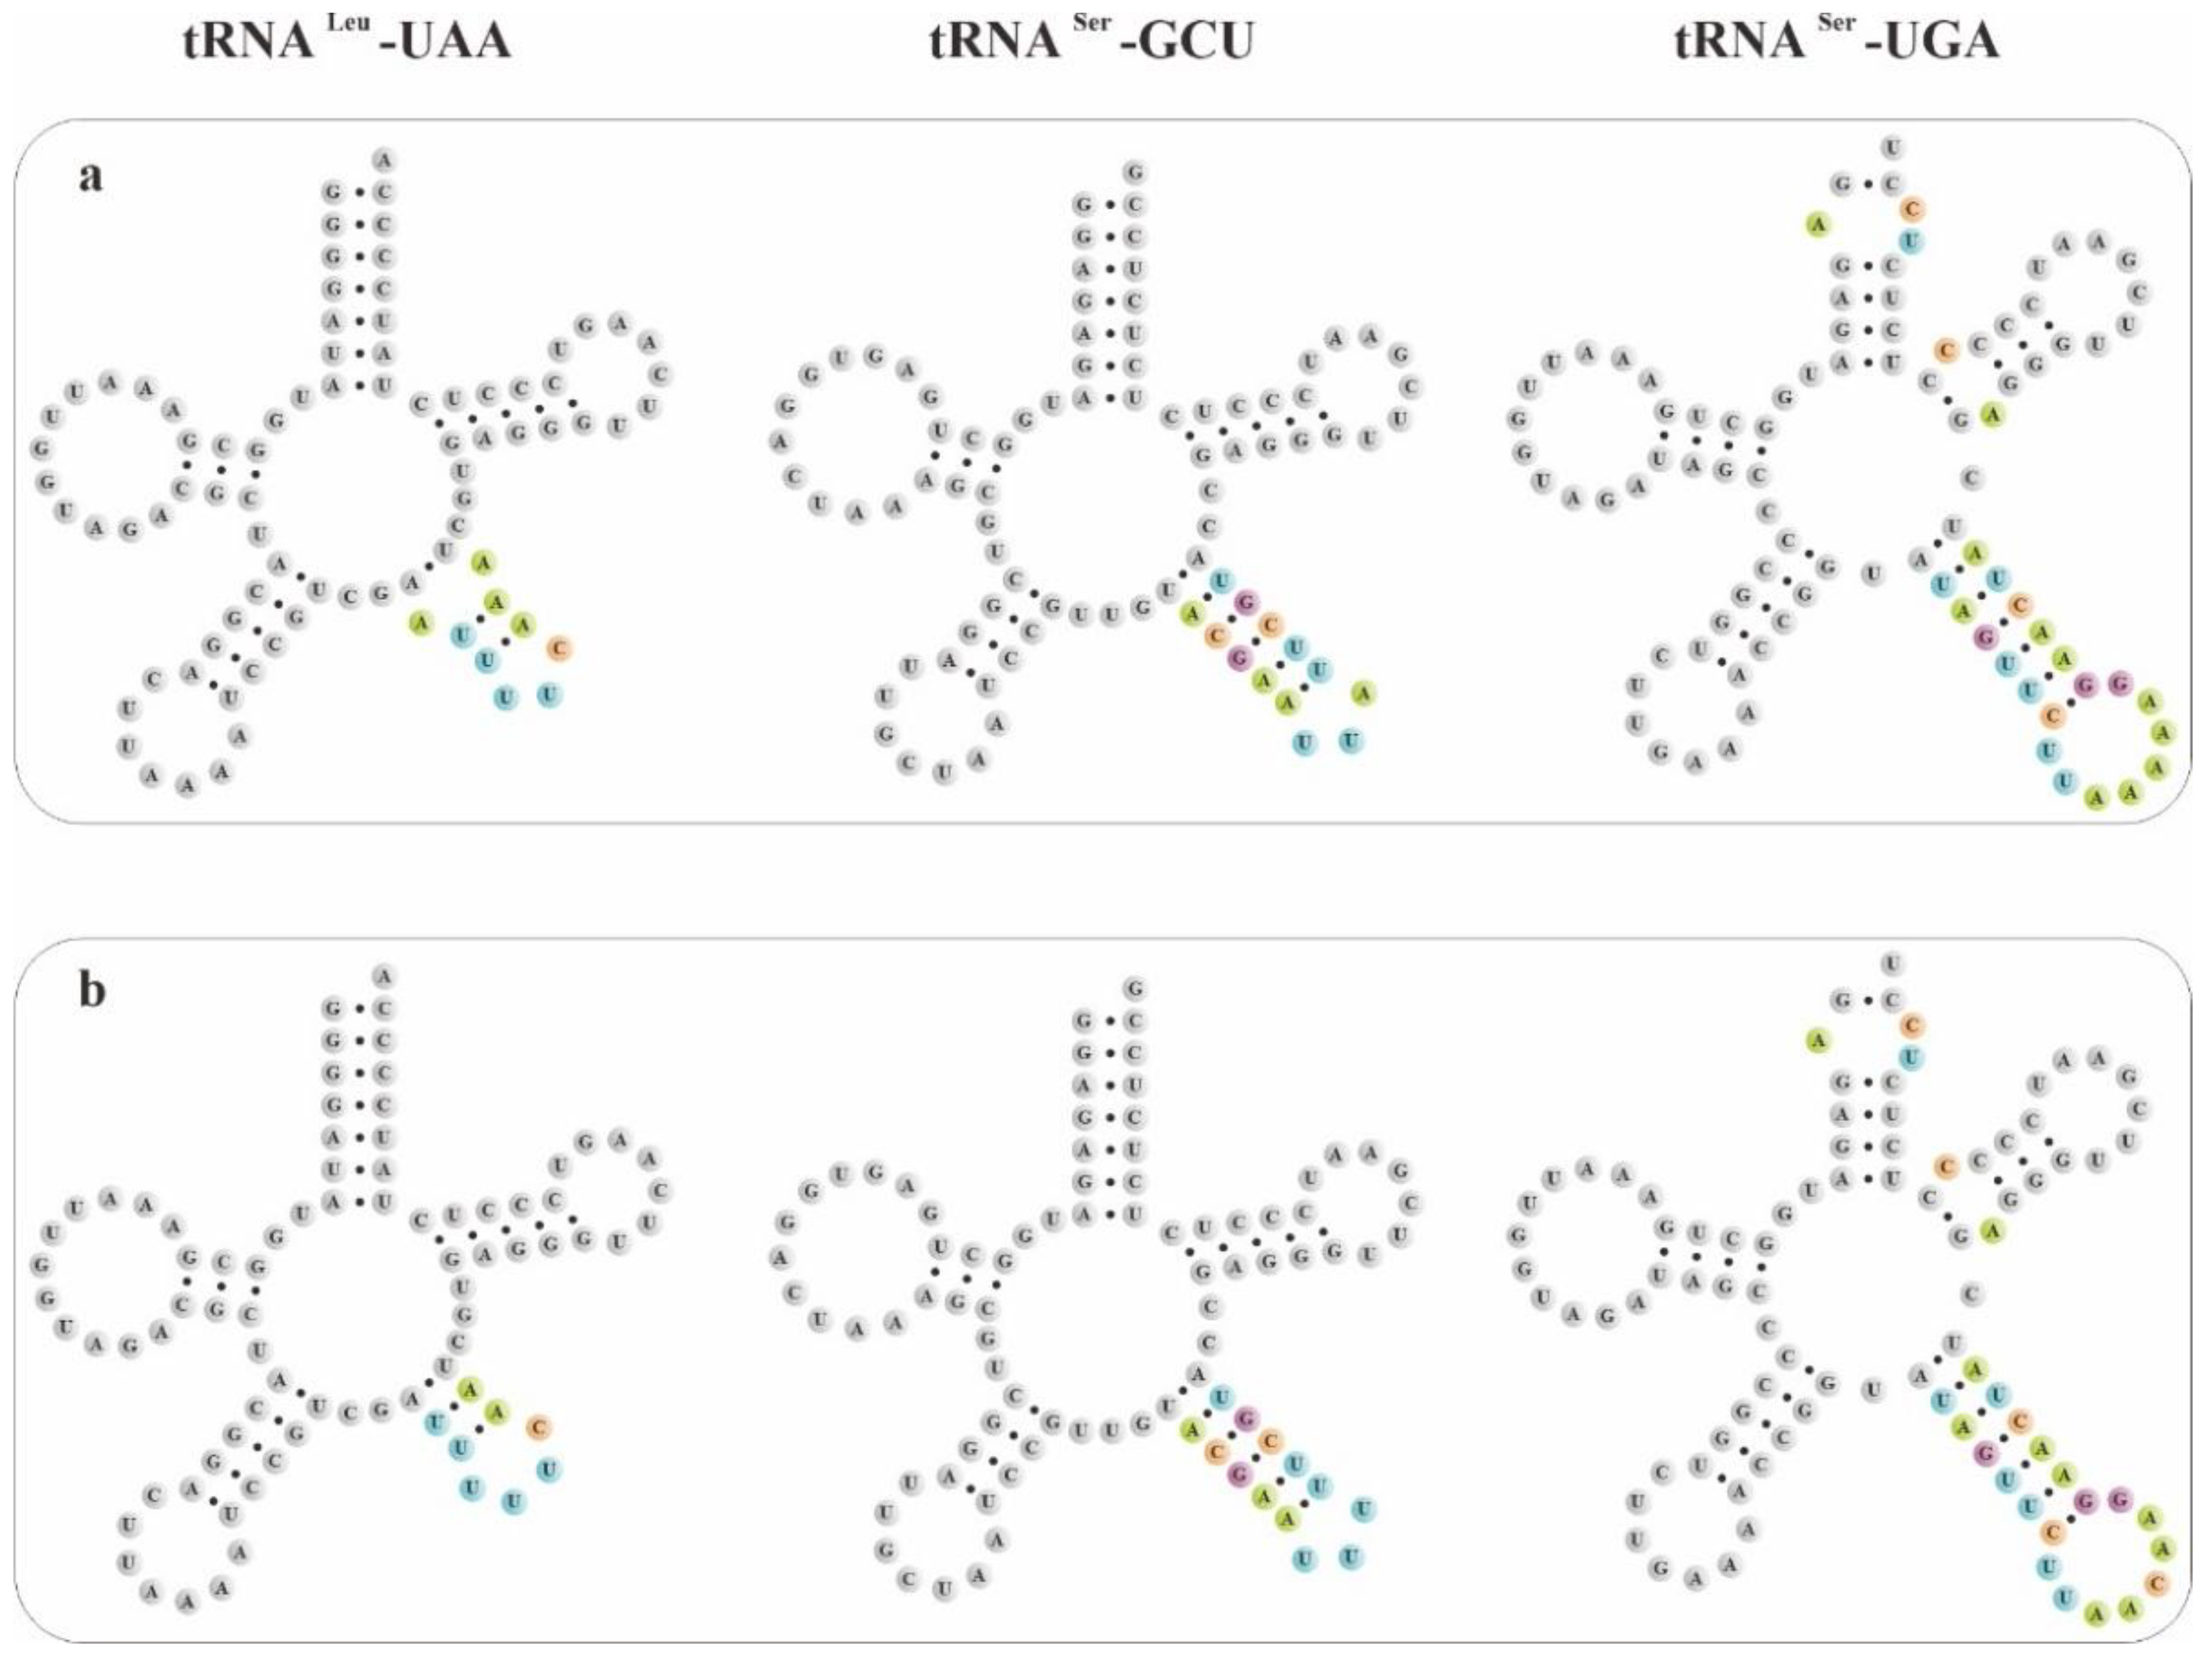
To explore potential new markers for DNA barcoding, we further compared these novel putative pttRNA structures within Bletilla. Interestingly, the species B. sinensis has unique structural features of pttRNA. For example, the expanded 9-nt anticodon loop of tRNAGln-UUG was found to be characteristic for B. sinensis (Figure 4) compared with the ordinary 7-nt loop for the remaining three Bletilla species. Moreover, in the variable loop, three unique pttRNAs were also detected (Figure 5): (1) B. sinensis only had one new variable loop in tRNALeu-UAA, while the other three species all possessed two new loops; (2) tRNASer-GCU contained anticodon-like sequences in the variable loops for all four Bletilla species, however, the sequence 5′-UUU-3′ is only for B. sinensis, while it is 5′-UUA-3′ for the other three; (3) the position nt 56 in tRNASer-UGA was occupied by ‘C’ for B. sinensis and ‘A’ for the other three.
Furthermore, we conducted comparative analyses at the intergeneric level in the tribe Arethuseae (involving 22 released plastomes in total). Notably, except for tRNASer-UGA, the structural features of tRNAGln-UUG, tRNASer-GCU and tRNALeu-UAA of B. sinensis differed from the other species of the tribe Arethuseae.
2.3. Patterns of Codon Usage and Aversion
To explicate the patterns of codon usage and aversion among four species of Bletilla and one closely related species Arundina graminifolia, we performed the evaluation of the effective number of codons (ENCs), relative synonymous codon usage (RSCU) value, optimal codons and codon aversion motifs (CAM). Only 53 CDSs with sizes of at least 300 bp were considered for further analyses.
To reflect varying levels of CUB, the lowest and highest 5% of ENC values were selected and compared among these five species. As presented in Table 4, we detected high similarities in B. formosana, B. ochracea and B. striata, which shared the exactly same pattern for both low (rps18, rpl16 and psbD) and high (clpP, ndhE and ycf3) groups. In contrast, for B. sinensis, the low group included rps8, and the high group possessed rps4 and ndhJ. It was worth noting that the B. sinensis was found to share some similarities with A. graminifolia on ENC values. For instance, the rps8 (37.85) gene was also one of the lowest in A. graminifolia and ndhJ (53.81) was the third highest as well.
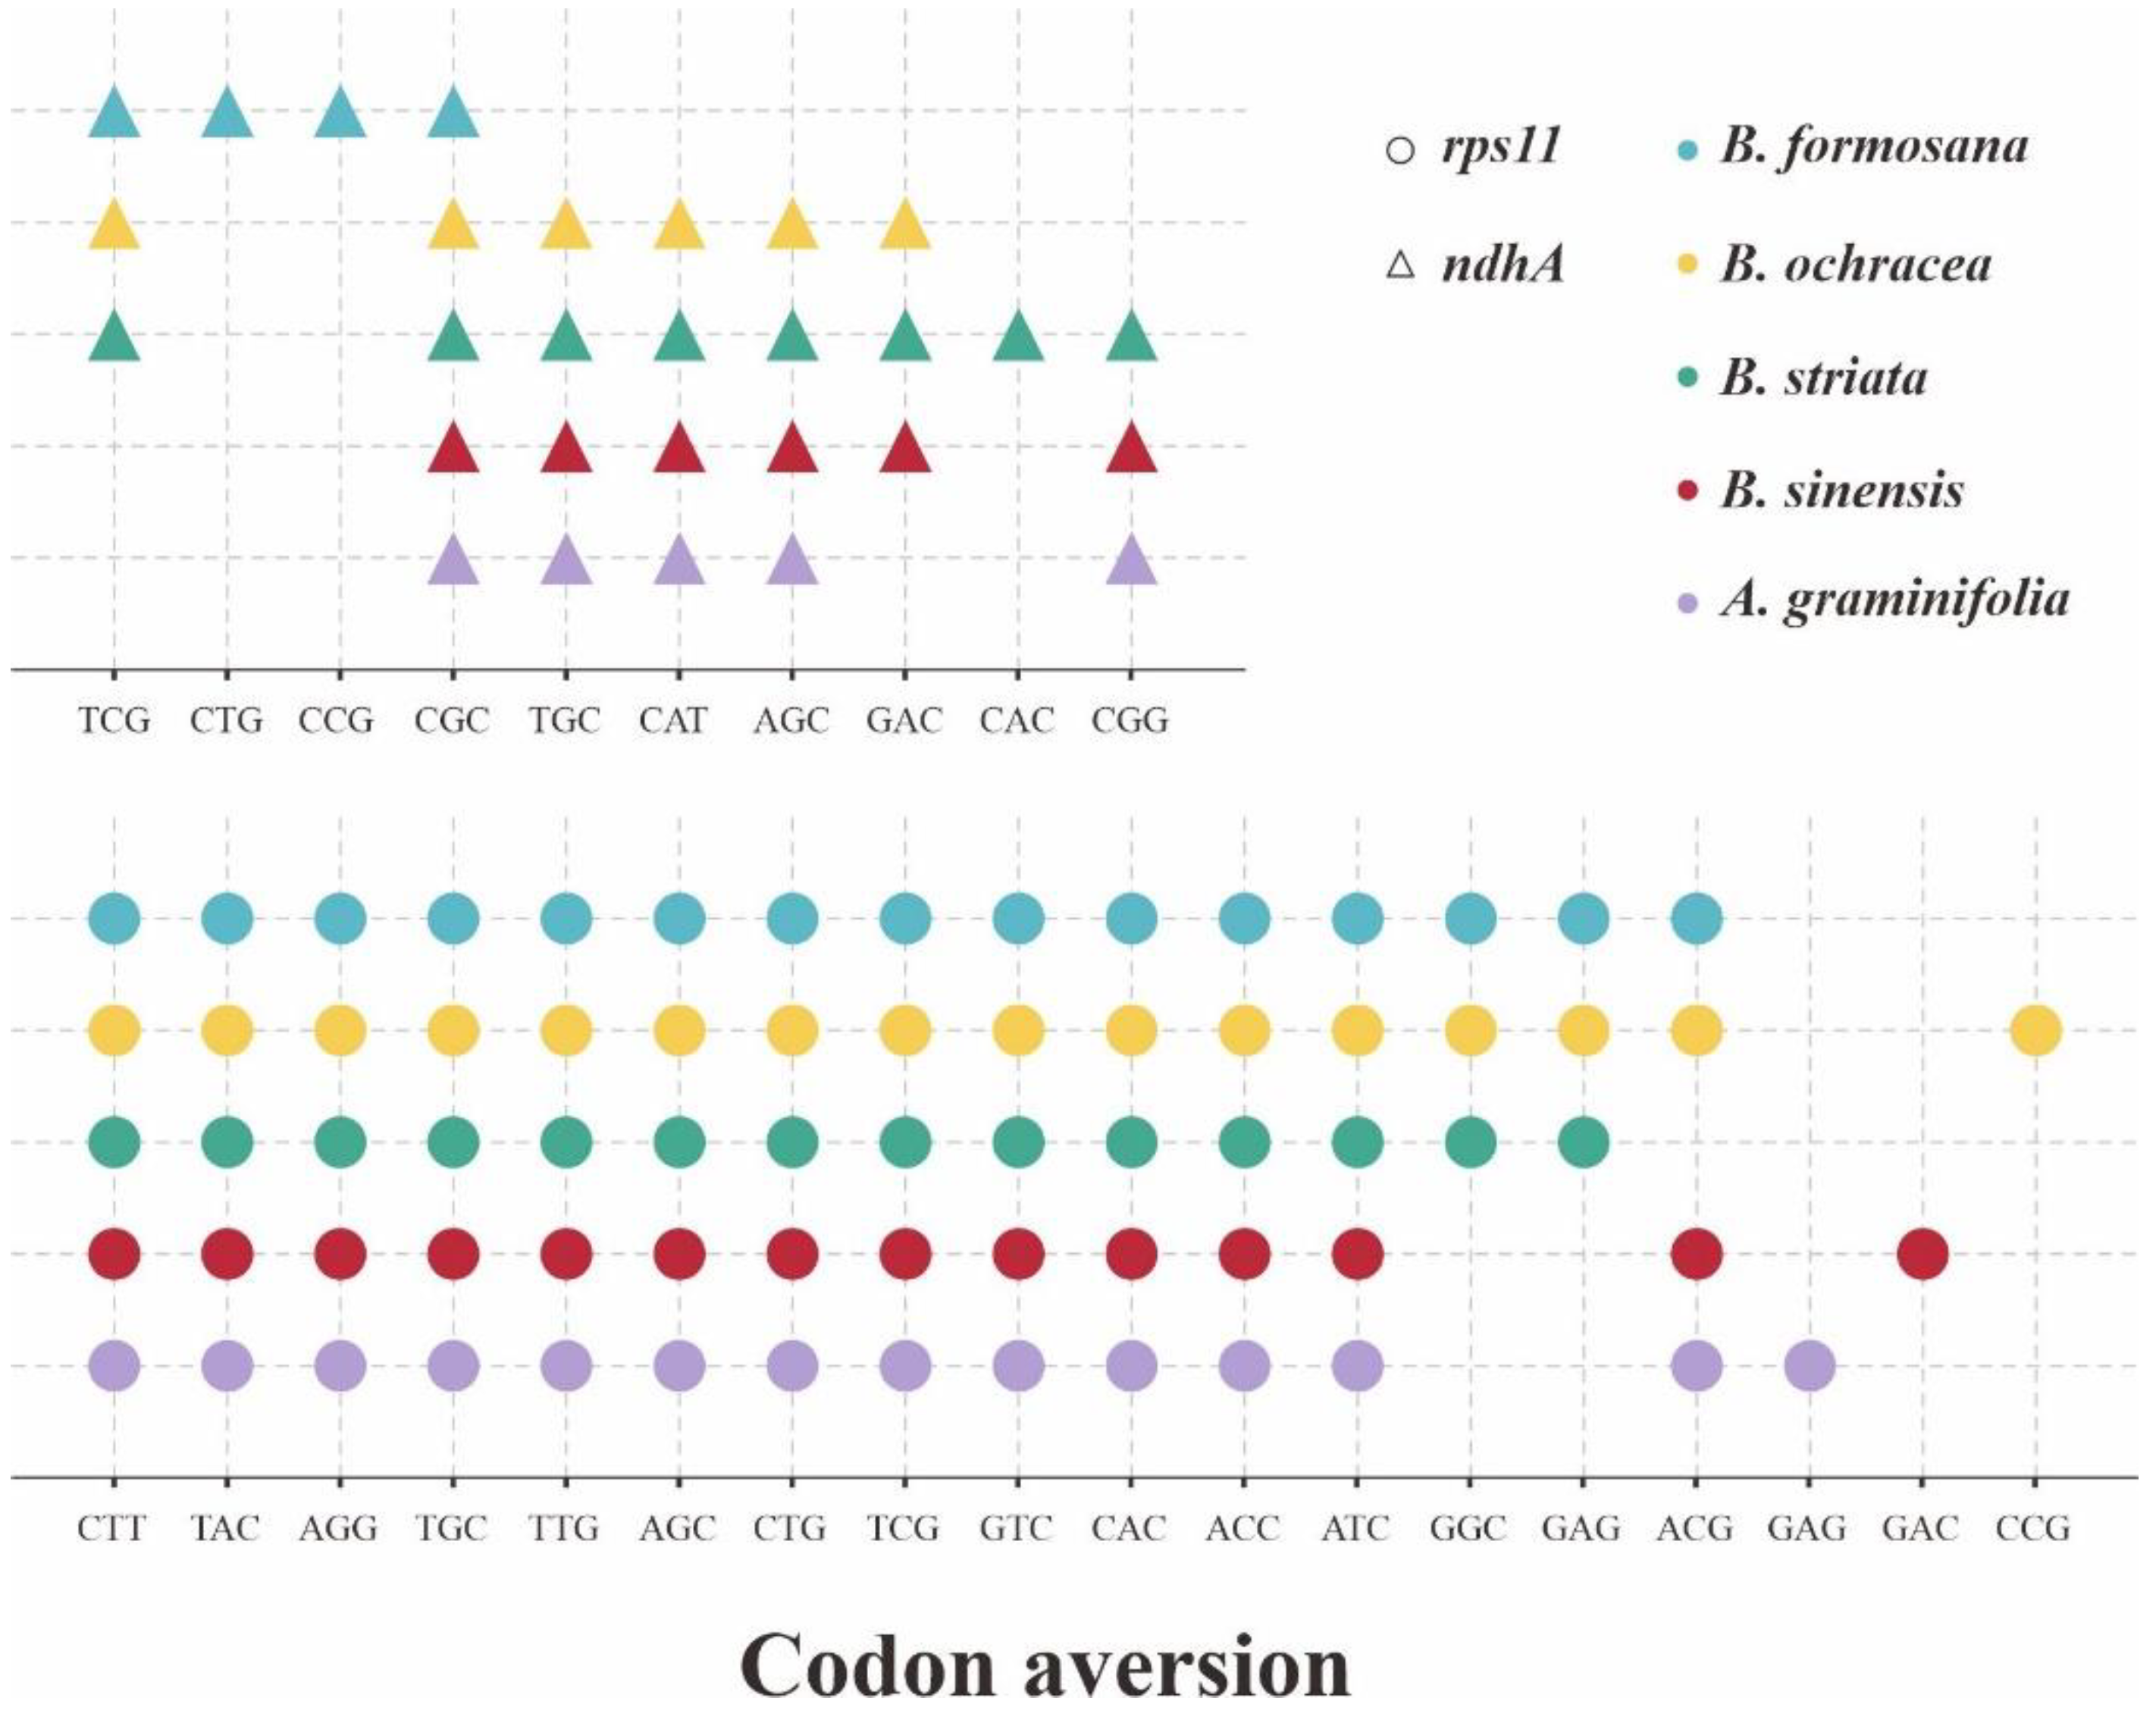
Considering the codon aversion can act as a new character system in phylogenetics, we also employed the analysis of CAM for these 53 CDSs of five plastomes (Table S2). The genus Bletilla had a highly conservative codon aversion pattern excluding B. sinensis, harboring the same motifs for 27 CDSs. Among these 27 CDSs, five are shared by B. sinensis (clpP, ndhB, ndhJ, rps7 and ycf4). Surprisingly, we detected many unique CAM for B. sinensis from a total of 31 CDSs, indicating the substantial interspecific difference in Bletilla. Furthermore, two CDSs (accD and atpF) were observed that were shared by A. graminifolia and B. sinensis. Most significantly, as shown in Figure 6, the aversion motifs identified in ndhA and rps11 genes could distinguish five investigated species.
The optimal codons identified in the five plastomes were shown in Table 5. Four species possessed four optimal codons, respectively: B. formosana, B. ochracea and B. striata had the same pattern (GGU, UUG, UCC and CGU), and A. graminifolia featured by GGU, UUG, UCC and CGA. Instead, B. sinensis only had two optimal codons (GGU and CGA), showing a high degree of diversity. Notably, GGU was shared by all five species, and CGA was shared by B. sinensis and A. graminifolia.
2.4. Phylogenetic Implications of Plastomes within Bletilla
To further clarify the evolutionary relationships within the genus Bletilla, especially the taxonomic position of B. sinensis, we performed phylogenetic analyses. Along with four new plastomes generated in this study, our phylogeny totally covered 36 species from 9 genera of Arethuseae using the datasets of 79 PCGs. Based on the 69,937-bp concatenated sequence, similar tree topologies were obtained for both ML and BI algorithms.
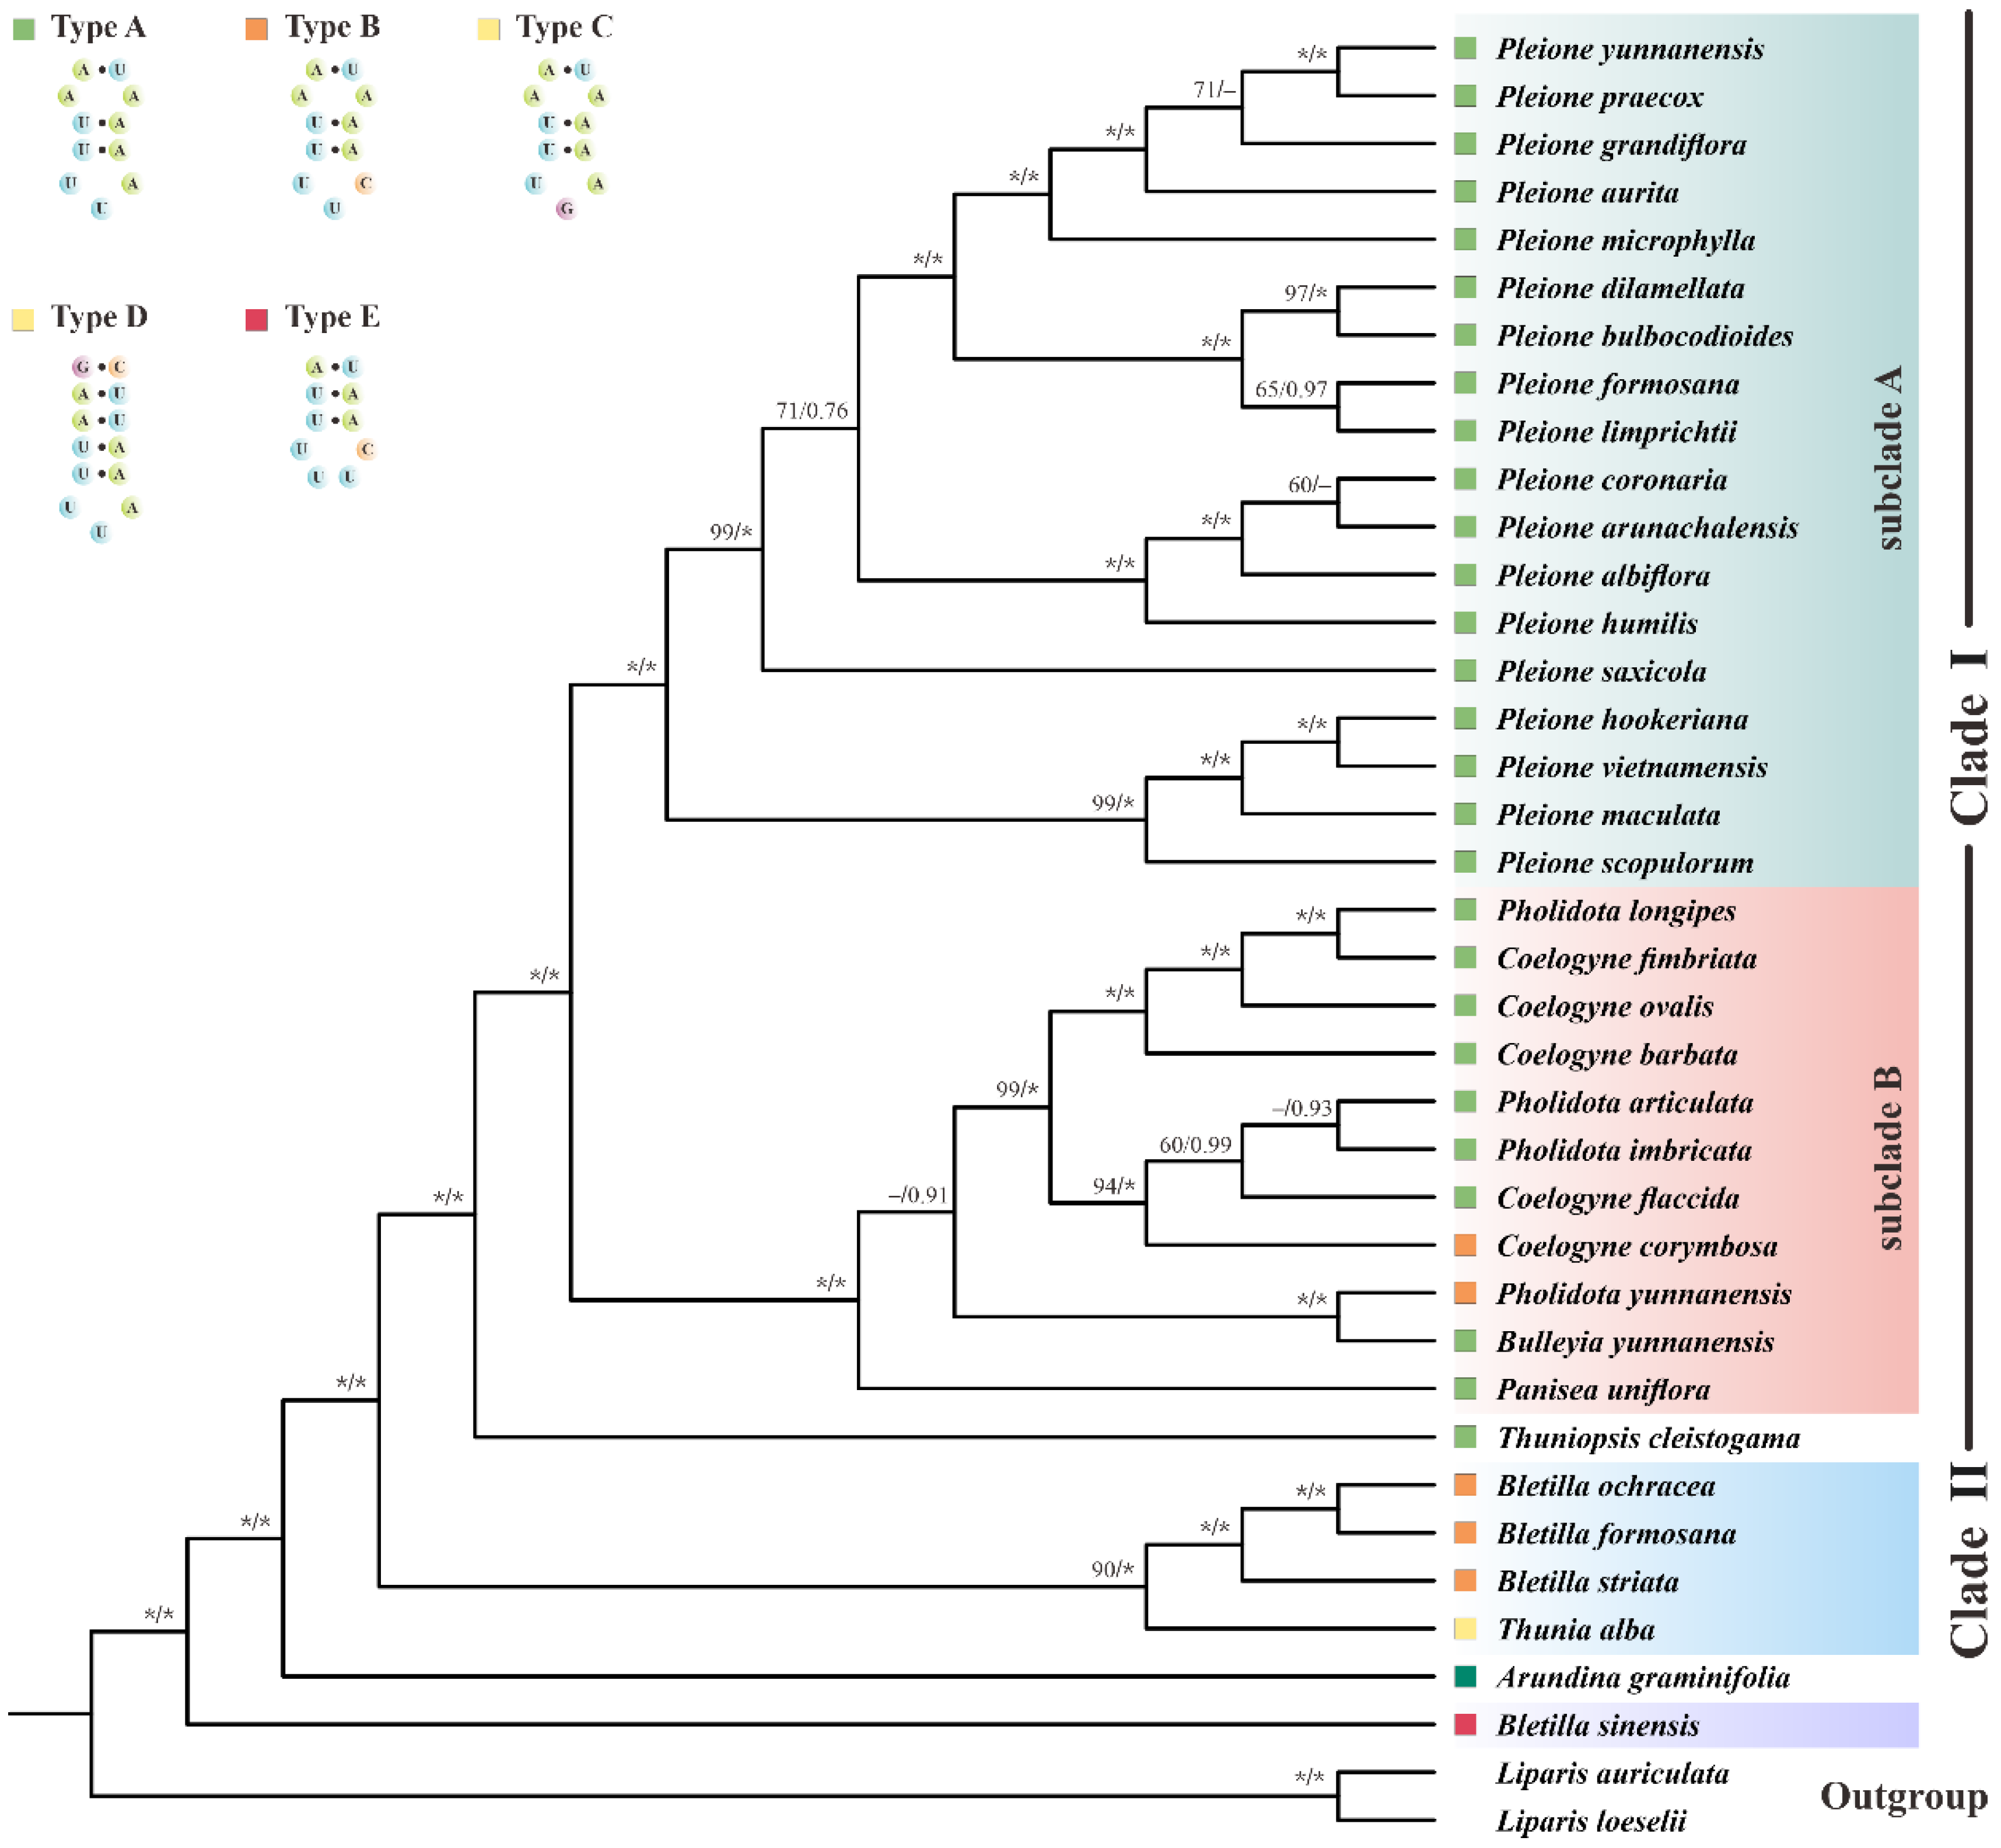
As Figure 7 displayed, most Arethuseae species formed two main clades. Clade I comprised 6 genera, which could be further divided into two subclades. All Pleione species clustered in a strongly supported monophyletic group (subclade A) ([BS] = 100, [PP] = 1.0). As sister to subclade A, subclade B consisted of four genera (Pholidota, Coelogyne, Panisea and Bulleyia ([BS] = 100, [PP] = 1.0). Among the members of subclade B, the two genera (Pholidota and Coelogyne) were recovered to be paraphyletic. Thuniopsis, a monotypic genus, was found to be the basal sister branch of Clade I ([BS] = 100, [PP] = 1.0). Furthermore, Bletilla species (excluded B. sinensis) and Thunia alba formed a distinct clade (clade II) (90 in ML, 1.0 in BI). Our data also support a sister relationship between Arundina graminifolia and these two main clades (clade I and II).
In addition, we also constructed a wider taxonomic sampled cladogram based on six cpDNA loci, additionally comprising the data of three Arethusinae taxa (Figure S1). Notably, clade I showed a highly similar topology to the PCG trees. Additionally, its sister clade (clade II) was composed of four species, three of which (Arethusa bulbosa, Eleorchis japonica and Calopogon tuberosus) formed a well-supported subclade (100 in ML, 1.0 in BI), and A. graminifolia was weakly grouped with them.
Significantly, it was interesting to note that B. sinensis was not clustered with other Bletilla members, and was located at the basal position of Arethuseae ([BS] = 100, [PP] = 1.0) in all trees instead. Thus, our results suggest that the genus Bletilla is paraphyletic.
3. Discussion
With the aim of clarifying the interspecific relationships in the genus Bletilla, this study reported the plastomes sequences of four species. Comprehensive analyses were performed within Bletilla and the tribe Arethuseae, including basic genomic properties of plastids, the structural features of IR boundaries, the predicted structures of pttRNAs, the patterns of codon usage and aversion, as well as phylogeny. Thereby, this work provides abundant molecular evidence for resolving the taxonomic issues in Bletilla, and also sheds light on the evolution of Arethuseae.
Characterized by single-parent inheritance, conservative organization, and a relatively slow-evolving rate, the plastome is widely recognized as a super-barcode for plant species discrimination and phylogenetic analyses [51,52,53]. From our analyses, both similarities and differences were detected between B. sinensis and three other Bletilla species. All four plastomes harbored exactly the same number of genes and similar GC contents. With the same location of the ycf1 gene, all four plastomes possessed a pseudo ycf1. Nevertheless, compared to other species, the gene content of B. sinensis at JLB was highly divergent. According to Downie and Palmer [52], any mutation occurring in the structure or content of plastome possibly implicated phylogeny. In our recent study on plastome evolution [28], the rps19 genes in all investigated taxa of Crassulaceae were located at the JLB, and were extended by 105 or 110 bp in the IRb. However, all rps19 genes from members of the tribe Arethuseae were present in IRb. Moreover, the trnH-rps19 gene cluster in IRs observed in this study was also present in most monocots, implying that the duplication of this cluster was prior to the divergence of monocot lineages [54].
Nucleotide mutations are cluster-distributed and manifested as “hotspots” in plastomes [55]. Consistent with previous studies [56,57,58,59,60], we also observed that genes in the IR regions were slower to evolve than those in the SC regions. To our knowledge, few mutational hotspots were found in the IR regions. For instance, Henriquez et al. [31] investigated five plastomes of Monsteroideae, which exhibited no hotspots in the two repeat regions. The decreased rates of substitution might result from gene conversion in IR regions [58,61,62]. More interestingly, Li et al. [63] observed that genes translocated into the IR region of fern plastomes not only reduced substitution rates, but also increased the GC content. In addition, the substantial increase in the Pi values in group A (Bletilla included B. sinensis) compared to group B (Bletilla excluded B. sinensis) indicated the faster substitution rate in B. sinensis. This finding implies that the three species (B. ochracea, B. formosana and B. striata) were closely related to each other and distantly related to B. sinensis. Dong et al. [64] found that highly variable chloroplast markers were suitable for evolutionary studies on angiosperms at low taxonomic levels. In our recent research on the plastome evolution of Aeonium and Monanthes (Crassulaceae) [28], we strongly recommended that the hotspots (highly polymorphic regions) of plastomes might have important implications for phylogeny, and could be used for the DNA barcoding of plants. Therefore, the identified hotspots loci in this study obviously possessed higher informative divergence, which would act as more efficient markers for the barcoding and phylogeny of Bletilla.
As we know, the complete plastome has significant genomic resources for untangling phylogenetic issues [65,66,67,68]. Linking the mRNA and protein, pttRNA occupies a critical part of chloroplast [32,69,70]. Brennan and Sundaralingam [71] pointed out that tRNAs embodies two categories on the basis of a variable-region size: type I contains a small loop with 4 or 5 nt, and type II has a larger size with a stem (3–7 bp) as well as a loop (3–5 nt). In this work, among the 38 pttRNAs of Bletilla, seven with a variable arm were examined to belong to type II, including tRNALeu-CAA, tRNALeu-UAA, tRNALeu-UAG, tRNASer-GCU, tRNASer-GGA, tRNASer-UGA and tRNATyr-GUA. It is noteworthy that tRNATyr of type II was considered to be unique to prokaryotes in an early study [72]. However, through intensive and extensive sampling, Sun and Caetano-Anollés [73] found that all Tyr specific tRNAs in both Archaea and Eukaryotes were also classified as type II. The long variable arm was presumed to be an ancient structure and was lost in more derived tRNAs [73].
More notably, plastomic tRNALeu-UAA was proved to have important phylogenetic implications. As shown in Figure 7, Arethuseae could be sorted into five distinct categories based on the variable loop of tRNALeu-UAA. Type A was shared by Clade I, consisting of the genera Bulleyia, Coelogyne (except for C. corymbosa), Panisea, Pholidota (except for P. yunnanensis) and Pleione; type B was featured in the genus Bletilla (except for B. sinensis), C. corymbosa and P. yunnanensis; while types C, D and E were unique to Thunia alba, Arundina graminifolia and B. sinensis, respectively. Based on these analyses, we strongly suggest that the genus Bletilla is non-monophyletic. Our results clearly indicate that the secondary structures of pttRNAs are of highly informative value for phylogenetic analyses. Thus, more in-depth studies are needed to better understand the evolutionary significance of pttRNAs in plants.
The CUB pattern is affected by multiple factors, such as selection on translation [74], gene size [75] and composition [76], as well as mutation and selection pressure [41,77]. The ubiquity of CUB in different genes or taxa makes it an ideal resource for investigating molecular evolution, gene expression, nucleotide composition, etc. [78,79]. As a vital index of CUB, ENC is widely associated with the gene expression level. The lower value of ENC means the stronger impact from CUB, and vice versa [80]. Additionally, it has been widely acknowledged that a higher level of expression is generally associated with a more powerful bias [81,82]. Notably, in comparison with three other species of Bletilla, our analysis revealed that B. sinensis varied considerably in ENC pattern, which might imply that the gene expression mode in B. sinensis is different. Another important indicator for gene expression is optimal codons. In fact, codon optimality has been proven to be a key determinant of mRNA stability [46,47,48]. Previous studies proposed that the number of optimal codons might be correlated with a different selection mode [81,83]. Generally, a positive selection will result in an increased number of preferred codons, while negative selection might cause a decrease. Significantly, we found that B. sinensis harbored the least number (two) of optimal codons among the five taxa investigated, suggesting that this species might undergo more pressure from purifying selection than others. On the other hand, codon aversion has recently been proposed to have extraordinarily potential value in phylogeny [28,49,50,84,85]. Remarkably, this study identified extremely divergent CAM in B. sinensis compared with other analyzed species. Moreover, following the method of Miller et al. [50], we further recovered the phylogeny of Arethuseae using CAM, exhibiting the same topology with the tree based on the PCGs of plastomes. Accordingly, our analyses on the patterns of codon usage and aversion confirmed the non-monophyly of Bletilla within the tribe Arethuseae.
In order to overcome the limitations of a few loci and the taxon sampling estimated, we employed two datasets (79 plastomic PCGs for 38 taxa, and 6 cpDNA regions for 49 taxa) to construct the cladogram of Arethuseae, respectively. Significantly, the non-monophyly of Bletilla was strongly supported by two different phylogenetic methods. We also found a heterogeneity in the relationship between B. sinensis and Arundina graminifolia compared to the work of Huang et al. [18]. The latter study found a sister relationship of them, while B. sinensis was located at the basal position of Arethuseae in the present study. Currently, there are a limited number of phylogenetic informative sites for the phylogeny of Arethuseae. Hence, to better evaluate the taxonomic status of B. sinensis, more samples are needed.
4. Materials and Methods
4.1. Sample Material, DNA Extraction, Sequencing and Annotations
The fresh leaves of four Bletilla species (B. formosana, B. ochracea, B. sinensis and B. striata) were gathered, and their specific locations are listed in Table S3. The extraction of whole-genomic DNA was achieved using the Plant Genomic DNA kit (Tiangen, Beijing, China) according to CTAB method [86]. TruSeq DNA PCR-Free Library Prep Kit (Illumina, San Diego, CA, USA) was employed for library construction. Additionally, the resulting libraries were then sequenced through Illumina Novaseq 6000 with 150 paired-ends and 350 bp insert size.
The sequenced reads were quality assessed by FastQC and trimmed using Fastp v.0.11.0 [87,88]. The obtained reads were then assembled by GetOrganelle v.1.7.5.0 [89], taking the plastome of Bletilla striata (MT193723) as reference [90]. Gene annotation was conducted by GeSeq [91], and the annotation results were manually confirmed, with the BLAST program for coding sequences (CDSs) and tRNAscan-SE v.2.0.3 for pttRNA genes [92,93]. Lastly, the plastomes were visualized by Chloroplot [94].
4.2. Comparative Structural Analyses among the Plastomes of Bletilla
Comprehensive structural analyses were conducted comparatively among four members of the genus Bletilla. Firstly, the nucleotide composition of the plastomes was identified using Bioedit [95]. The boundaries at the junctions of IR and SC regions were checked and plotted manually. Additionally, the secondary structure of pttRNAs was then predicted by tRNAscan-SE v.2.0.3 [46].
4.3. Plastomic Codon Usage and Aversion Indices
To investigate the plastomic codon usage, CodonW v.1.4.2 was employed for the calculation of the value of ENC and RSCU [96]. The RSCU value was applied to quantify the degree of even use for each synonymous codon, with a value larger than 1 favoring the use of a codon and vice versa [97]. In the range of 20–61, ENC values usually denote the bias of codon usage, and the strong bias features with a low value [98].
Furthermore, to explore the deep correlation between CUB and gene expression, we conducted the ΔRSCU method to determine optimal codons in Bletilla [44,45]. Taking the ENC values of the CDSs as a substitute for expression degree, the highest and lowest 5% were categorized as the low and high group, respectively [40,81] Then, the optimal codons were sifted out with the ΔRSCU > 0.08 as well as the RCU (relative codon usage) value > 1 in the high group and <1 in the low group.
Moreover, to gain more informative genetic evidence, the codon aversion motifs, possessing strong phylogenetic implications, were extracted and manually checked using the CAM algorithm [50].
4.4. Phylogenetic Inferences
To untangle the controversy of the phylogeny of Bletilla, we performed phylogenetic analyses within the tribe Arethuseae. Additionally, two species of Liparis, from the closely related tribe Malaxideae of Arethuseae, served as outgroups. Additionally, two phylogenetic sampling strategies were employed in this study.
The first one was the inclusion of all available complete plastomic sequences of the tribe Arethuseae from NCBI, along with four new data from this study. The 79 plastomic CDSs from a total of 38 taxa formed the first dataset, which represented nine genera of the tribe Arethuseae (Table S4).
Furthermore, six cpDNA regions (ccsA, matK, psaB, rbcL, rpoC1 and ycf1) were selected for the second dataset. It consisted of 49 species, including eight additional species of Coelogyninae and three Arethusinae taxa compared to the first dataset (Table S5).
The two datasets were aligned, respectively, with MAFFT, under the default settings [99]. SequenceMatrix was then used for the concatenation [100], with gaps as missing data. After that, two approaches were chosen for phylogenetic analysis: maximum likelihood (ML) and Bayesian inference (BI).
The ML trees were inferred by RAxML 8.2.12 [101]. Fifty runs and one thousand bootstrap replicates were executed under the models identified by PartitionFinder v.2.1.1 with the “-raxml” command line [102]. We also checked the convergence of each node by the “-I autoMRE” option. For BI analysis, the best models for the dataset were determined by ModelTest-NG [103]. Two simultaneous runs with four Markov chains each were run for 10 million generations (sampling every 100 generations), and Tracer 1.7.1 was used to assess the convergence [104].
5. Conclusions
In the context of the controversial intrageneric relationships within Bletilla, this study newly sequenced plastomes from four species of Bletilla, and performed comparative analyses among them. Interestingly, our results reveal considerable plastomic differences between B. sinensis and the other three taxa in many aspects. Most importantly, the specific features of the IR junction patterns, novel pttRNA structures and codon aversion motifs can serve as useful molecular markers for Bletilla. Furthermore, at the tribe level, the variable region of plastomic tRNALeu-UAA and IR boundaries showed important phylogenetic implications for Arethuseae. Additionally, our phylogenetic analyses based on the two datasets, covering 36 species and 49 taxa of Arethuseae, respectively, suggested the non-monophyly of Bletilla with strong support. The convincing molecular evidence reported herein will provide novel potential markers for species identification, and achieve a more profound understanding for the evolution of Bletilla and Arethuseae.
Supplementary Materials
The following are available online at https://www.mdpi.com/article/10.3390/ijms231710151/s1.
Author Contributions
Conceived and designed the experiments, X.K.; data curation, R.W. and X.H.; formal analysis, S.H.; investigation, C.W.; software, S.Z.; writing—original draft preparation, S.H.; writing—review and editing, X.K. All authors have read and agreed to the published version of the manuscript.
Funding
This research was funded by The Scientific Research Project of Anhui Provincial Department of Education, grant number KJ2021ZD0148.
Institutional Review Board Statement
Not applicable.
Informed Consent Statement
Not applicable.
Data Availability Statement
The four plastomes’ sequences data generated in this study are available in GenBank of the National Center for Biotechnology Information (NCBI) (https://www.ncbi.nl-m.nih.gov/nuccore, accessed on 29 July 2022) under the access numbers: OP104328-OP104330, and MT806143.
Acknowledgments
The authors would like to thank Jianke Yang for the investigation, Ran Yi for the contributions in data analyses, and the anonymous reviewers for their critical reviews and helpful suggestions.
Conflicts of Interest
The authors declare no conflict of interest. The funders had no role in the design of the study; in the collection, analyses, or interpretation of data; in the writing of the manuscript, or in the decision to publish the results.
References
- Antonelli, A.; Smith, R.; Fry, C.; Simmonds, M.S.; Kersey, P.J.; Pritchard, H.; Abbo, M.; Acedo, C.; Adams, J.; Ainsworth, A. State of the World’s Plants and Fungi 2020; Royal Botanic Gardens (Kew): London, UK, 2020. [Google Scholar]
- Christenhusz, M.J.; Byng, J.W. The number of known plants species in the world and its annual increase. Phytotaxa 2016, 261, 201–217. [Google Scholar] [CrossRef]
- Chase, M.; Cameron, K.; Hills, H.; Jarrell, D. Molecular systematics of the Orchidaceae and other lilioid monocots. In Proceedings of the 14th World Orchid Conference; Pridgeon, A.M., Ed.; HMSO, Edinburgh: London, UK, 1994; pp. 61–73. [Google Scholar]
- Freudenstein, J.V.; Chase, M.W. Phylogenetic relationships in Epidendroideae (Orchidaceae), one of the great flowering plant radiations: Progressive specialization and diversification. Ann. Bot. 2015, 115, 665–681. [Google Scholar] [CrossRef] [PubMed]
- Goldman, D.H.; Freudenstein, J.V.; Kores, P.J.; Molvray, M.; Jarrell, D.C.; Whitten, W.M.; Cameron, K.M.; Jansen, R.K.; Chase, M.W. Phylogenetics of Arethuseae (Orchidaceae) based on plastid matK and rbcL sequences. Syst. Bot. 2001, 26, 670–695. [Google Scholar]
- Kim, Y.-K.; Jo, S.; Cheon, S.-H.; Joo, M.-J.; Hong, J.-R.; Kwak, M.; Kim, K.-J. Plastome evolution and phylogeny of Orchidaceae, with 24 new sequences. Front. Plant Sci. 2020, 11, 22. [Google Scholar] [CrossRef]
- Neyland, R.; Urbatsch, L.E. Phylogeny of subfamily Epidendroideae (Orchidaceae) inferred from ndhF chloroplast gene sequences. Am. J. Bot. 1996, 83, 1195–1206. [Google Scholar] [CrossRef]
- van den Berg, C.; Goldman, D.H.; Freudenstein, J.V.; Pridgeon, A.M.; Cameron, K.M.; Chase, M.W. An overview of the phylogenetic relationships within Epidendroideae inferred from multiple DNA regions and recircumscription of Epidendreae and Arethuseae (Orchidaceae). Am. J. Bot. 2005, 92, 613–624. [Google Scholar] [CrossRef]
- Chase, M.W.; Cameron, K.M.; Freudenstein, J.V.; Pridgeon, A.M.; Salazar, G.; Van den Berg, C.; Schuiteman, A. An updated classification of Orchidaceae. Bot. J. Linn. Soc. 2015, 177, 151–174. [Google Scholar] [CrossRef]
- Dressler, R.L. Phylogeny and Classification of the Orchid Family; Cambridge University Press: Cambridge, UK, 1993. [Google Scholar]
- Lindley, J. Orchidearum Sceletos, Commisit Johannes Lindley; Typis Ricardi Taylor: London, UK, 1826. [Google Scholar]
- Dressler, R.L. The Orchids: Natural History and Classification; Harvard University Press: Cambridge, MA, USA, 1981. [Google Scholar]
- Jiang, S.; Wang, M.; Jiang, L.; Xie, Q.; Yuan, H.; Yang, Y.; Zafar, S.; Liu, Y.; Jian, Y.; Li, B. The medicinal uses of the genus Bletilla in traditional Chinese medicine: A phytochemical and pharmacological review. J. Ethnopharmacol 2021, 280, 114263. [Google Scholar] [CrossRef]
- Lanjouw, J. International Code of Botanical Nomenclature Adopted by the Ninth International Botanical Congress; International Bureau for Plant Taxonomy & Nomenclature of the International Association for Plant Taxonomy: Utrecht, The Netherlands, 1961. [Google Scholar]
- Tan, K.W. The systematic status of the genus Bletilla (Orchidaceae). Brittonia 1969, 21, 202–214. [Google Scholar] [CrossRef]
- Schlechter, R. Das system der orchidaceen. Not. Bot. Gart. Berl.-Dahl. 1926, 9, 563–591. [Google Scholar] [CrossRef]
- Mansfeld, R. Üeber das System der Orchidaceae. Blumea Suppl. 1937, 29, 25–37. [Google Scholar]
- Huang, W.-C.; Liu, Z.-J.; Jiang, K.; Luo, Y.-B.; Jin, X.-H.; Zhang, Z.; Xu, R.-H.; Muchuku, J.K.; Musungwa, S.S.; Yukawa, T.; et al. Phylogenetic analysis and character evolution of tribe Arethuseae (Orchidaceae) reveal a new genus Mengzia. Mol. Phylogenet. Evol. 2022, 167, 107362. [Google Scholar] [CrossRef]
- Li, L.; Ye, D.-P.; Niu, M.; Yan, H.-F.; Wen, T.-L.; Li, S.-J. Thuniopsis: A new orchid genus and phylogeny of the tribe Arethuseae (Orchidaceae). PLoS ONE 2015, 10, e0132777. [Google Scholar] [CrossRef]
- Feng, H.; Cao, T.; Xu, H.; Liu, Y.; Han, Y.; Sun, W.; Liu, Y. Characterization of the complete chloroplast genome of Bletilla striata (Orchidaceae: Bletilla), the herb in China. Mitochondrial DNA B 2019, 4, 3542–3543. [Google Scholar] [CrossRef]
- Daniell, H.; Lin, C.-S.; Yu, M.; Chang, W.-J. Chloroplast genomes: Diversity, evolution, and applications in genetic engineering. Genome Biol. 2016, 17, 134. [Google Scholar] [CrossRef] [PubMed]
- Ren, T.; Yang, Y.; Zhou, T.; Liu, Z.-L. Comparative plastid genomes of Primula species: Sequence divergence and phylogenetic relationships. Int. J. Mol. Sci. 2018, 19, 1050. [Google Scholar] [CrossRef]
- Hong, Z.; Wu, Z.; Zhao, K.; Yang, Z.; Zhang, N.; Guo, J.; Tembrock, L.R.; Xu, D. Comparative analyses of five complete chloroplast genomes from the genus Pterocarpus (Fabacaeae). Int. J. Mol. Sci. 2020, 21, 3758. [Google Scholar] [CrossRef]
- Li, P.; Lou, G.; Cai, X.; Zhang, B.; Cheng, Y.; Wang, H. Comparison of the complete plastomes and the phylogenetic analysis of Paulownia species. Sci. Rep. 2020, 10, 2225. [Google Scholar] [CrossRef]
- Pacheco, T.G.; Lopes, A.d.S.; Welter, J.F.; Yotoko, K.S.C.; Otoni, W.C.; Vieira, L.d.N.; Guerra, M.P.; Nodari, R.O.; Balsanelli, E.; Pedrosa, F.d.O. Plastome sequences of the subgenus Passiflora reveal highly divergent genes and specific evolutionary features. Plant Mol. Biol. 2020, 104, 21–37. [Google Scholar] [CrossRef]
- Chen, S.; Wang, T.; Shu, J.; Xiang, Q.; Yang, T.; Zhang, X.; Yan, Y. Plastid Phylogenomics and Plastomic Diversity of the Extant Lycophytes. Genes 2022, 13, 1280. [Google Scholar] [CrossRef]
- Dalla Costa, T.P.; Silva, M.C.; de Santana Lopes, A.; Gomes Pacheco, T.; de Oliveira, J.D.; de Baura, V.A.; Balsanelli, E.; Maltempi de Souza, E.; de Oliveira Pedrosa, F.; Rogalski, M. The plastome of Melocactus glaucescens Buining & Brederoo reveals unique evolutionary features and loss of essential tRNA genes. Planta 2022, 255, 57. [Google Scholar] [PubMed]
- Han, S.; Bi, D.; Yi, R.; Ding, H.; Wu, L.; Kan, X. Plastome evolution of Aeonium and Monanthes (Crassulaceae): Insights into the variation of plastomic tRNAs, and the patterns of codon usage and aversion. Planta 2022, 256, 35. [Google Scholar] [CrossRef] [PubMed]
- Shahzadi, I.; Abdullah; Mehmood, F.; Ali, Z.; Ahmed, I.; Mirza, B. Chloroplast genome sequences of Artemisia maritima and Artemisia absinthium: Comparative analyses, mutational hotspots in genus Artemisia and phylogeny in family Asteraceae. Genomics 2020, 112, 1454–1463. [Google Scholar] [CrossRef] [PubMed]
- Liu, L.; Wang, Y.; He, P.; Li, P.; Lee, J.; Soltis, D.E.; Fu, C. Chloroplast genome analyses and genomic resource development for epilithic sister genera Oresitrophe and Mukdenia (Saxifragaceae), using genome skimming data. BMC Genom. 2018, 19, 235. [Google Scholar] [CrossRef] [PubMed]
- Henriquez, C.L.; Abdullah; Ahmed, I.; Carlsen, M.M.; Zuluaga, A.; Croat, T.B.; McKain, M.R. Molecular evolution of chloroplast genomes in Monsteroideae (Araceae). Planta 2020, 251, 72. [Google Scholar] [CrossRef]
- Wang, N.; Dong, W.L.; Zhang, X.J.; Zhou, T.; Huang, X.J.; Li, B.G.; Liu, J.N.; Ma, X.F.; Li, Z.H. Evolutionary characteristics and phylogeny of cotton chloroplast tRNAs. Planta 2021, 254, 116. [Google Scholar] [CrossRef]
- Mohanta, T.K.; Syed, A.S.; Ameen, F.; Bae, H. Novel Genomic and Evolutionary Perspective of Cyanobacterial tRNAs. Front. Genet. 2017, 8, 200. [Google Scholar] [CrossRef]
- Iriarte, A.; Lamolle, G.; Musto, H. Codon Usage Bias: An Endless Tale. J. Mol. Evol. 2021, 89, 589–593. [Google Scholar] [CrossRef]
- Leffler, E.M.; Bullaughey, K.; Matute, D.R.; Meyer, W.K.; Segurel, L.; Venkat, A.; Andolfatto, P.; Przeworski, M. Revisiting an old riddle: What determines genetic diversity levels within species? PLoS Biol. 2012, 10, e1001388. [Google Scholar] [CrossRef]
- Parvathy, S.T.; Udayasuriyan, V.; Bhadana, V. Codon usage bias. Mol. Biol. Rep. 2021, 49, 539–565. [Google Scholar] [CrossRef]
- Yang, J.; Ding, H.; Kan, X. Codon usage patterns and evolution of HSP60 in birds. Int. J. Biol. Macromol. 2021, 183, 1002–1012. [Google Scholar] [CrossRef]
- Zhou, J.; Ding, Y.; He, Y.; Chu, Y.; Zhao, P.; Ma, L.; Wang, X.; Li, X.; Liu, Y. The effect of multiple evolutionary selections on synonymous codon usage of genes in the Mycoplasma bovis genome. PLoS ONE 2014, 9, e108949. [Google Scholar] [CrossRef] [Green Version]
- Yadav, M.K.; Swati, D. Comparative genome analysis of six malarial parasites using codon usage bias based tools. Bioinformation 2012, 8, 1230–1239. [Google Scholar] [CrossRef]
- Sheng, J.; She, X.; Liu, X.; Wang, J.; Hu, Z. Comparative analysis of codon usage patterns in chloroplast genomes of five Miscanthus species and related species. PeerJ 2021, 9, e12173. [Google Scholar] [CrossRef]
- Chen, S.L.; Lee, W.; Hottes, A.K.; Shapiro, L.; McAdams, H.H. Codon usage between genomes is constrained by genome-wide mutational processes. Proc. Natl. Acad. Sci. USA 2004, 101, 3480–3485. [Google Scholar] [CrossRef]
- Liu, Q.; Feng, Y.; Xue, Q. Analysis of factors shaping codon usage in the mitochondrion genome of Oryza sativa. Mitochondrion 2004, 4, 313–320. [Google Scholar] [CrossRef]
- Bulmer, M. Are codon usage patterns in unicellular organisms determined by selection-mutation balance? J. Evol. Biol. 1988, 1, 15–26. [Google Scholar] [CrossRef]
- Duret, L.; Mouchiroud, D. Expression pattern and, surprisingly, gene length shape codon usage in Caenorhabditis, Drosophila, and Arabidopsis. Proc. Natl. Acad. Sci. USA 1999, 96, 4482–4487. [Google Scholar] [CrossRef]
- Cutter, A.D.; Charlesworth, B. Selection intensity on preferred codons correlates with overall codon usage bias in Caenorhabditis remanei. Curr. Biol. 2006, 16, 2053–2057. [Google Scholar] [CrossRef]
- Hanson, G.; Coller, J. Codon optimality, bias and usage in translation and mRNA decay. Nat. Rev. Mol. Cell Biol. 2018, 19, 20–30. [Google Scholar] [CrossRef]
- Radhakrishnan, A.; Chen, Y.-H.; Martin, S.; Alhusaini, N.; Green, R.; Coller, J. The DEAD-box protein Dhh1p couples mRNA decay and translation by monitoring codon optimality. Cell 2016, 167, 122–132. e129. [Google Scholar] [CrossRef]
- Presnyak, V.; Alhusaini, N.; Chen, Y.-H.; Martin, S.; Morris, N.; Kline, N.; Olson, S.; Weinberg, D.; Baker, K.E.; Graveley, B.R.; et al. Codon optimality is a major determinant of mRNA stability. Cell 2015, 160, 1111–1124. [Google Scholar] [CrossRef] [Green Version]
- Miller, J.B.; Hippen, A.A.; Belyeu, J.R.; Whiting, M.F.; Ridge, P.G. Missing something? Codon aversion as a new character system in phylogenetics. Cladistics 2017, 33, 545–556. [Google Scholar] [CrossRef]
- Miller, J.B.; McKinnon, L.M.; Whiting, M.F.; Ridge, P.G. CAM: An alignment-free method to recover phylogenies using codon aversion motifs. PeerJ 2019, 7, e6984. [Google Scholar] [CrossRef]
- Clegg, M.T.; Zurawski, G. Chloroplast DNA and the study of plant phylogeny: Present status and future prospects. In Molecular Systematics of Plants; Soltis, P.S., Soltis, D.E., Doyle, J.J., Eds.; Springer: New York, NY, USA, 1992; pp. 1–13. [Google Scholar]
- Downie, S.R.; Palmer, J.D. Use of chloroplast DNA rearrangements in reconstructing plant phylogeny. In Molecular Systematics of Plants; Soltis, P.S., Soltis, D.E., Doyle, J.J., Eds.; Springer: New York, NY, USA, 1992; pp. 14–35. [Google Scholar]
- Zhai, W.; Duan, X.; Zhang, R.; Guo, C.; Li, L.; Xu, G.; Shan, H.; Kong, H.; Ren, Y. Chloroplast genomic data provide new and robust insights into the phylogeny and evolution of the Ranunculaceae. Mol. Phylogenet. Evol. 2019, 135, 12–21. [Google Scholar] [CrossRef]
- Wang, R.-J.; Cheng, C.-L.; Chang, C.-C.; Wu, C.-L.; Su, T.-M.; Chaw, S.-M. Dynamics and evolution of the inverted repeat-large single copy junctions in the chloroplast genomes of monocots. BMC Evol. Biol. 2008, 8, 36. [Google Scholar] [CrossRef]
- Liu, H.; Su, Z.; Yu, S.; Liu, J.; Yin, X.; Zhang, G.; Liu, W.; Li, B. Genome Comparison Reveals Mutation Hotspots in the Chloroplast Genome and Phylogenetic Relationships of Ormosia Species. Biomed Res. Int. 2019, 2019, 7265030. [Google Scholar] [CrossRef]
- Masood, M.S.; Nishikawa, T.; Fukuoka, S.-i.; Njenga, P.K.; Tsudzuki, T.; Kadowaki, K.-i. The complete nucleotide sequence of wild rice (Oryza nivara) chloroplast genome: First genome wide comparative sequence analysis of wild and cultivated rice. Gene 2004, 340, 133–139. [Google Scholar] [CrossRef]
- Huang, H.; Shi, C.; Liu, Y.; Mao, S.-Y.; Gao, L.-Z. Thirteen Camelliachloroplast genome sequences determined by high-throughput sequencing: Genome structure and phylogenetic relationships. BMC Evol. Biol. 2014, 14, 151. [Google Scholar] [CrossRef]
- Wu, C.-S.; Chaw, S.-M. Evolutionary stasis in cycad plastomes and the first case of plastome GC-biased gene conversion. Genome Biol. Evol. 2015, 7, 2000–2009. [Google Scholar] [CrossRef]
- Garaycochea, S.; Speranza, P.; Alvarez-Valin, F. A strategy to recover a high-quality, complete plastid sequence from low-coverage whole-genome sequencing. Appl. Plant Sci. 2015, 3, 1500022. [Google Scholar] [CrossRef]
- Shaw, J.; Lickey, E.B.; Schilling, E.E.; Small, R.L. Comparison of whole chloroplast genome sequences to choose noncoding regions for phylogenetic studies in angiosperms: The tortoise and the hare III. Am. J. Bot. 2007, 94, 275–288. [Google Scholar] [CrossRef] [Green Version]
- Perry, A.S.; Wolfe, K.H. Nucleotide substitution rates in legume chloroplast DNA depend on the presence of the inverted repeat. J. Mol. Evol. 2002, 55, 501–508. [Google Scholar] [CrossRef] [PubMed]
- Birky, C.W., Jr.; Walsh, J. Biased gene conversion, copy number, and apparent mutation rate differences within chloroplast and bacterial genomes. Genetics 1992, 130, 677–683. [Google Scholar] [CrossRef]
- Li, F.-W.; Kuo, L.-Y.; Pryer, K.M.; Rothfels, C.J. Genes translocated into the plastid inverted repeat show decelerated substitution rates and elevated GC content. Genome Biol. Evol. 2016, 8, 2452–2458. [Google Scholar] [CrossRef]
- Dong, W.; Liu, J.; Yu, J.; Wang, L.; Zhou, S. Highly variable chloroplast markers for evaluating plant phylogeny at low taxonomic levels and for DNA barcoding. PLoS ONE 2012, 7, e35071. [Google Scholar] [CrossRef]
- Sobreiro, M.B.; Vieira, L.D.; Nunes, R.; Novaes, E.; Coissac, E.; Silva-Junior, O.B.; Grattapaglia, D.; Collevatti, R.G. Chloroplast genome assembly of Handroanthus impetiginosus: Comparative analysis and molecular evolution in Bignoniaceae. Planta 2020, 252, 91. [Google Scholar] [CrossRef]
- Zhang, J.; Huang, H.; Qu, C.; Meng, X.; Meng, F.; Yao, X.; Wu, J.; Guo, X.; Han, B.; Xing, S. Comprehensive analysis of chloroplast genome of Albizia julibrissin Durazz.(Leguminosae sp.). Planta 2022, 255, 26. [Google Scholar] [CrossRef]
- Wu, L.; Cui, Y.; Wang, Q.; Xu, Z.; Wang, Y.; Lin, Y.; Song, J.; Yao, H. Identification and phylogenetic analysis of five Crataegus species (Rosaceae) based on complete chloroplast genomes. Planta 2021, 254, 14. [Google Scholar] [CrossRef]
- Jansen, R.K.; Kaittanis, C.; Saski, C.; Lee, S.-B.; Tomkins, J.; Alverson, A.J.; Daniell, H. Phylogenetic analyses of Vitis (Vitaceae) based on complete chloroplast genome sequences: Effects of taxon sampling and phylogenetic methods on resolving relationships among rosids. BMC Evol. Biol. 2006, 6, 32. [Google Scholar] [CrossRef]
- Zhao, Y.-H.; Zhou, T.; Wang, J.-X.; Li, Y.; Fang, M.-F.; Liu, J.-N.; Li, Z.-H. Evolution and structural variations in chloroplast tRNAs in gymnosperms. BMC Genom. 2021, 22, 750. [Google Scholar] [CrossRef] [PubMed]
- Zhong, Q.Y.; Fu, X.G.; Zhang, T.T.; Zhou, T.; Yue, M.; Liu, J.N.; Li, Z.H. Phylogeny and evolution of chloroplast tRNAs in Adoxaceae. Ecol. Evol. 2021, 11, 1294–1309. [Google Scholar] [CrossRef] [PubMed]
- Brennan, T.; Sundaralingam, M. Structure, of transfer RNA molecules containing the long variable loop. Nucleic Acids Res. 1976, 3, 3235–3252. [Google Scholar] [CrossRef]
- Dock-Bregeon, A.C.; Westhof, E.; Giege, R.; Moras, D. Solution structure of a tRNA with a large variable region: Yeast tRNASer. J. Mol. Biol. 1989, 206, 707–722. [Google Scholar] [CrossRef]
- Sun, F.J.; Caetano-Anollés, G. The evolutionary significance of the long variable arm in transfer RNA. Complexity 2009, 14, 26–39. [Google Scholar] [CrossRef]
- Akashi, H. Synonymous codon usage in Drosophila melanogaster: Natural selection and translational accuracy. Genetics 1994, 136, 927–935. [Google Scholar] [CrossRef]
- Wei, L.; He, J.; Jia, X.; Qi, Q.; Liang, Z.; Zheng, H.; Ping, Y.; Liu, S.; Sun, J. Analysis of codon usage bias of mitochondrial genome in Bombyx moriand its relation to evolution. BMC Evol. Biol. 2014, 14, 262. [Google Scholar] [CrossRef]
- Osawa, S.; Ohama, T.; Yamao, F.; Muto, A.; Jukes, T.H.; Ozeki, H.; Umesono, K. Directional mutation pressure and transfer RNA in choice of the third nucleotide of synonymous two-codon sets. Proc. Natl. Acad. Sci. USA 1988, 85, 1124–1128. [Google Scholar] [CrossRef]
- Fedorov, A.; Saxonov, S.; Gilbert, W. Regularities of context-dependent codon bias in eukaryotic genes. Nucleic Acids Res. 2002, 30, 1192–1197. [Google Scholar] [CrossRef]
- Zhang, R.; Zhang, L.; Wang, W.; Zhang, Z.; Du, H.; Qu, Z.; Li, X.-Q.; Xiang, H. Differences in codon usage bias between photosynthesis-related genes and genetic system-related genes of chloroplast genomes in cultivated and wild solanum species. Int. J. Mol. Sci. 2018, 19, 3142. [Google Scholar] [CrossRef]
- Chamani Mohasses, F.; Solouki, M.; Ghareyazie, B.; Fahmideh, L.; Mohsenpour, M. Correlation between gene expression levels under drought stress and synonymous codon usage in rice plant by in-silico study. PLoS ONE 2020, 15, e0237334. [Google Scholar] [CrossRef] [PubMed]
- Sueoka, N. Directional mutation pressure and neutral molecular evolution. Proc. Natl. Acad. Sci. USA 1988, 85, 2653–2657. [Google Scholar] [CrossRef] [PubMed] [Green Version]
- Tang, D.; Wei, F.; Cai, Z.; Wei, Y.; Khan, A.; Miao, J.; Wei, K. Analysis of codon usage bias and evolution in the chloroplast genome of Mesona chinensis Benth. Dev. Genes Evol. 2021, 231, 1–9. [Google Scholar] [CrossRef] [PubMed]
- Zhou, Z.; Dang, Y.; Zhou, M.; Li, L.; Yu, C.-H.; Fu, J.; Chen, S.; Liu, Y. Codon usage is an important determinant of gene expression levels largely through its effects on transcription. Proc. Natl. Acad. Sci. USA 2016, 113, E6117–E6125. [Google Scholar] [CrossRef]
- Hershberg, R.; Petrov, D.A. Selection on codon bias. Annu. Rev. Genet. 2008, 42, 287–299. [Google Scholar] [CrossRef]
- Miller, J.B.; McKinnon, L.M.; Whiting, M.F.; Ridge, P.G. Codon use and aversion is largely phylogenetically conserved across the tree of life. Mol. Phylogenet. Evol. 2020, 144, 106697. [Google Scholar] [CrossRef]
- Miller, J.B.; Whiting, M.F.; Kauwe, J.S.; Ridge, P.G. How Codon Usage Bias Affects Our Ability to Recover the Tree of Life. J Phylogenetics Evol Biol. 2021, 9, 1. [Google Scholar]
- Murray, M.G.; Thompson, W.F. Rapid isolation of high molecular weight plant DNA. Nucleic Acids Res. 1980, 8, 4321–4325. [Google Scholar] [CrossRef]
- Andrews, S. FastQC: A Quality Control Tool for High Throughput Sequence Data. Available online: http://www.bioinformatics.babraham.ac.uk/projects/fastqc/ (accessed on 10 January 2017).
- Chen, S.; Zhou, Y.; Chen, Y.; Gu, J. fastp: An ultra-fast all-in-one FASTQ preprocessor. Bioinformatics 2018, 34, i884–i890. [Google Scholar] [CrossRef]
- Jin, J.-J.; Yu, W.-B.; Yang, J.-B.; Song, Y.; DePamphilis, C.W.; Yi, T.-S.; Li, D.-Z. GetOrganelle: A fast and versatile toolkit for accurate de novo assembly of organelle genomes. Genome Biol. 2020, 21, 241. [Google Scholar] [CrossRef]
- Cai, Z.; Wang, H.; Wang, G. Complete chloroplast genome sequence of Bletilla striata (Thunb.) Reichb. f., a Chinese folk medicinal plant. Mitochondrial DNA B 2020, 5, 2239–2240. [Google Scholar] [CrossRef] [PubMed]
- Tillich, M.; Lehwark, P.; Pellizzer, T.; Ulbricht-Jones, E.S.; Fischer, A.; Bock, R.; Greiner, S. GeSeq–versatile and accurate annotation of organelle genomes. Nucleic Acids Res. 2017, 45, W6–W11. [Google Scholar] [CrossRef] [PubMed]
- Chan, P.P.; Lin, B.Y.; Mak, A.J.; Lowe, T.M. tRNAscan-SE 2.0: Improved detection and functional classification of transfer RNA genes. Nucleic Acids Res. 2021, 49, 9077–9096. [Google Scholar] [CrossRef]
- Johnson, M.; Zaretskaya, I.; Raytselis, Y.; Merezhuk, Y.; McGinnis, S.; Madden, T.L. NCBI BLAST: A better web interface. Nucleic Acids Res. 2008, 36, W5–W9. [Google Scholar] [CrossRef]
- Zheng, S.; Poczai, P.; Hyvönen, J.; Tang, J.; Amiryousefi, A. Chloroplot: An online program for the versatile plotting of organelle genomes. Front. Genet. 2020, 11, 1123. [Google Scholar] [CrossRef]
- Hall, T.; Biosciences, I.; Carlsbad, C. BioEdit: An important software for molecular biology. GERF Bull. BioSci. 2011, 2, 60–61. [Google Scholar]
- Peden, J.F. Analysis of Codon Usage. Ph.D. Thesis, University of Nottingham, Nottingham, UK, 2000. [Google Scholar]
- Sharp, P.M.; Li, W.-H. An evolutionary perspective on synonymous codon usage in unicellular organisms. J. Mol. Evol. 1986, 24, 28–38. [Google Scholar] [CrossRef]
- Wright, F. The ‘effective number of codons’ used in a gene. Gene 1990, 87, 23–29. [Google Scholar] [CrossRef]
- Katoh, K.; Standley, D.M. MAFFT multiple sequence alignment software version 7: Improvements in performance and usability. Mol. Biol. Evol. 2013, 30, 772–780. [Google Scholar] [CrossRef]
- Vaidya, G.; Lohman, D.J.; Meier, R. SequenceMatrix: Concatenation software for the fast assembly of multi-gene datasets with character set and codon information. Cladistics 2011, 27, 171–180. [Google Scholar] [CrossRef] [PubMed]
- Stamatakis, A. RAxML version 8: A tool for phylogenetic analysis and post-analysis of large phylogenies. Bioinformatics 2014, 30, 1312–1313. [Google Scholar] [CrossRef] [PubMed]
- Lanfear, R.; Frandsen, P.B.; Wright, A.M.; Senfeld, T.; Calcott, B. PartitionFinder 2: New methods for selecting partitioned models of evolution for molecular and morphological phylogenetic analyses. Mol. Biol. Evol. 2017, 34, 772–773. [Google Scholar] [CrossRef] [PubMed]
- Darriba, D.; Posada, D.; Kozlov, A.M.; Stamatakis, A.; Morel, B.; Flouri, T. ModelTest-NG: A new and scalable tool for the selection of DNA and protein evolutionary models. Mol. Biol. Evol. 2020, 37, 291–294. [Google Scholar] [CrossRef] [PubMed]
- Rambaut, A.; Drummond, A.J.; Xie, D.; Baele, G.; Suchard, M.A. Posterior summarization in Bayesian phylogenetics using Tracer 1.7. Syst. Biol. 2018, 67, 901–904. [Google Scholar] [CrossRef] [Green Version]
Figure 1.
Chloroplast genome map of 4 Bletilla species. Directed with arrows, genes that are listed inside and outside of the circle are transcribed clockwise and counterclockwise, respectively. Genes are color-coded by their functional classification, with pseudogenes marked with asterisks. The GC content of the genome is depicted as the proportion of the shaded parts of each section.

Figure 2.
Contraction and expansion comparison of the junctions among 4 Bletilla plastomes. Blue, orange and green blocks represent the LSC, IR and SSC regions, respectively. Gene boxes represented above the block were transcribed clockwise and those represented below the block were transcribed clockwise. The base pairs (bp) number labeled within scale bars above the gene boxes indicate the extent of the integration between the junction region. The number 1, 2, and 3 above the branches represented different nodes, respectively.

Figure 3.
The HPR analyses among the plastomes of different groups. (a) The nucleotide diversity of the complete chloroplast genomes based on the comparison of group A (shown left the Y axis) and group B (shown right the Y axis), respectively. (b) The HPRs possessed by the two groups were shown in the Circoletto plot. The width of line reflected the region size, and the color is based on the BLASTn score: (i) group A; (ii) group B.

Figure 4.
The novel putative pttRNAs structures in 4 Bletilla species. Specific locations of new structures were highlighted with color-coded nucleotides: (a) tRNAIle-GAU; (b) tRNALeu-CAA; (c) tRNALeu-UAA; (d) tRNALeu-UAG; (e) tRNAMet-CAU; (f) tRNAArg-ACG; (g) tRNASer-GCU; (h) tRNASer-GGA; (i) tRNASer-UGA; (j) tRNAThr-UGU; (k) tRNATyr-GUA; and (l) tRNAGln-UUG (only in B. sinensis).

Figure 5.
Three types of pttRNA were found to be different between B. sinensis and the other three Bletilla species: (a) B. formosana, B. ochracea and B. striata; and (b) B. sinensis.
Figure 5.
Three types of pttRNA were found to be different between B. sinensis and the other three Bletilla species: (a) B. formosana, B. ochracea and B. striata; and (b) B. sinensis.

Figure 6.
The species-specific codon aversion motifs of ndhA and rps11 gene for the 5 investigated plastomes. The dots that were marked, respectively, in different colors, represent specific species.
Figure 6.
The species-specific codon aversion motifs of ndhA and rps11 gene for the 5 investigated plastomes. The dots that were marked, respectively, in different colors, represent specific species.

Figure 7.
The phylogenetic tree of 36 Arethuseae species based on 79 plastomic PCGs using the maximum likelihood (ML) and Bayesian inference (BI) method. The bootstrap (BS) and Bayesian posterior probability (PP) values of each node were labeled (* denoted 100% bootstrap or 1.00 PP, with the omission of those <50% bootstrap or <0.5 PP).


Table 1.
The taxonomic history of Bletilla.
| Botanists | Taxonomic Status of Bletilla | |
|---|---|---|
| Bentham (1883) | Included within the genus Bletia Position: tribe Epidendreae, subtribe Bletieae | |
| Schlechter (1926) | As an individual genus associated with the genus Arethusa in the same subtribe (Bletia was placed in the subtribe Phajeae of tribe Kerosphaereae) Position: tribe Polychondreae, subtribe Bletilleae | |
| Mansfeld | Bletilla, Arethusa and Bletia were classified in the same tribe | |
| (1937, 1954) | Position: tribe Epidendreae | subtribe Bletillinae (including Bletilla and Arethusa) |
| subtribe Phaiinae (including Bletia) | ||
| Dressler | Bletilla, Arethusa and Bletia were classified in the same tribe | |
| (1981, 1993) | Position: tribe Arethuseae | subtribe Arethusinae (Arethusa) |
| subtribe Bletiinae (included Bletilla and Bletia) | ||
| Szlachetko (1995) | Bletilla and Bletia were classified in the same tribe (Arethusa was still placed in tribe Arethuseae) Position: tribe Bletiinae (including Bletilla and Bletia) | |
| Berg (2005) | Bletilla and Arethusa were classified in the same tribe (Bletia was placed in the subtribe Bletiinae of tribe Epidendreae) | |
| Until now | Position: tribe Arethuseae | subtribe Arethusinae (including Arethusa) |
| subtribe Coelogyninae (including Bletilla) | ||
Table 2.
Comparative analysis among the plastomic features of the species in this study.
| Species (Accession Number) | B. formosana (OP104328) | B. ochracea (OP104329) | B. striata (OP104330) | B. sinensis (MT806143) | |
|---|---|---|---|---|---|
| Size (base pair, bp) | Total | 160,022 | 160,168 | 159,484 | 156,942 |
| LSC | 87,636 | 87,746 | 87,114 | 86,289 | |
| IR | 26,801 | 26,809 | 26,793 | 26,202 | |
| SSC | 18,784 | 18,804 | 18,784 | 18,249 | |
| Number of genes | Total | 135 | 135 | 135 | 135 |
| PCGs | 86 | 86 | 86 | 86 | |
| tRNA | 38 | 38 | 38 | 38 | |
| rRNA | 8 | 8 | 8 | 8 | |
| Pseudo | 3 | 3 | 3 | 3 | |
| Intron-containing | 17 | 17 | 17 | 17 | |
| GC content (%) | Total | 37.2 | 37.2 | 37.2 | 37.2 |
| LSC | 35.1 | 35.0 | 35.0 | 35.0 | |
| IR | 43.2 | 43.2 | 43.2 | 43.2 | |
| SSC | 30.3 | 30.3 | 30.2 | 30.4 | |
| All genes | 39.7 | 39.8 | 39.7 | 39.7 | |
| CDS | 38.0 | 38.0 | 38.0 | 37.9 | |
| tRNA | 53.0 | 53.1 | 53.2 | 53.2 | |
| rRNA | 54.9 | 54.9 | 54.9 | 54.8 | |
Table 3.
The highly polymorphic regions identified in the plastomes of the two groups.
| Taxa | Region | Nucleotide Diversity | No. of Mutations | Region Length | |
|---|---|---|---|---|---|
| Group A | 1 | matK-trnK-UUU | 0.04243 | 199 | 1307 |
| 2 | trnS-GCU-trnG-GCC | 0.03875 | 93 | 965 | |
| 3 | petN-psbM-trnD-GUC | 0.04389 | 158 | 1127 | |
| 4 | trnE-UUC-trnT-GGU-psbD | 0.07028 | 253 | 1331 | |
| 5 | trnT-GGU-psbD | 0.03667 | 44 | 731 | |
| 6 | ndhC-trnV-UAC-trnM-CAU-atpE | 0.04194 | 50 | 1540 | |
| 7 | rbcL | 0.05880 | 203 | 1247 | |
| 8 | psbB-psbT | 0.04569 | 109 | 1078 | |
| 9 | petB | 0.05546 | 188 | 1130 | |
| 10 | ccsA-ndhD | 0.05944 | 353 | 1504 | |
| 11 | ndhD | 0.03764 | 89 | 857 | |
| 12 | ycf1 | 0.04000 | 48 | 621 | |
| Group B | 1 | psbA-matK | 0.00556 | 15 | 1000 |
| 2 | matK-trnK-UUU | 0.00612 | 33 | 1601 | |
| 3 | rps16-trnQ-UUG-psbK | 0.00556 | 10 | 845 | |
| 4 | trnS-GCU-trnG-GCC | 0.00667 | 18 | 1016 | |
| 5 | trnG-GCC-trnR-UCU-atpA | 0.00695 | 25 | 1205 | |
| 6 | trnT-GGU-psbD | 0.00556 | 5 | 609 | |
| 7 | atpB-rbcL | 0.00917 | 33 | 1257 | |
| 8 | psbH-petB | 0.01185 | 32 | 1009 | |
| 9 | rpoA-rps11-rpl36-infA | 0.00778 | 21 | 1000 | |
| 10 | rpl16 | 0.00741 | 20 | 1023 | |
| 11 | rps3-rpl22 | 0.00556 | 5 | 601 | |
| 12 | ccsA-ndhD | 0.00723 | 13 | 849 | |
| 13 | rps15-ycf1 | 0.00926 | 25 | 1000 | |
| 14 | trnN-GUU-trnR-ACG-rrn5-rrn4.5-rrn23 | 0.00630 | 17 | 1009 |
Table 4.
The highest and lowest 5% ENC values of 53 CDSs among the 5 investigated species.
| Bletilla formosana | Bletilla ochracea | Bletilla striata | Bletilla sinensis | Arundina graminifolia | ||||||
|---|---|---|---|---|---|---|---|---|---|---|
| Gene | ENC | Gene | ENC | Gene | ENC | Gene | ENC | Gene | ENC | |
| Low group | rps18 | 36.65 | rps18 | 36.65 | rps18 | 36.65 | rps18 | 38.16 | rps8 | 37.85 |
| rpl16 | 41.39 | rpl16 | 41.39 | psbD | 42.05 | rps8 | 40.80 | rps14 | 42.03 | |
| psbD | 42.05 | psbD | 42.05 | rpl16 | 42.20 | rpl16 | 41.67 | petD | 42.03 | |
| High group | clpP | 57.86 | clpP | 57.86 | clpP | 57.86 | ndhJ | 53.81 | ndhJ | 54.68 |
| ndhE | 59.50 | ndhE | 59.50 | ndhE | 59.50 | rps4 | 54.04 | clpP | 57.69 | |
| ycf3 | 60.75 | ycf3 | 60.75 | ycf3 | 60.75 | clpP | 60.36 | ndhE | 57.83 | |
Table 5.
The optimal codons of the 5 investigated species.
| Taxa | Optimal Codons | ||||
|---|---|---|---|---|---|
| B. formosana | GGU | UUG | UCC | CGU | |
| B. ochracea | GGU | UUG | UCC | CGU | |
| B. striata | GGU | UUG | UCC | CGU | |
| B. sinensis | GGU | CGA | |||
| A. graminifolia | GGU | CGA | UUG | UCC | |
Publisher’s Note: MDPI stays neutral with regard to jurisdictional claims in published maps and institutional affiliations. |
© 2022 by the authors. Licensee MDPI, Basel, Switzerland. This article is an open access article distributed under the terms and conditions of the Creative Commons Attribution (CC BY) license (https://creativecommons.org/licenses/by/4.0/).
Share and Cite
MDPI and ACS Style
Han, S.; Wang, R.; Hong, X.; Wu, C.; Zhang, S.; Kan, X. Plastomes of Bletilla (Orchidaceae) and Phylogenetic Implications. Int. J. Mol. Sci. 2022, 23, 10151. https://doi.org/10.3390/ijms231710151
AMA Style
Han S, Wang R, Hong X, Wu C, Zhang S, Kan X. Plastomes of Bletilla (Orchidaceae) and Phylogenetic Implications. International Journal of Molecular Sciences. 2022; 23(17):10151. https://doi.org/10.3390/ijms231710151
Chicago/Turabian StyleHan, Shiyun, Rongbin Wang, Xin Hong, Cuilian Wu, Sijia Zhang, and Xianzhao Kan. 2022. "Plastomes of Bletilla (Orchidaceae) and Phylogenetic Implications" International Journal of Molecular Sciences 23, no. 17: 10151. https://doi.org/10.3390/ijms231710151
Note that from the first issue of 2016, this journal uses article numbers instead of page numbers. See further details here.