
Chronic-Antibiotics Induced Gut Microbiota Dysbiosis Rescues Memory Impairment and Reduces β-Amyloid Aggregation in a Preclinical Alzheimer’s Disease Model

 ,
,  , and
, and 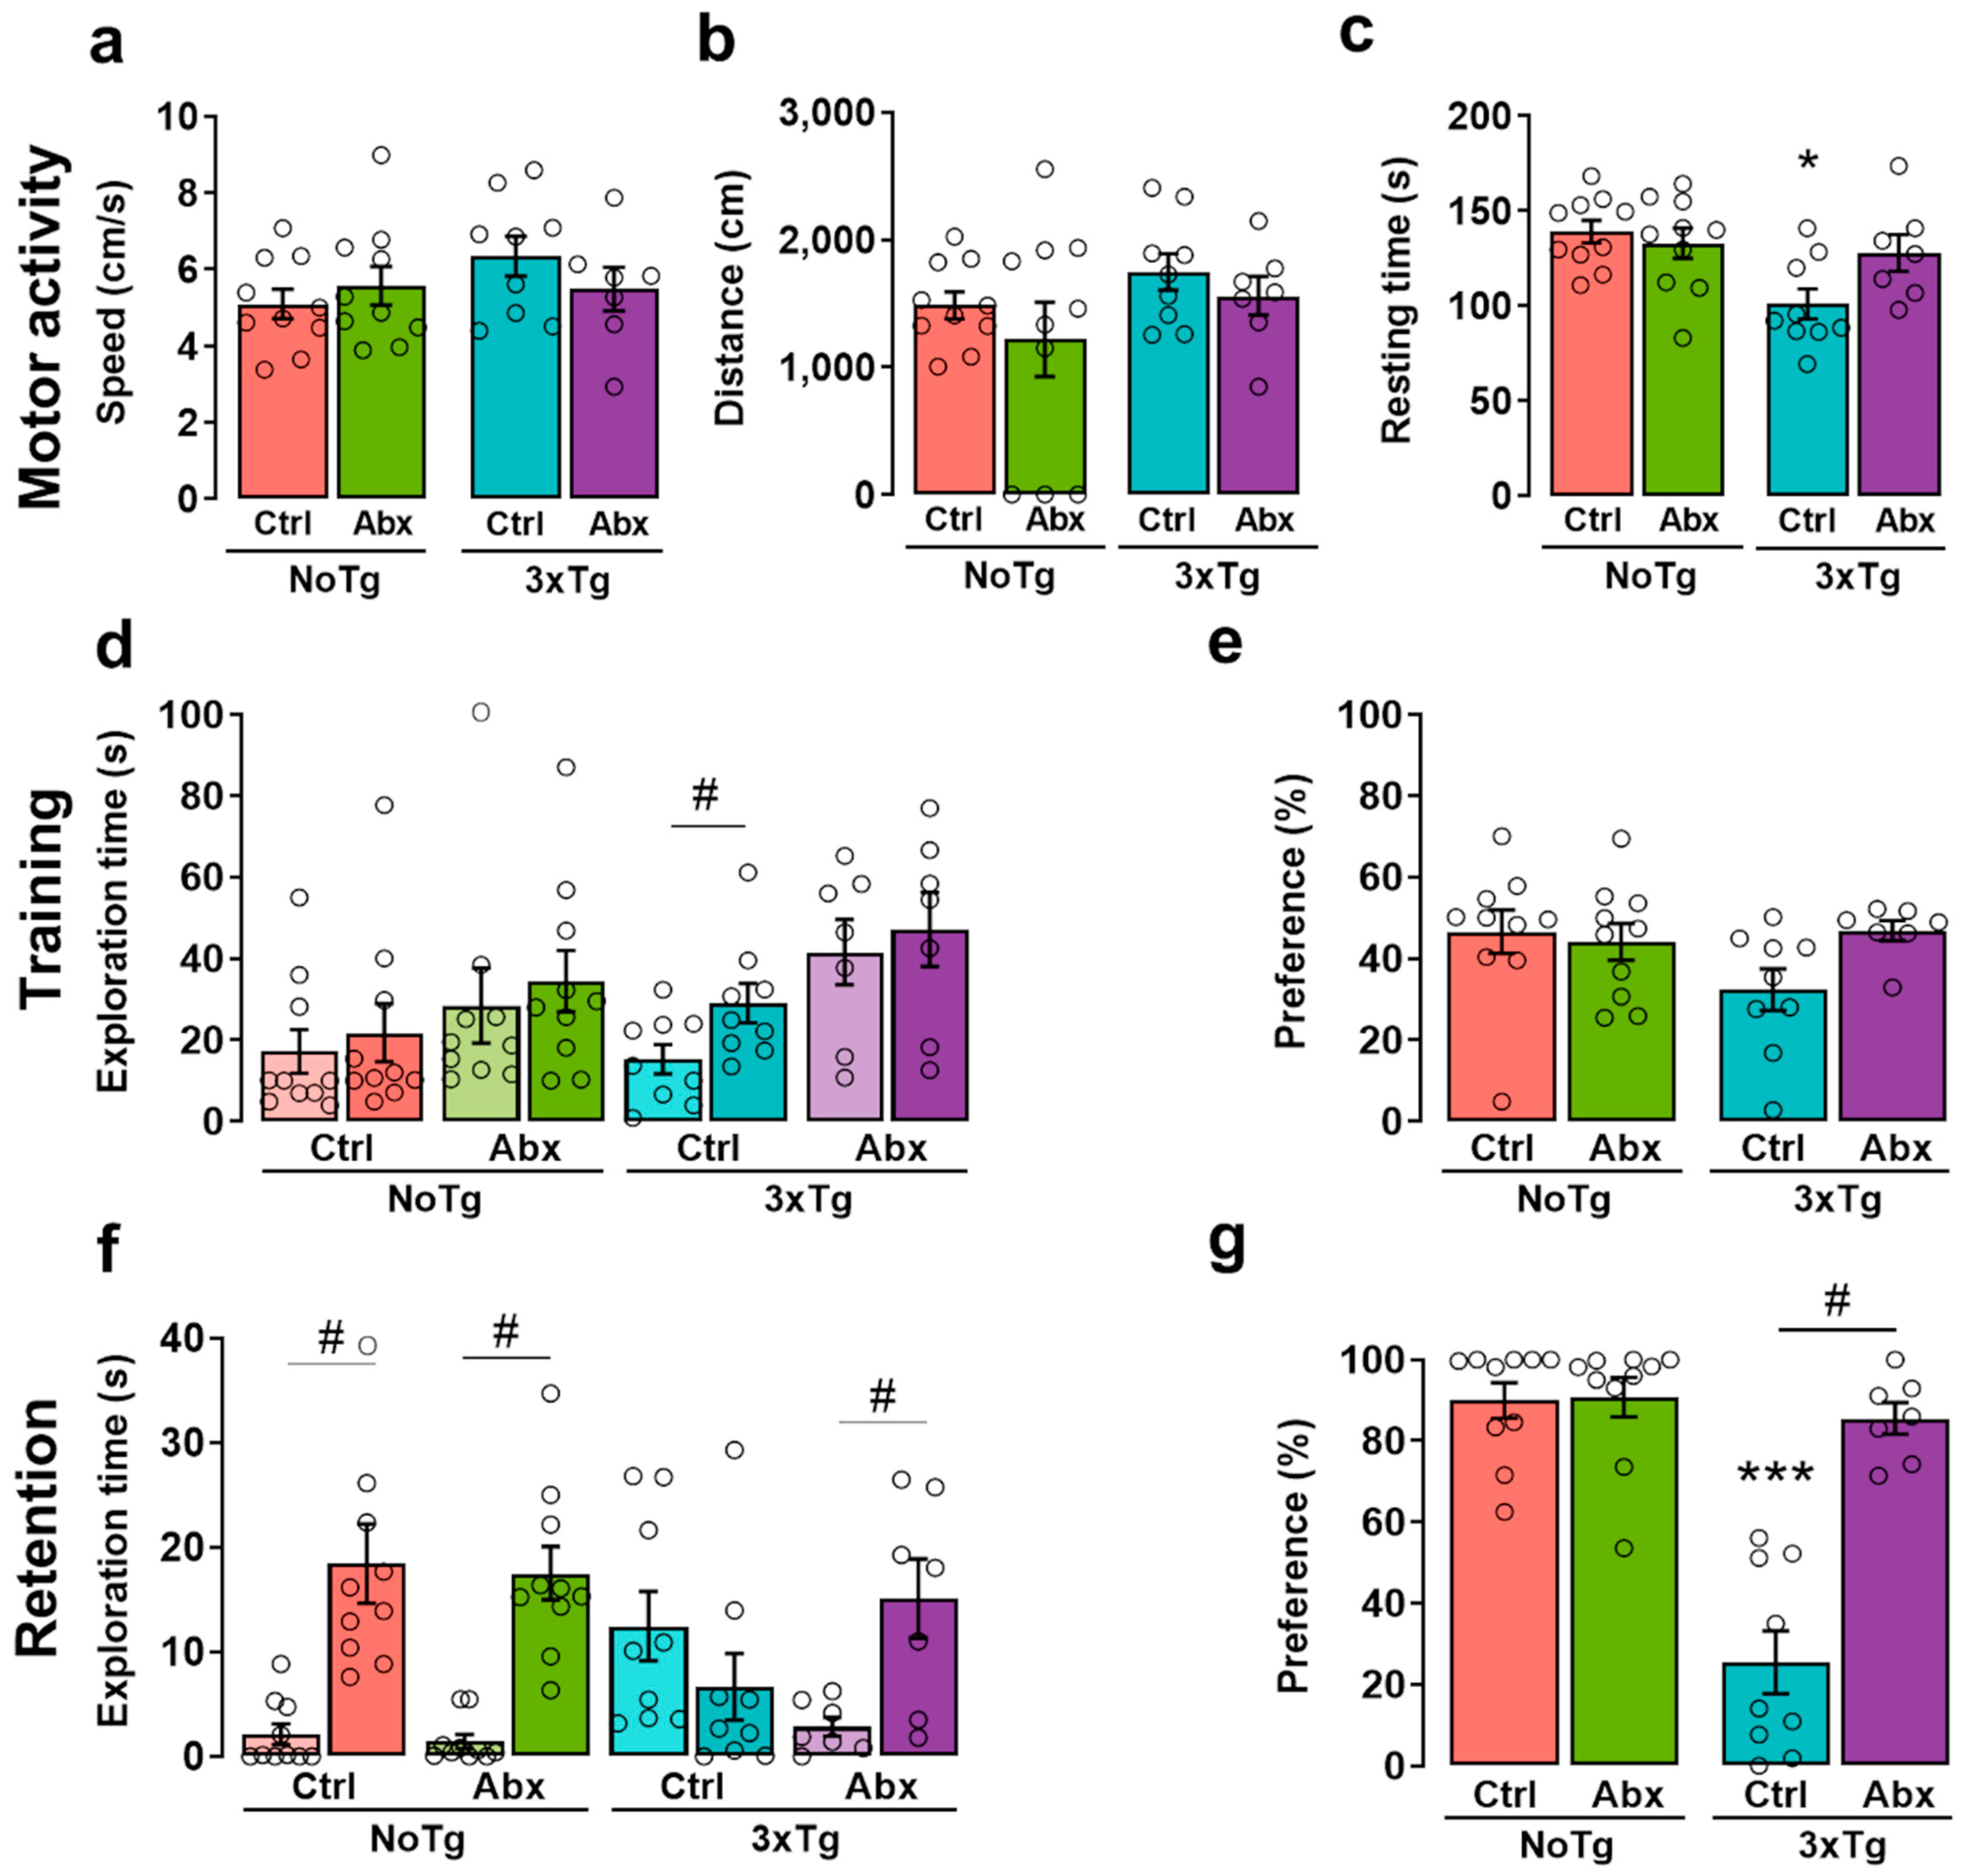
Abstract
:1. Introduction
2. Results
2.1. A Habituation Period for Abx Consumption Was Observed in Offspring after Weaning
2.2. Offspring Body Weight Was Affected by Abx Consumption
2.3. BGM Perturbation with Abx Produces a Delayed Motor Alteration in 3xTg
2.4. BGM Dysbiosis with Abx Attenuates NOL Memory Impairment in 3xTg Mice
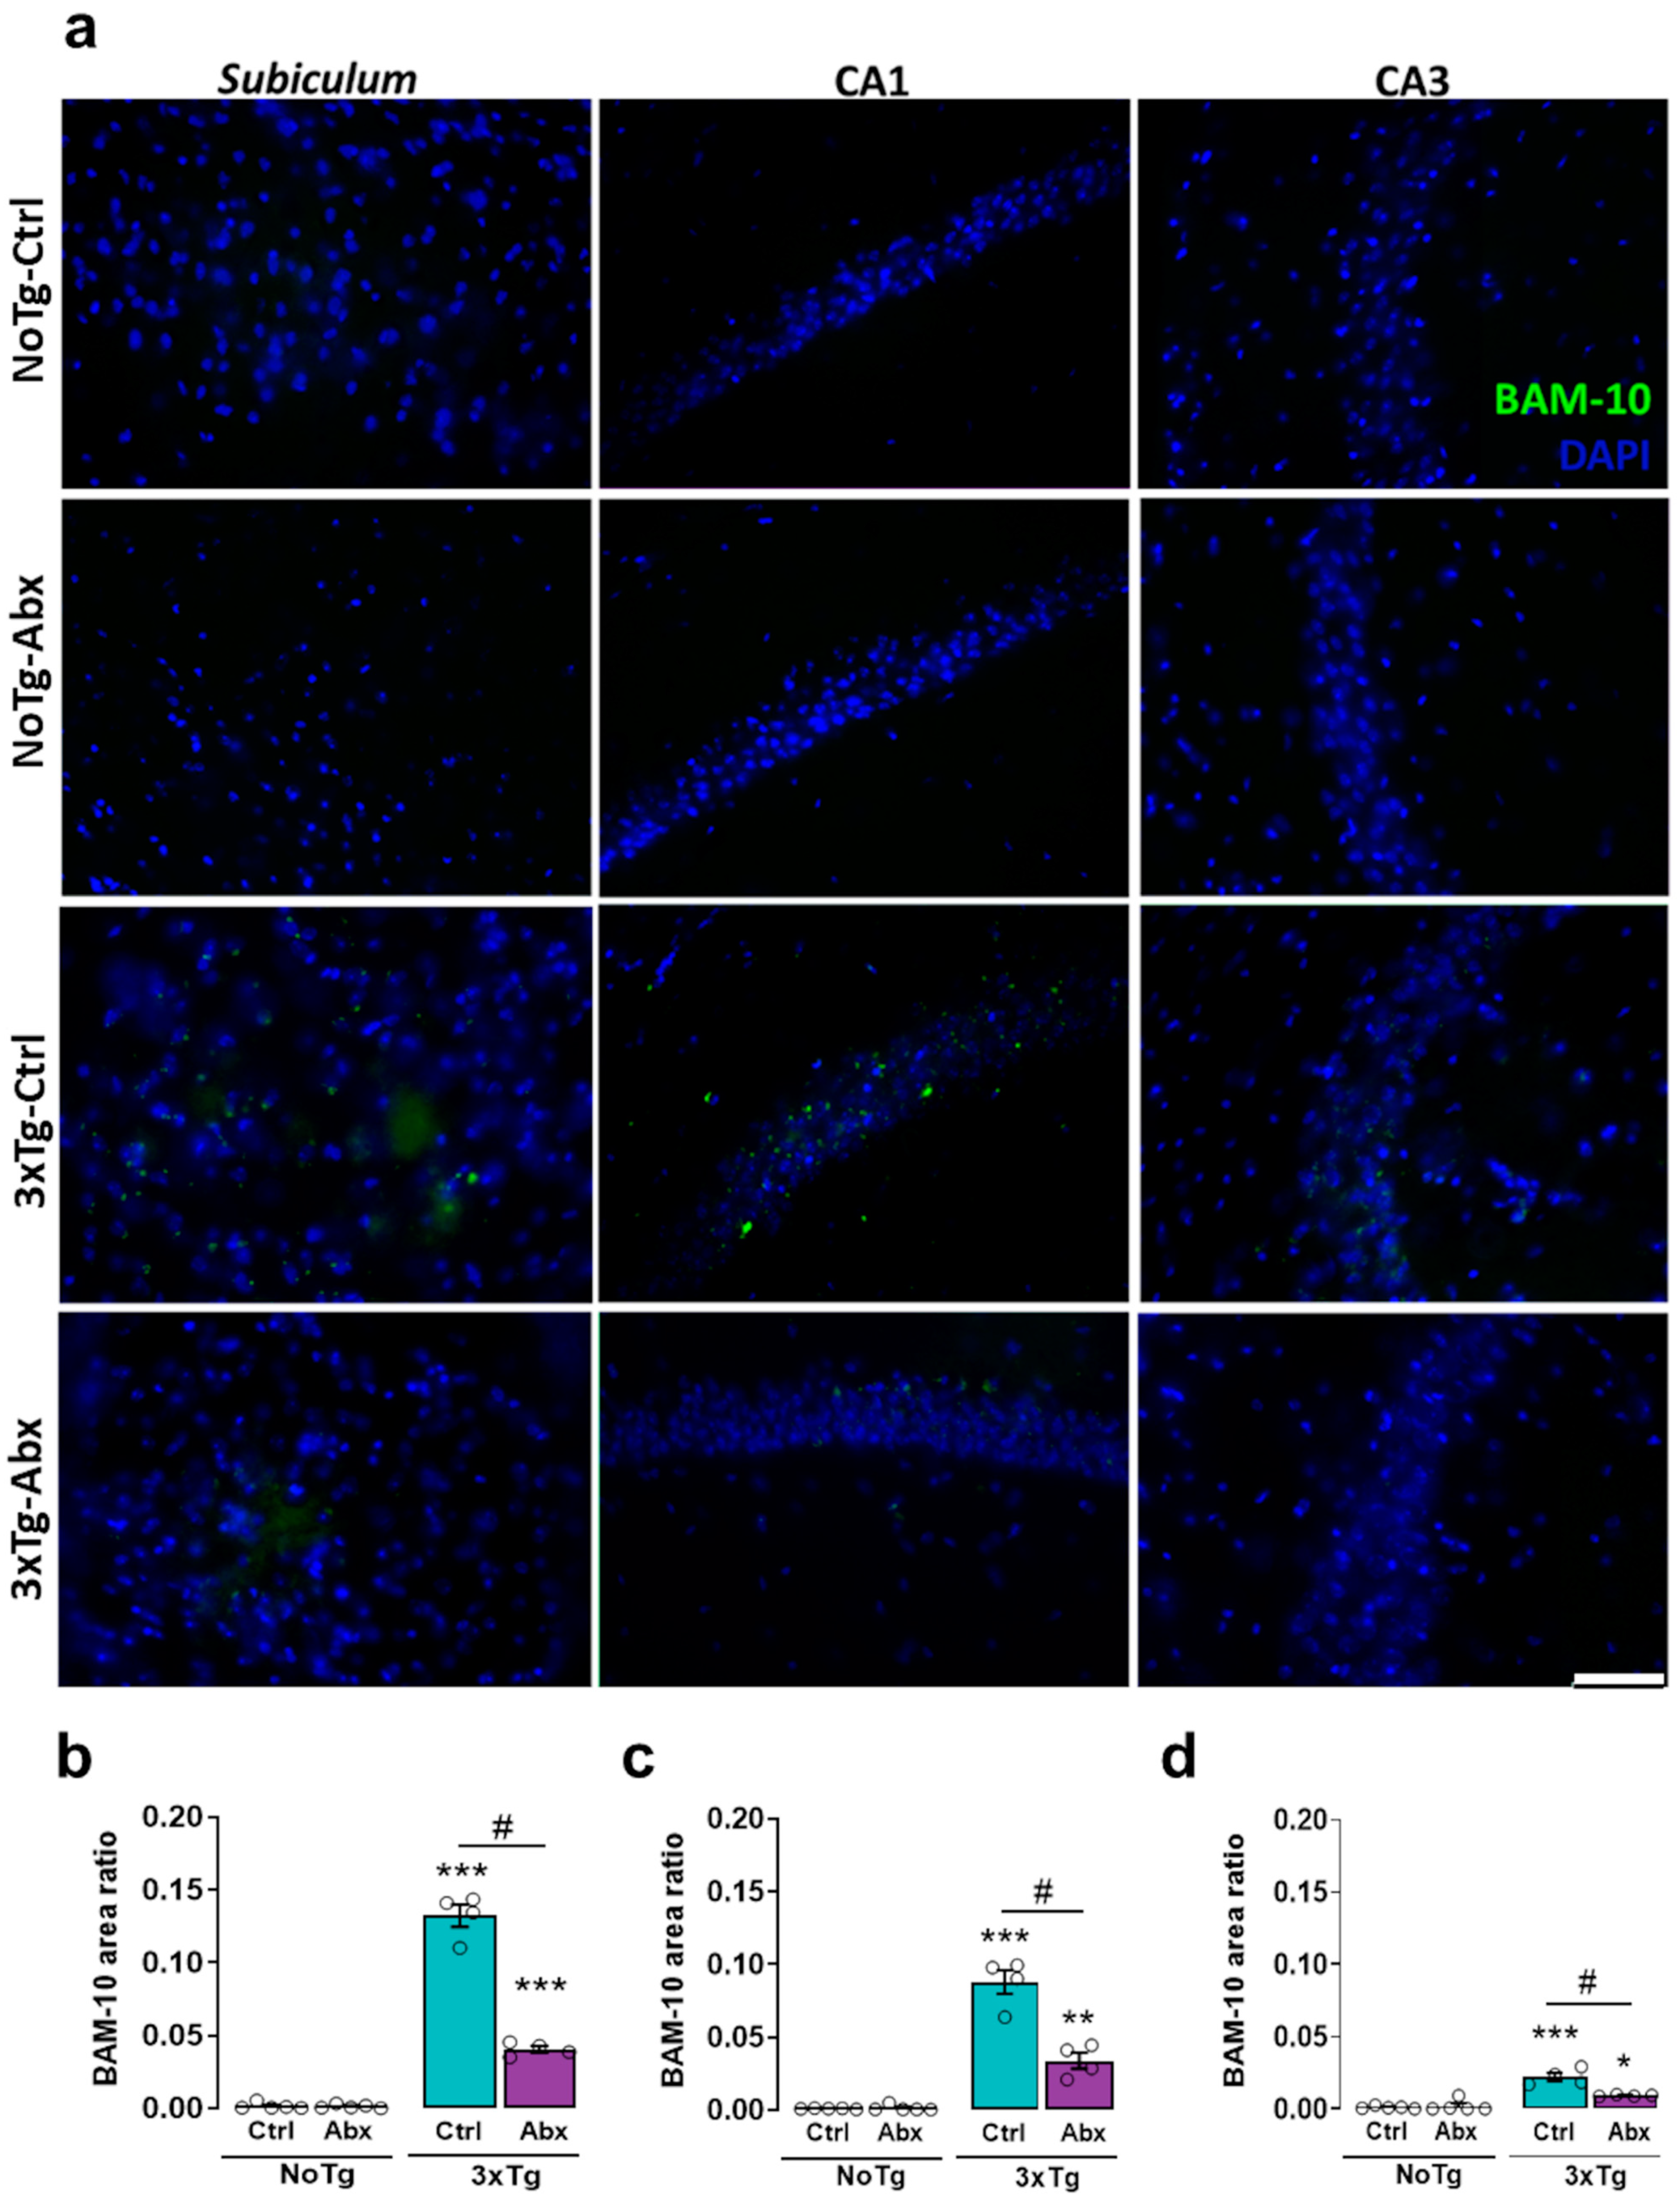
2.5. BGM Dysbiosis with Abx Treatment Attenuates Total Aβ in the Hippocampus of 3xTg Mice
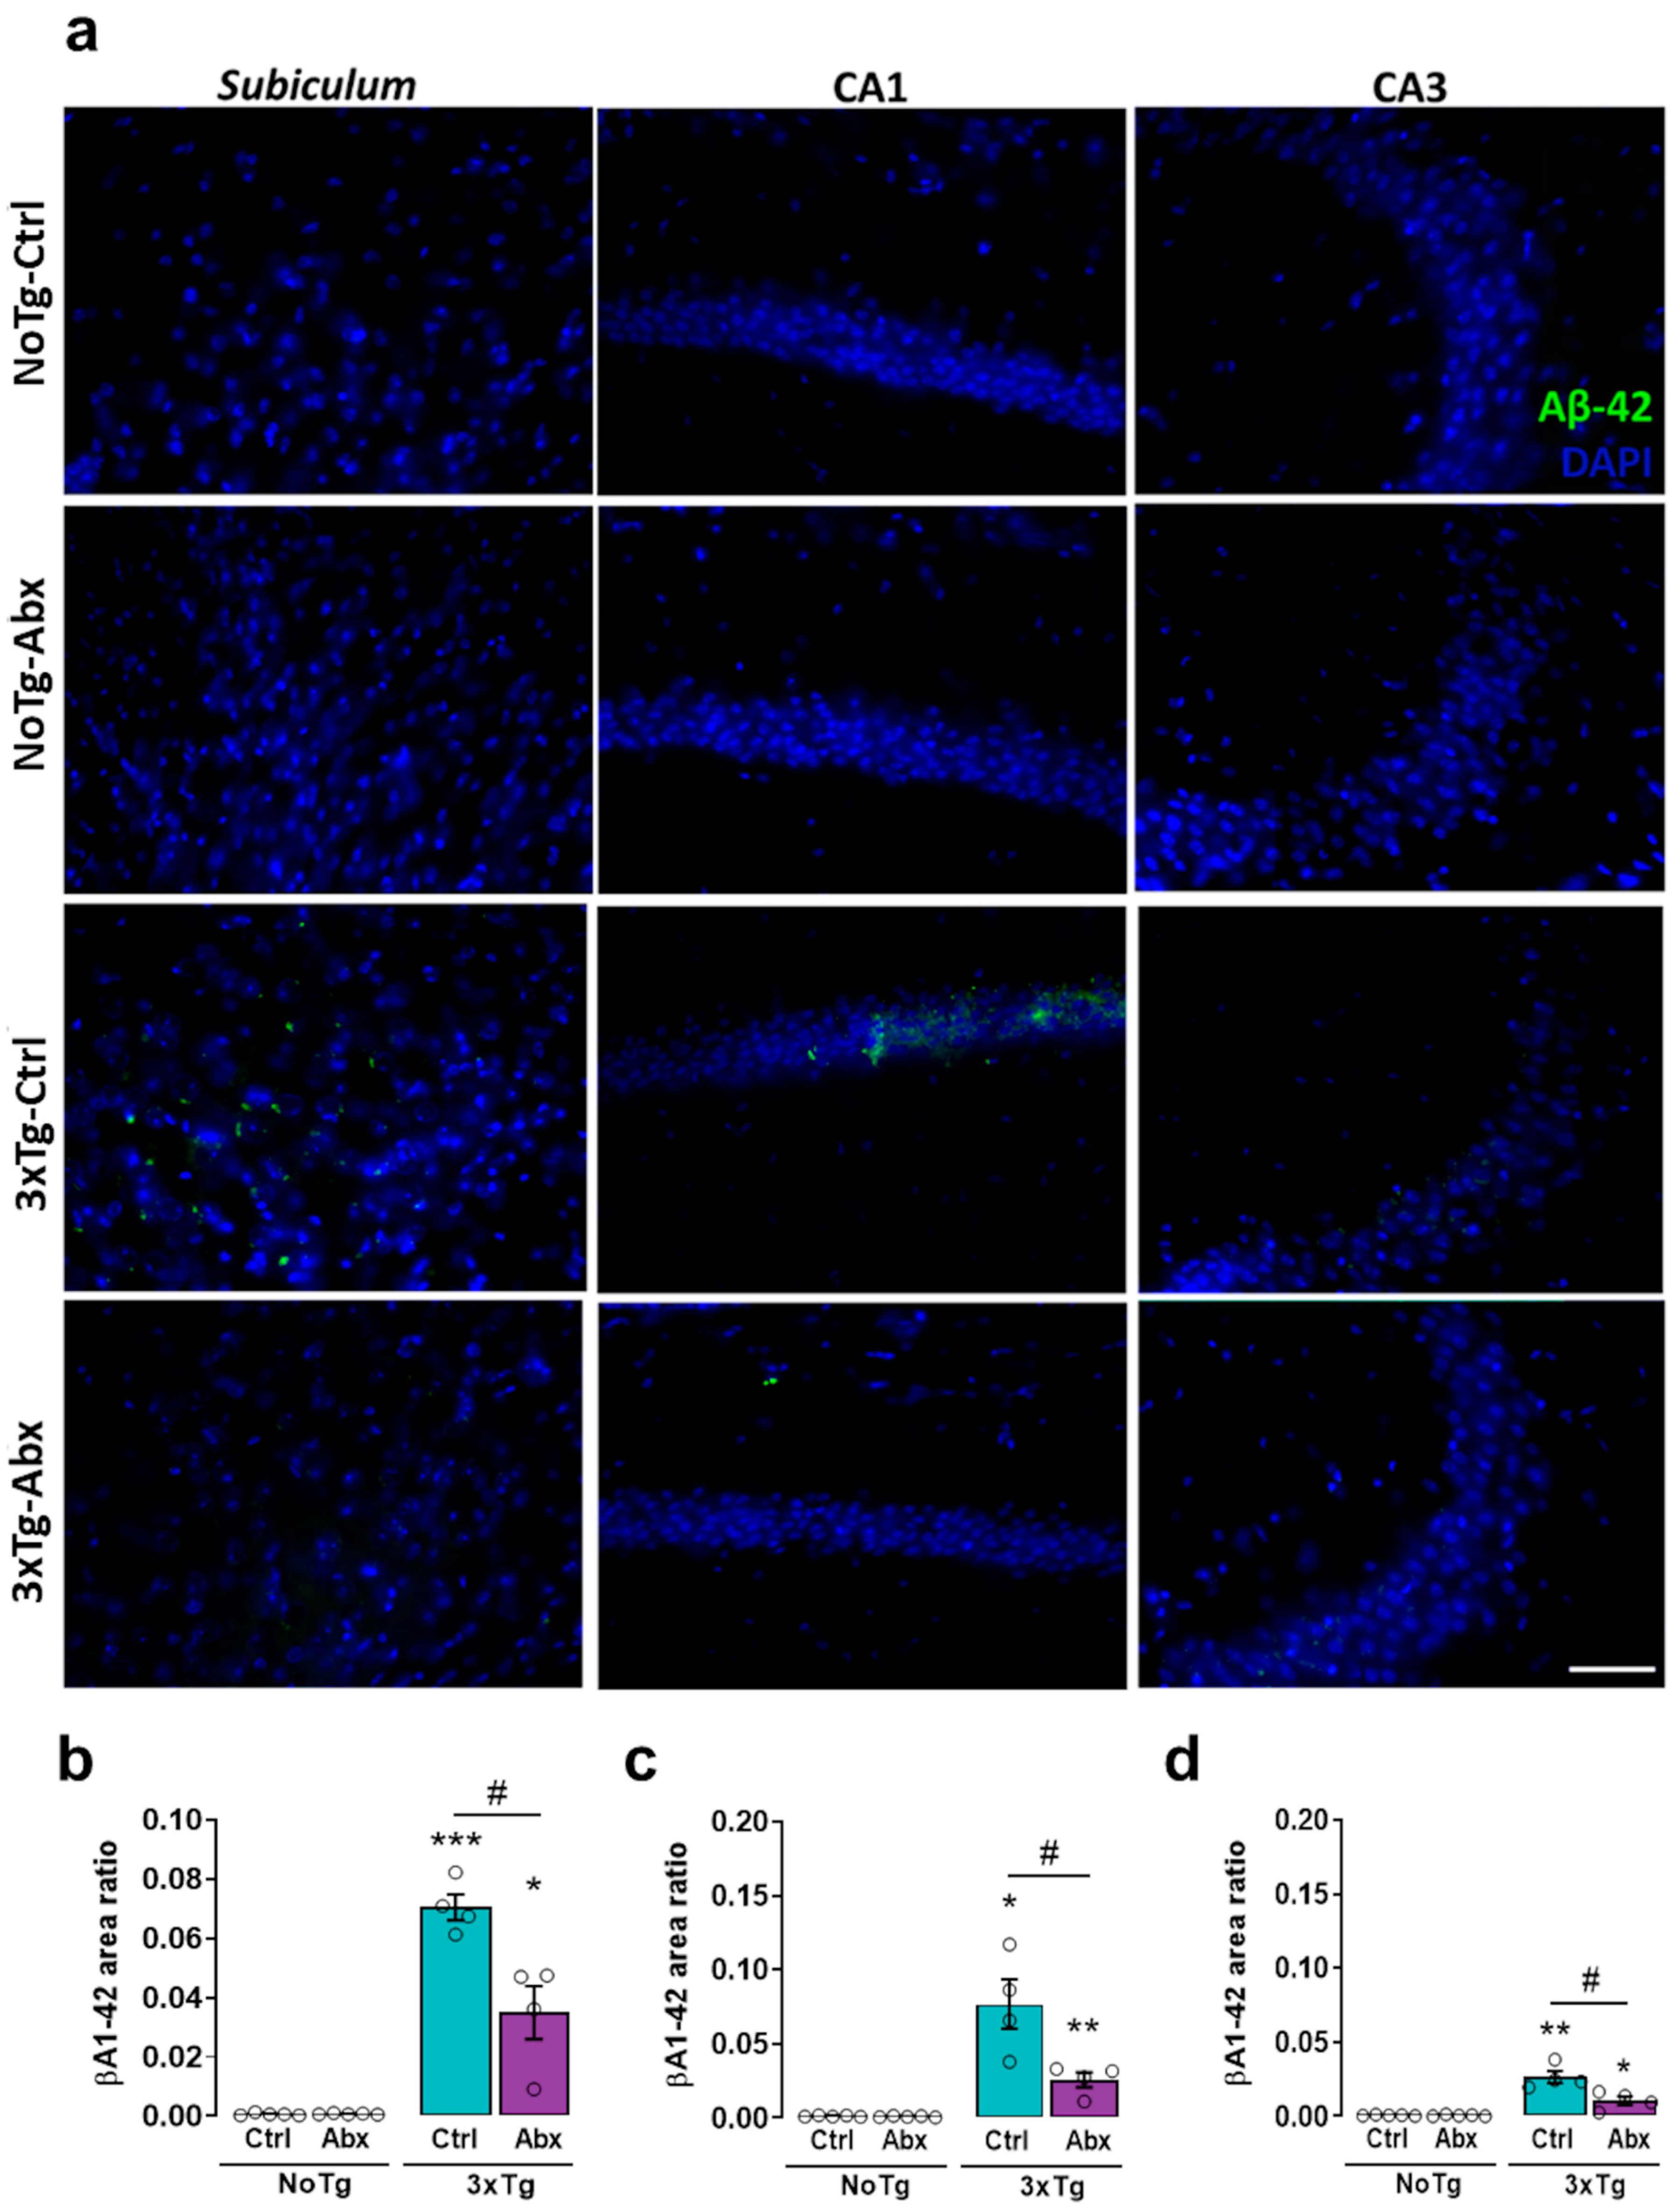
2.6. BGM DysbiosisDysbiosis with Abx Treatment Alleviates Aβ1-42 in the Hippocampus of 3xTg Mice
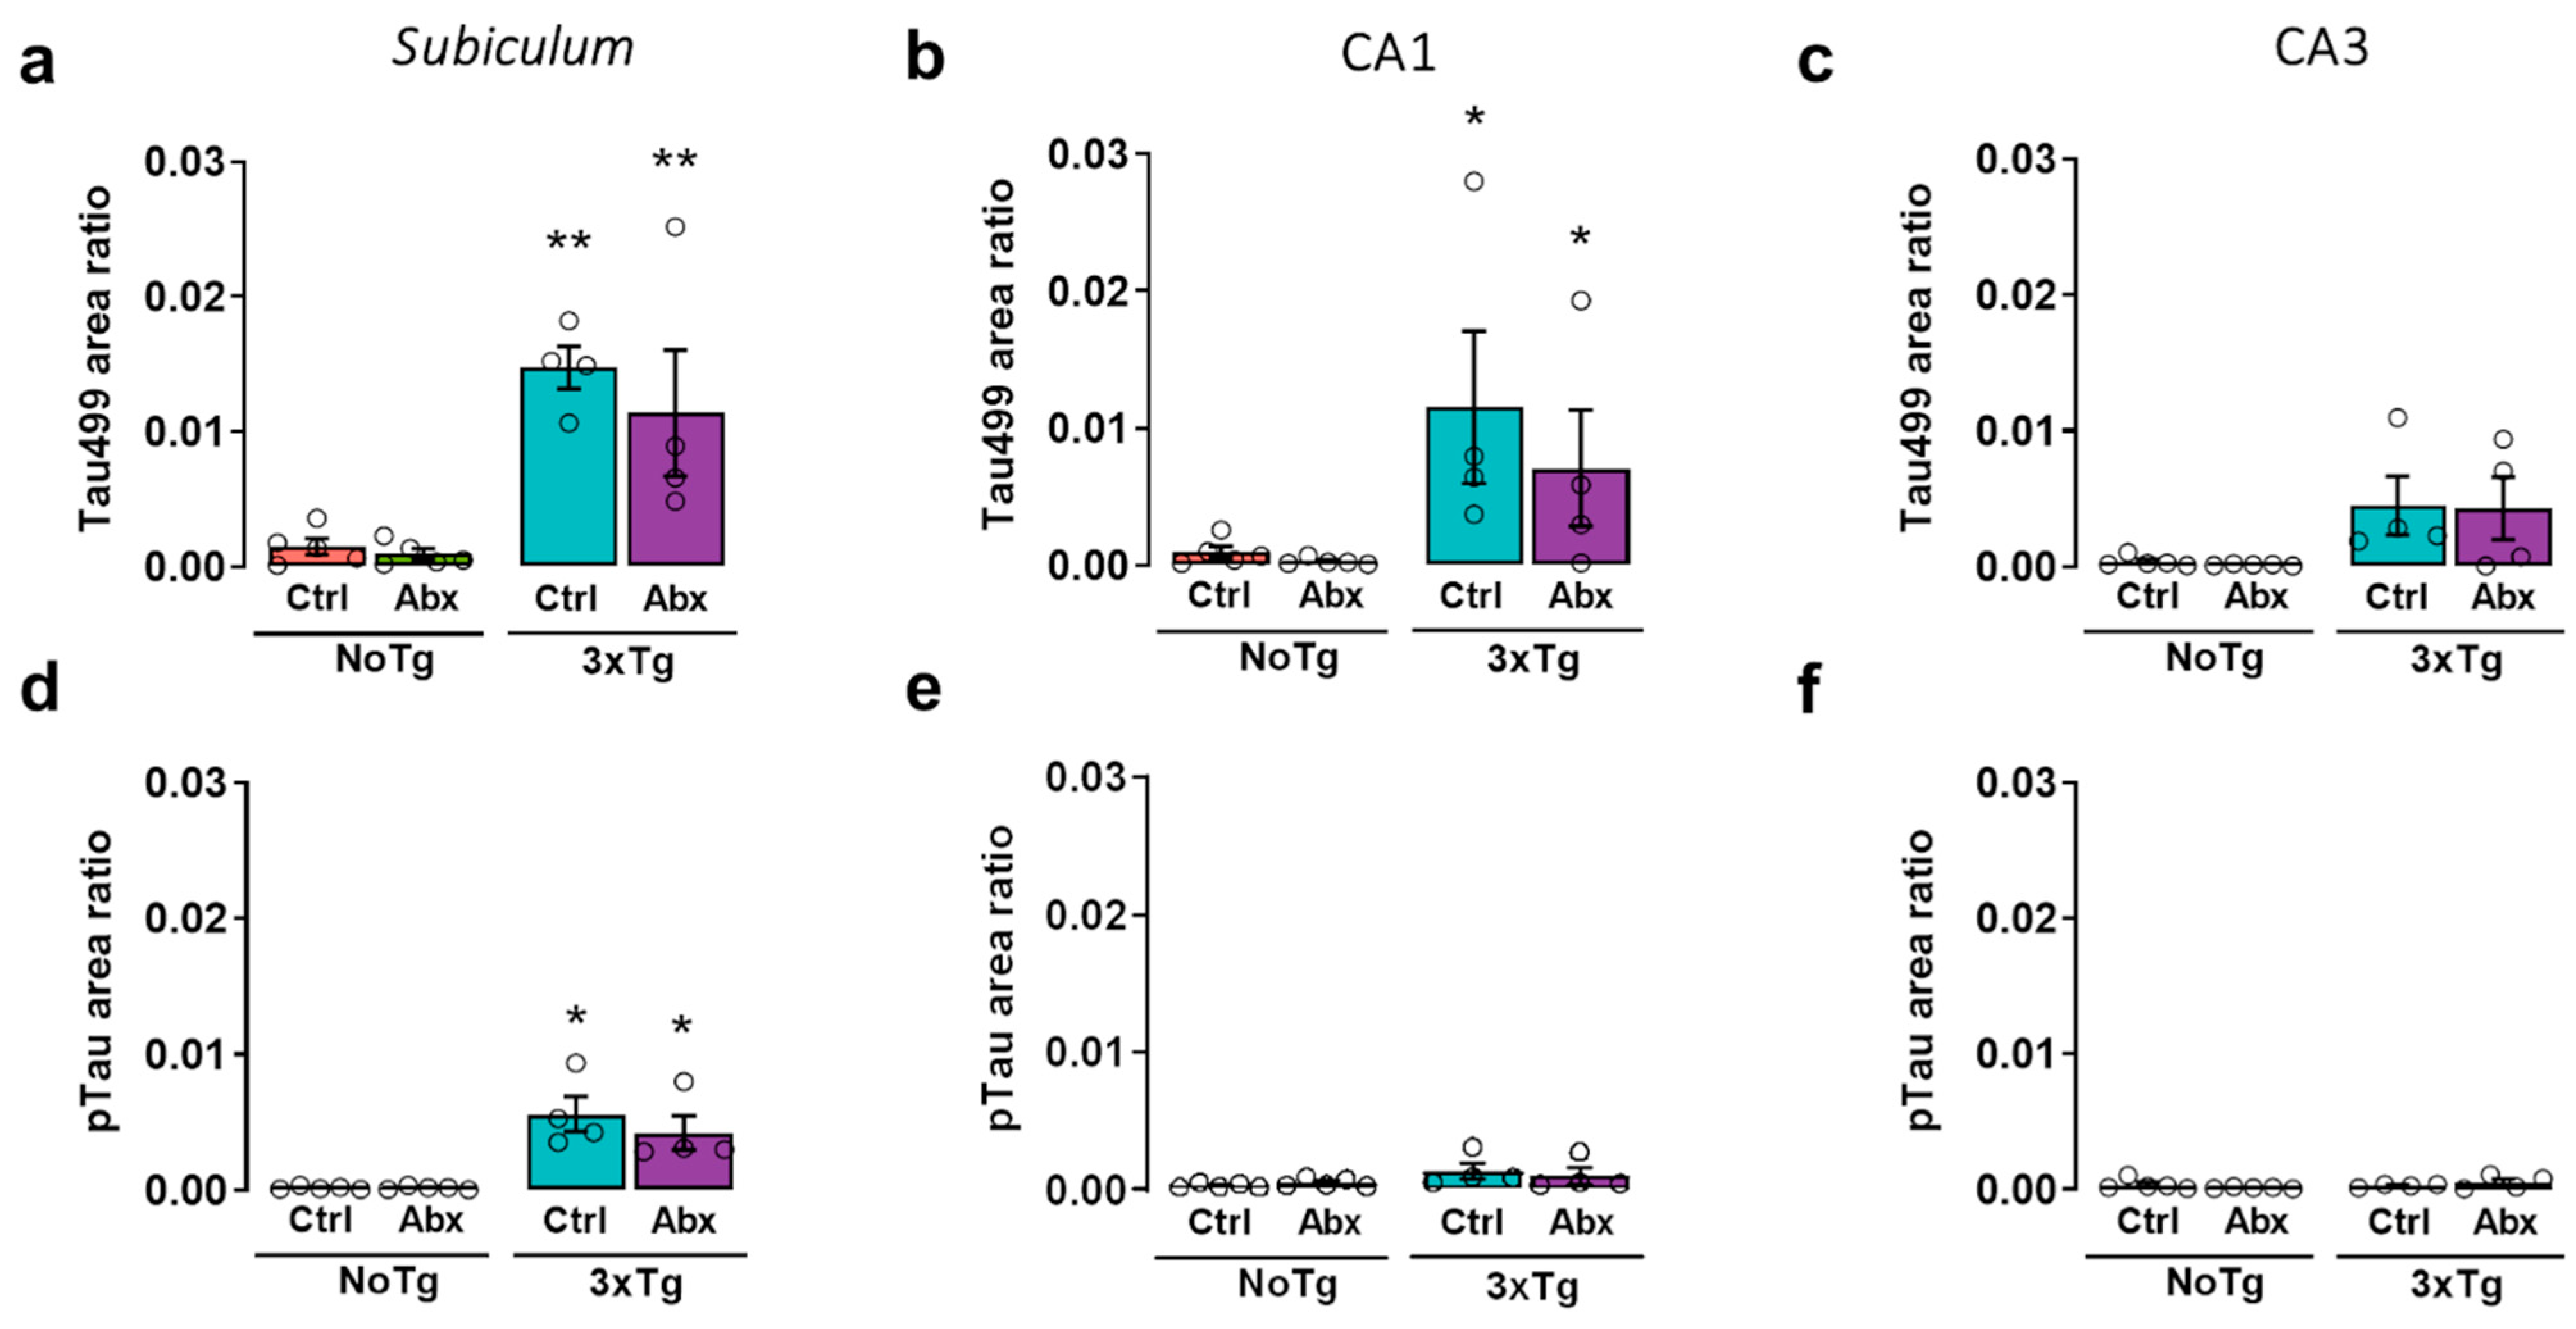
2.7. Total and Phosphorylated Tau Protein in the Hippocampus of 3xTg Mice Are Not Affected by BGM DysbiosisDysbiosis with Antibiotics
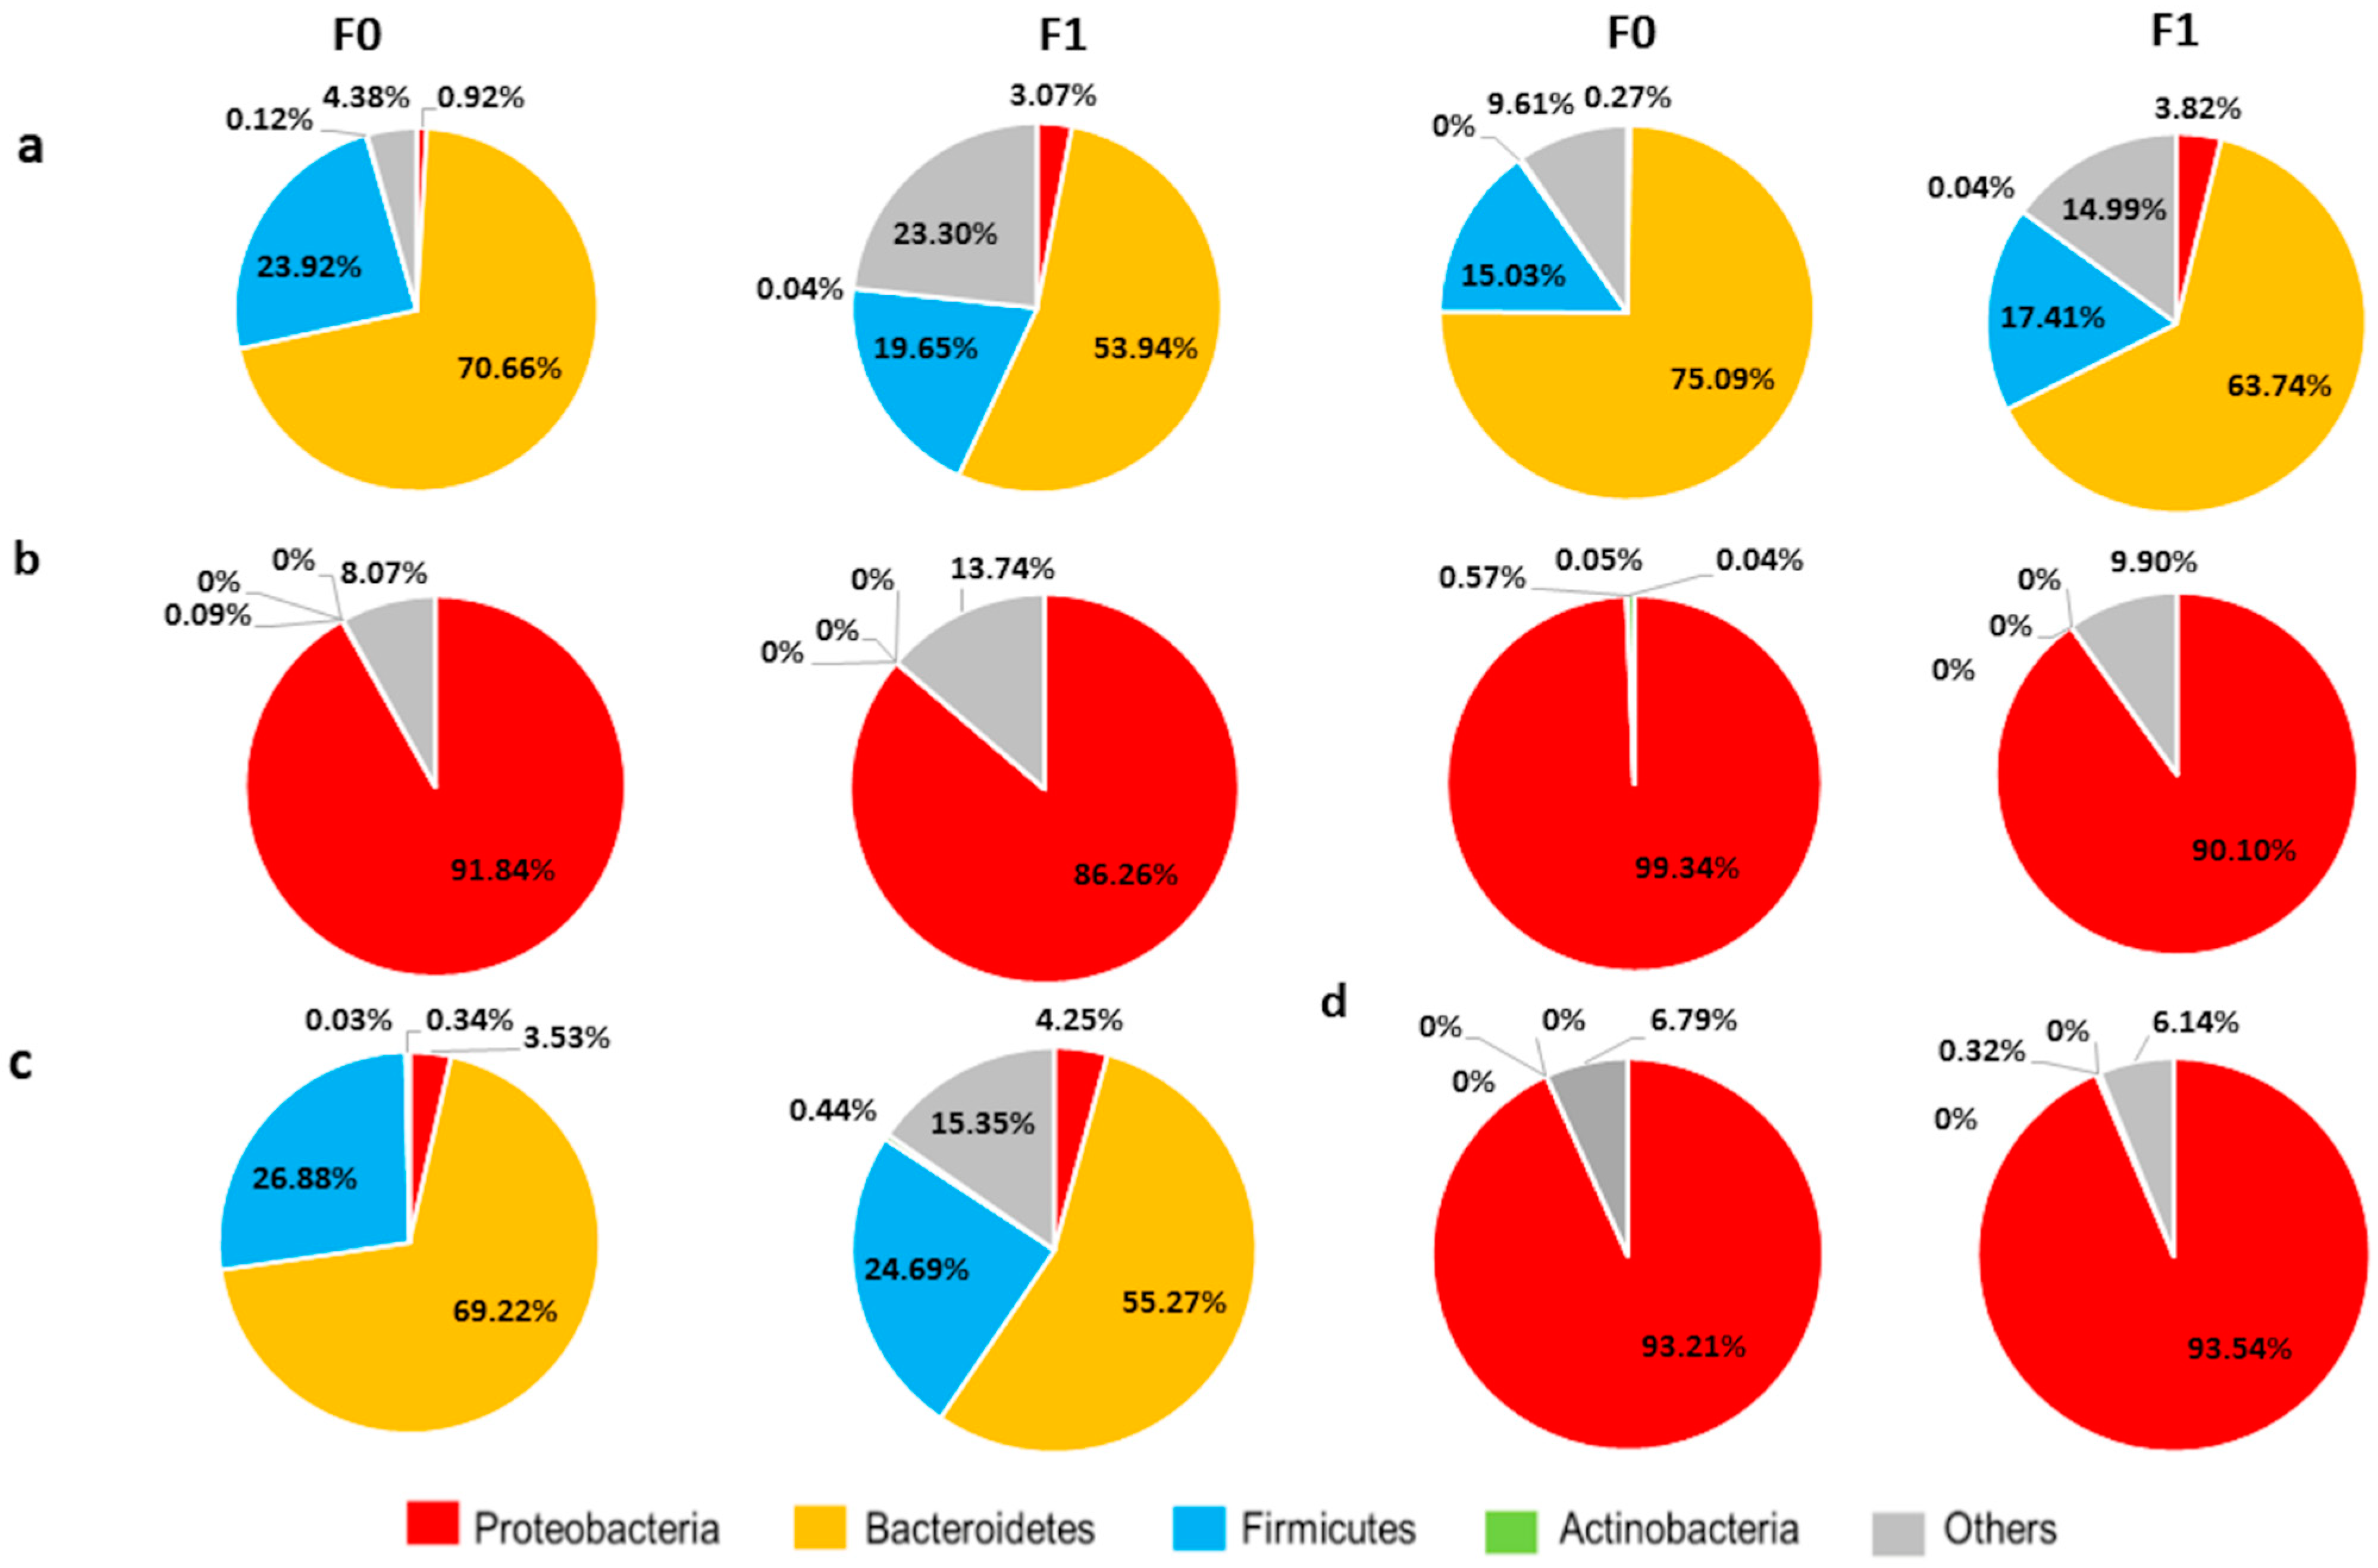
2.8. Chronic Abx Treatment Promotes Proliferation of Proteobacteria
2.9. A Vertical Transfer of BGM from F0 to F1 Was Observed at PD30
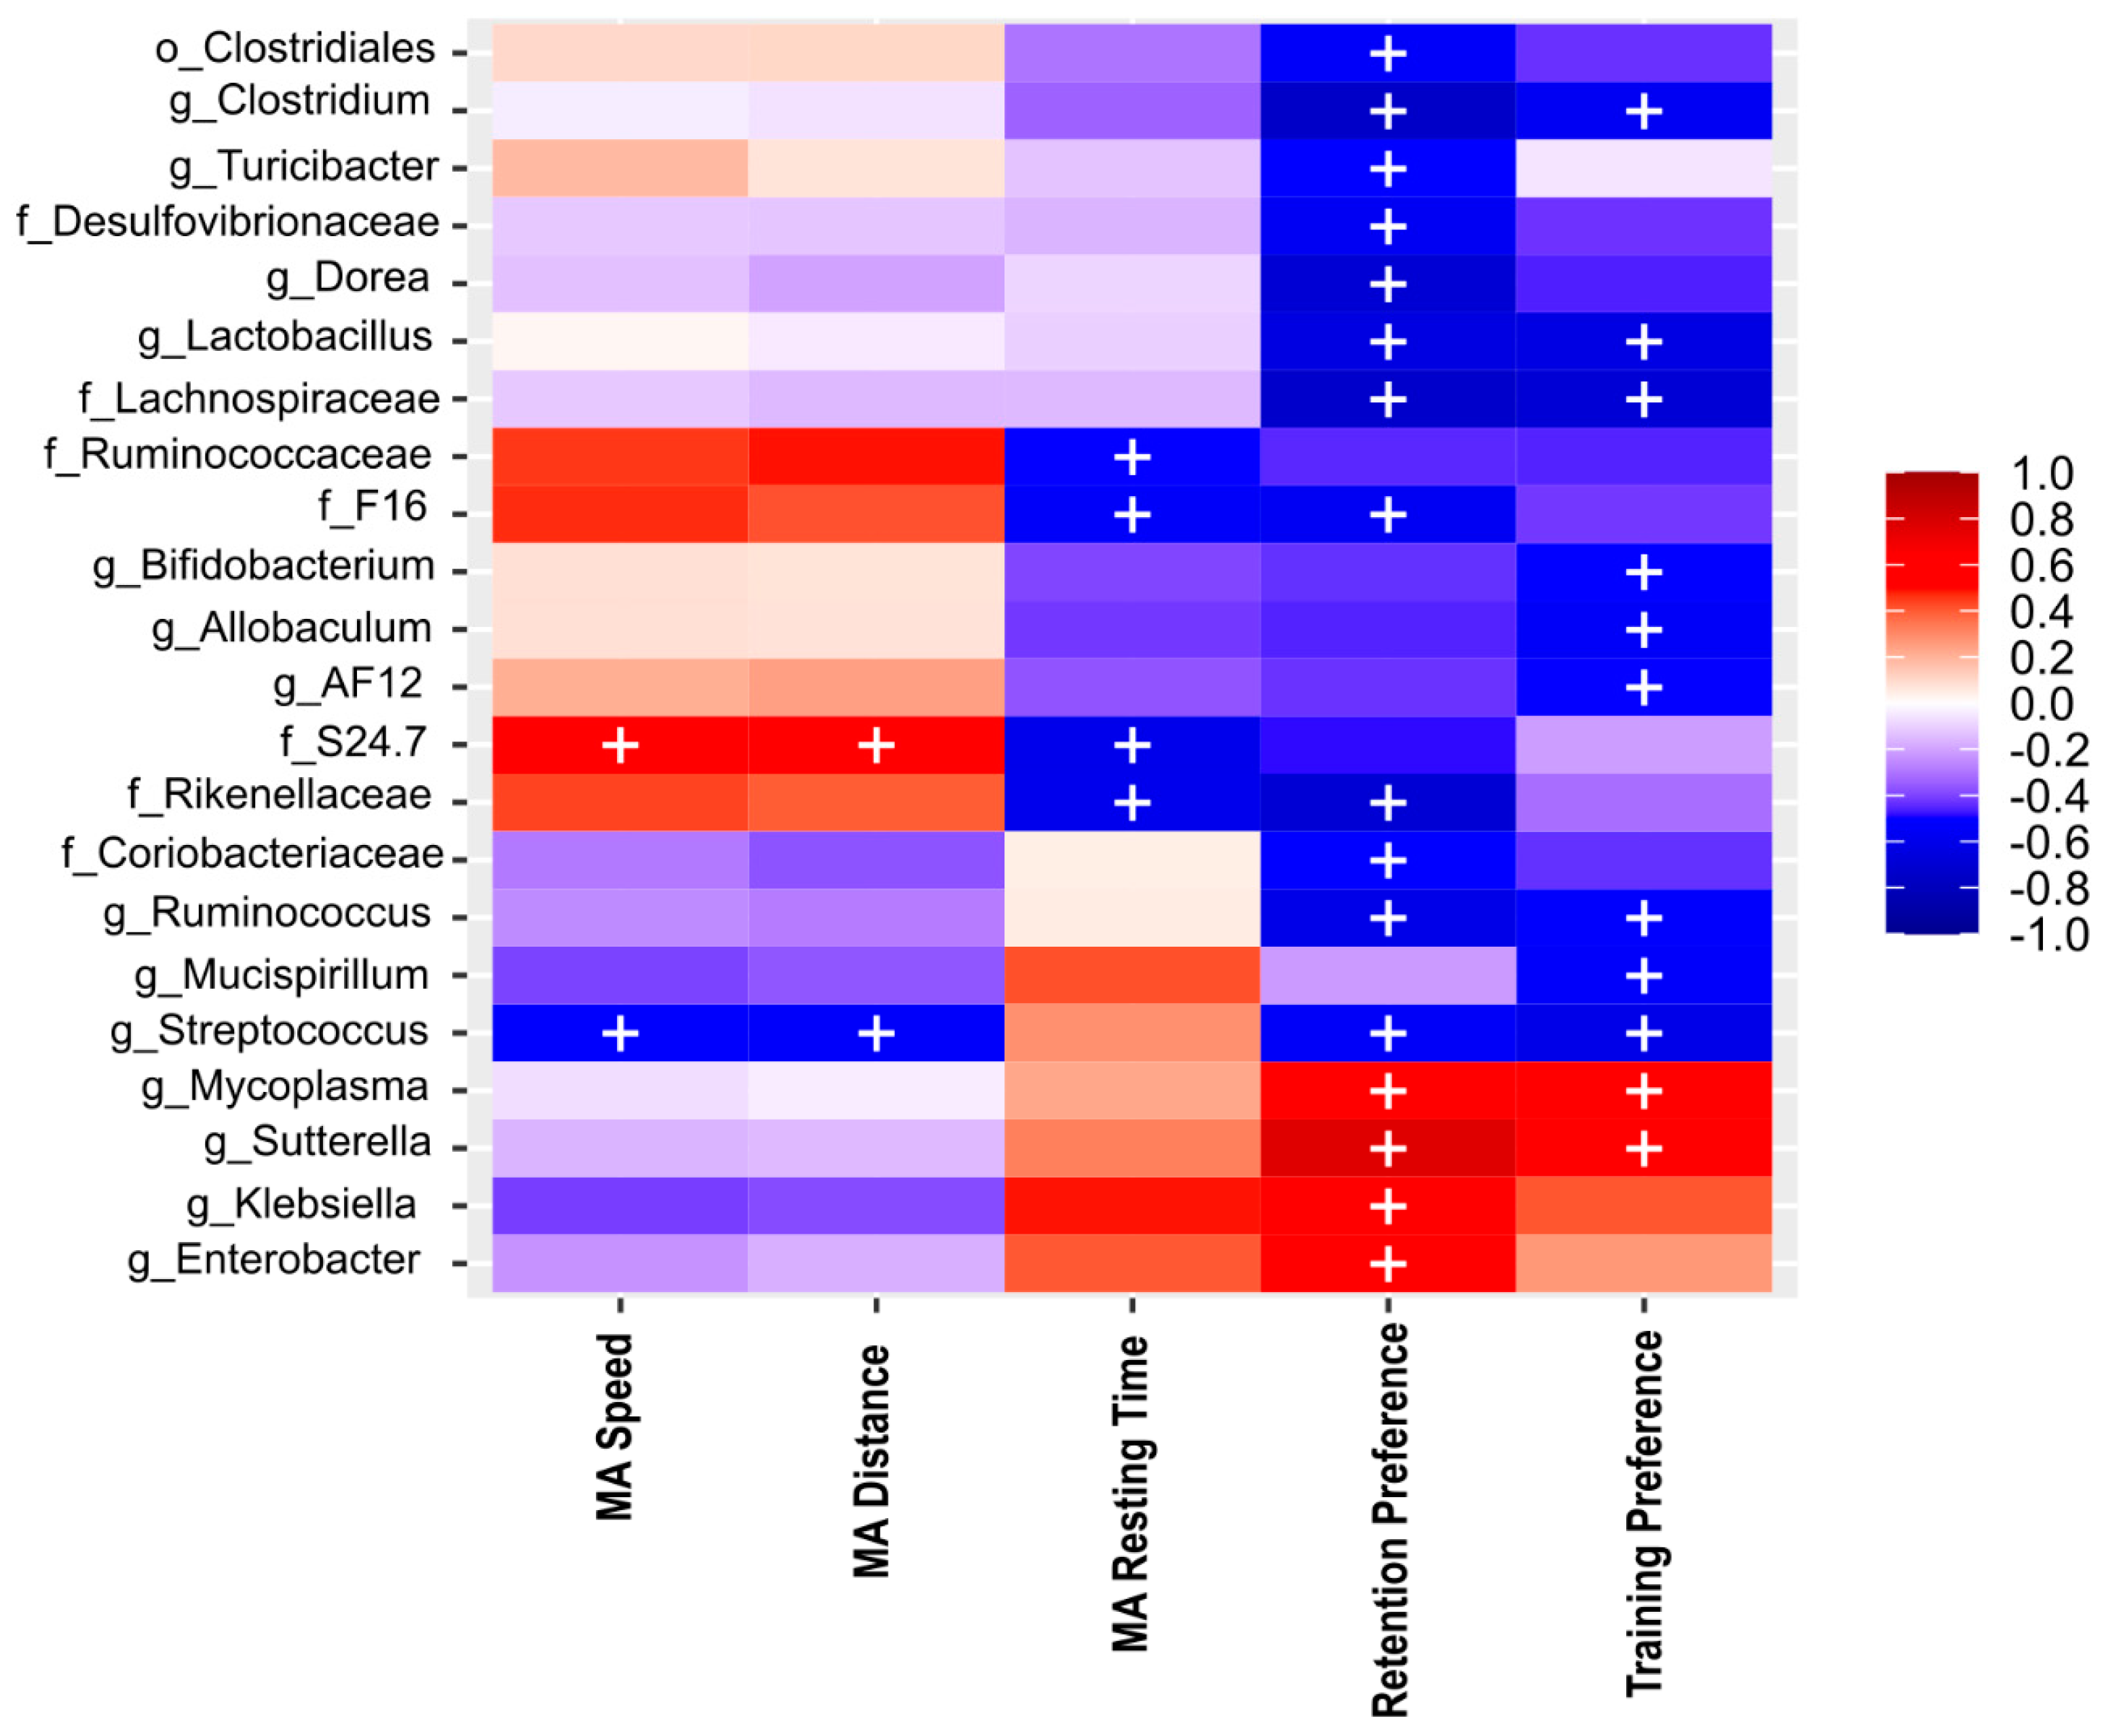
2.10. Bacterial Diversity Is Directly Correlated with NOL Performance and Total Aβ and Aβ1-42 in the Hippocampus
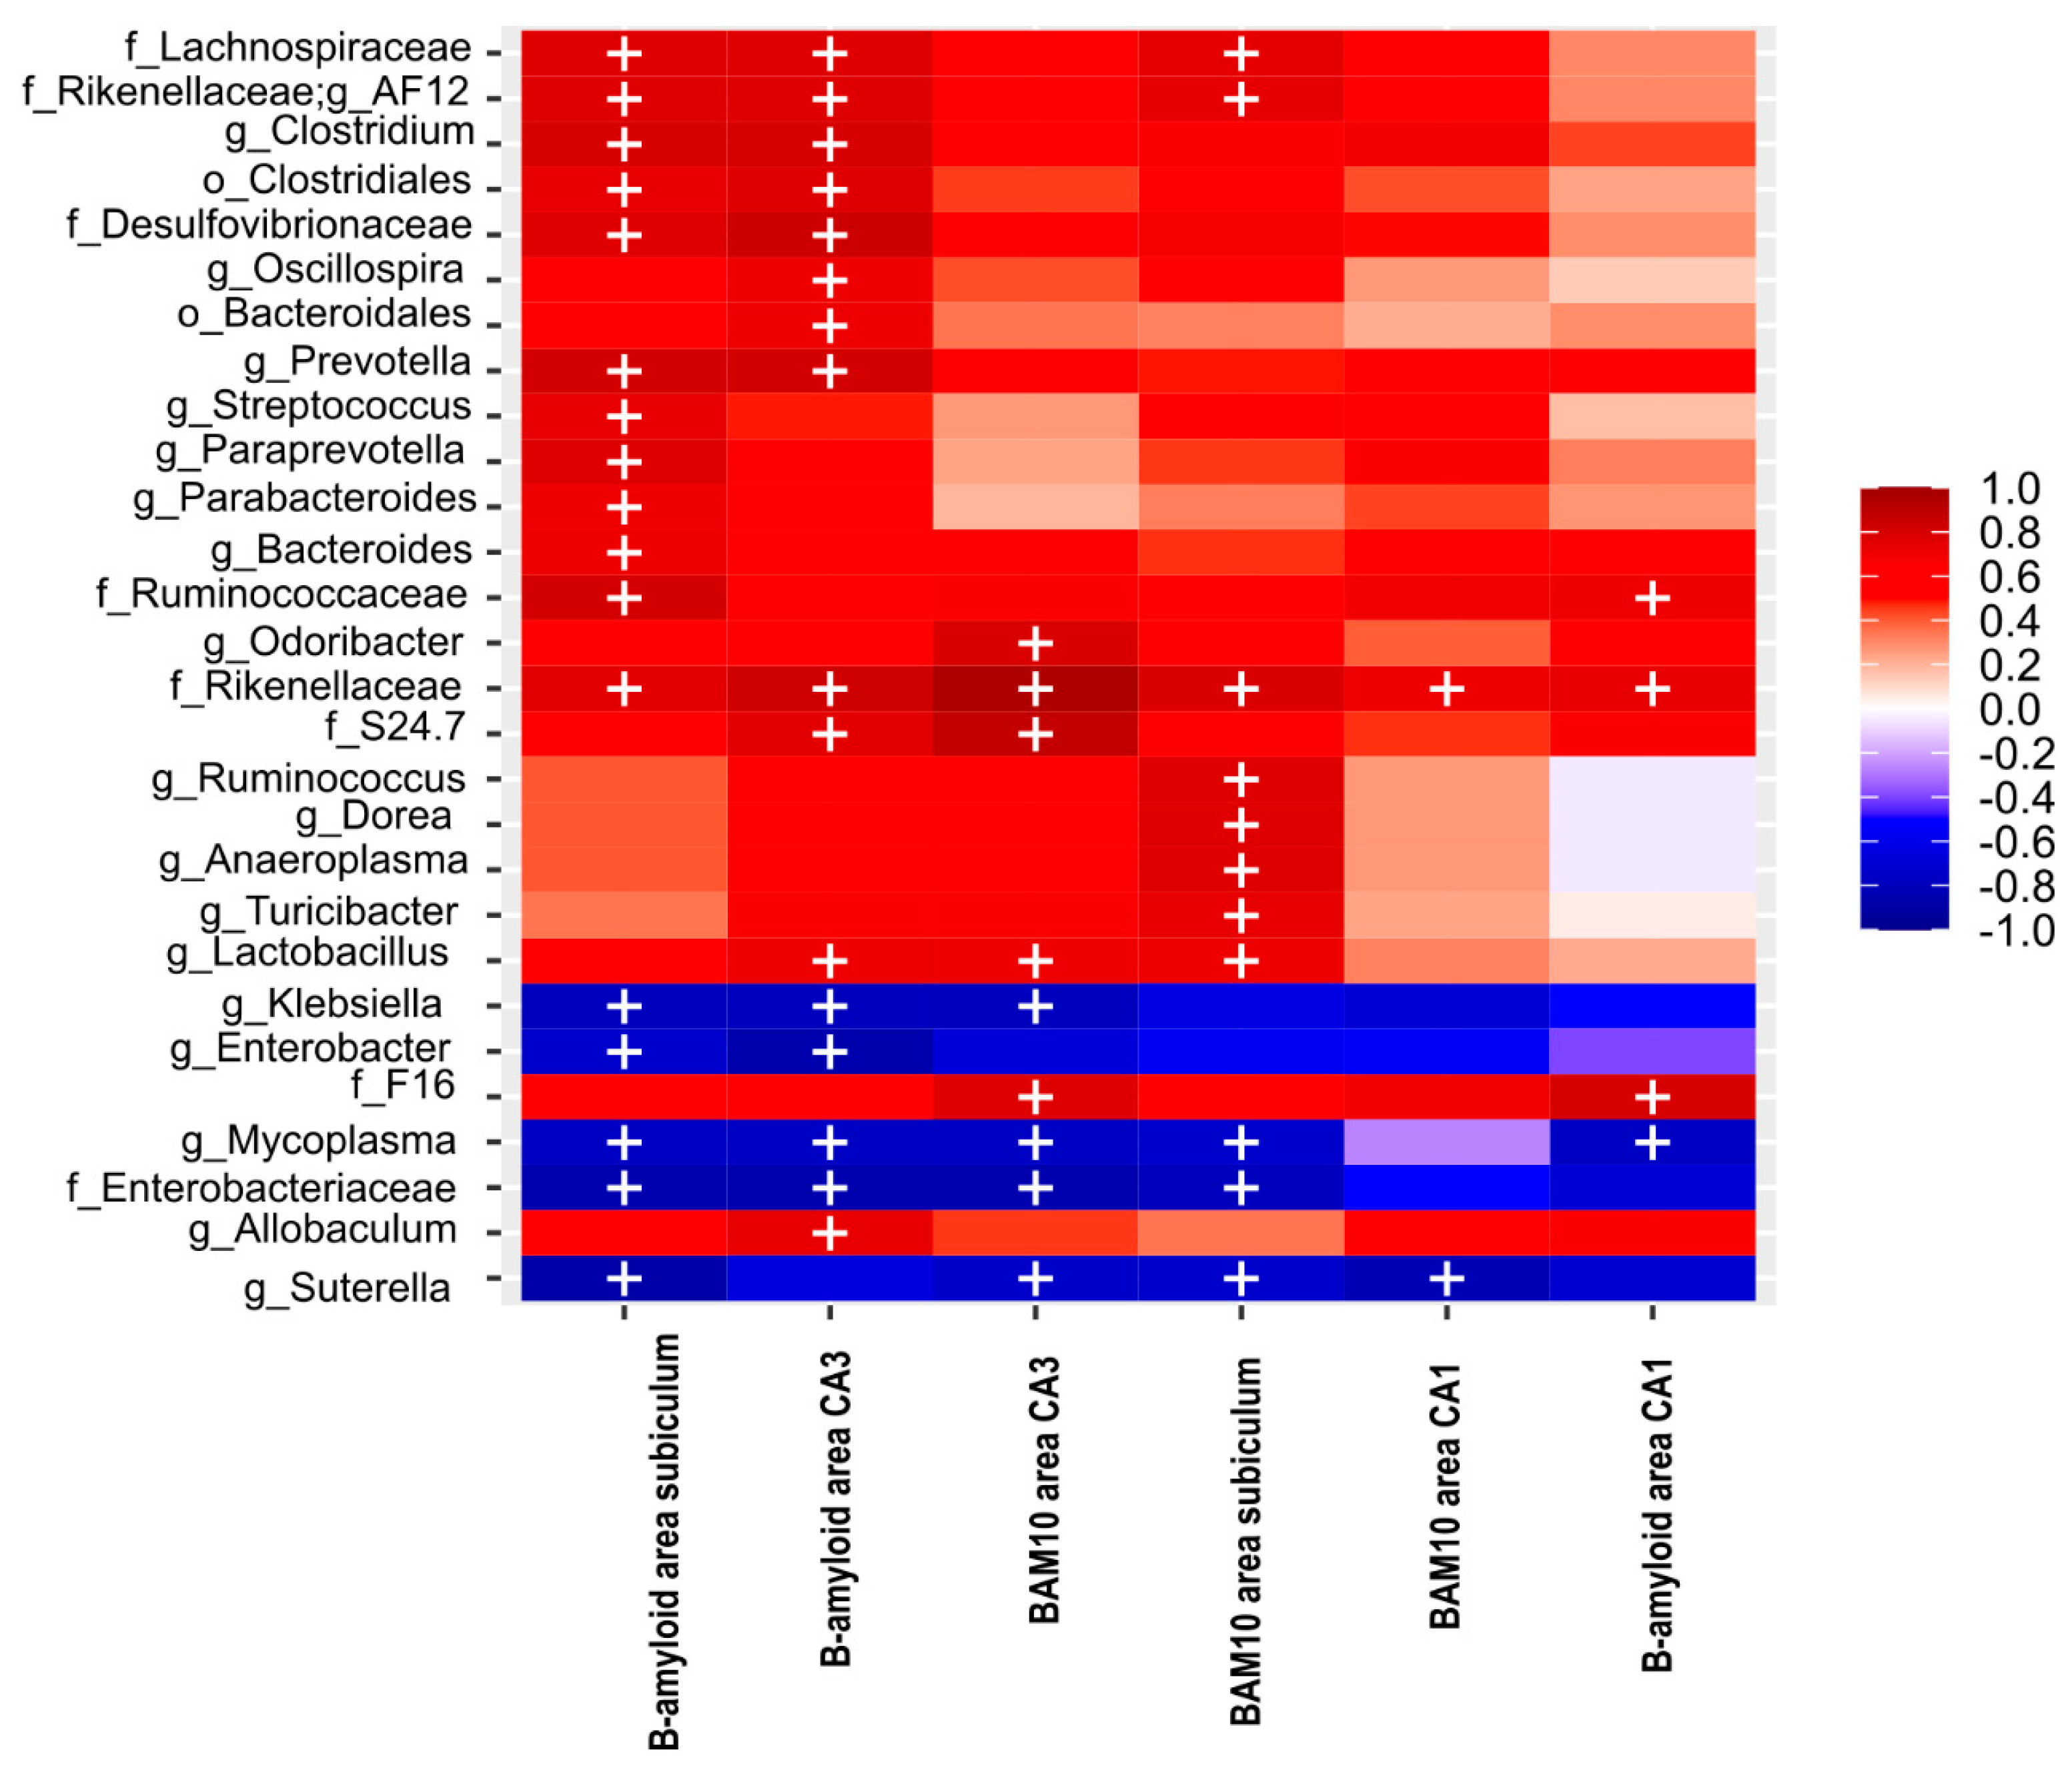
2.11. NOL Performance and Aβ in the Hippocampus Correlates with BGM Taxa in 3xTg Mice at PD150
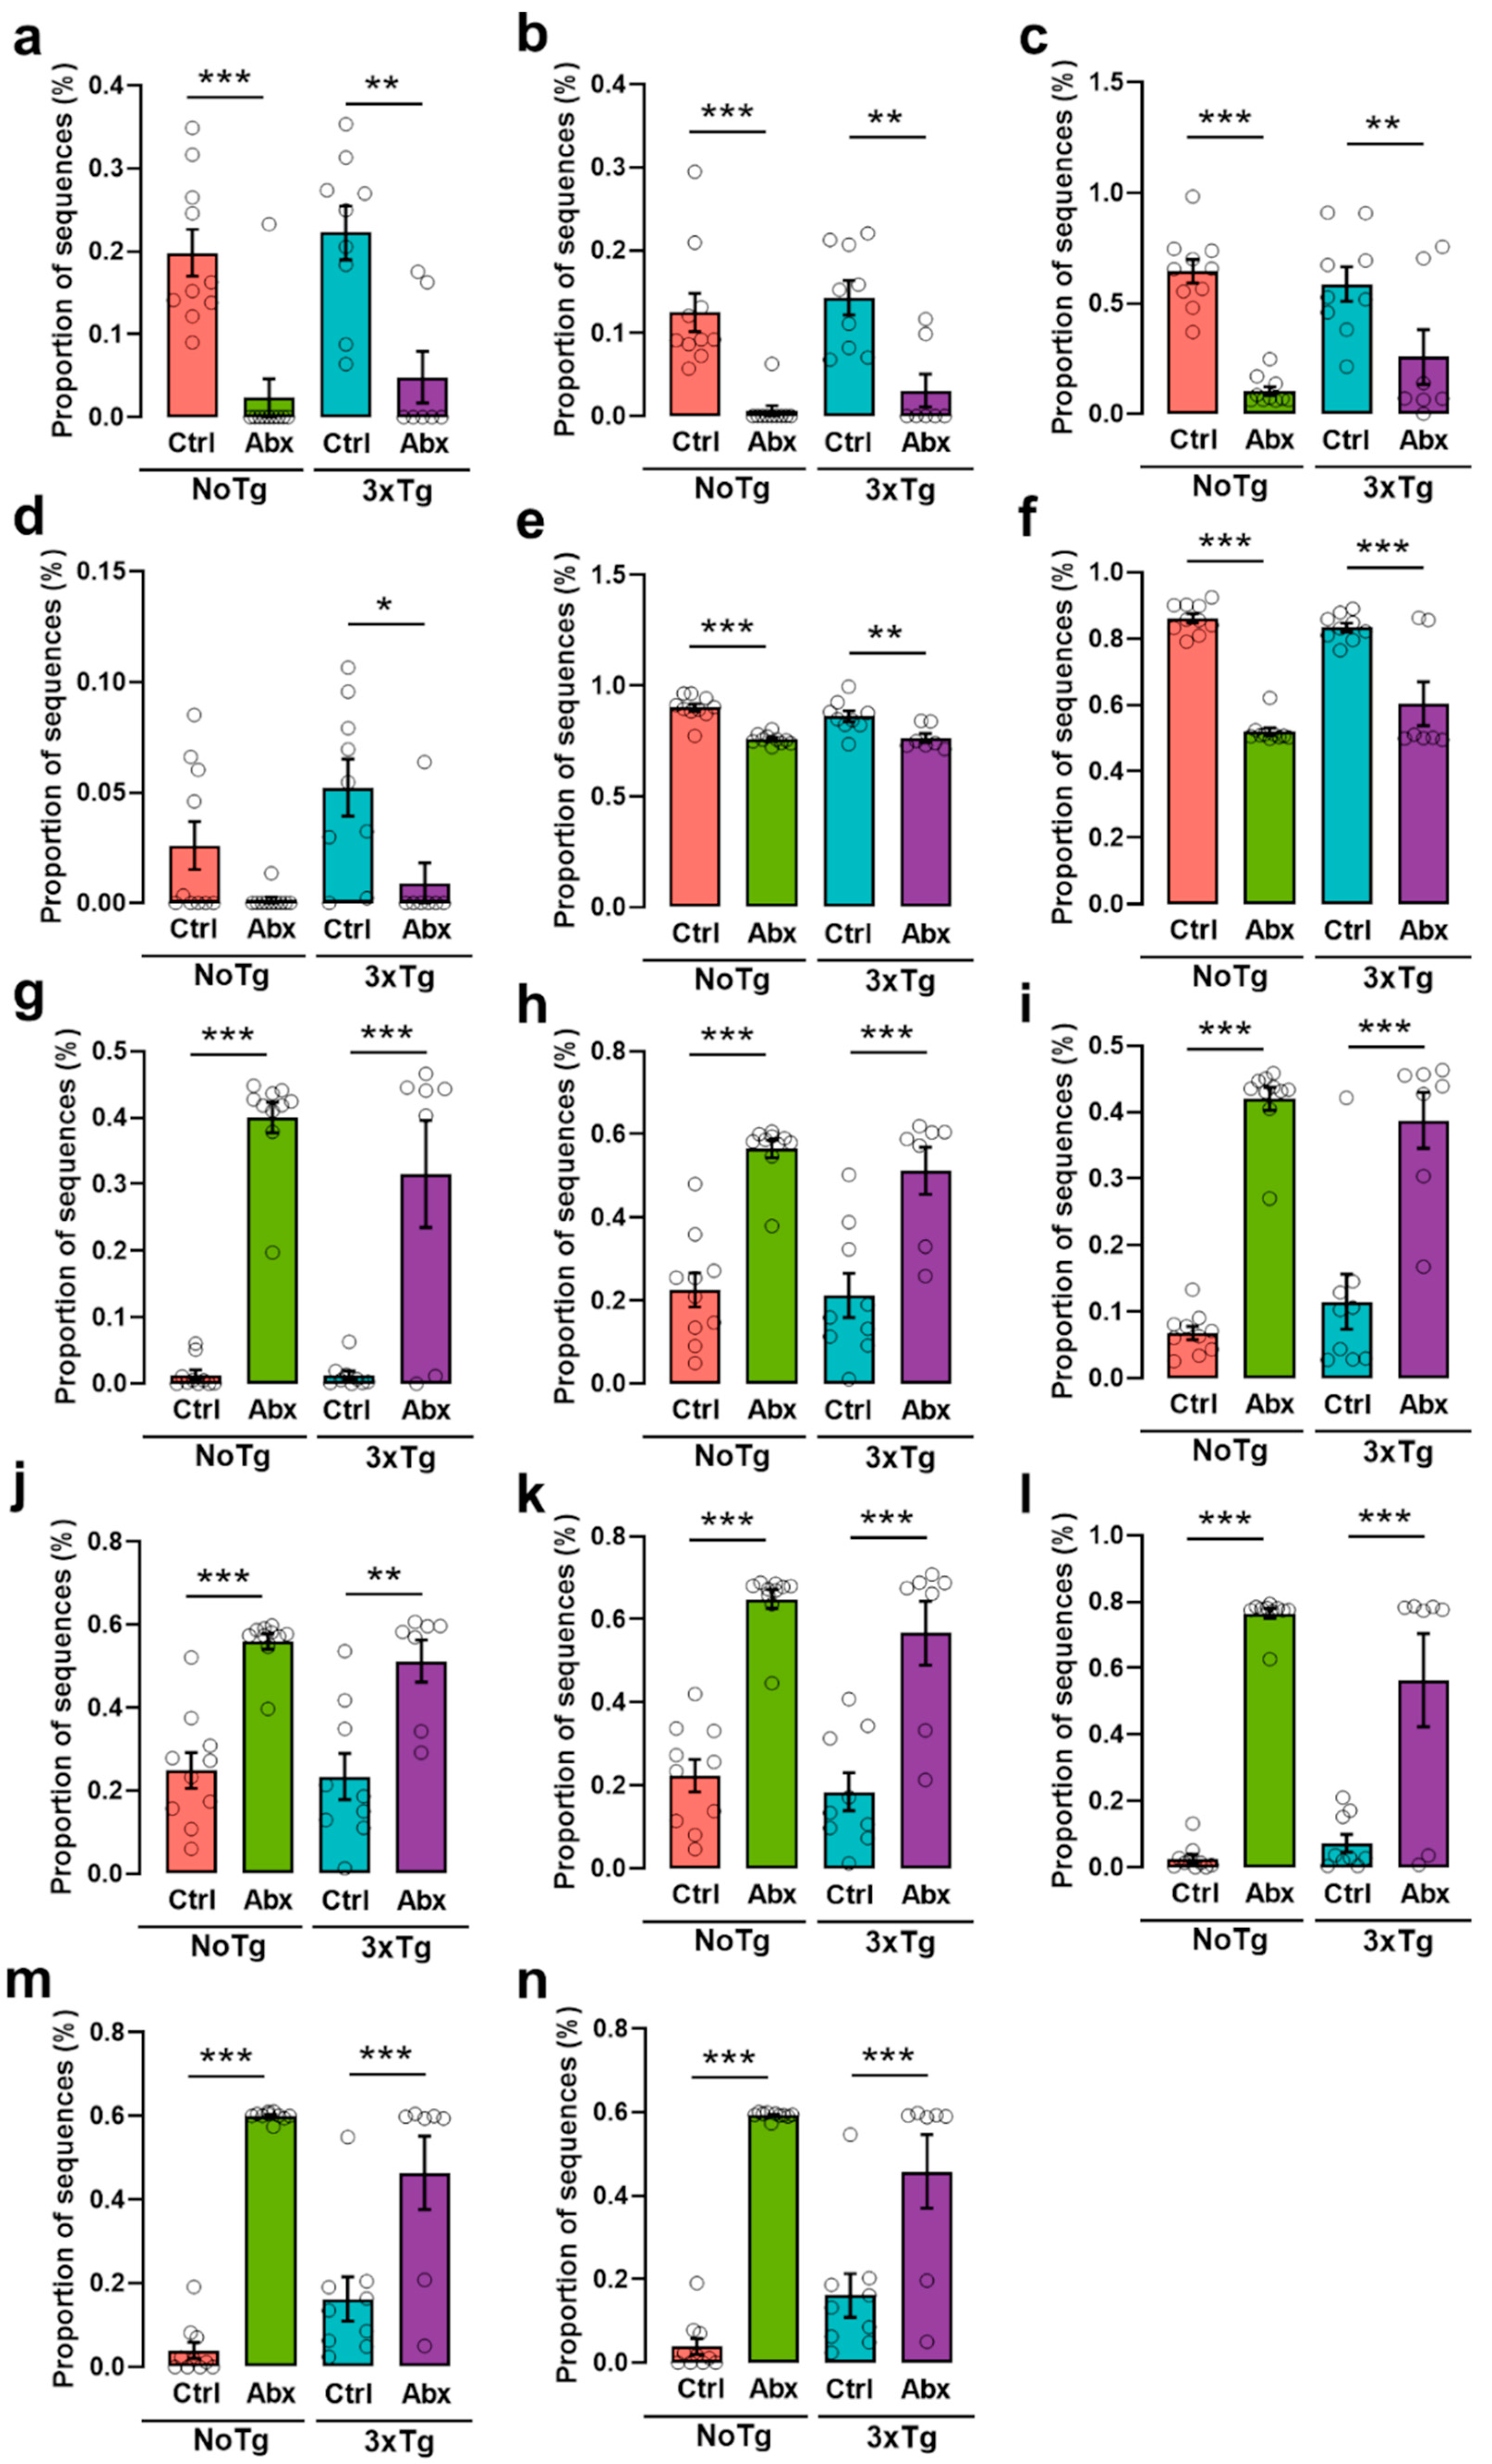
2.12. There Is a Differential Abundance in the BGM Composition in All Groups
2.13. The Predicted Functional Metagenome Shows Reduced Detonator Molecules and Greater Metabolism of Protective Molecules after Abx Treatment
3. Discussion
4. Methods and Materials
4.1. Animals
4.2. Chronic Antibiotics Treatment
4.3. Fecal Samples Collection for Microbiota Analysis
4.4. DNA Extraction, Library Preparation, and 16S rRNA Gene Amplicon Sequencing
4.5. Filtering and Taxonomic Classification
4.6. Determination of Bacterial Abundance and Diversity
4.7. Novel Object Localization Task
4.8. Immunohistochemistry for β-Amyloid and Tau
4.9. Correlation Analyses
4.10. Metagenome Prediction of the BGM
4.11. Statistical Analysis
Supplementary Materials
Author Contributions
Funding
Institutional Review Board Statement
Informed Consent Statement
Data Availability Statement
Acknowledgments
Conflicts of Interest
References
- Serrano-Pozo, A.; Frosch, M.P.; Masliah, E.; Hyman, B.T. Neuropathological Alterations in Alzheimer Disease. Cold Spring Harb. Perspect. Med. 2011, 1, a006189. [Google Scholar] [CrossRef] [PubMed]
- Martins, R.N.; Villemagne, V.; Sohrabi, H.R.; Chatterjee, P.; Shah, T.M.; Verdile, G.; Fraser, P.; Taddei, K.; Gupta, V.B.; Rainey-Smith, S.R.; et al. Alzheimer’s Disease: A Journey from Amyloid Peptides and Oxidative Stress, to Biomarker Technologies and Disease Prevention Strategies-Gains from AIBL and DIAN Cohort Studies. J. Alzheimer’s Dis. 2018, 62, 965–992. [Google Scholar] [CrossRef] [PubMed] [Green Version]
- Querfurth, H.W.; Laferla, F.M. Alzheimer’s Disease. N. Engl. J. Med. 2010, 362, 329–344. [Google Scholar] [CrossRef] [PubMed] [Green Version]
- Oddo, S.; Caccamo, A.; Shepherd, J.D.; Murphy, M.P.; Golde, T.E.; Kayed, R.; Metherate, R.; Mattson, M.P.; Akbari, Y.; LaFerla, F.M. Triple-Transgenic Model of Alzheimer’s Disease with Plaques and Tangles: Intracellular Aβ and Synaptic Dysfunction. Neuron 2003, 39, 409–421. [Google Scholar] [CrossRef] [Green Version]
- Chen, Y.; Liang, Z.; Blanchard, J.; Dai, C.L.; Sun, S.; Lee, M.H.; Grundke-Iqbal, I.; Iqbal, K.; Liu, F.; Gong, C.X. A Non-Transgenic Mouse Model (Icv-STZ Mouse) of Alzheimer’s Disease: Similarities to and Differences from the Transgenic Model (3xTg-AD Mouse). Mol. Neurobiol. 2013, 47, 711–725. [Google Scholar] [CrossRef]
- Cantanelli, P.; Sperduti, S.; Ciavardelli, D.; Stuppia, L.; Gatta, V.; Sensi, S.L. Age-Dependent Modifications of AMPA Receptor Subunit Expression Levels and Related Cognitive Effects in 3xTg-AD Mice. Front. Aging Neurosci. 2014, 6, 200. [Google Scholar] [CrossRef] [Green Version]
- Davis, K.E.; Burnett, K.; Gigg, J. Water and T-Maze Protocols Are Equally Efficient Methods to Assess Spatial Memory in 3xTg Alzheimer’s Disease Mice. Behav. Brain Res. 2017, 331, 54–66. [Google Scholar] [CrossRef]
- Zhang, W.; Guo, J.; Niu, X.; Wang, J.; Wang, Z.; Wu, M.; Yang, W.; Zhang, J.; Qi, J. Citalopram Ameliorates Impairments in Spatial Memory and Synaptic Plasticity in Female 3xTgAD Mice. Biomed. Res. Int. 2017, 2017, 1238687. [Google Scholar] [CrossRef] [Green Version]
- Bello-Medina, P.C.; González-Franco, D.A.; Vargas-Rodríguez, I.; Díaz-Cintra, S. Estrés Oxidativo, Respuesta Inmune, Plasticidad Sináptica y Cognición En Modelos Transgénicos de La Enfermedad de Alzheimer. Neurología, 2019; in press. [Google Scholar] [CrossRef]
- Bello-Medina, P.C.; Hernández-Quiroz, F.; Pérez-Morales, M.; González-Franco, D.A.; Cruz-Pauseno, G.; García-Mena, J.; Díaz-Cintra, S.; Pacheco-López, G. Spatial Memory and Gut Microbiota Alterations Are Already Present in Early Adulthood in a Pre-Clinical Transgenic Model of Alzheimer’s Disease. Front. Neurosci. 2021, 15, 397. [Google Scholar] [CrossRef]
- Billings, L.M.; Oddo, S.; Green, K.N.; McGaugh, J.L.; LaFerla, F.M. Intraneuronal Aβ Causes the Onset of Early Alzheimer’s Disease-Related Cognitive Deficits in Transgenic Mice. Neuron 2005, 45, 675–688. [Google Scholar] [CrossRef] [PubMed] [Green Version]
- Clark, J.K.; Furgerson, M.; Crystal, J.D.; Fechheimer, M.; Furukawa, R.; Wagner, J.J. Alterations in Synaptic Plasticity Coincide with Deficits in Spatial Working Memory in Presymptomatic 3xTg-AD Mice. Neurobiol. Learn. Mem. 2015, 125, 152–162. [Google Scholar] [CrossRef] [PubMed] [Green Version]
- Kommaddi, R.P.; Das, D.; Karunakaran, S.; Nanguneri, S.; Bapat, D.; Ray, A.; Shaw, E.; Bennett, D.A.; Nair, D.; Ravindranath, V. Aβ Mediates F-Actin Disassembly in Dendritic Spines Leading to Cognitive Deficits in Alzheimer’s Disease. J. Neurosci. 2018, 38, 1085–1099. [Google Scholar] [CrossRef] [PubMed]
- Zou, C.; Montagna, E.; Shi, Y.; Peters, F.; Blazquez-Llorca, L.; Shi, S.; Filser, S.; Dorostkar, M.M.; Herms, J. Intraneuronal APP and Extracellular Aβ Independently Cause Dendritic Spine Pathology in Transgenic Mouse Models of Alzheimer’s Disease. Acta Neuropathol. 2015, 129, 909–920. [Google Scholar] [CrossRef]
- Guzmán-Ramos, K.; Moreno-Castilla, P.; Castro-Cruz, M.; McGaugh, J.L.; Martínez-Coria, H.; LaFerla, F.M.; Bermúdez-Rattoni, F. Restoration of Dopamine Release Deficits during Object Recognition Memory Acquisition Attenuates Cognitive Impairment in a Triple Transgenic Mice Model of Alzheimer’s Disease. Learn. Mem. 2012, 19, 453–460. [Google Scholar] [CrossRef] [Green Version]
- Sonnen, J.A.; Breitner, J.C.; Lovell, M.A.; Markesbery, W.R.; Quinn, J.F.; Montine, T.J. Free Radical-Mediated Damage to Brain in Alzheimer’s Disease and Its Transgenic Mouse Models. Free Radic. Biol. Med. 2008, 45, 219–230. [Google Scholar] [CrossRef] [Green Version]
- Chen, Z.; Zhong, C. Oxidative Stress in Alzheimer’s Disease. Neurosci. Bull. 2014, 30, 271–281. [Google Scholar] [CrossRef]
- Cheignon, C.; Tomas, M.; Bonnefont-Rousselot, D.; Faller, P.; Hureau, C.; Collin, F. Oxidative Stress and the Amyloid Beta Peptide in Alzheimer’s Disease. Redox Biol. 2018, 14, 450–464. [Google Scholar] [CrossRef]
- Pohanka, M. Oxidative Stress in Alzheimer Disease as a Target for Therapy. Bratislava Med. J. 2018, 119, 535–543. [Google Scholar] [CrossRef] [Green Version]
- Hamilton, L.K.; Dufresne, M.; Joppé, S.E.; Petryszyn, S.; Aumont, A.; Calon, F.; Barnabé-Heider, F.; Furtos, A.; Parent, M.; Chaurand, P.; et al. Aberrant Lipid Metabolism in the Forebrain Niche Suppresses Adult Neural Stem Cell Proliferation in an Animal Model of Alzheimer’s Disease. Cell Stem Cell 2015, 17, 397–411. [Google Scholar] [CrossRef] [Green Version]
- Sah, S.K.; Lee, C.; Jang, J.H.; Park, G.H. Effect of High-Fat Diet on Cognitive Impairment in Triple-Transgenic Mice Model of Alzheimer’s Disease. Biochem. Biophys. Res. Commun. 2017, 493, 731–736. [Google Scholar] [CrossRef] [PubMed]
- Min, D.; Guo, F.; Zhu, S.; Xu, X.; Mao, X.; Cao, Y.; Lv, X.; Gao, Q.; Wang, L.; Chen, T.; et al. The Alterations of Ca2+/Calmodulin/CaMKII/CaV1.2 Signaling in Experimental Models of Alzheimer’s Disease and Vascular Dementia. Neurosci. Lett. 2013, 538, 60–65. [Google Scholar] [CrossRef] [PubMed]
- Guillot, F.; Kemppainen, S.; Lavasseur, G.; Miettinen, P.O.; Laroche, S.; Tanila, H.; Davis, S. Brain-Specific Basal and Novelty-Induced Alternations in PI3K-Akt and MAPK/ERK Signaling in a Middle-Aged AβPP/PS1 Mouse Model of Alzheimer’s Disease. J. Alzheimer’s Dis. 2016, 51, 1157–1173. [Google Scholar] [CrossRef]
- Cuello, A.C. Early and Late CNS Inflammation in Alzheimer’s Disease: Two Extremes of a Continuum? Trends Pharmacol. Sci. 2017, 38, 956–966. [Google Scholar] [CrossRef] [PubMed]
- Koboziev, I.; Reinoso Webb, C.; Furr, K.L.; Grisham, M.B. Role of the Enteric Microbiota in Intestinal Homeostasis and Inflammation. Free Radic. Biol. Med. 2014, 68, 122–133. [Google Scholar] [CrossRef] [Green Version]
- Sampson, T.R.; Mazmanian, S.K. Control of Brain Development, Function, and Behavior by the Microbiome. Cell Host Microbe 2015, 17, 565–576. [Google Scholar] [CrossRef] [Green Version]
- Lee, H.; Lee, K.; Kim, J.; Kim, D. Suppression of Gut Dysbiosis by Bifidobacterium Longum Alleviates Cognitive Decline in 5XFAD Transgenic and Aged Mice. Sci. Rep. 2019, 9, 11814. [Google Scholar] [CrossRef] [Green Version]
- Harach, T.; Marungruang, N.; Duthilleul, N.; Cheatham, V.; Mc Coy, K.D.; Frisoni, G.; Neher, J.J.; Fåk, F.; Jucker, M.; Lasser, T.; et al. Reduction of Abeta Amyloid Pathology in APPPS1 Transgenic Mice in the Absence of Gut Microbiota. Sci. Rep. 2017, 7, 41802. [Google Scholar] [CrossRef]
- Syeda, T.; Sanchez-Tapia, M.; Pinedo-Vargas, L.; Granados, O.; Cuervo-Zanatta, D.; Rojas-Santiago, E.; Díaz-Cintra, S.; Torres, N.; Perez-Cruz, C. Bioactive Food Abates Metabolic and Synaptic Alterations by Modulation of Gut Microbiota in a Mouse Model of Alzheimer’s Disease. J. Alzheimer’s Dis. 2018, 66, 1657–1682. [Google Scholar] [CrossRef]
- Sun, B.L.; Li, W.W.; Wang, J.; Xu, Y.L.; Sun, H.L.; Tian, D.-Y.; Wang, Y.J.; Yao, X.Q. Gut Microbiota Alteration and Its Time Course in a Tauopathy Mouse Model. J. Alzheimer’s Dis. 2019, 70, 399–412. [Google Scholar] [CrossRef]
- Zhang, L.; Wang, Y.; Xiayu, X.; Shi, C.; Chen, W.; Song, N.; Fu, X.; Zhou, R.; Xu, Y.F.; Huang, L.; et al. Altered Gut Microbiota in a Mouse Model of Alzheimer’s Disease. J. Alzheimer’s Dis. 2017, 60, 1241–1257. [Google Scholar] [CrossRef]
- Tlaskalová-Hogenová, H.; Štěpánková, R.; Hudcovic, T.; Tučková, L.; Cukrowska, B.; Lodinová-Žádníková, R.; Kozáková, H.; Rossmann, P.; Bártová, J.; Sokol, D.; et al. Commensal Bacteria (Normal Microflora), Mucosal Immunity and Chronic Inflammatory and Autoimmune Diseases. Immunol. Lett. 2004, 93, 97–108. [Google Scholar] [CrossRef] [PubMed]
- Colangelo, V.; Schurr, J.; Ball, M.J.; Pelaez, R.P.; Bazan, N.G.; Lukiw, W.J. Gene Expression Profiling of 12633 Genes in Alzheimer Hippocampal CA1: Transcription and Neurotrophic Factor down-Regulation and up-Regulation of Apoptotic and pro-Inflammatory Signaling. J. Neurosci. Res. 2002, 70, 462–473. [Google Scholar] [CrossRef] [PubMed]
- Dasari, M.; Espargaro, A.; Sabate, R.; Lopez Del Amo, J.M.; Fink, U.; Grelle, G.; Bieschke, J.; Ventura, S.; Reif, B. Bacterial Inclusion Bodies of Alzheimer’s Disease β-Amyloid Peptides Can Be Employed to Study Native-like Aggregation Intermediate States. CheBioChem 2011, 12, 407–423. [Google Scholar] [CrossRef] [PubMed]
- Ferrera, D.; Mazzaro, N.; Canale, C.; Gasparini, L. Resting Microglia React to Aβ42 Fibrils but Do Not Detect Oligomers or Oligomer-Induced Neuronal Damage. Neurobiol. Aging 2014, 35, 2444–2457. [Google Scholar] [CrossRef]
- Zhao, Y.; Lukiw, W.J. Microbiome-Generated Amyloid and Potential Impact on Amyloidogenesis in Alzheimer’s Disease (AD). J. Naure Sci. 2015, 1, e138. [Google Scholar] [CrossRef] [Green Version]
- Bello-Medina, P.C.; Sánchez-Carrasco, L.; González-Ornelas, N.R.; Jeffery, K.J.; Ramírez-Amaya, V. Differential Effects of Spaced vs. Massed Training in Long-Term Object-Identity and Object-Location Recognition Memory. Behav. Brain Res. 2013, 250, 102–113. [Google Scholar] [CrossRef]
- Bello-Medina, P.C.; Prado-Alcalá, R.A.; Rivas-Arancibia, S. Effect of Ozone Exposure on Dendritic Spines of CA1 Pyramidal Neurons of the Dorsal Hippocampus and on Object–Place Recognition Memory in Rats. Neuroscience 2019, 402, 1–10. [Google Scholar] [CrossRef]
- Giménez-Llort, L.; Blázquez, G.; Cañete, T.; Johansson, B.; Oddo, S.; Tobeña, A.; LaFerla, F.M.; Fernández-Teruel, A. Modeling Behavioral and Neuronal Symptoms of Alzheimer’s Disease in Mice: A Role for Intraneuronal Amyloid. Neurosci. Biobehav. Rev. 2007, 31, 125–147. [Google Scholar] [CrossRef]
- Gómez-Chacón, B.; Morillas, E.; Gallo, M. Altered Perirhinal Cortex Activity Patterns during Taste Neophobia and Their Habituation in Aged Rats. Behav. Brain Res. 2015, 281, 245–249. [Google Scholar] [CrossRef]
- Thiel, C.M.; Huston, J.P.S.R. Hippocampal Acetylcholine and Habituation Learning. Neuroscience 1998, 85, 1253–1262. [Google Scholar] [CrossRef]
- Hoesen, G.W.V.A.N.; Augustinack, J.C.; Dierking, J.; Redman, S.J.; Thangavel, R. The Parahippocampal Gyrus in Alzheimer’s Disease, Clinical and Preclinical Neuroanatomical Correlates. Ann. N. Y. Acad. Sci. 2006, 911, 254–274. [Google Scholar] [CrossRef] [PubMed]
- Reikvam, D.H.; Erofeev, A.; Sandvik, A.; Grcic, V.; Jahnsen, F.L.; Gaustad, P.; McCoy, K.D.; Macpherson, A.J.; Meza-Zepeda, L.A.; Johansen, F.-E. Depletion of Murine Intestinal Microbiota: Effects on Gut Mucosa and Epithelial Gene Expression. PLoS ONE 2011, 6, e17996. [Google Scholar] [CrossRef] [Green Version]
- Vogt, N.M.; Kerby, R.L.; Dill-McFarland, K.A.; Harding, S.J.; Merluzzi, A.P.; Johnson, S.C.; Carlsson, C.M.; Asthana, S.; Zetterberg, H.; Blennow, K.; et al. Gut Microbiome Alterations in Alzheimer’s Disease. Sci. Rep. 2017, 7, 13537. [Google Scholar] [CrossRef] [PubMed]
- Binda, C.; Lopetuso, L.R.; Rizzatti, G.; Gibiino, G.; Cennamo, V.; Gasbarrini, A. Actinobacteria: A Relevant Minority for the Maintenance of Gut Homeostasis. Dig. Liver Dis. 2018, 50, 421–428. [Google Scholar] [CrossRef] [PubMed]
- Zhang, C.; Li, S.; Yang, L.; Huang, P.; Li, W.; Wang, S.; Zhao, G.; Zhang, M.; Pang, X.; Yan, Z.; et al. Structural Modulation of Gut Microbiota in Life-Long Calorie-Restricted Mice. Nat. Commun. 2013, 4, 2163. [Google Scholar] [CrossRef] [Green Version]
- Tulstrup, M.V.L.; Christensen, E.G.; Carvalho, V.; Linninge, C.; Ahrné, S.; Højberg, O.; Licht, T.R.; Bahl, M.I. Antibiotic Treatment Affects Intestinal Permeability and Gut Microbial Composition in Wistar Rats Dependent on Antibiotic Class. PLoS ONE 2015, 10, e0144854. [Google Scholar] [CrossRef]
- Vrieze, A.; Out, C.; Fuentes, S.; Jonker, L.; Reuling, I.; Kootte, R.S.; Van Nood, E.; Holleman, F.; Knaapen, M.; Romijn, J.A.; et al. Impact of Oral Vancomycin on Gut Microbiota, Bile Acid Metabolism, and Insulin Sensitivity. J. Hepatol. 2014, 60, 824–831. [Google Scholar] [CrossRef]
- Morgun, A.; Dzutsev, A.; Dong, X.; Greer, R.L.; Sexton, D.J.; Ravel, J.; Schuster, M.; Hsiao, W.; Matzinger, P.; Shulzhenko, N. Uncovering Effects of Antibiotics on the Host and Microbiota Using Transkingdom Gene Networks. Gut 2015, 64, 1732–1743. [Google Scholar] [CrossRef] [Green Version]
- Rodrigues, R.R.; Greer, R.L.; Dong, X.; DSouza, K.N.; Gurung, M.; Wu, J.Y.; Morgun, A.; Shulzhenko, N. Antibiotic-Induced Alterations in Gut Microbiota Are Associated with Changes in Glucose Metabolism in Healthy Mice. Front. Microbiol. 2017, 8, 2306. [Google Scholar] [CrossRef]
- Mariat, D.; Firmesse, O.; Levenez, F.; Guimarǎes, V.D.; Sokol, H.; Doré, J.; Corthier, G.; Furet, J.P. The Firmicutes/Bacteroidetes Ratio of the Human Microbiota Changes with Age. BMC Microbiol. 2009, 9, 123. [Google Scholar] [CrossRef] [PubMed]
- Brandscheid, C.; Schuck, F.; Reinhardt, S.; Schäfer, K.H.; Pietrzik, C.U.; Grimm, M.; Hartmann, T.; Schwiertz, A.; Endres, K. Altered Gut Microbiome Composition and Tryptic Activity of the 5xFAD Alzheimer’s Mouse Model. J. Alzheimer’s Dis. 2017, 56, 775–788. [Google Scholar] [CrossRef] [PubMed]
- Romero, R.; Hassan, S.S.; Gajer, P.; Tarca, A.L.; Fadrosh, D.W.; Nikita, L.; Galuppi, M.; Lamont, R.F.; Chaemsaithong, P.; Miranda, J.; et al. The Composition and Stability of the Vaginal Microbiota of Normal Pregnant Women Is Different from That of Non-Pregnant Women. Microbiome 2014, 2, 4. [Google Scholar] [CrossRef] [PubMed] [Green Version]
- Elovitz, M.A.; Gajer, P.; Riis, V.; Brown, A.G.; Humphrys, M.S.; Holm, J.B.; Ravel, J. Cervicovaginal Microbiota and Local Immune Response Modulate the Risk of Spontaneous Preterm Delivery. Nat. Commun. 2019, 10, 1305. [Google Scholar] [CrossRef] [PubMed] [Green Version]
- Corona-Cervantes, K.; García-González, I.; Villalobos-Flores, L.E.; Hernández-Quiroz, F.; Piña-Escobedo, A.; Hoyo-Vadillo, C.; Rangel-Calvillo, M.N.; García-Mena, J. Human Milk Microbiota Associated with Early Colonization of the Neonatal Gut in Mexican Newborns. Peer J. 2020, 8, e9205. [Google Scholar] [CrossRef]
- Bo, T.; Zhang, X.Y.; Kohl, K.D.; Wen, J.; Tian, S.J.; Wang, D.H. Coprophagy Prevention Alters Microbiome, Metabolism, Neurochemistry, and Cognitive Behavior in a Small Mammal. ISME J. 2020, 14, 2625–2645. [Google Scholar] [CrossRef]
- Mezö, C.; Dokalis, N.; Mossad, O.; Staszewski, O.; Neuber, J.; Yilmaz, B.; Schnepf, D.; De Agüero, M.G.; Ganal-vonarburg, S.C.; Macpherson, A.J.; et al. Different Effects of Constitutive and Induced Microbiota Modulation on Microglia in a Mouse Model of Alzheimer’s Disease. Acta Neuropathol. Commun. 2020, 8, 119. [Google Scholar] [CrossRef]
- Minter, M.R.; Zhang, C.; Leone, V.; Ringus, D.L.; Zhang, X.; Oyler-Castrillo, P.; Musch, M.W.; Liao, F.; Ward, J.F.; Holtzman, D.M.; et al. Antibiotic-Induced Dysbiosiss in Gut Microbial Diversity Influences Neuro-Inflammation and Amyloidosis in a Murine Model of Alzheimer’s Disease. Sci. Rep. 2016, 6, 30028. [Google Scholar] [CrossRef]
- Al Alam, D.; Danopoulos, S.; Grubbs, B.; Ali, N.; MacAogain, M.; Chotirmall, S.H.; Warburton, D.; Gaggar, A.; Ambalavanan, N.; Lal, C.V. Human Fetal Lungs Harbor a Microbiome Signature. Am. J. Respir Crit Care Med. 2020, 201, 1002–1006. [Google Scholar] [CrossRef] [Green Version]
- Stover, K.R.; Campbell, M.A.; Van Winssen, C.M.; Brown, R.E. Analysis of Motor Function in 6-Month-Old Male and Female 3xTg-AD Mice. Behav. Brain Res. 2015, 281, 16–23. [Google Scholar] [CrossRef]
- Garvock-de Montbrun, T.; Fertan, E.; Stover, K.; Brown, R.E. Motor Deficits in 16-Month-Old Male and Female 3xTg-AD Mice. Behav. Brain Res. 2019, 356, 305–313. [Google Scholar] [CrossRef] [PubMed]
- Ontiveros-Torres, M.Á.; Labra-Barrios, M.L.; Díaz-Cintra, S.; Aguilar-Vázquez, A.R.; Moreno-Campuzano, S.; Flores-Rodríguez, P.; Luna-Herrera, C.; Mena, R.; Perry, G.; Florán-Garduño, B.; et al. Fibrillar Amyloid-β Accumulation Triggers an Inflammatory Mechanism Leading to Hyperphosphorylation of the Carboxyl-Terminal End of Tau Polypeptide in the Hippocampal Formation of the 3×Tg-AD Transgenic Mouse. J. Alzheimer’s Dis. 2016, 52, 243–269. [Google Scholar] [CrossRef] [PubMed]
- Mastrangelo, M.A.; Bowers, W.J. Detailed Immunohistochemical Characterization of Temporal and Spatial Progression of Alzheimer’ s Disease-Related Pathologies in Male Triple-Transgenic Mice. BMC Neurosci. 2008, 31, 81. [Google Scholar] [CrossRef] [Green Version]
- Hirata-Fukae, C.; Li, H.F.; Hoe, H.S.; Gray, A.J.; Minami, S.S.; Hamada, K.; Niikura, T.; Hua, F.; Tsukagoshi-Nagai, H.; Horikoshi-Sakuraba, Y.; et al. Females Exhibit More Extensive Amyloid, but Not Tau, Pathology in an Alzheimer Transgenic Model. Brain Res. 2008, 1216, 92–103. [Google Scholar] [CrossRef] [PubMed]
- Amedei, A.; Barceló-Coblijn, G. Editorial of Special Issue “ The Interplay of Microbiome and Immune Response in Health and Diseases”. Int. J. Mol. Sci. 2019, 20, 3708. [Google Scholar] [CrossRef] [PubMed] [Green Version]
- Dinan, T.G.; Cryan, J.F. The Micriobiome-Gut-Brain Axis in Health and Disease. Gastroenterol. Clin. N. Am. 2021, 46, 77–89. [Google Scholar] [CrossRef] [PubMed] [Green Version]
- Soto-martin, E.C.; Warnke, I.; Farquharson, F.M.; Christodoulou, M.; Horgan, G.; Derrien, M.; Faurie, J.; Flint, H.J.; Duncan, S.H. Vitamin Biosynthesis by Human Gut Butyrate-Producing Bacteria and Cross-Feeding in Synthetic Microbial Communities. MBio 2020, 11, e00886-20. [Google Scholar] [CrossRef]
- Vinolo, M.A.R.; Rodrigues, H.G.; Nachbar, R.T.; Curi, R. Regulation of Inflammation by Short Chain Fatty Acids. Nutrients 2011, 3, 858–876. [Google Scholar] [CrossRef] [Green Version]
- Mirzaei, R.; Bouzari, B.; Hosseini-fard, S.R.; Mazaheri, M.; Keyvani, H.; Zamani, F.; Yousefimashouf, R.; Karampoor, S. Role of Microbiota-Derived Short-Chain Fatty Acids in Nervous System Disorders. Biomed. Pharmacother. 2021, 139, 111661. [Google Scholar] [CrossRef]
- Vinolo, M.A.R.; Rodrigues, H.G.; Hatanaka, E.; Sato, F.T.; Sampaio, S.C.; Curi, R. Suppressive Effect of Short-Chain Fatty Acids on Production of Proinflammatory Mediators by Neutrophils. J. Nutr. Biochem. 2011, 22, 849–855. [Google Scholar] [CrossRef]
- Marizzoni, M.; Cattaneo, A.; Mirabelli, P.; Festari, C.; Lopizzo, N.; Nicolosi, V.; Mombelli, E.; Mazzelli, M.; Luongo, D.; Naviglio, D.; et al. Short-Chain Fatty Acids and Lipopolysaccharide as Mediators between Gut Dysbiosis and Amyloid Pathology in Alzheimer’s Disease. J. Alzheimer’s Dis. 2020, 78, 683–697. [Google Scholar] [CrossRef] [PubMed]
- Colombo, A.V.; Sadler, R.K.; Llovera, G.; Singh, V.; Roth, S.; Heindl, S.; Monasor, L.S.; Verhoeven, A.; Peters, F.; Parhizkar, S.; et al. Microbiota-Derived Short Chain Fatty Acids Modulate Microglia and Promote A b Plaque Deposition. Elife 2021, 10, e59826. [Google Scholar] [CrossRef] [PubMed]
- MacFabe, D.F.; Rodríguez-Capote, K.; Hoffman, J.E.; Franklin, A.E.; Mohammad-Asef, Y.; Taylor, A.R.; Boon, F.; Cain, D.P.; Kavaliers, M.; Possmayer, F.; et al. A Novel Rodent Model of Autism: Intraventricular Infusions of Propionic Acid Increase Locomotor Activity and Induce Neuroinflammation and Oxidative Stress in Discrete Regions of Adult Rat Brain. Am. J. Biochem. Biotechnol. 2008, 4, 146–166. [Google Scholar] [CrossRef]
- Wood, P.L.; Medicherla, S.; Sheikh, N.; Terry, B.; Phillipps, A.; Kaye, J.A.; Quinn, J.F.; Woltjer, R.L. Targeted Lipidomics of Fontal Cortex and Plasma Diacylglycerols (DAG) in Mild Cognitive Impairment and Alzheimer’s Disease: Validation of DAG Accumulation Early in the Pathophysiology of Alzheimer’s Disease. J. Alzheimer’s Dis. 2015, 48, 537–546. [Google Scholar] [CrossRef] [Green Version]
- Yu, L.C.-H. Microbiota Dysbiosis and Barrier Dysfunction in Inflammatory Bowel Disease and Colorectal Cancers: Exploring a Common Ground Hypothesis. J. Biomed. Sci. 2018, 25, 79. [Google Scholar] [CrossRef] [PubMed] [Green Version]
- Bulgart, H.R.; Neczypor, E.W.; Wold, L.E.; Mackos, A.R. Microbial Involvement in Alzheimer Disease Development and Progression. Mol. Neurodegener. 2020, 15, 42. [Google Scholar] [CrossRef]
- Zhan, X.; Stamova, B.; Jin, L.-W.; DeCarli, C.; Phinney, B.; Sharp, F.R. Gram-Negative Bacterial Molecules Associate with Alzheimer Disease Pathology. Neurology 2016, 87, 2324–2332. [Google Scholar] [CrossRef] [Green Version]
- Qin, L.; Wu, X.; Block, M.L.; Liu, Y.; Breese, G.R.; Hong, J.-S.; Knapp, D.J.; Crews, F.T. Systemic LPS Causes Chronic Neuroinflammation and Progressive Neurodegeneration. Glia 2007, 55, 453–462. [Google Scholar] [CrossRef] [Green Version]
- Yoshii, K.; Hosomi, K.; Sawane, K.; Kunisawa, J. Metabolism of Dietary and Microbial Vitamin B Family in the Regulation of Host Immunity. Front. Nutr. 2019, 6, 48. [Google Scholar] [CrossRef] [Green Version]
- McCarty, M.F.; DiNicolantonio, J.J. Neuroprotective Potential of High-Dose Biotin. Med. Hypotheses 2017, 109, 145–149. [Google Scholar] [CrossRef]
- Amtul, Z.; Westaway, D.; Cechetto, D.F.; Rozmahel, R.F. Oleic Acid Ameliorates Amyloidosis in Cellular and Mouse Models of Alzheimer’s Disease. Brain Pathol. 2011, 21, 321–329. [Google Scholar] [CrossRef]
- Kwon, B.; Lee, H.K.; Querfurth, H.W. Oleate Prevents Palmitate-Induced Mitochondrial Dysfunction, Insulin Resistance and Inflammatory Signaling in Neuronal Cells. Biochim. Biophys. Acta 2014, 1843, 1402–1413. [Google Scholar] [CrossRef] [PubMed] [Green Version]
- Strandwitz, P. Neurotransmitter Modulation by the Gut Microbiota Philip. Brain Res. 2019, 1693, 128–133. [Google Scholar] [CrossRef]
- Chen, Y.; Xu, J.; Chen, Y. Regulation of Neurotransmitters by the Gut Microbiota and Effects on Cognition in Neurological Disorders. Nutrients 2021, 13, 2099. [Google Scholar] [CrossRef]
- Bonfili, L.; Cecarini, V.; Gogoi, O.; Berardi, S.; Scarpona, S.; Angeletti, M.; Rossi, G.; Eleuteri, A.M. Gut Microbiota Manipulation through Probiotics Oral Administration Restores Glucose Homeostasis in a Mouse Model of Alzheimer’s Disease. Neurobiol. Aging 2020, 87, 35–43. [Google Scholar] [CrossRef] [PubMed]
- Ochoa-Repáraz, J.; Mielcarz, D.W.; Ditrio, L.E.; Burroughs, A.R.; Foureau, D.M.; Haque-Begum, S.; Kasper, L.H. Role of Gut Commensal Microflora in the Development of Experimental Autoimmune Encephalomyelitis. J. Immunol. 2009, 183, 6041–6050. [Google Scholar] [CrossRef] [Green Version]
- Rakoff-Nahoum, S.; Paglino, J.; Eslami-Varzaneh, F.; Edberg, S.; Medzhitov, R. Recognition of Commensal Microflora by Toll-like Receptors Is Required for Intestinal Homeostasis. Cell 2004, 118, 229–241. [Google Scholar] [CrossRef] [PubMed] [Green Version]
- Greer, R.L.; Dong, X.; Moraes, A.C.F.; Zielke, R.A.; Fernandes, G.R.; Peremyslova, E.; Vasquez-Perez, S.; Schoenborn, A.A.; Gomes, E.P.; Pereira, A.C.; et al. Akkermansia Muciniphila Mediates Negative Effects of IFNγ on Glucose Metabolism. Nat. Commun. 2016, 7, 13329. [Google Scholar] [CrossRef]
- García-Mena, J.; Murugesan, S.; Pérez-Muñoz, A.A.; García-Espitia, M.; Maya, O.; Jacinto-Montiel, M.; Monsalvo-Ponce, G.; Piña-Escobedo, A.; Domínguez-Malfavón, L.; Gómez-Ramírez, M.; et al. Airborne Bacterial Diversity from the Low Atmosphere of Greater Mexico City. Microb. Ecol. 2016, 72, 70–84. [Google Scholar] [CrossRef]
- Bolger, A.M.; Lohse, M.; Usadel, B. Trimmomatic: A Flexible Trimmer for Illumina Sequence Data. Bioinformatics 2014, 30, 2114–2120. [Google Scholar] [CrossRef] [Green Version]
- Bolyen, E.; Rideout, J.R.; Dillon, M.R.; Bokulich, N.A.; Abnet, C.C.; Al-Ghalith, G.A.; Alexander, H.; Alm, E.J.; Arumugam, M.; Asnicar, F.; et al. Reproducible, Interactive, Scalable and Extensible Microbiome Data Science Using QIIME 2. Nat. Biotechnol. 2019, 37, 852–857. [Google Scholar] [CrossRef] [PubMed]
- Quast, C.; Pruesse, E.; Yilmaz, P.; Gerken, J.; Schweer, T.; Yarza, P.; Peplies, J.; Glöckner, F.O. The SILVA Ribosomal RNA Gene Database Project: Improved Data Processing and Web-Based Tools. Nucleic Acids Res. 2013, 41, 590–596. [Google Scholar] [CrossRef] [PubMed]
- McMurdie, P.J.; Holmes, S. Phyloseq: An R Package for Reproducible Interactive Analysis and Graphics of Microbiome Census Data. PLoS ONE 2013, 8, e61217. [Google Scholar] [CrossRef] [PubMed] [Green Version]
- Segata, N.; Izard, J.; Waldron, L.; Gevers, D.; Miropolsky, L.; Garrett, W.S.; Huttenhower, C. Metagenomic Biomarker Discovery and Explanation. Genome Biol. 2011, 12, R60. [Google Scholar] [CrossRef] [PubMed] [Green Version]
- Paxinos, G.; Franklin, K. The Mouse Brain in Stereotaxic Coordinates, 2nd ed.; Academic: San Diego, CA, USA, 2001. [Google Scholar]
- González-Franco, D.A.; Bello-Medina, P.C.; Serafín, N.; Prado-Alcalá, R.A.; Quirarte, G.L. Effects of Anisomycin Infusions into the Dorsal Striatum on Memory Consolidation of Intense Training and Neurotransmitter Activity. Brain Res. Bull. 2019, 150, 250–260. [Google Scholar] [CrossRef]
- Langille, M.G.I.; Zaneveld, J.; Caporaso, J.G.; Mcdonald, D.; Knights, D.; Reyes, J.A.; Clemente, J.C.; Burkepile, D.E.; Thurber, R.L.V.; Knight, R.; et al. Predictive Functional Profiling of Microbial Communities Using 16s RRnA Marker Gene Sequences. Nat. Biotechnol. 2013, 31, 814–823. [Google Scholar] [CrossRef]
- National Research Council. Guide for the Care and Use of Laboratory Animals, 8th ed.; National Academy of Sciences: Washington, DC, USA, 2011. [Google Scholar]


Publisher’s Note: MDPI stays neutral with regard to jurisdictional claims in published maps and institutional affiliations. |
© 2022 by the authors. Licensee MDPI, Basel, Switzerland. This article is an open access article distributed under the terms and conditions of the Creative Commons Attribution (CC BY) license (https://creativecommons.org/licenses/by/4.0/).
Share and Cite
Bello-Medina, P.C.; Corona-Cervantes, K.; Zavala Torres, N.G.; González, A.; Pérez-Morales, M.; González-Franco, D.A.; Gómez, A.; García-Mena, J.; Díaz-Cintra, S.; Pacheco-López, G. Chronic-Antibiotics Induced Gut Microbiota Dysbiosis Rescues Memory Impairment and Reduces β-Amyloid Aggregation in a Preclinical Alzheimer’s Disease Model. Int. J. Mol. Sci. 2022, 23, 8209. https://doi.org/10.3390/ijms23158209
Bello-Medina PC, Corona-Cervantes K, Zavala Torres NG, González A, Pérez-Morales M, González-Franco DA, Gómez A, García-Mena J, Díaz-Cintra S, Pacheco-López G. Chronic-Antibiotics Induced Gut Microbiota Dysbiosis Rescues Memory Impairment and Reduces β-Amyloid Aggregation in a Preclinical Alzheimer’s Disease Model. International Journal of Molecular Sciences. 2022; 23(15):8209. https://doi.org/10.3390/ijms23158209
Chicago/Turabian StyleBello-Medina, Paola C., Karina Corona-Cervantes, Norma Gabriela Zavala Torres, Antonio González, Marcel Pérez-Morales, Diego A. González-Franco, Astrid Gómez, Jaime García-Mena, Sofía Díaz-Cintra, and Gustavo Pacheco-López. 2022. "Chronic-Antibiotics Induced Gut Microbiota Dysbiosis Rescues Memory Impairment and Reduces β-Amyloid Aggregation in a Preclinical Alzheimer’s Disease Model" International Journal of Molecular Sciences 23, no. 15: 8209. https://doi.org/10.3390/ijms23158209