
Sphingosine Phosphate Lyase Is Upregulated in Duchenne Muscular Dystrophy, and Its Inhibition Early in Life Attenuates Inflammation and Dystrophy in Mdx Mice

 , ,
, ,
Abstract
: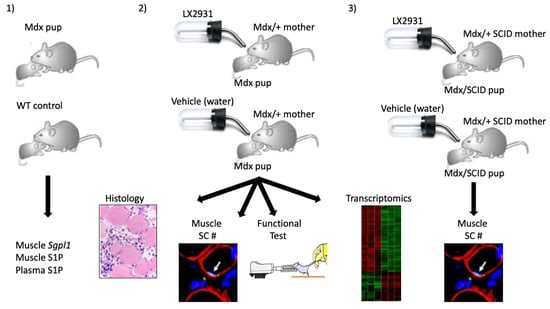
1. Introduction
2. Results
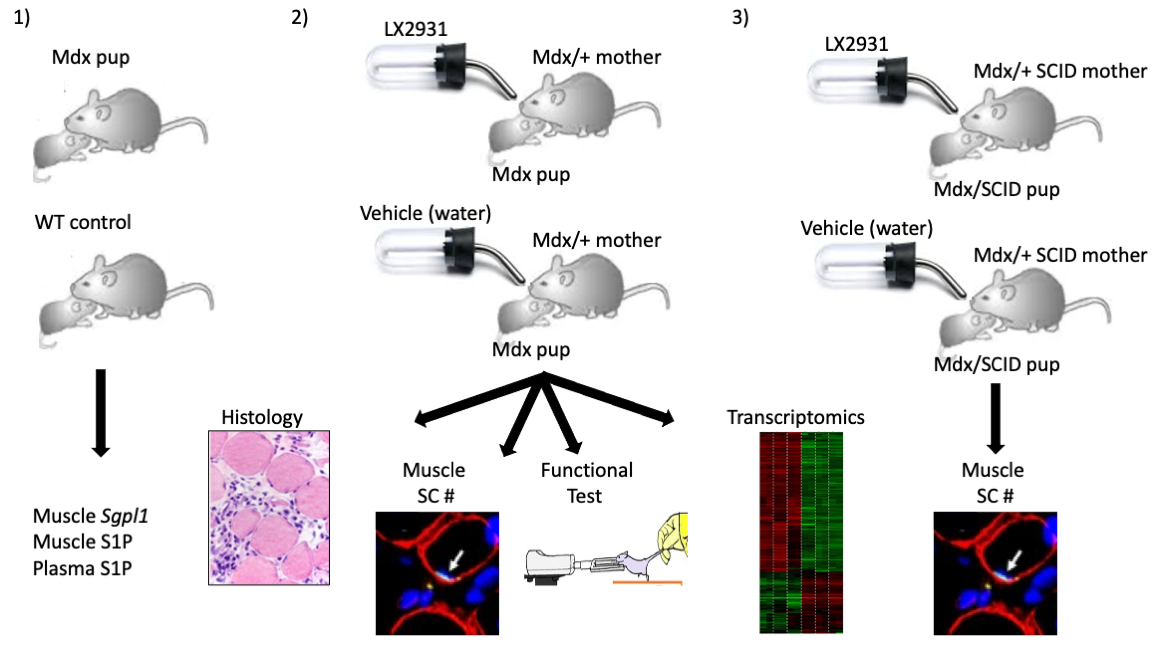
2.1. SPL Expression Is Increased in DMD Muscles Compared to Age-Matched Controls
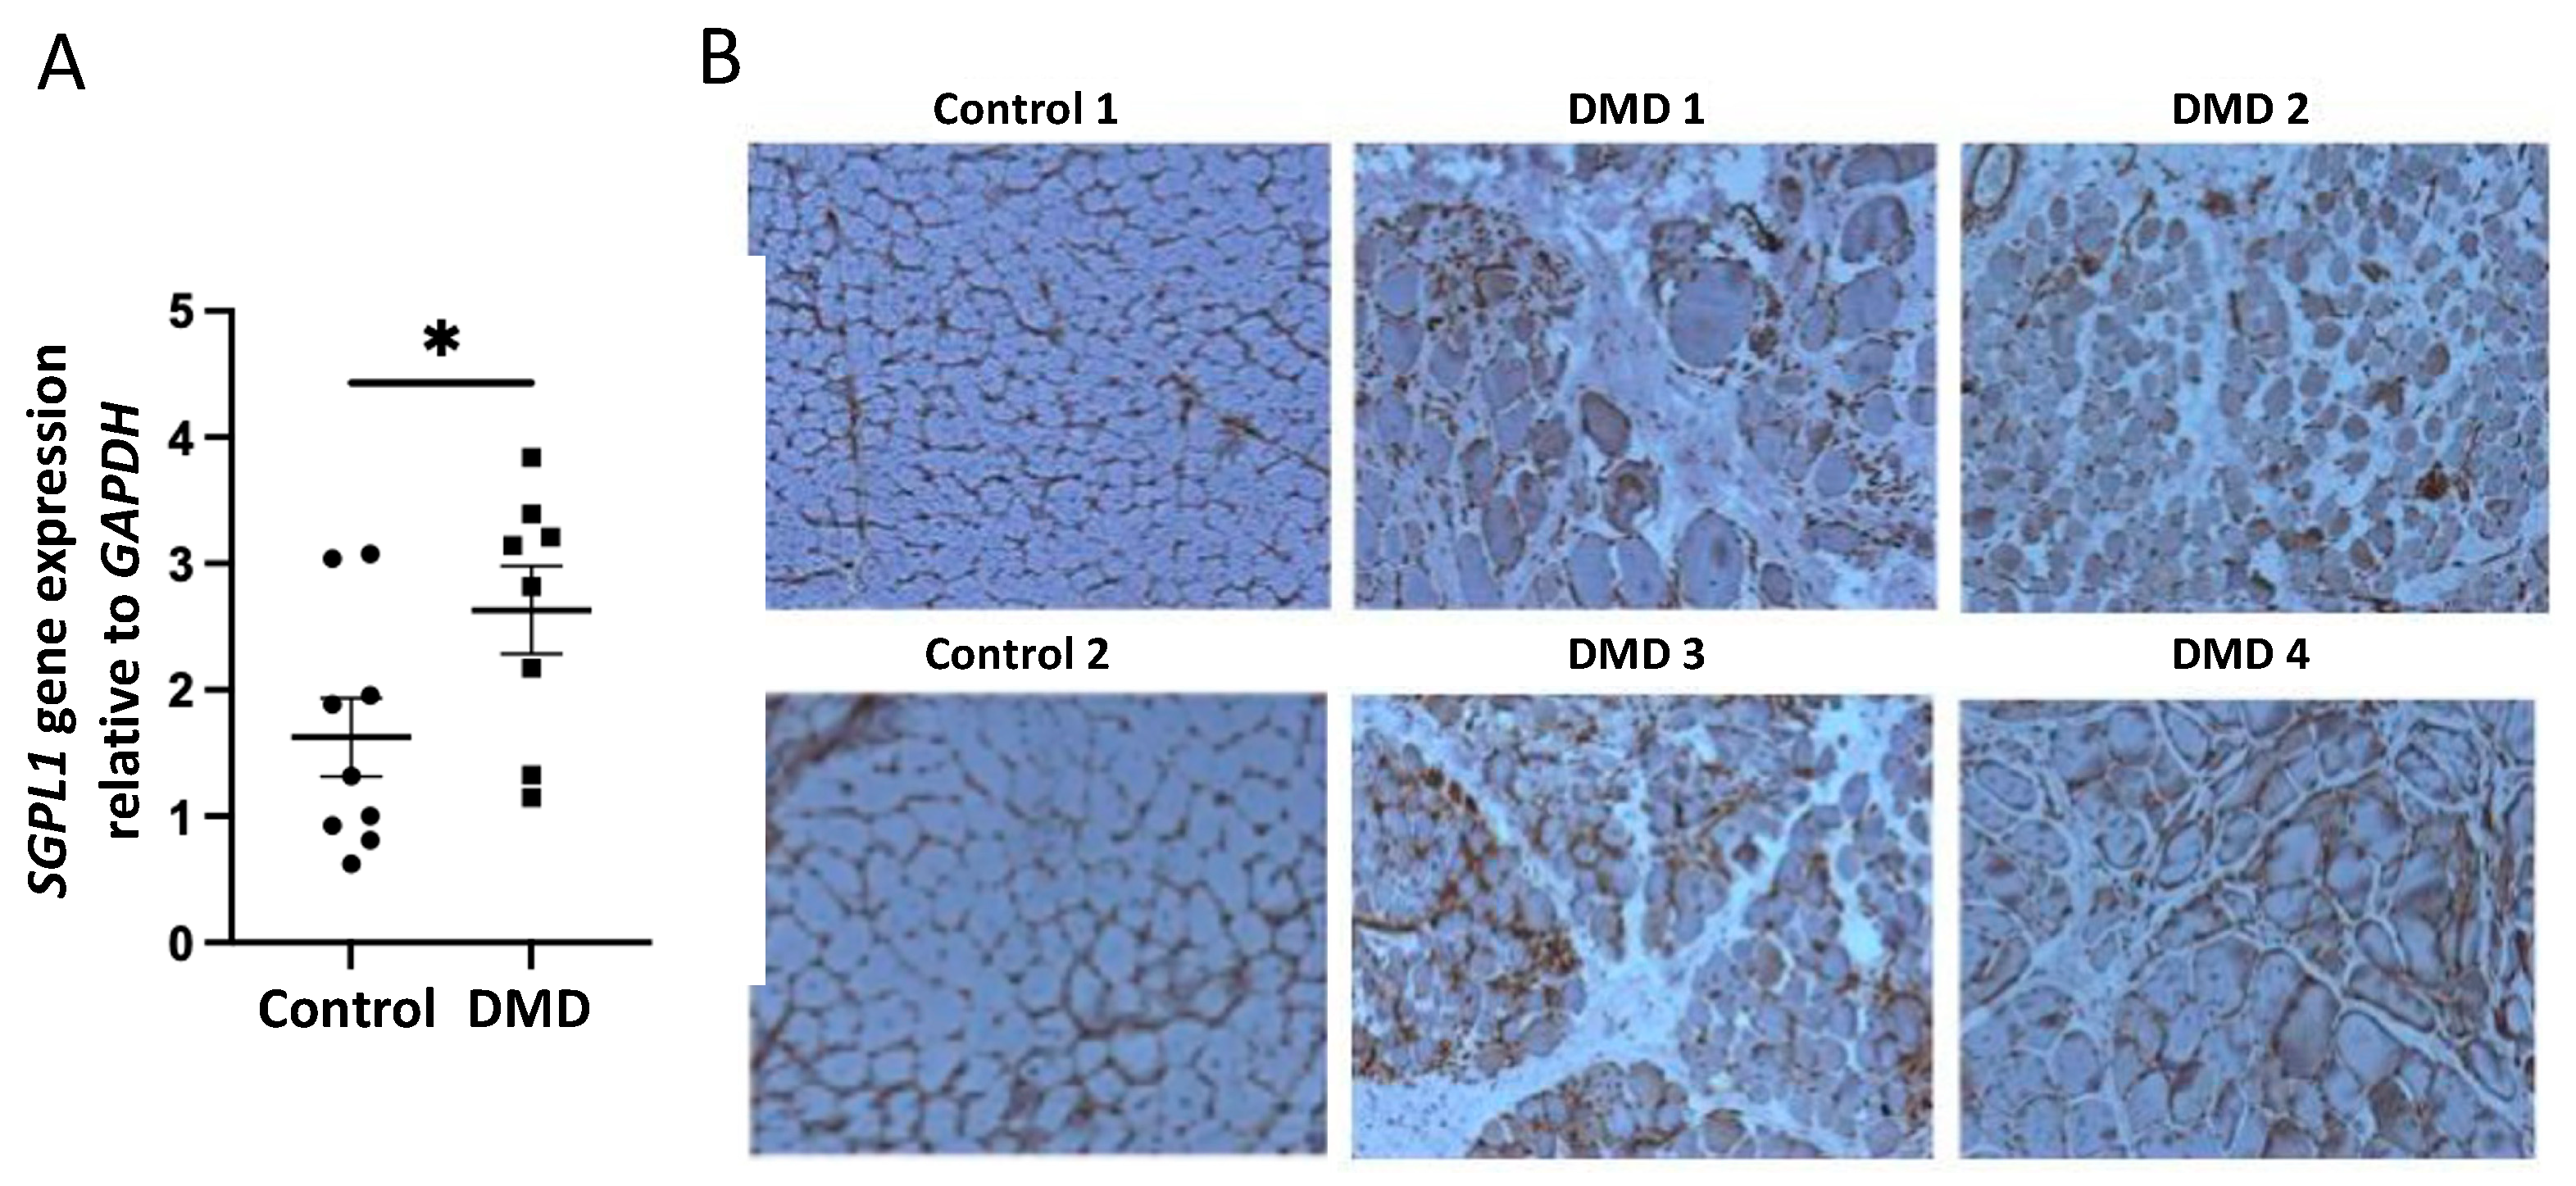
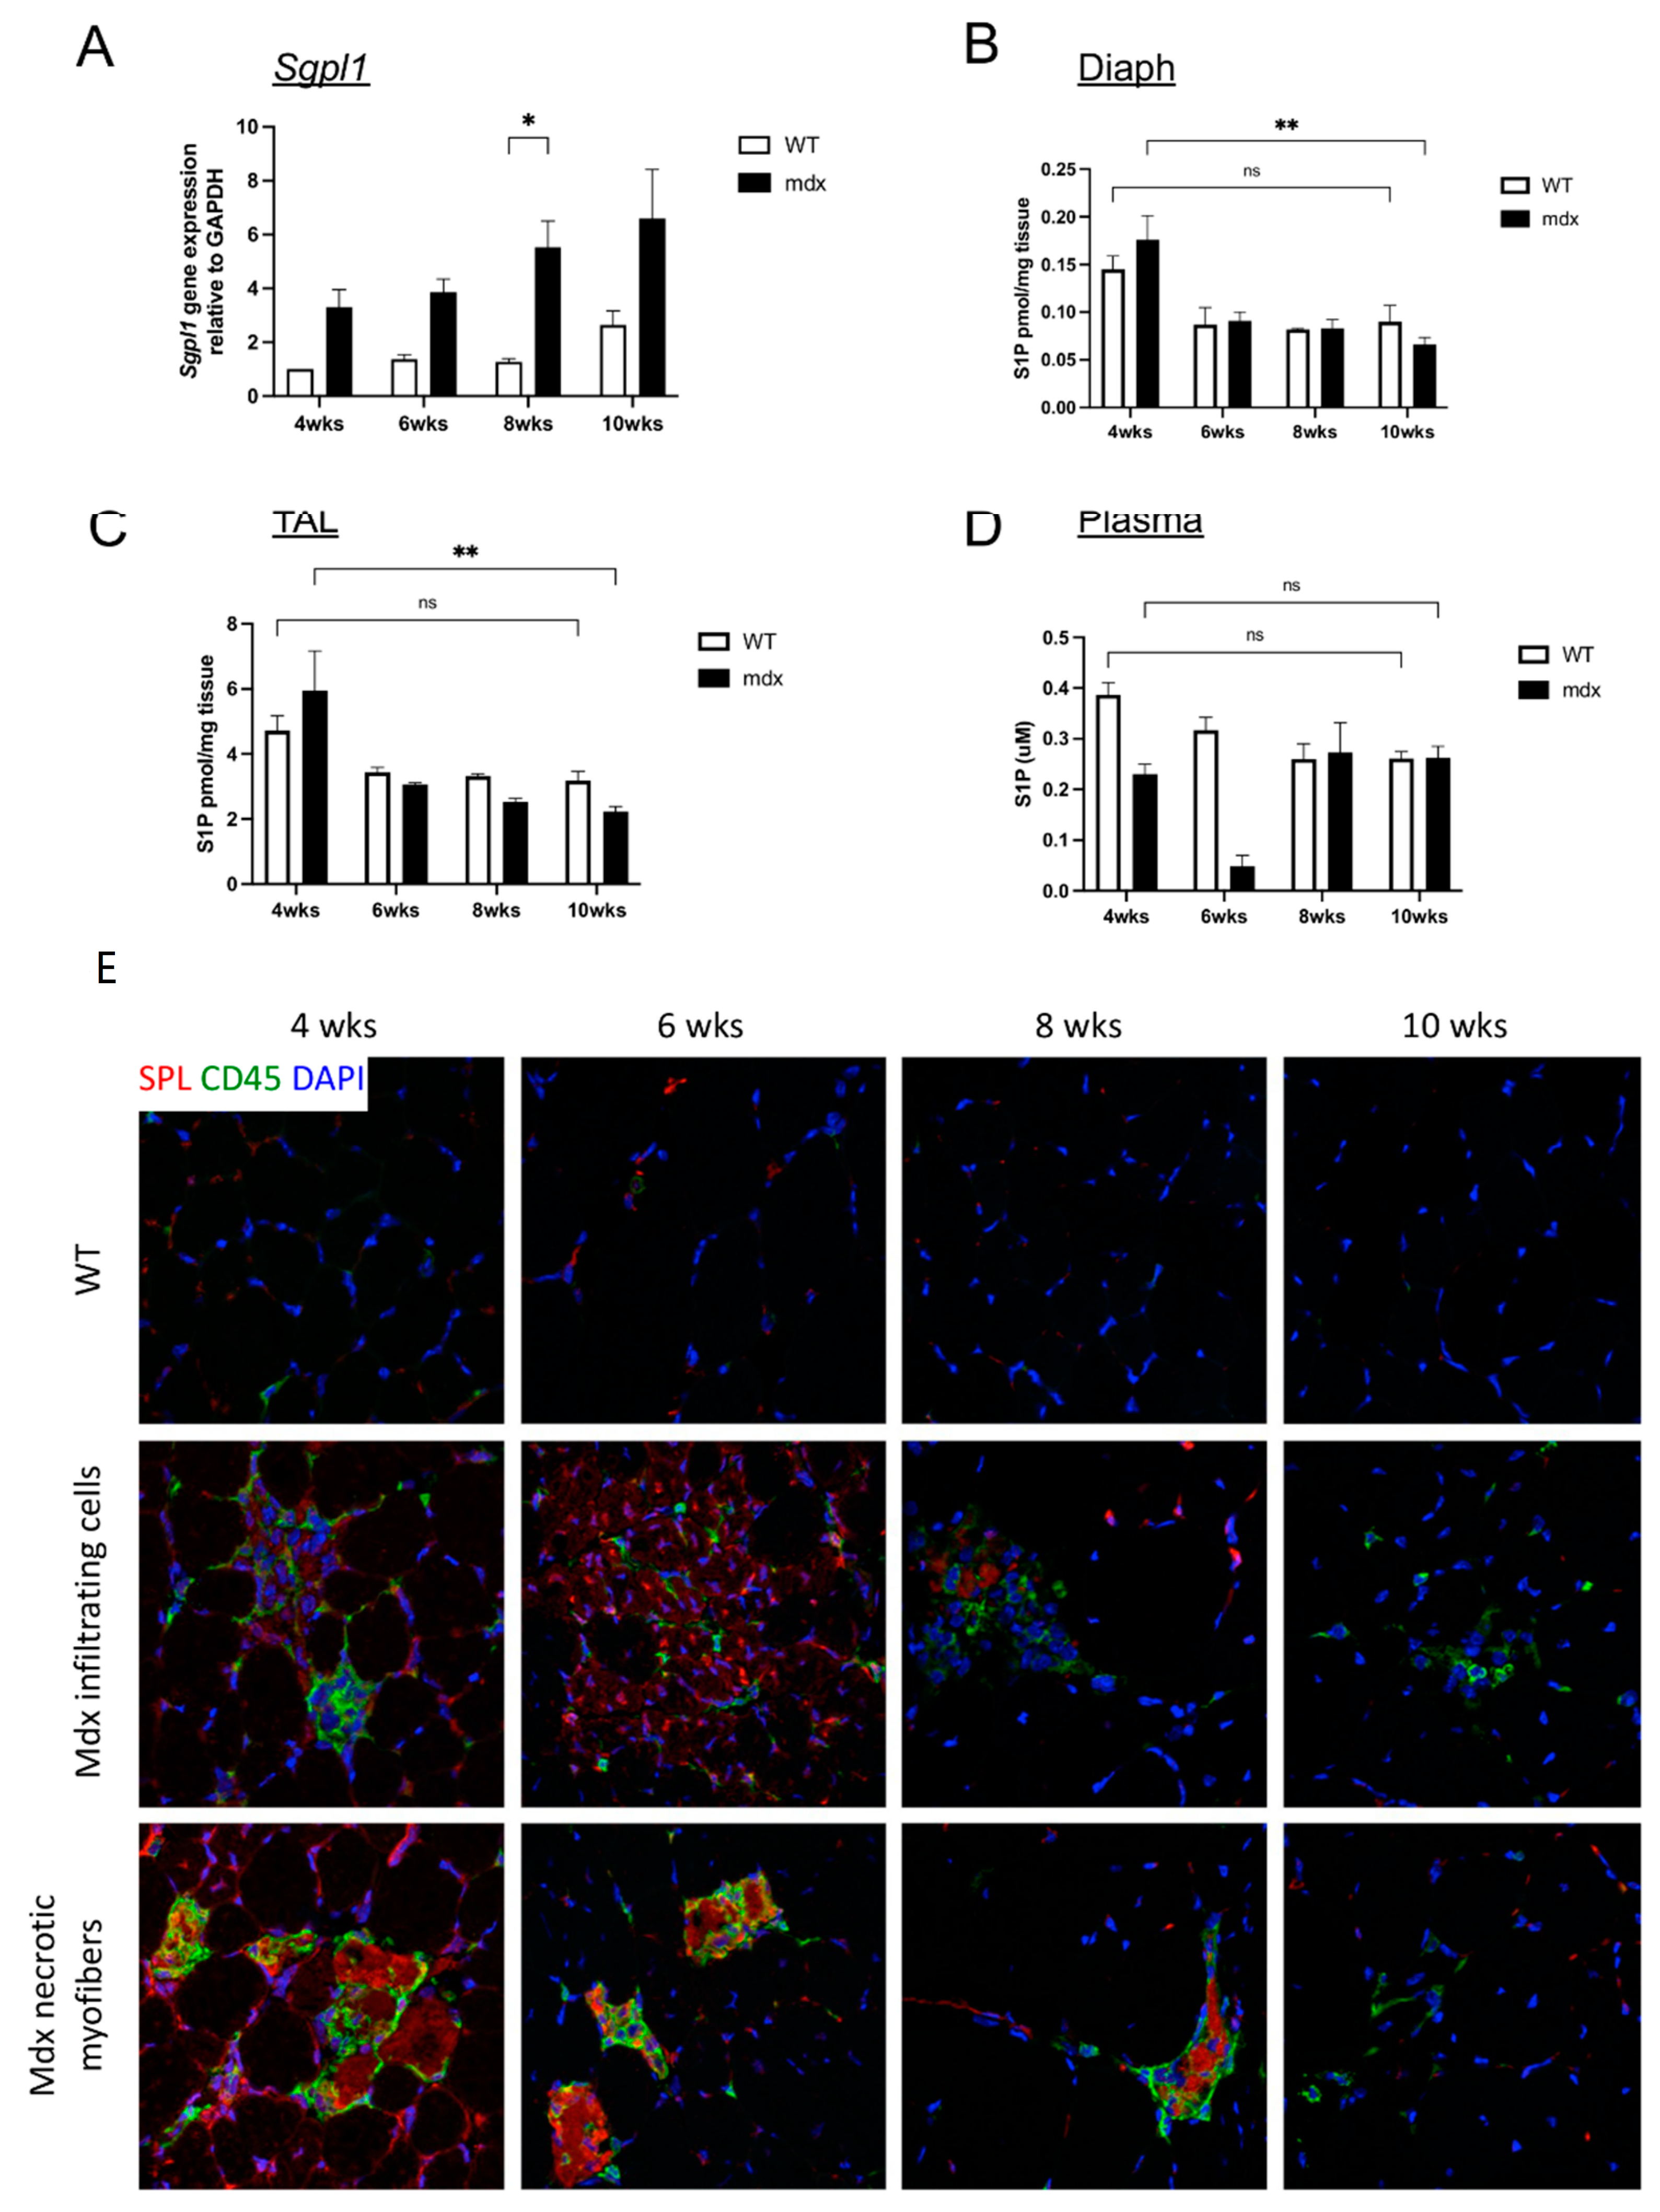
2.2. S1P Metabolism Is Altered in Juvenile Mdx Mice
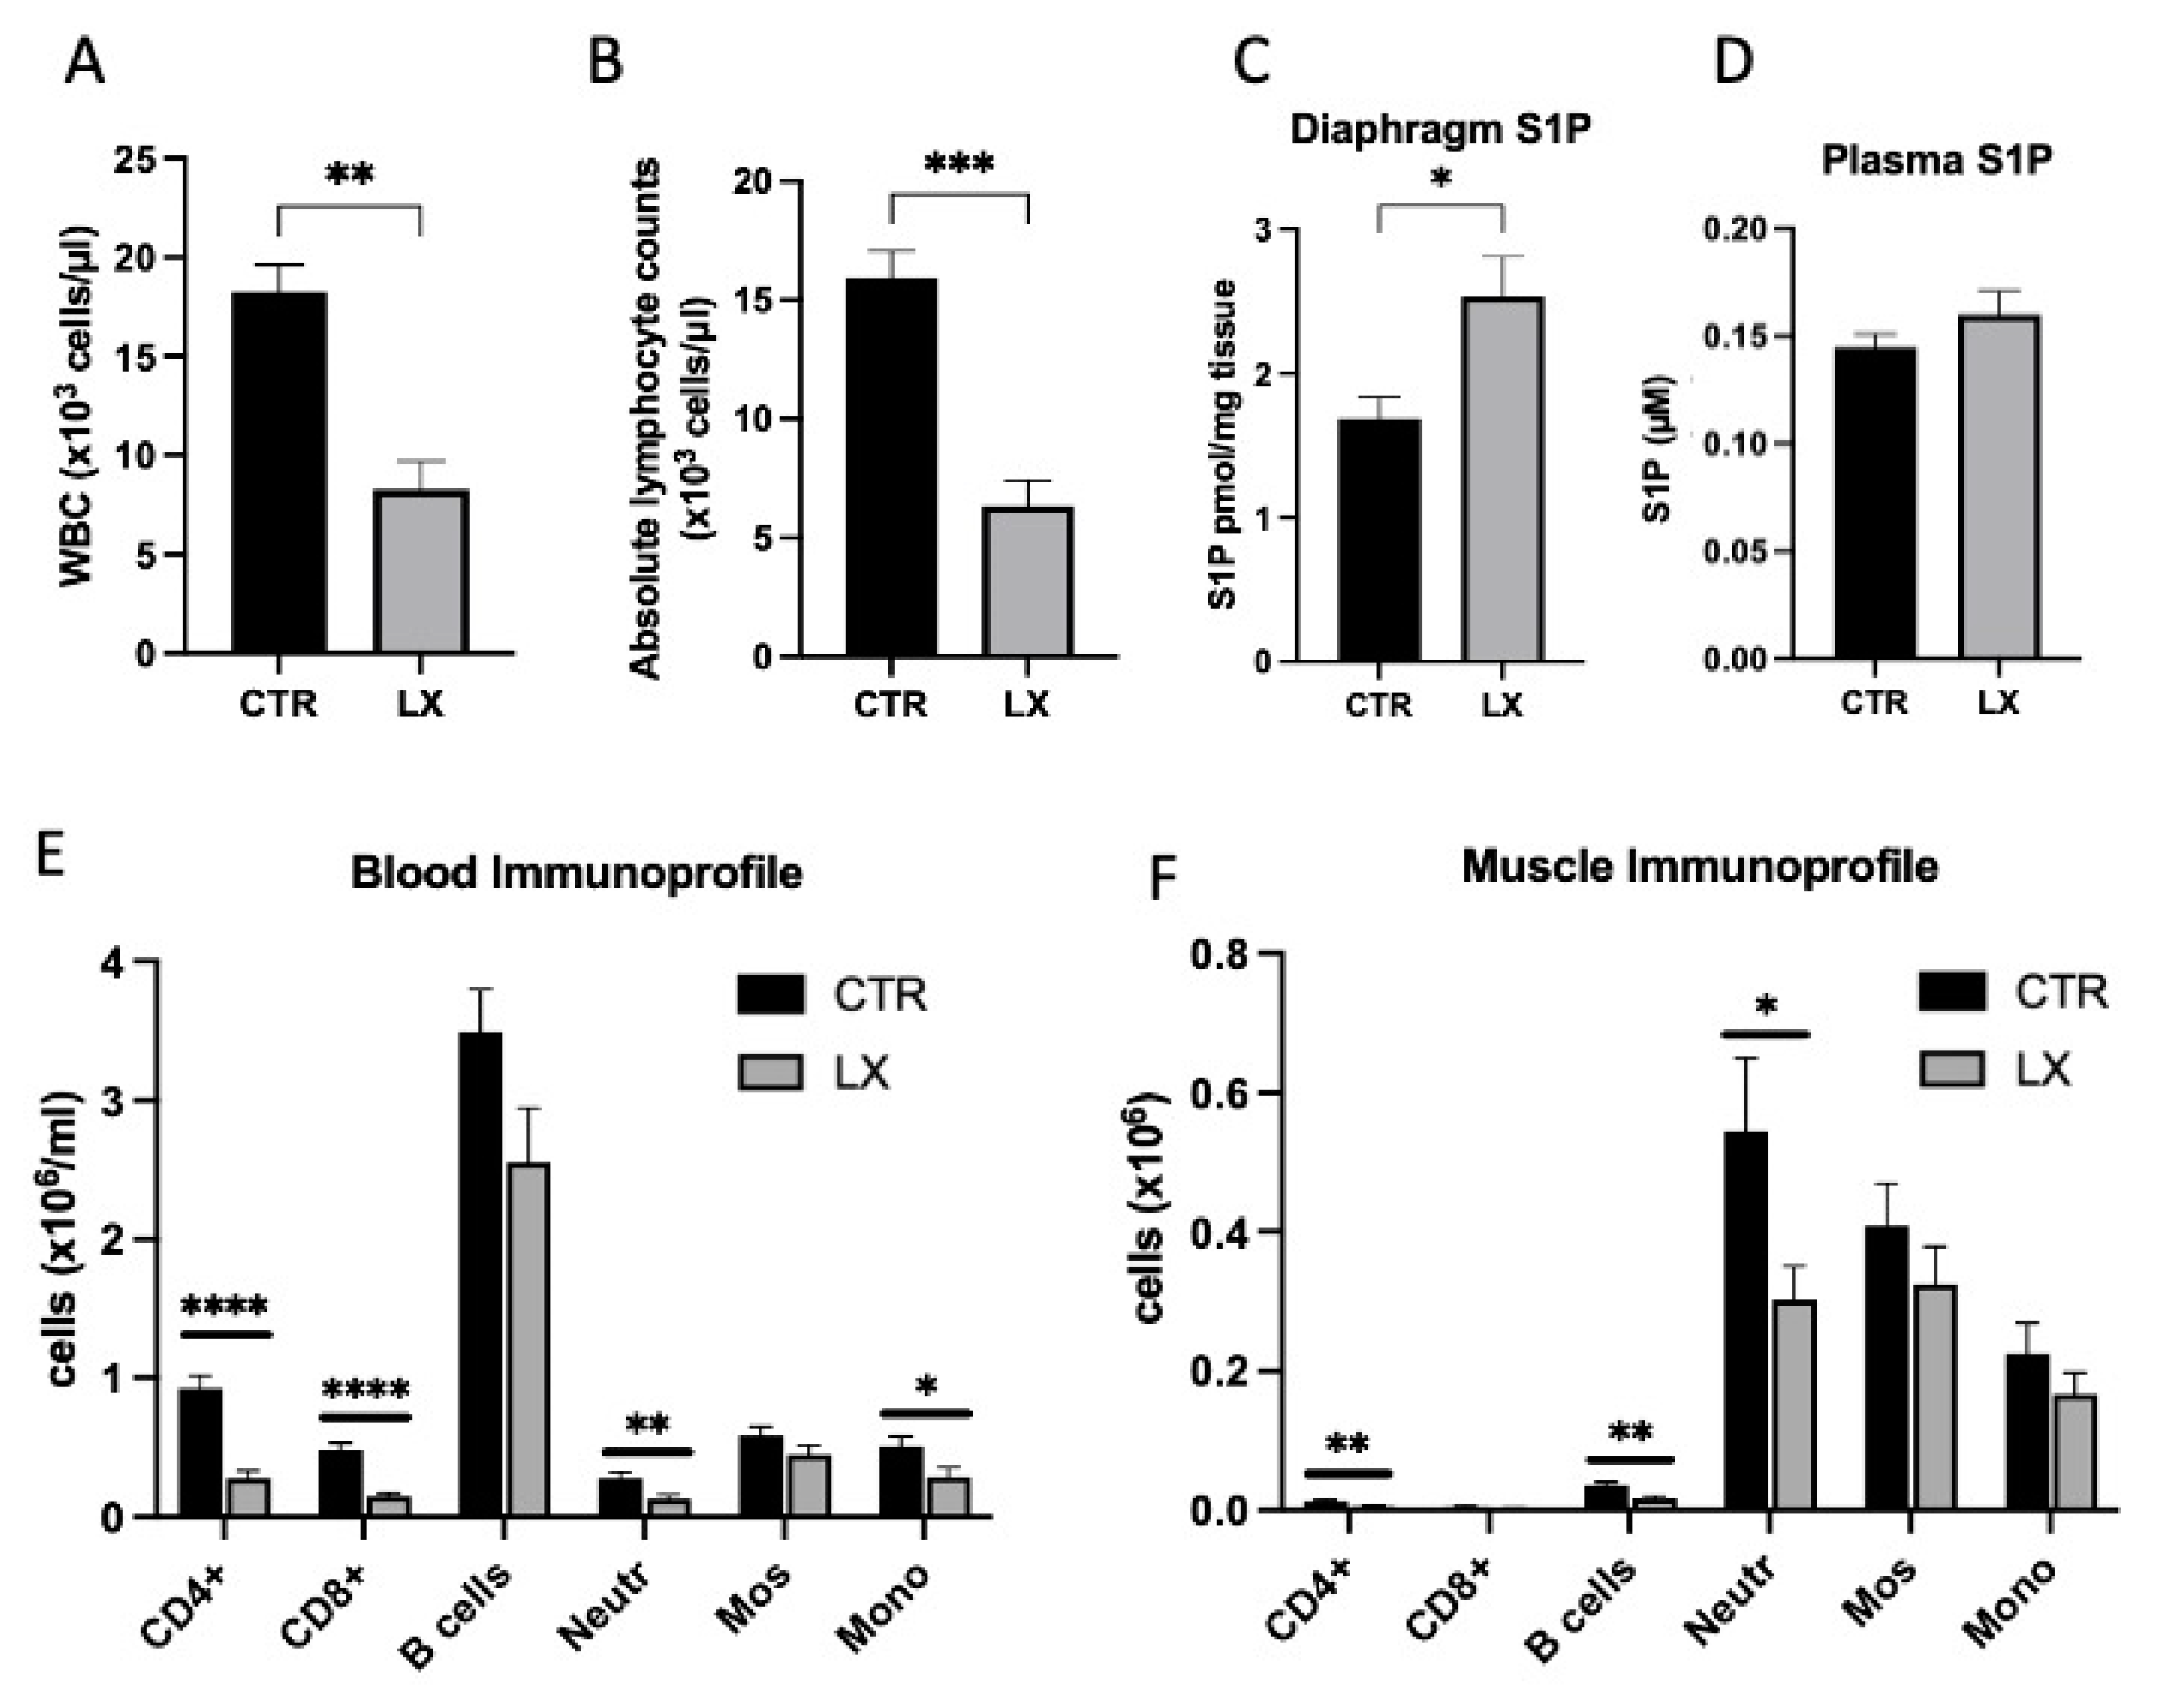
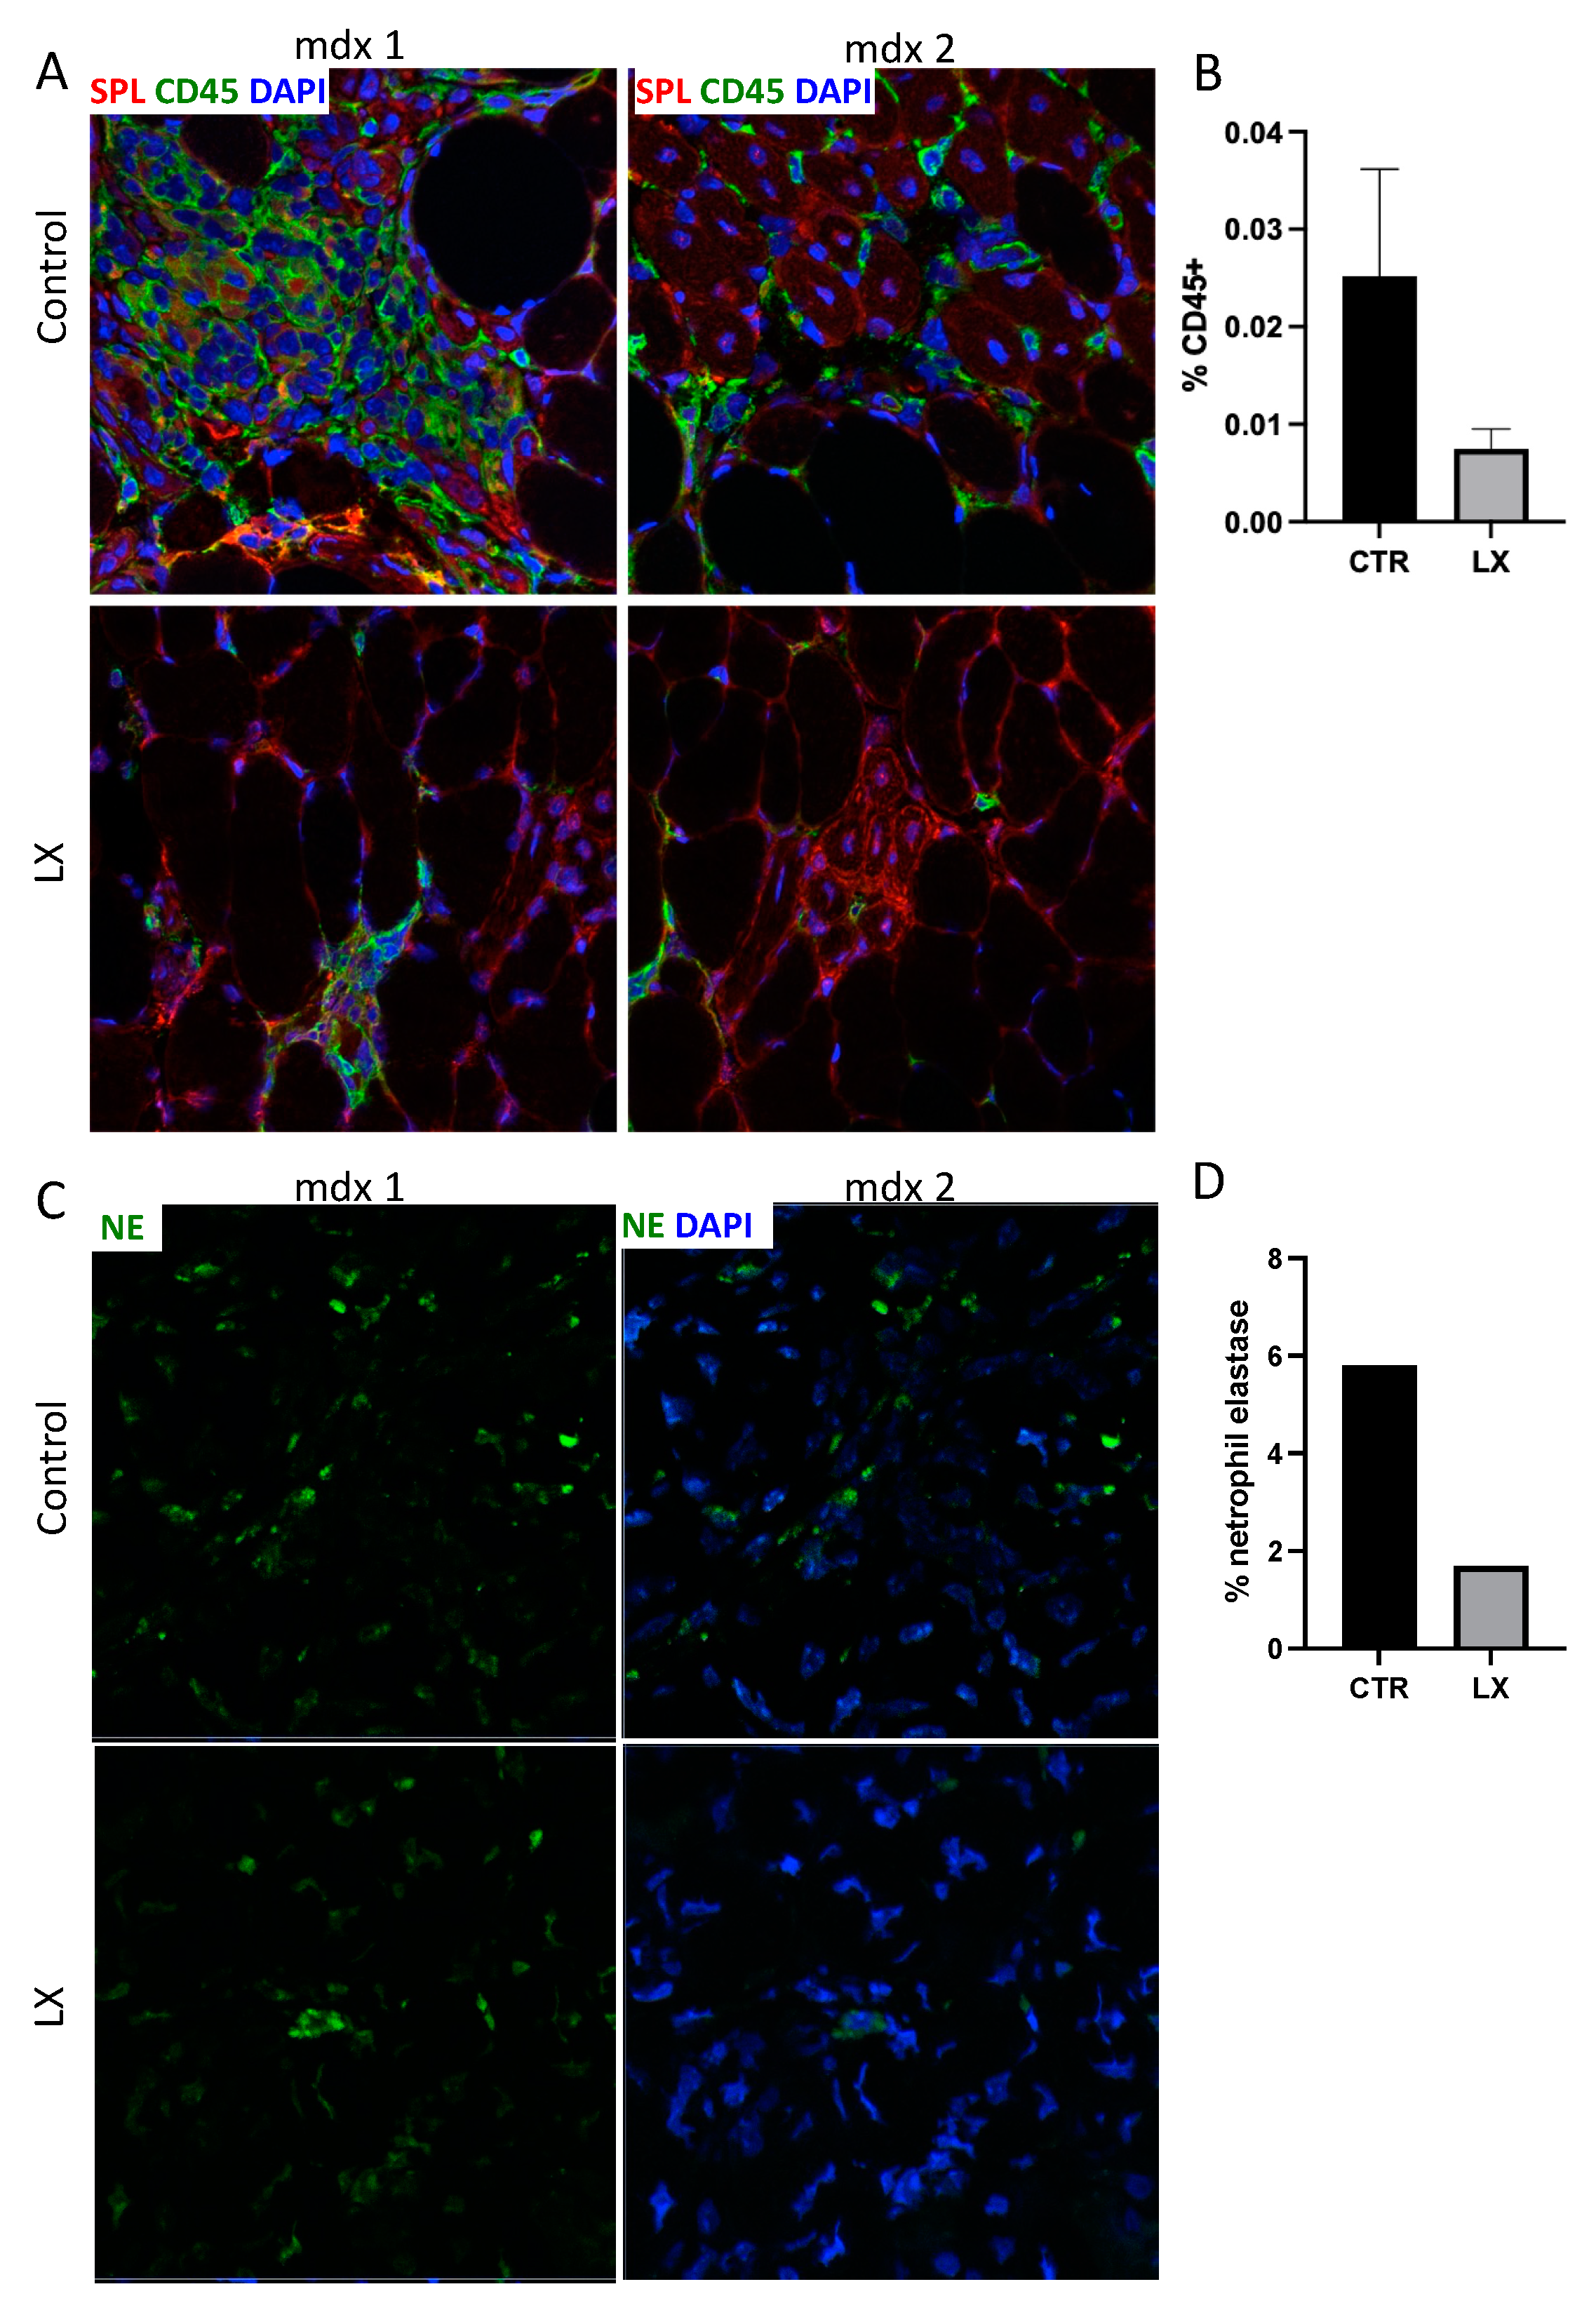
2.3. Perinatal Treatment of Mdx Mice with SPL Inhibitor Reduces Immune Cell Trafficking to Skeletal Muscles
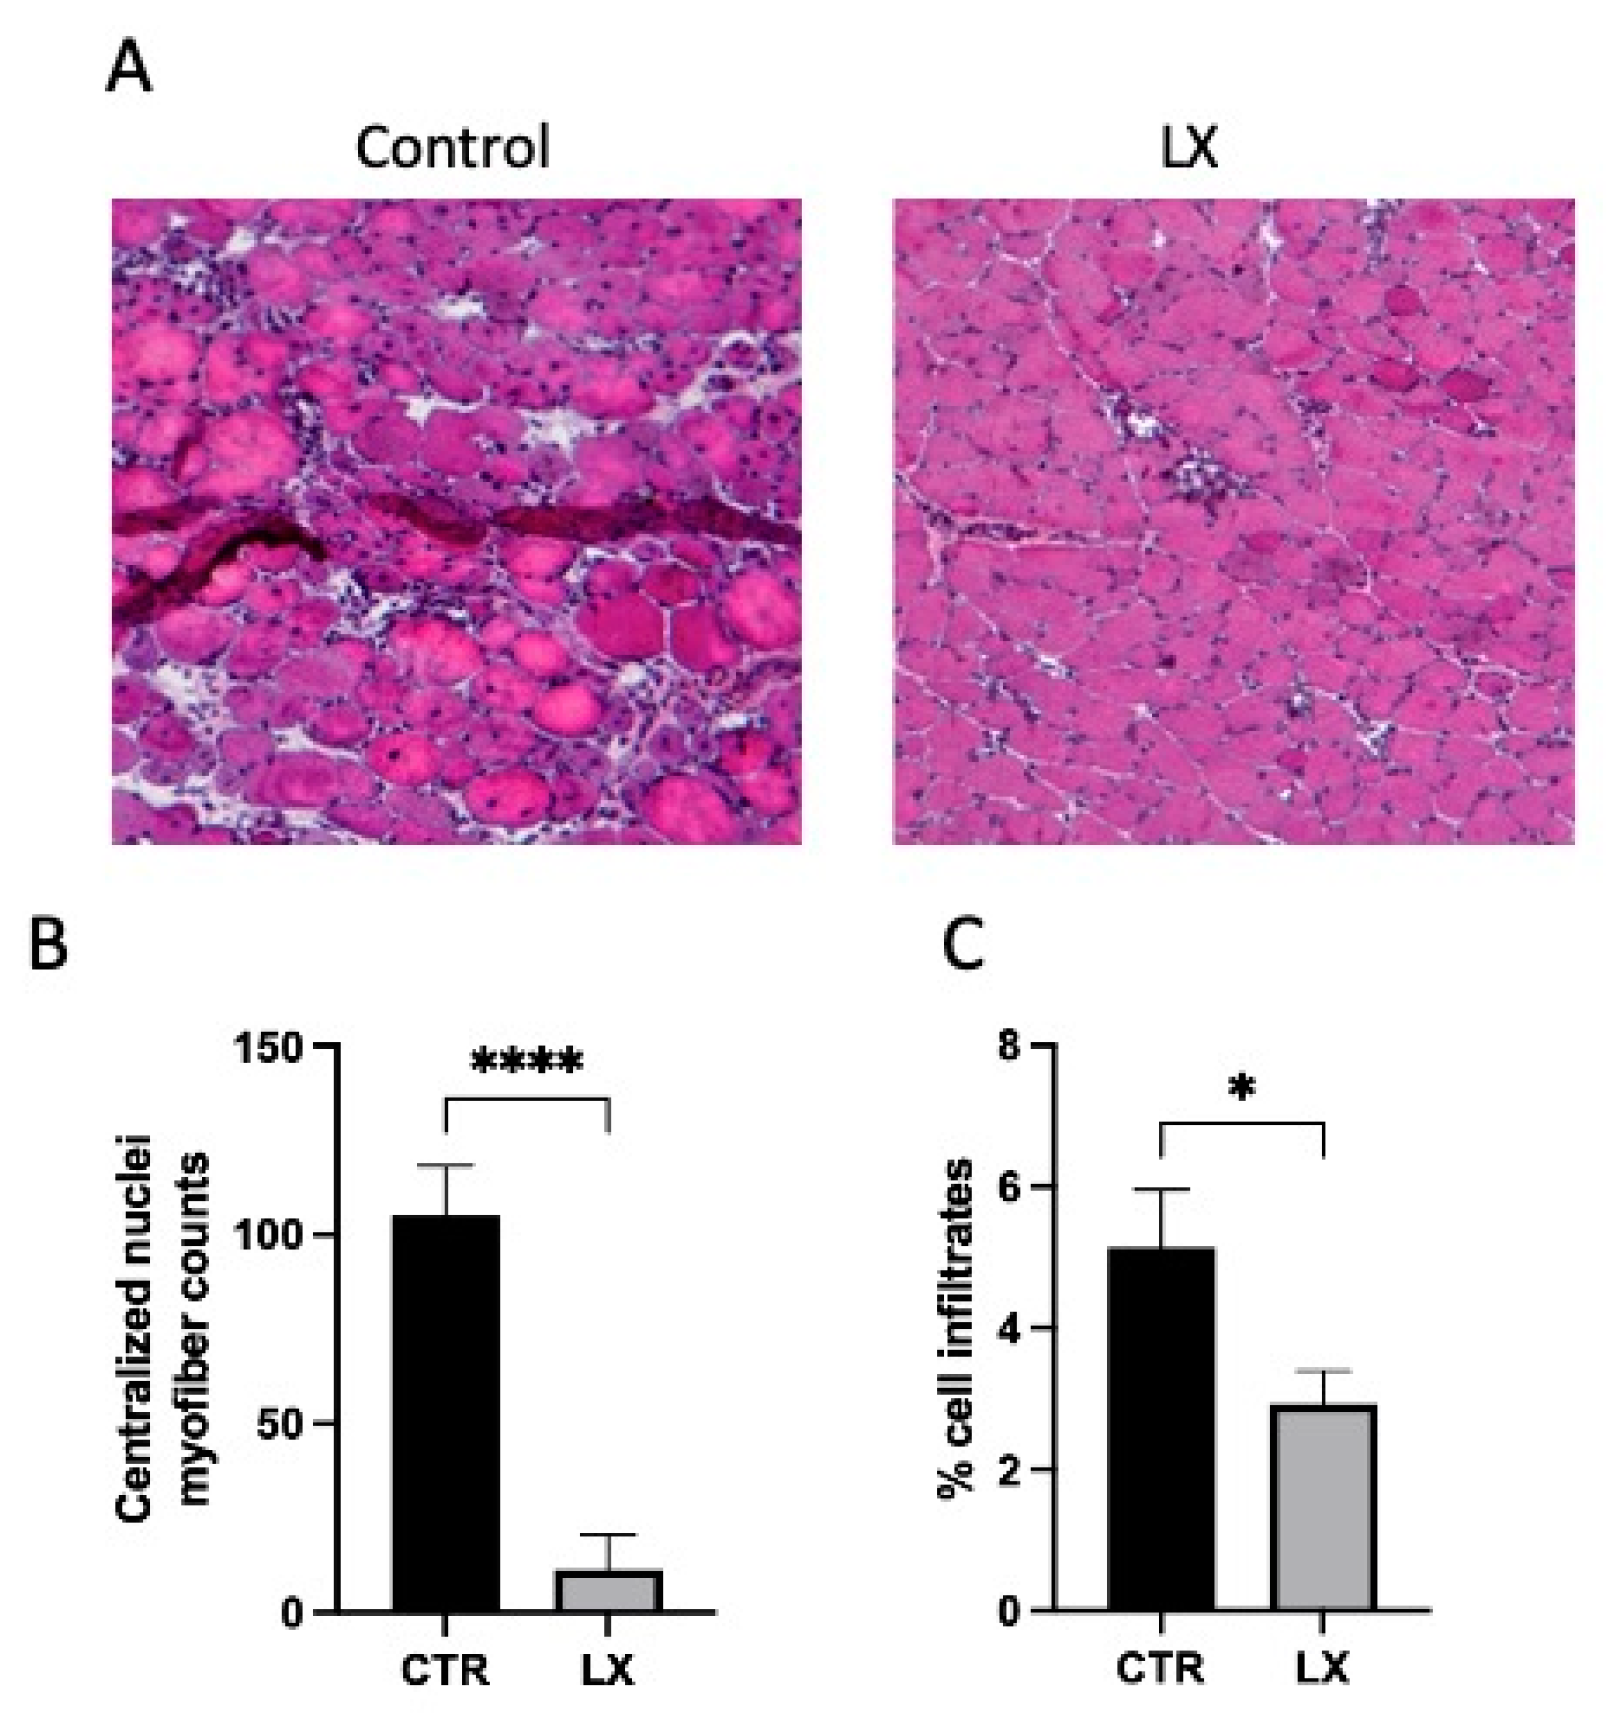
2.4. Perinatal SPL Inhibition in Mdx Mice Attenuates Muscle Damage
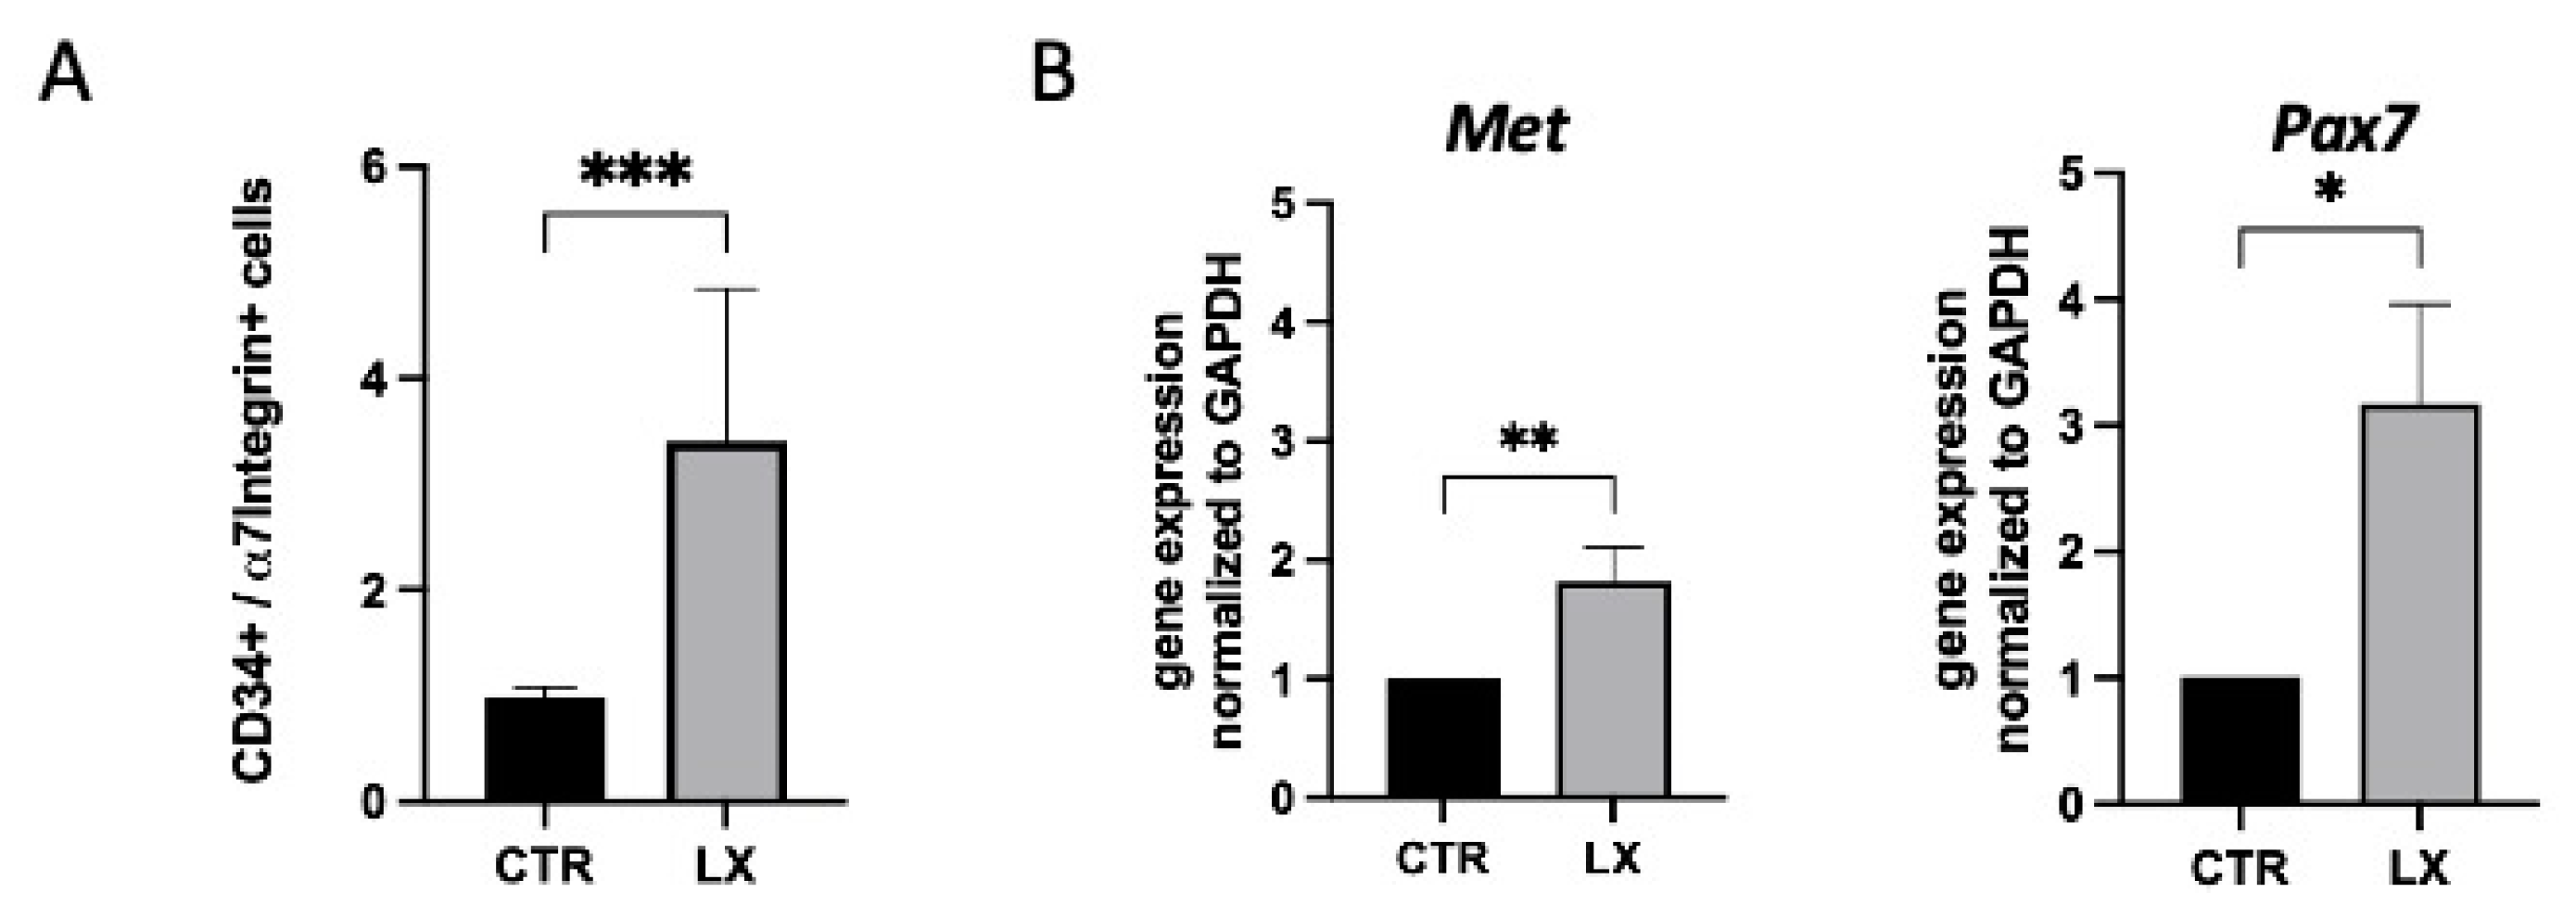
2.5. Perinatal SPL Inhibition Increases Endogenous Satellite Cell (SC) Numbers in Mdx Muscles
2.6. Perinatal SPL Inhibition Diminishes Fibrosis in Mdx Muscles
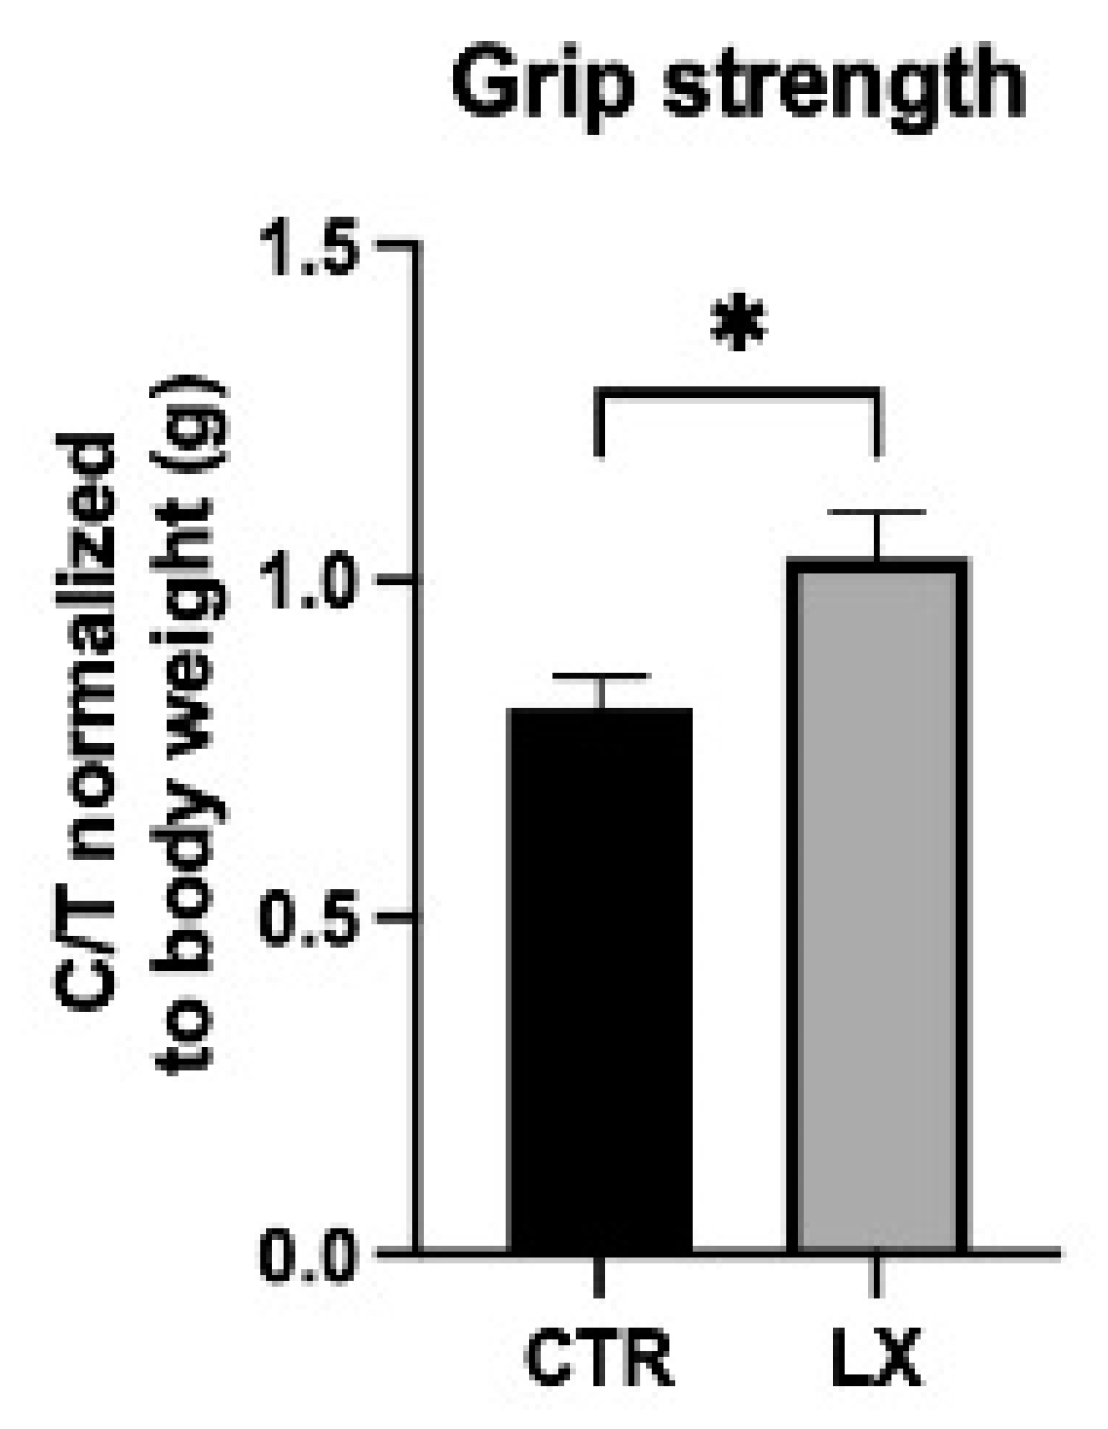
2.7. SPL Suppression Results in Increased Muscle Strength
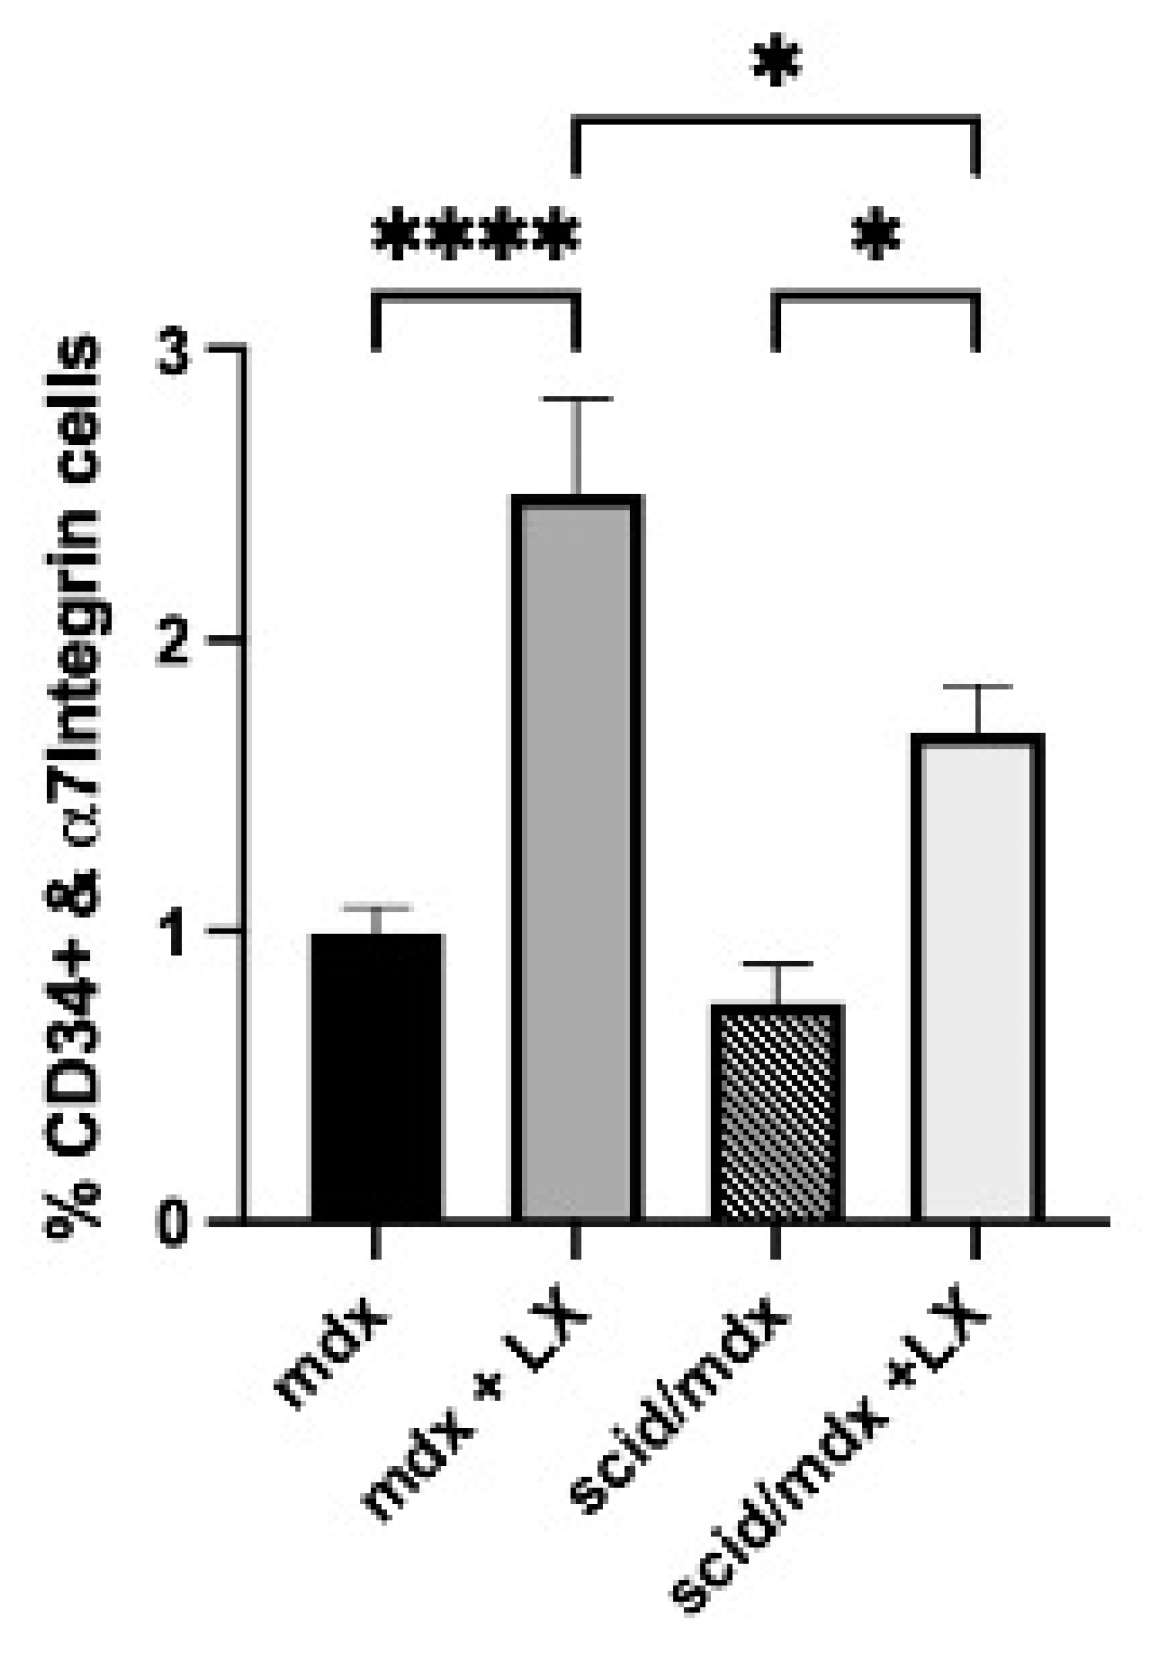
2.8. SPL Inhibition Promotes SC Expansion in Immunodeficient Mdx Mice
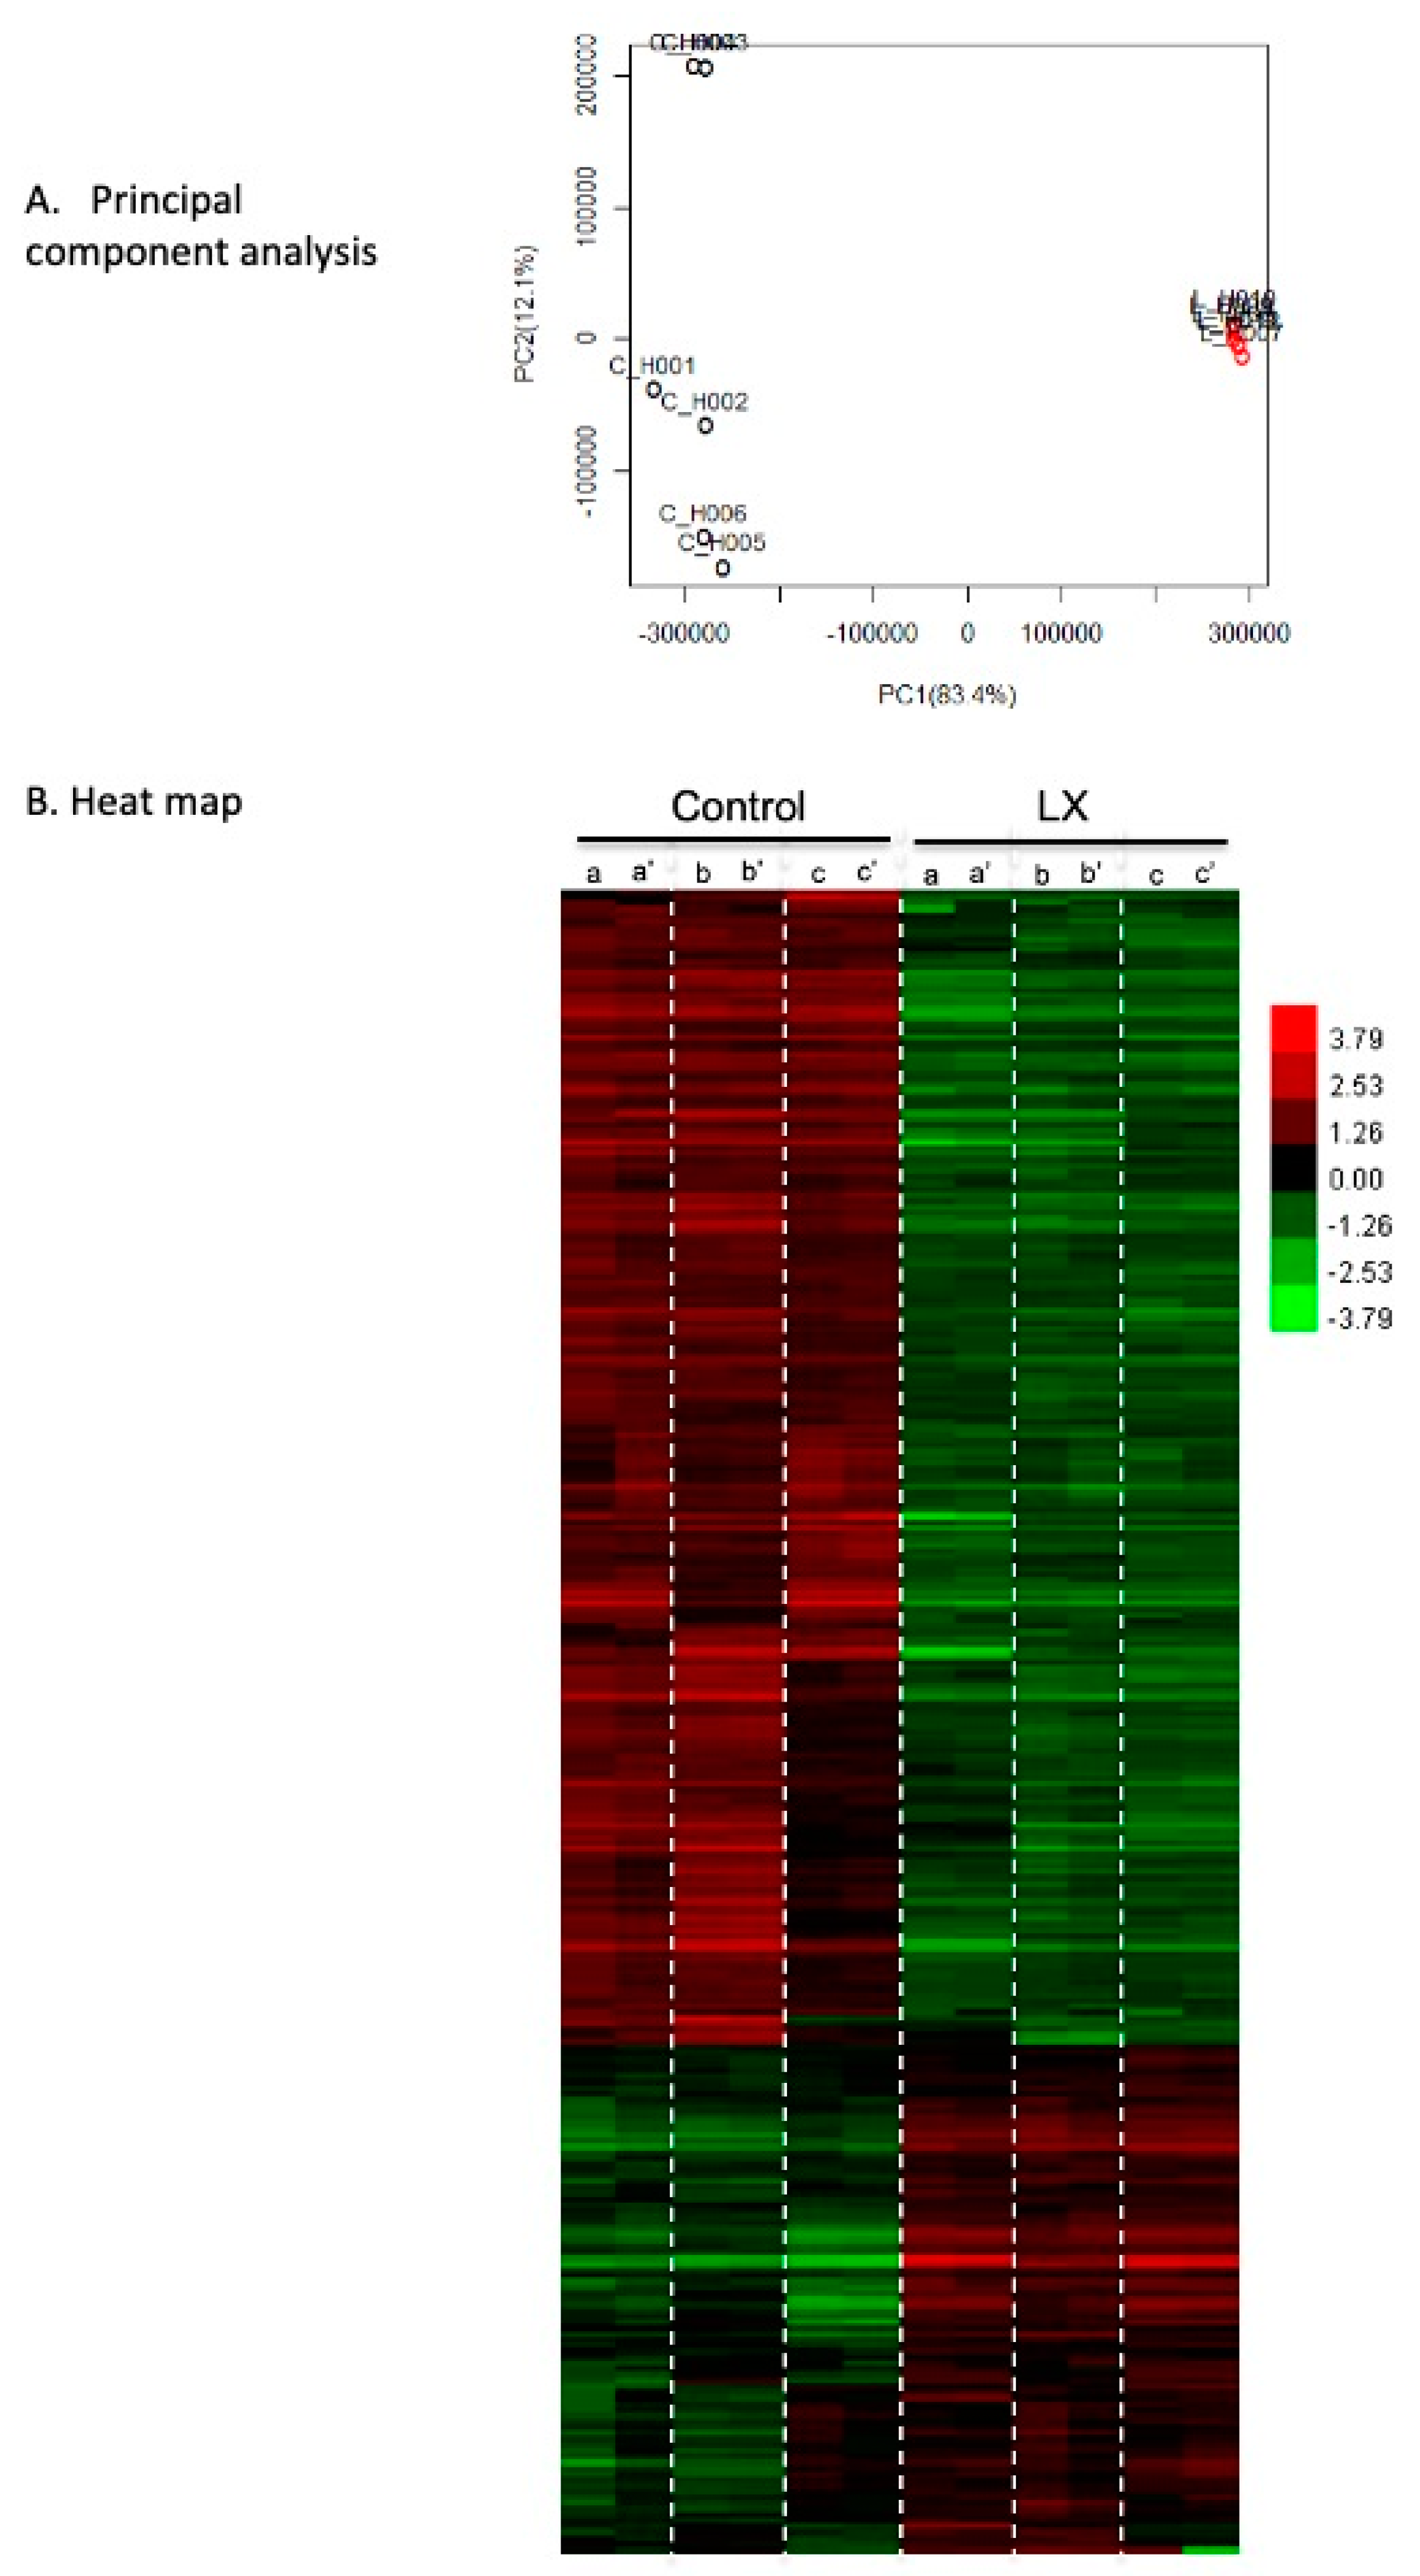
2.9. Transcriptional Profiling in LX2931-Treated and Untreated Mdx Muscle
3. Discussion
4. Materials and Methods
4.1. Human Tissues
4.2. Mice
4.3. LX2931 Administration
4.4. Tissue Harvesting
4.5. Flow Cytometry
4.6. S1P Quantification
4.7. qRT-PCR
4.8. Microarray Analysis
4.9. Histology
4.10. Immunofluorescence
4.11. Functional Test
4.12. Statistics
Supplementary Materials
Author Contributions
Funding
Institutional Review Board Statement
Informed Consent Statement
Data Availability Statement
Acknowledgments
Conflicts of Interest
References
- Duchenne, D. The pathology of paralysis with muscular degeneration (paralysie myosclerotique), or paralysis with apparent hypertrophy. Br. Med. J. 1867, 2, 541–542. [Google Scholar] [CrossRef] [PubMed] [Green Version]
- Verhaart, I.E.C.; Aartsma-Rus, A. Therapeutic developments for Duchenne muscular dystrophy. Nat. Rev. Neurol. 2019, 15, 373–386. [Google Scholar] [CrossRef] [PubMed]
- Bhat, H.F.; Mir, S.S.; Dar, K.B.; Bhat, Z.F.; Shah, R.A.; Ganai, N.A. ABC of multifaceted dystrophin glycoprotein complex (DGC). J. Cell. Physiol. 2018, 233, 5142–5159. [Google Scholar] [CrossRef] [PubMed]
- Morgan, J.E.; Partridge, T.A. Muscle satellite cells. Int. J. Biochem. Cell Biol. 2003, 35, 1151–1156. [Google Scholar] [CrossRef]
- Dumont, N.A.; Wang, Y.X.; von Maltzahn, J.; Pasut, A.; Bentzinger, C.F.; Brun, C.E.; Rudnicki, M.A. Dystrophin expression in muscle stem cells regulates their polarity and asymmetric division. Nat. Med. 2015, 21, 1455–1463. [Google Scholar] [CrossRef] [Green Version]
- Sun, C.; Shen, L.; Zhang, Z.; Xie, X. Therapeutic strategies for Duchenne muscular dystrophy: An update. Genes 2020, 11, 837. [Google Scholar] [CrossRef]
- Chemello, F.; Wang, Z.; Li, H.; McAnally, J.R.; Liu, N.; Bassel-Duby, R.; Olson, E.N. Degenerative and regenerative pathways underlying Duchenne muscular dystrophy revealed by single-nucleus RNA sequencing. Proc. Natl. Acad. Sci. USA 2020, 117, 29691–29701. [Google Scholar] [CrossRef]
- Cartier, A.; Hla, T. Sphingosine 1-phosphate: Lipid signaling in pathology and therapy. Science 2019, 366, 463. [Google Scholar] [CrossRef]
- Saba, J.D. Fifty years of lyase and a moment of truth: Sphingosine phosphate lyase from discovery to disease. J. Lipid Res. 2019, 60, 456–463. [Google Scholar] [CrossRef] [Green Version]
- Weber, C.; Krueger, A.; Münk, A.; Bode, C.; Van Veldhoven, P.P.; Gräler, M.H. Discontinued postnatal thymocyte development in sphingosine 1-phosphate-lyase-deficient mice. J. Immunol. 2009, 183, 4292–4301. [Google Scholar] [CrossRef] [Green Version]
- Schwab, S.R.; Pereira, J.P.; Matloubian, M.; Xu, Y.; Huang, Y.; Cyster, J.G. Lymphocyte sequestration through S1P lyase inhibition and disruption of S1P gradients. Science 2005, 309, 1735–1739. [Google Scholar] [CrossRef] [PubMed]
- Matloubian, M.; Lo, C.G.; Cinamon, G.; Lesneski, M.J.; Xu, Y.; Brinkmann, V.; Allende, M.L.; Proia, R.; Cyster, J.G. Lymphocyte egress from thymus and peripheral lymphoid organs is dependent on S1P receptor 1. Nature 2004, 427, 355–360. [Google Scholar] [CrossRef] [PubMed]
- Perez-Jeldres, T.; Alvarez-Lobos, M.; Rivera-Nieves, J. Targeting sphingosine-1-phosphate signaling in immune-mediated diseases: Beyond multiple sclerosis. Drugs 2021, 81, 985–1002. [Google Scholar] [CrossRef] [PubMed]
- Zanin, M.; Germinario, E.; Libera, L.D.; Sandonà, D.; Sabbadini, R.A.; Betto, R.; Danieli, D. Trophic action of sphingosine 1-phosphate in denervated rat soleus muscle. Am. J. Physiol.-Cell Physiol. 2008, 294, C36–C46. [Google Scholar] [CrossRef] [PubMed]
- Cordeiro, A.V.; Silva, V.R.R.; Pauli, J.R.; da Silva, A.S.R.; Cintra, D.E.; Moura, L.P.; Ropelle, E.R. The role of sphingosine-1-phosphate in skeletal muscle: Physiology, mechanisms, and clinical perspectives. J. Cell Physiol. 2019, 234, 10047–10059. [Google Scholar] [CrossRef]
- Pantoja, M.; Fischer, K.A.; Ieronimakis, N.; Reyes, M.; Ruohola-Baker, H. Genetic elevation of Sphingosine 1-phosphate suppresses dystrophic muscle phenotypes in Drosophila. Development 2013, 140, 136–146. [Google Scholar] [CrossRef] [Green Version]
- Ieronimakis, N.; Pantoja, M.; Hays, A.L.; Dosey, T.L.; Qi, J.; Fischer, K.A.; Hoofnagle, A.N.; Sadilek, M.; Chamberlain, J.S.; Ruohola-Baker, H.; et al. Increased sphingosine-1-phosphate improves muscle regeneration in acutely injured mdx mice. Skelet. Muscle 2013, 3, 20. [Google Scholar] [CrossRef] [Green Version]
- Hodun, K.; Chabowski, A.; Baranowski, M. Sphingosine-1-phosphate in acute exercise and training. Scand. J. Med. Sci. Sports 2021, 31, 945–955. [Google Scholar] [CrossRef]
- Nguyen-Tran, D.-H.; Hait, N.C.; Sperber, H.; Qi, J.; Fischer, K.; Ieronimakis, N.; Pantoja, M.; Hays, A.; Allegood, J.; Reyes, M.; et al. Molecular mechanism of sphingosine-1-phosphate action in Duchenne muscular dystrophy. Dis. Model. Mech. 2014, 7, 41–54. [Google Scholar] [CrossRef] [Green Version]
- Meacci, E.; Garcia-Gil, M. S1P/S1P Receptor signaling in neuromuscolar disorders. Int. J. Mol. Sci. 2019, 20, 6364. [Google Scholar] [CrossRef] [Green Version]
- Loh, K.C.; Leong, W.I.; Carlson, M.E.; Oskouian, B.; Kumar, A.; Fyrst, H.; Zhang, M.; Proia, R.L.; Hoffman, E.P.; Saba, J.D. Sphingosine-1-phosphate enhances satellite cell activation in dystrophic muscles through a S1PR2/STAT3 signaling pathway. PLoS ONE 2012, 7, e37218. [Google Scholar]
- Germinario, E.; Bondì, M.; Blaauw, B.; Betto, R.; Danieli-Betto, D. Reduction of circulating sphingosine-1-phosphate worsens mdx soleus muscle dystrophic phenotype. Exp. Physiol. 2020, 105, 1895–1906. [Google Scholar] [CrossRef] [PubMed]
- Herr, D.R.; Fyrst, H.; Phan, V.; Heinecke, K.; Georges, R.; Harris, G.L.; Saba, J.D. Sply regulation of sphingolipid signaling molecules is essential for Drosophila development. Development 2003, 130, 2443–2453. [Google Scholar] [CrossRef] [PubMed] [Green Version]
- De La Garza-Rodea, A.S.; Baldwin, D.M.; Oskouian, B.; Place, R.F.; Bandhuvula, P.; Kumar, A.; Saba, J.D. Sphingosine phosphate lyase regulates myogenic differentiation via S1P receptor-mediated effects on myogenic microRNA expression. FASEB J. 2014, 28, 506–519. [Google Scholar] [CrossRef] [PubMed] [Green Version]
- Porter, J.D.; Khanna, S.; Kaminski, H.J.; Rao, J.S.; Merriam, A.P.; Richmonds, C.R.; Leahy, P.; Li, J.; Guo, W.; Andrade, F.H. A chronic inflammatory response dominates the skeletal muscle molecular signature in dystrophin-deficient mdx mice. Hum. Mol. Genet. 2002, 11, 263–272. [Google Scholar] [CrossRef] [Green Version]
- Nakamura, A.; Takeda, S. Mammalian models of Duchenne muscular dystrophy: Pathological characteristics and therapeutic applications. J. Biomed. Biotechnol. 2011, 2011, 1–8. [Google Scholar] [CrossRef] [Green Version]
- Allende, M.L.; Bektas, M.; Lee, B.G.; Bonifacino, E.; Kang, J.; Tuymetova, G.; Chen, W.; Saba, J.D.; Proia, R.L. Sphingosine-1-phosphate lyase deficiency produces a pro-inflammatory response while impairing neutrophil trafficking. J. Biol. Chem. 2011, 286, 7348–7358. [Google Scholar] [CrossRef] [Green Version]
- Gutpell, K.M.; Hrinivich, W.T.; Hoffman, L.M. Skeletal muscle fibrosis in the mdx/utrn+/- mouse validates its suitability as a murine model of Duchenne muscular dystrophy. PLoS ONE 2015, 10, e0117306. [Google Scholar]
- Zhao, P.; Tassew, G.B.; Lee, J.Y.; Oskouian, B.; Muñoz, D.P.; Hodgin, J.B.; Watson, G.L.; Tang, F.; Wang, J.-Y.; Luo, J.; et al. Efficacy of AAV9-mediated SGPL1 gene transfer in a mouse model of S1P lyase insufficiency syndrome. JCI Insight 2021, 6, e145936. [Google Scholar] [CrossRef]
- Boer, J.M.; de Meijer, E.J.; Mank, E.M.; van Ommen, G.B.; Dunnen, J.T.D. Expression profiling in stably regenerating skeletal muscle of dystrophin-deficient mdx mice. Neuromuscul. Disord. 2002, 12, S118–S124. [Google Scholar] [CrossRef]
- Calyjur, P.C.; Almeida Cde, F.; Ayub-Guerrieri, D.; Ribeiro, A.F., Jr.; Fernandes Sde, A.; Ishiba, R.; Santos, A.L.; Onofre-Oliveira, P.; Vainzof, M. The mdx mutation in the 129/Sv background results in a milder phenotype: Transcriptome comparative analysis searching for the protective factors. PLoS ONE 2016, 11, e0150748. [Google Scholar]
- Almeida, C.F.; Martins, P.C.; Vainzof, M. Comparative transcriptome analysis of muscular dystrophy models Large(myd), Dmd(mdx)/Large(myd) and Dmd(mdx): What makes them different? Eur. J. Hum. Genet. 2016, 24, 1301–1309. [Google Scholar] [CrossRef] [PubMed] [Green Version]
- Porter, J.D.; Merriam, A.P.; Khanna, S.; Andrade, F.H.; Richmonds, C.R.; Leahy, P.; Cheng, G.; Karathanasis, P.; Zhou, X.; Kusner, L.L.; et al. Constitutive properties, not molecular adaptations, mediate extraocular muscle sparing in dystrophic mdx mice. FASEB J. 2003, 17, 893–895. [Google Scholar] [CrossRef] [PubMed]
- Porter, J.D.; Merriam, A.P.; Leahy, P.; Gong, B.; Khanna, S. Dissection of temporal gene expression signatures of affected and spared muscle groups in dystrophin-deficient (mdx) mice. Hum. Mol. Genet. 2003, 12, 1813–1821. [Google Scholar] [CrossRef] [Green Version]
- Carr, L.; Parkinson, D.B.; Dun, X.-P. Expression patterns of Slit and Robo family members in adult mouse spinal cord and peripheral nervous system. PLoS ONE 2017, 12, e0172736. [Google Scholar] [CrossRef] [Green Version]
- Do, M.K.; Suzuki, T.; Gerelt, B.; Sato, Y.; Mizunoya, W.; Nakamura, M.; Ikeuchi, Y.; Anderson, J.E.; Tatsumi, R. Time-coordinated prevalence of extracellular HGF, FGF2 and TGF-beta3 in crush-injured skeletal muscle. Anim. Sci. J. 2012, 83, 712–717. [Google Scholar] [CrossRef]
- Tatsumi, R.; Sankoda, Y.; Anderson, J.E.; Sato, Y.; Mizunoya, W.; Shimizu, N.; Suzuki, T.; Yamada, M.; Rhoads, R.P., Jr.; Ikeuchi, Y.; et al. Possible implication of satellite cells in regenerative motoneuritogenesis: HGF upregulates neural chemorepellent Sema3A during myogenic differentiation. Am. J. Physiol. Physiol. 2009, 297, C238–C252. [Google Scholar] [CrossRef] [Green Version]
- Sato, Y.; Suzuki, T.; Ohtsubo, H.; Mizunoya, W.; Nakamura, M.; Furuse, M.; Ikeuchi, Y.; Tatsumi, R.; Do, M.-K.Q. Satellite cells produce neural chemorepellent semaphorin 3A upon muscle injury. Anim. Sci. J. 2013, 84, 185–189. [Google Scholar] [CrossRef]
- Atkinson, D.; Glumac, J.N.; Asselbergh, B.; Ermanoska, B.; Blocquel, D.; Steiner, R.; Estrada-Cuzcano, A.; Peeters, K.; Ooms, T.; De Vriendt, E.; et al. Sphingosine 1-phosphate lyase deficiency causes Charcot-Marie-Tooth neuropathy. Neurology 2017, 88, 533–542. [Google Scholar] [CrossRef] [Green Version]
- Kourakis, S.; Timpani, C.A.; Campelj, D.G.; Hafner, P.; Gueven, N.; Fischer, D.; Rybalka, E. Standard of care versus new-wave corticosteroids in the treatment of Duchenne muscular dystrophy: Can we do better? Orphanet J. Rare Dis. 2021, 16, 117. [Google Scholar] [CrossRef]
- Sanllehí, P.; Casasampere, M.; Abad, J.-L.; Fabriàs, G.; López, O.; Bujons, J.; Casas, J.; Delgado, A. The first fluorogenic sensor for sphingosine-1-phosphate lyase activity in intact cells. Chem. Commun. 2017, 53, 5441–5444. [Google Scholar] [CrossRef]
- Pons, G.; Riba, D.; Casasampere, M.; Izquierdo, E.; Abad, J.-L.; Fabriàs, G.; Ortega, P.G.R.; López-González, J.J.; Montejo, M.; Casas, J.; et al. A Mechanism-based sphingosine-1-phosphate lyase inhibitor. J. Org. Chem. 2020, 85, 419–429. [Google Scholar] [CrossRef]
- Pharmaceuticals, L. Lexicon Pharmaceuticals Reports Preliminary Results from Two Phase 1 Studies. Available online: https://www.lexpharma.com/media-center/news/543-lexicon-pharmaceuticals-reports-preliminary-results-from-two-phase-1-studies (accessed on 22 May 2022).
- Bagdanoff, J.T.; Donoviel, M.S.; Nouraldeen, A.; Carlsen, M.; Jessop, T.C.; Tarver, J.; Aleem, S.; Dong, L.; Zhang, H.; Boteju, L.; et al. Inhibition of sphingosine 1-phosphate lyase for the treatment of rheumatoid arthritis: Discovery of (E)-1-(4-((1R,2S,3R)-1,2,3,4-tetrahydroxybutyl)-1H-imidazol-2-yl)ethanone oxime (LX2931) and (1R,2S,3R)-1-(2-(isoxazol-3-yl)-1H-imidazol-4-yl)butane-1,2,3,4-tetraol (LX2932). J. Med. Chem. 2010, 53, 8650–8662. [Google Scholar] [PubMed]
- Sullards, M.C.; Merrill, A.H., Jr. Analysis of sphingosine 1-phosphate, ceramides, and other bioactive sphingolipids by high-performance liquid chromatography-tandem mass spectrometry. Sci. STKE 2001, 67, 1–11. [Google Scholar] [CrossRef] [PubMed]
- Aartsma-Rus, A.; van Putten, M. Assessing functional performance in the mdx mouse model. J. Vis. Exp. 2014, 85, 51303. [Google Scholar] [CrossRef] [PubMed] [Green Version]


| Gene Set Name | # Genes in Overlap (k) | p Value |
|---|---|---|
| Leukocyte trans-endothelial migration | 25 | 5.1040 × 10⁻⁷ |
| ECM-receptor interaction | 19 | 4.7618 × 10⁻⁶ |
| Chemokine signaling pathway | 29 | 1.6142 × 10⁻⁵ |
| Fc gamma R-mediated phagocytosis | 19 | 5.2623 × 10⁻⁵ |
| Hematopoietic cell lineage | 17 | 8.7064 × 10⁻⁵ |
| Cell adhesion molecules (CAMs) | 23 | 0.0004 |
| B cell receptor signaling pathway | 15 | 0.0006 |
| Natural killer cell mediated cytotoxicity | 19 | 0.0009 |
| Focal adhesion | 26 | 0.0011 |
| Axon guidance | 19 | 0.0021 |
| Gene Set Name | # Genes in Overlap (k) | p Value |
|---|---|---|
| Calcium ion binding | 83 | 7.1745 × 10⁻⁷ |
| Carbohydrate binding | 40 | 3.9976 × 10⁻⁶ |
| GTPase regulator activity | 41 | 3.6579 × 10⁻⁵ |
| Nucleoside-triphosphatase regulator activity | 41 | 5.3041 × 10⁻⁵ |
| Enzyme activator activity | 31 | 7.4973 × 10⁻⁵ |
| Guanyl-nucleotide exchange factor activity | 22 | 8.1547 × 10⁻⁵ |
| Polysaccharide binding | 20 | 0.0001 |
| Pattern binding | 20 | 0.0001 |
| Identical protein binding | 33 | 0.0002 |
| Protein complex binding | 14 | 0.0004 |
| Gene Set Name | # Genes in Overlap (k) | p Value |
|---|---|---|
| Immune response | 76 | 3.0191 × 10⁻¹⁶ |
| Cell activation | 50 | 8.3240 × 10⁻¹⁵ |
| Cell adhesion | 78 | 3.7950 × 10⁻¹³ |
| Biological adhesion | 78 | 4.1752 × 10⁻¹³ |
| Immune effector process | 32 | 2.4120 × 10⁻¹² |
| Leukocyte activation | 43 | 2.6950 × 10⁻¹² |
| Leucocyte mediated immunity | 25 | 9.2975 × 10⁻¹¹ |
| Inflammatory response | 41 | 1.0399 × 10⁻¹⁰ |
| Response to wounding | 53 | 1.2520 × 10⁻¹⁰ |
| Vasculature development | 43 | 2.2401 × 10⁻¹⁰ |
| Gene Set Name | # Genes in Overlap (k) | p Value |
|---|---|---|
| Cell surface | 52 | 3.2687 × 10⁻¹¹ |
| Proteinaceous extracellular matrix | 50 | 1.3109 × 10⁻¹⁰ |
| Extracellular region | 165 | 1.5664 × 10⁻¹⁰ |
| Extracellular matrix | 51 | 1.7262 × 10⁻¹⁰ |
| External side of plasma membrane | 37 | 8.2316 × 10⁻⁹ |
| Extracellular region part | 85 | 1.1612 × 10⁻⁷ |
| Extracellular matrix part | 19 | 9.0239 × 10⁻⁶ |
| Plasma membrane | 228 | 9.9907 × 10⁻⁶ |
| Membrane raft | 15 | 0.0006 |
| Collagen | 7 | 0.0007 |
| Gene | Forward Primer (5′ to 3′) | Reverse Primer (5′ to 3′) | bp |
|---|---|---|---|
| hSGPL1 | CGTGGTCAAGTTGGAGGTCT | ATATAAGAGGGTACTGCCAGCG | 128 |
| mSgpl1 | GGGAAAGTGTGAGATAGCAAG | CTGAGGGAACACGGTACATAAC | 94 |
| Met | GGCCCAGCTGTTTCAGTGA | CAGCATCGCTCAAATTCAGAGA | 61 |
| Pax7 | CCGAGTGCTCAGAATCAA | ATGCTGTGTTTGGCTTTC | 93 |
| Myf5 | CCAGCCCCACCTCCAACT | CTTTTATCTGCAGCACATGCATTT | 127 |
| MyoD | AAATCGCATTGGGGTTTGAG | GAGCGCATCTCCACAGACAG | 178 |
| Col-1a1 | TCCGGCTCCTGCTCCTCTTA | GTATGCAGCTGACTTCAGGGATGT | 78 |
| Col-3a1 | GCCCACAGCCTTCTACAC | CCAGGGTCACCATTTCTC | 109 |
| Col-6a1 | GATGAGGGTGAAGTGGGAG | CACTCACAGCAGGAGCACAT | 185 |
| Fn1 | TGCCTCGGGAATGGAAAG | ATGGTAGGTCTTCCCATCGTCATA | 78 |
| hGAPDH | AATCCCATCACCATCTTCCAG | AAATGAGCCCCAGCCTTC | 122 |
| mGapdh | ACCTGCCAAGTATGATGA | GGAGTTGCTGTTGAAGTC | 118 |
Publisher’s Note: MDPI stays neutral with regard to jurisdictional claims in published maps and institutional affiliations. |
© 2022 by the authors. Licensee MDPI, Basel, Switzerland. This article is an open access article distributed under the terms and conditions of the Creative Commons Attribution (CC BY) license (https://creativecommons.org/licenses/by/4.0/).
Share and Cite
De la Garza-Rodea, A.S.; Moore, S.A.; Zamora-Pineda, J.; Hoffman, E.P.; Mistry, K.; Kumar, A.; Strober, J.B.; Zhao, P.; Suh, J.H.; Saba, J.D. Sphingosine Phosphate Lyase Is Upregulated in Duchenne Muscular Dystrophy, and Its Inhibition Early in Life Attenuates Inflammation and Dystrophy in Mdx Mice. Int. J. Mol. Sci. 2022, 23, 7579. https://doi.org/10.3390/ijms23147579
De la Garza-Rodea AS, Moore SA, Zamora-Pineda J, Hoffman EP, Mistry K, Kumar A, Strober JB, Zhao P, Suh JH, Saba JD. Sphingosine Phosphate Lyase Is Upregulated in Duchenne Muscular Dystrophy, and Its Inhibition Early in Life Attenuates Inflammation and Dystrophy in Mdx Mice. International Journal of Molecular Sciences. 2022; 23(14):7579. https://doi.org/10.3390/ijms23147579
Chicago/Turabian StyleDe la Garza-Rodea, Anabel S., Steven A. Moore, Jesus Zamora-Pineda, Eric P. Hoffman, Karishma Mistry, Ashok Kumar, Jonathan B. Strober, Piming Zhao, Jung H. Suh, and Julie D. Saba. 2022. "Sphingosine Phosphate Lyase Is Upregulated in Duchenne Muscular Dystrophy, and Its Inhibition Early in Life Attenuates Inflammation and Dystrophy in Mdx Mice" International Journal of Molecular Sciences 23, no. 14: 7579. https://doi.org/10.3390/ijms23147579