
Cannabidiol Antiproliferative Effect in Triple-Negative Breast Cancer MDA-MB-231 Cells Is Modulated by Its Physical State and by IGF-1

 , , , and
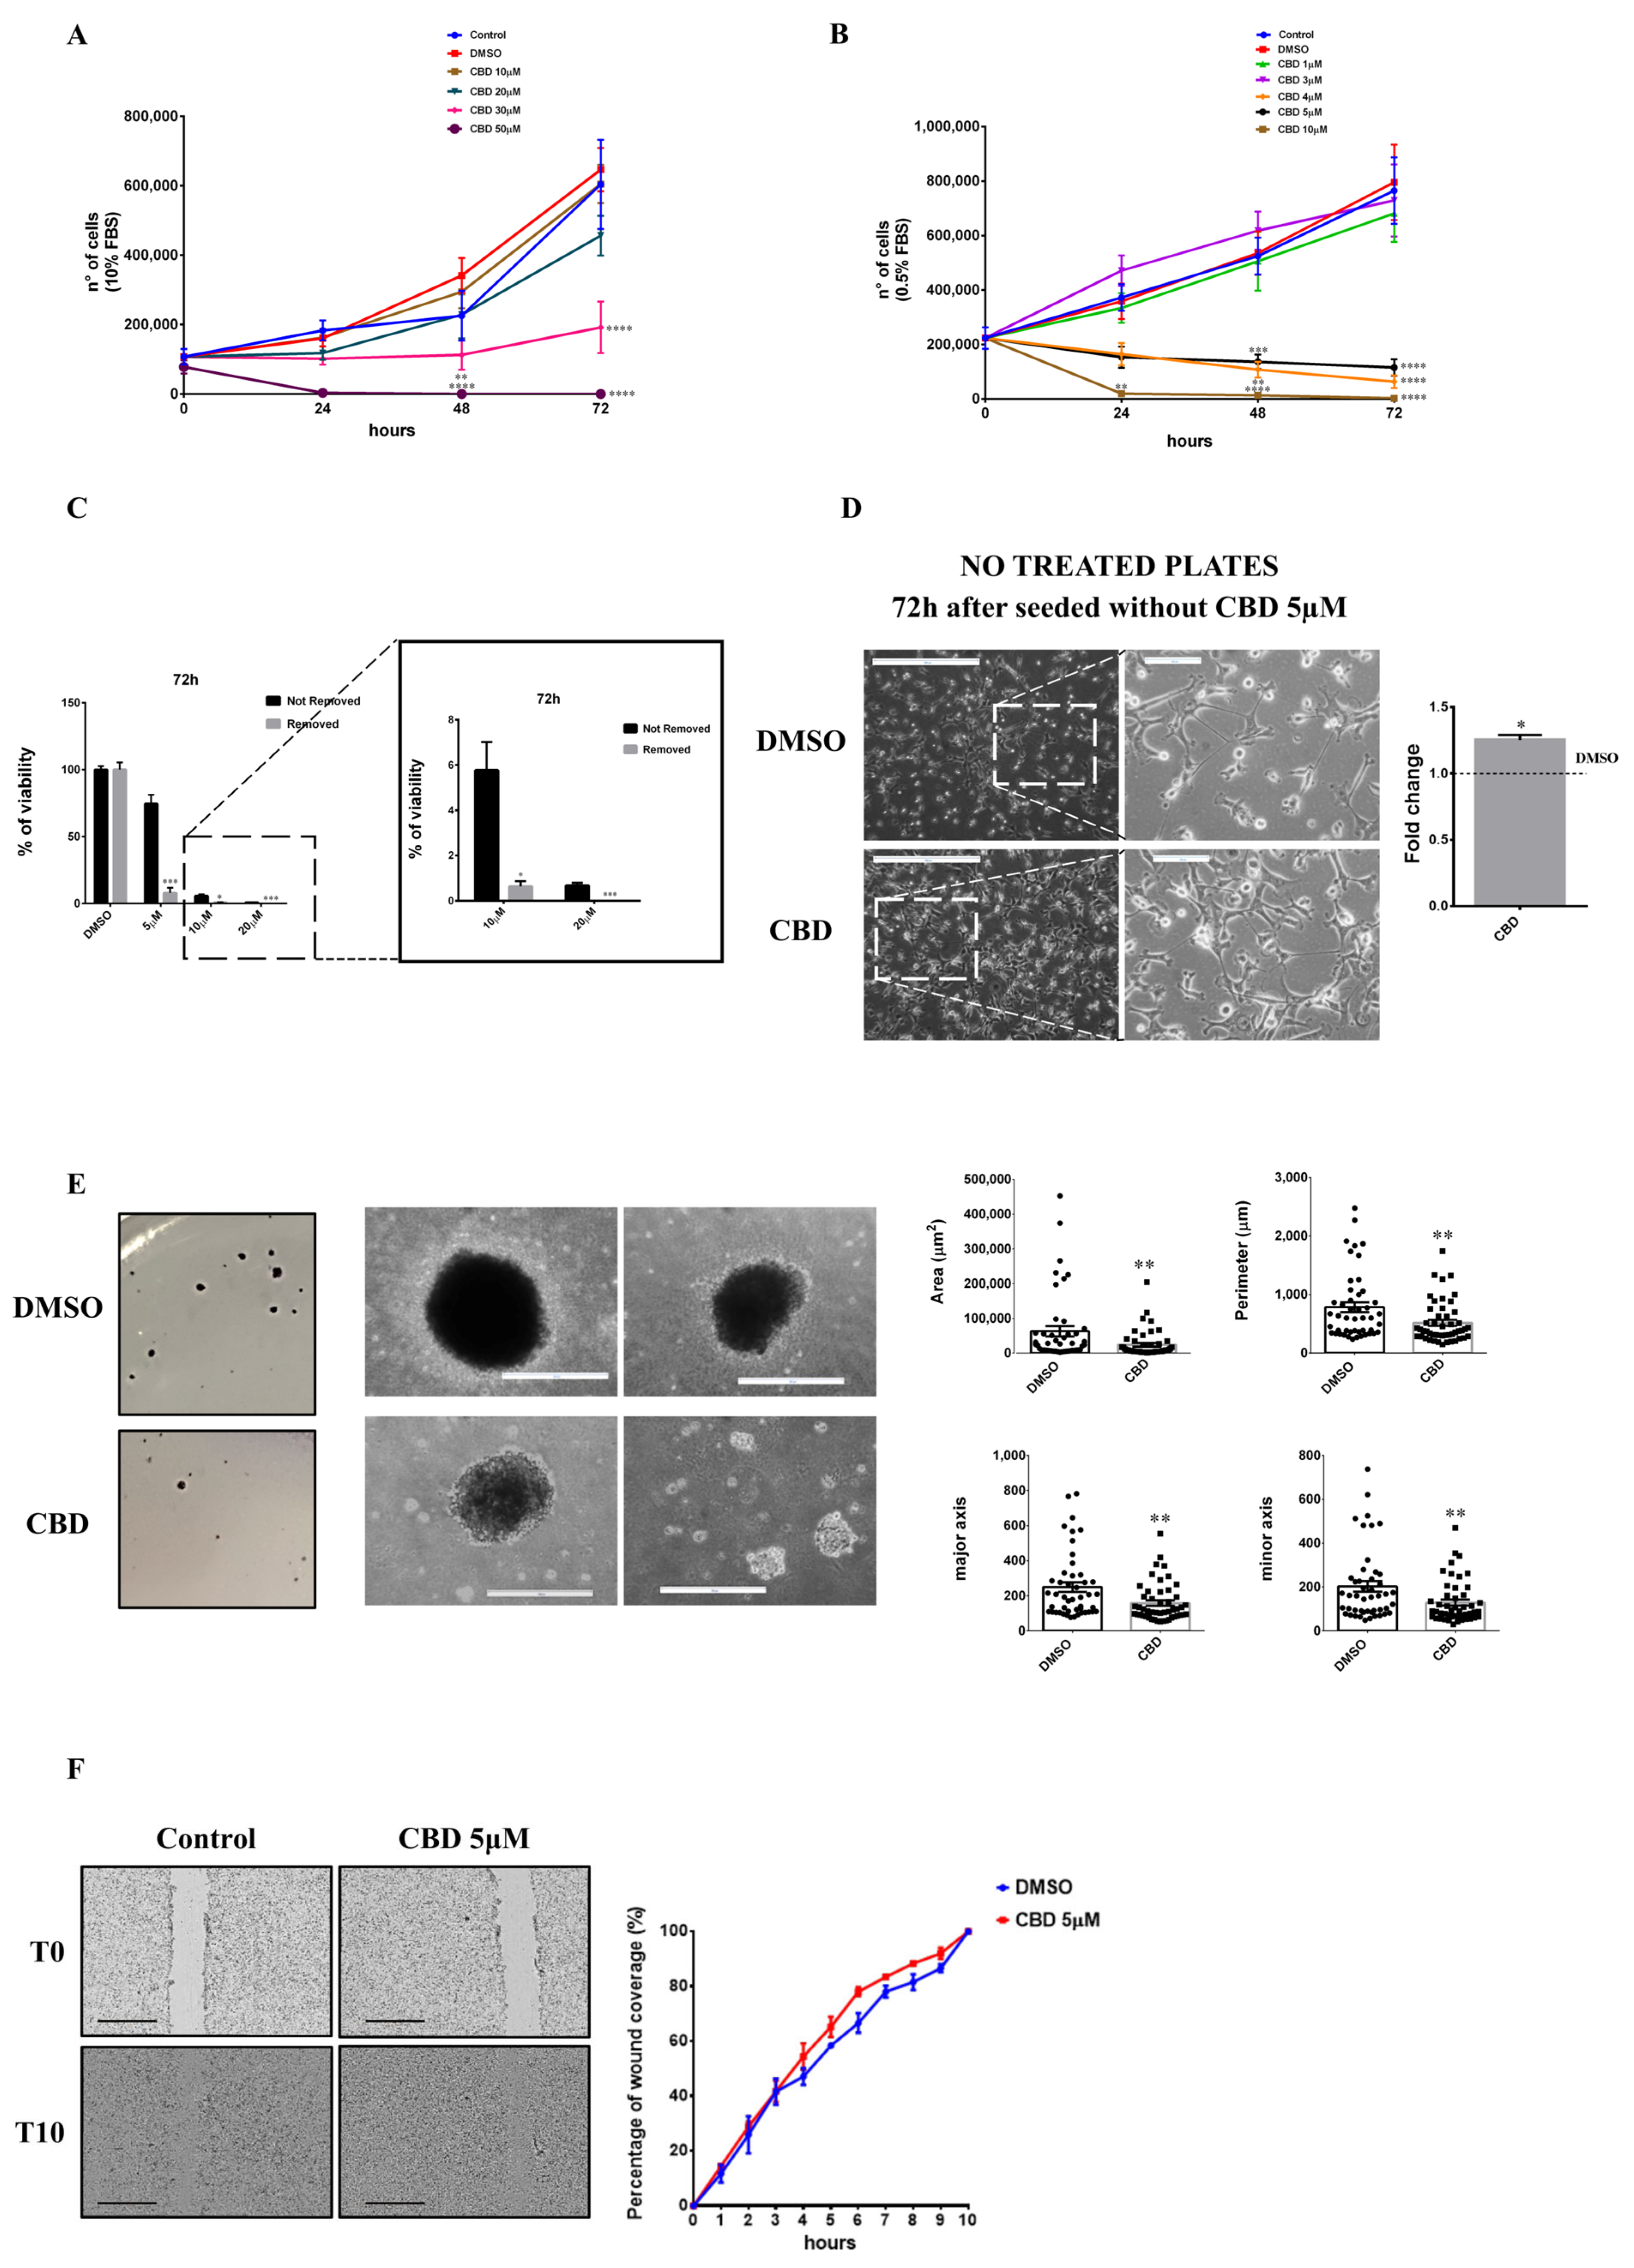
Abstract
:1. Introduction
2. Results
2.1. Biological Effects of CBD on MDA-MB-231 Cells under Low and High Serum Growth Conditions
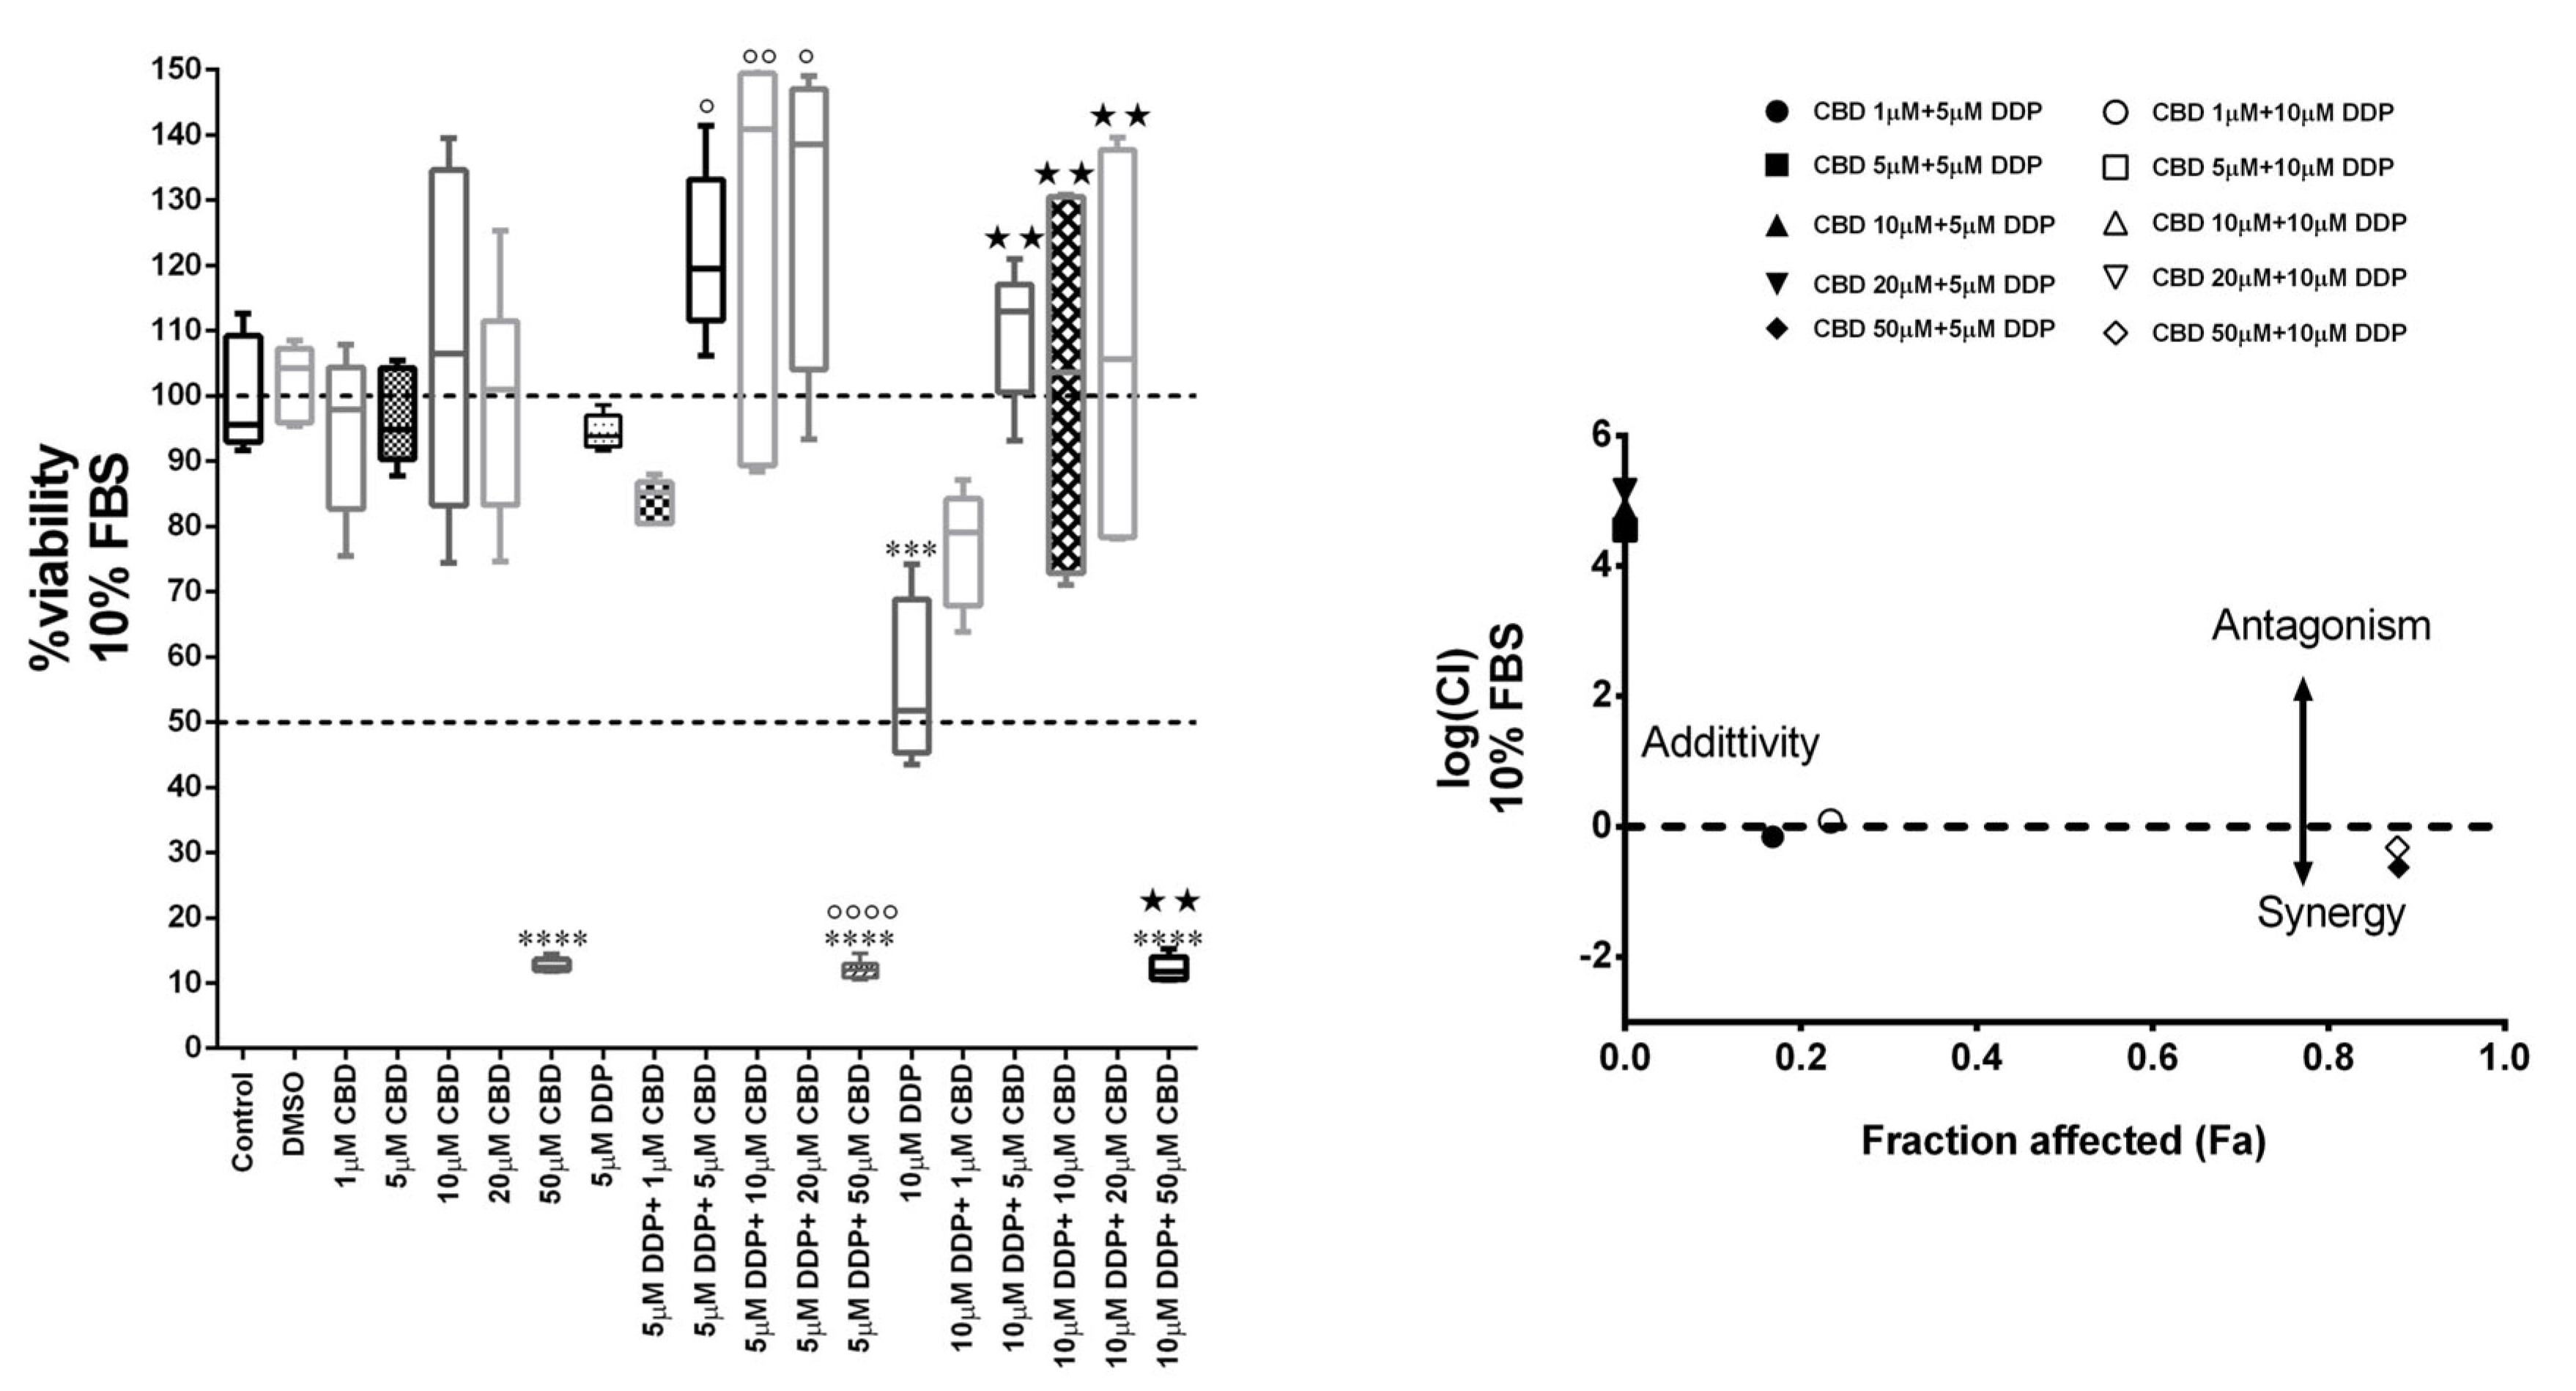
2.2. Antagonist Effect of CBD with Cisplatin in MDA-MB-231 Cell Line
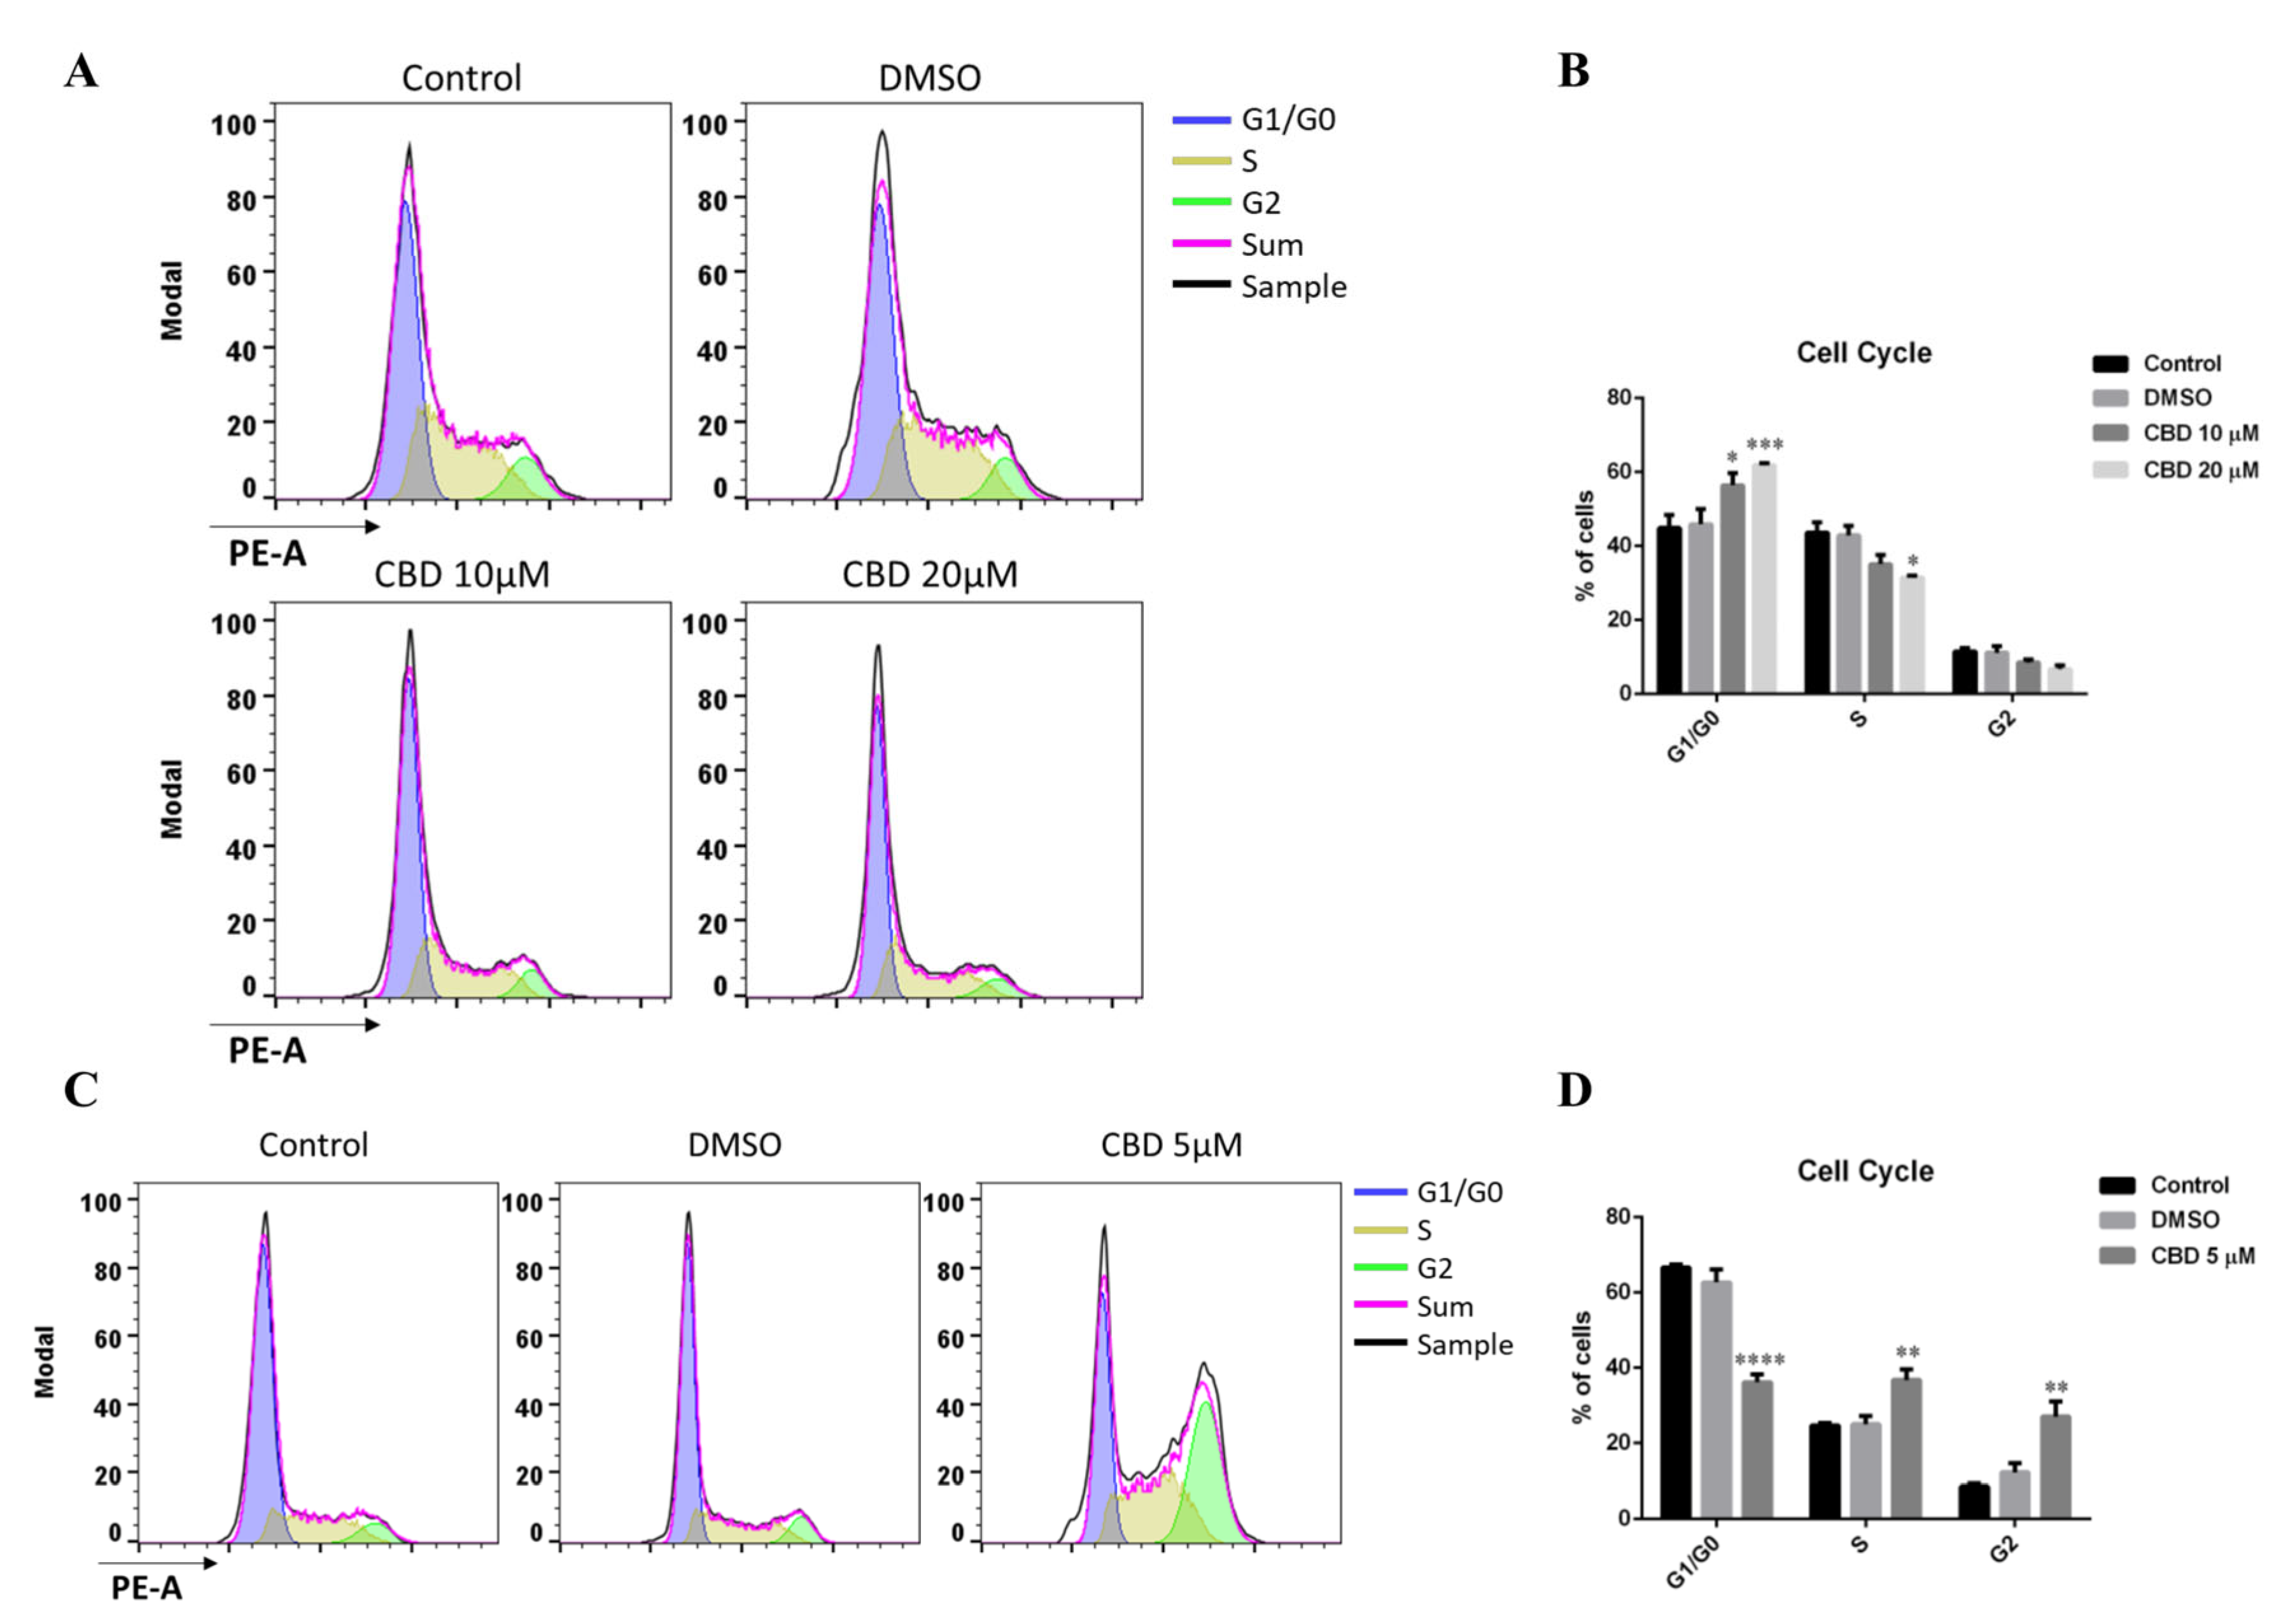
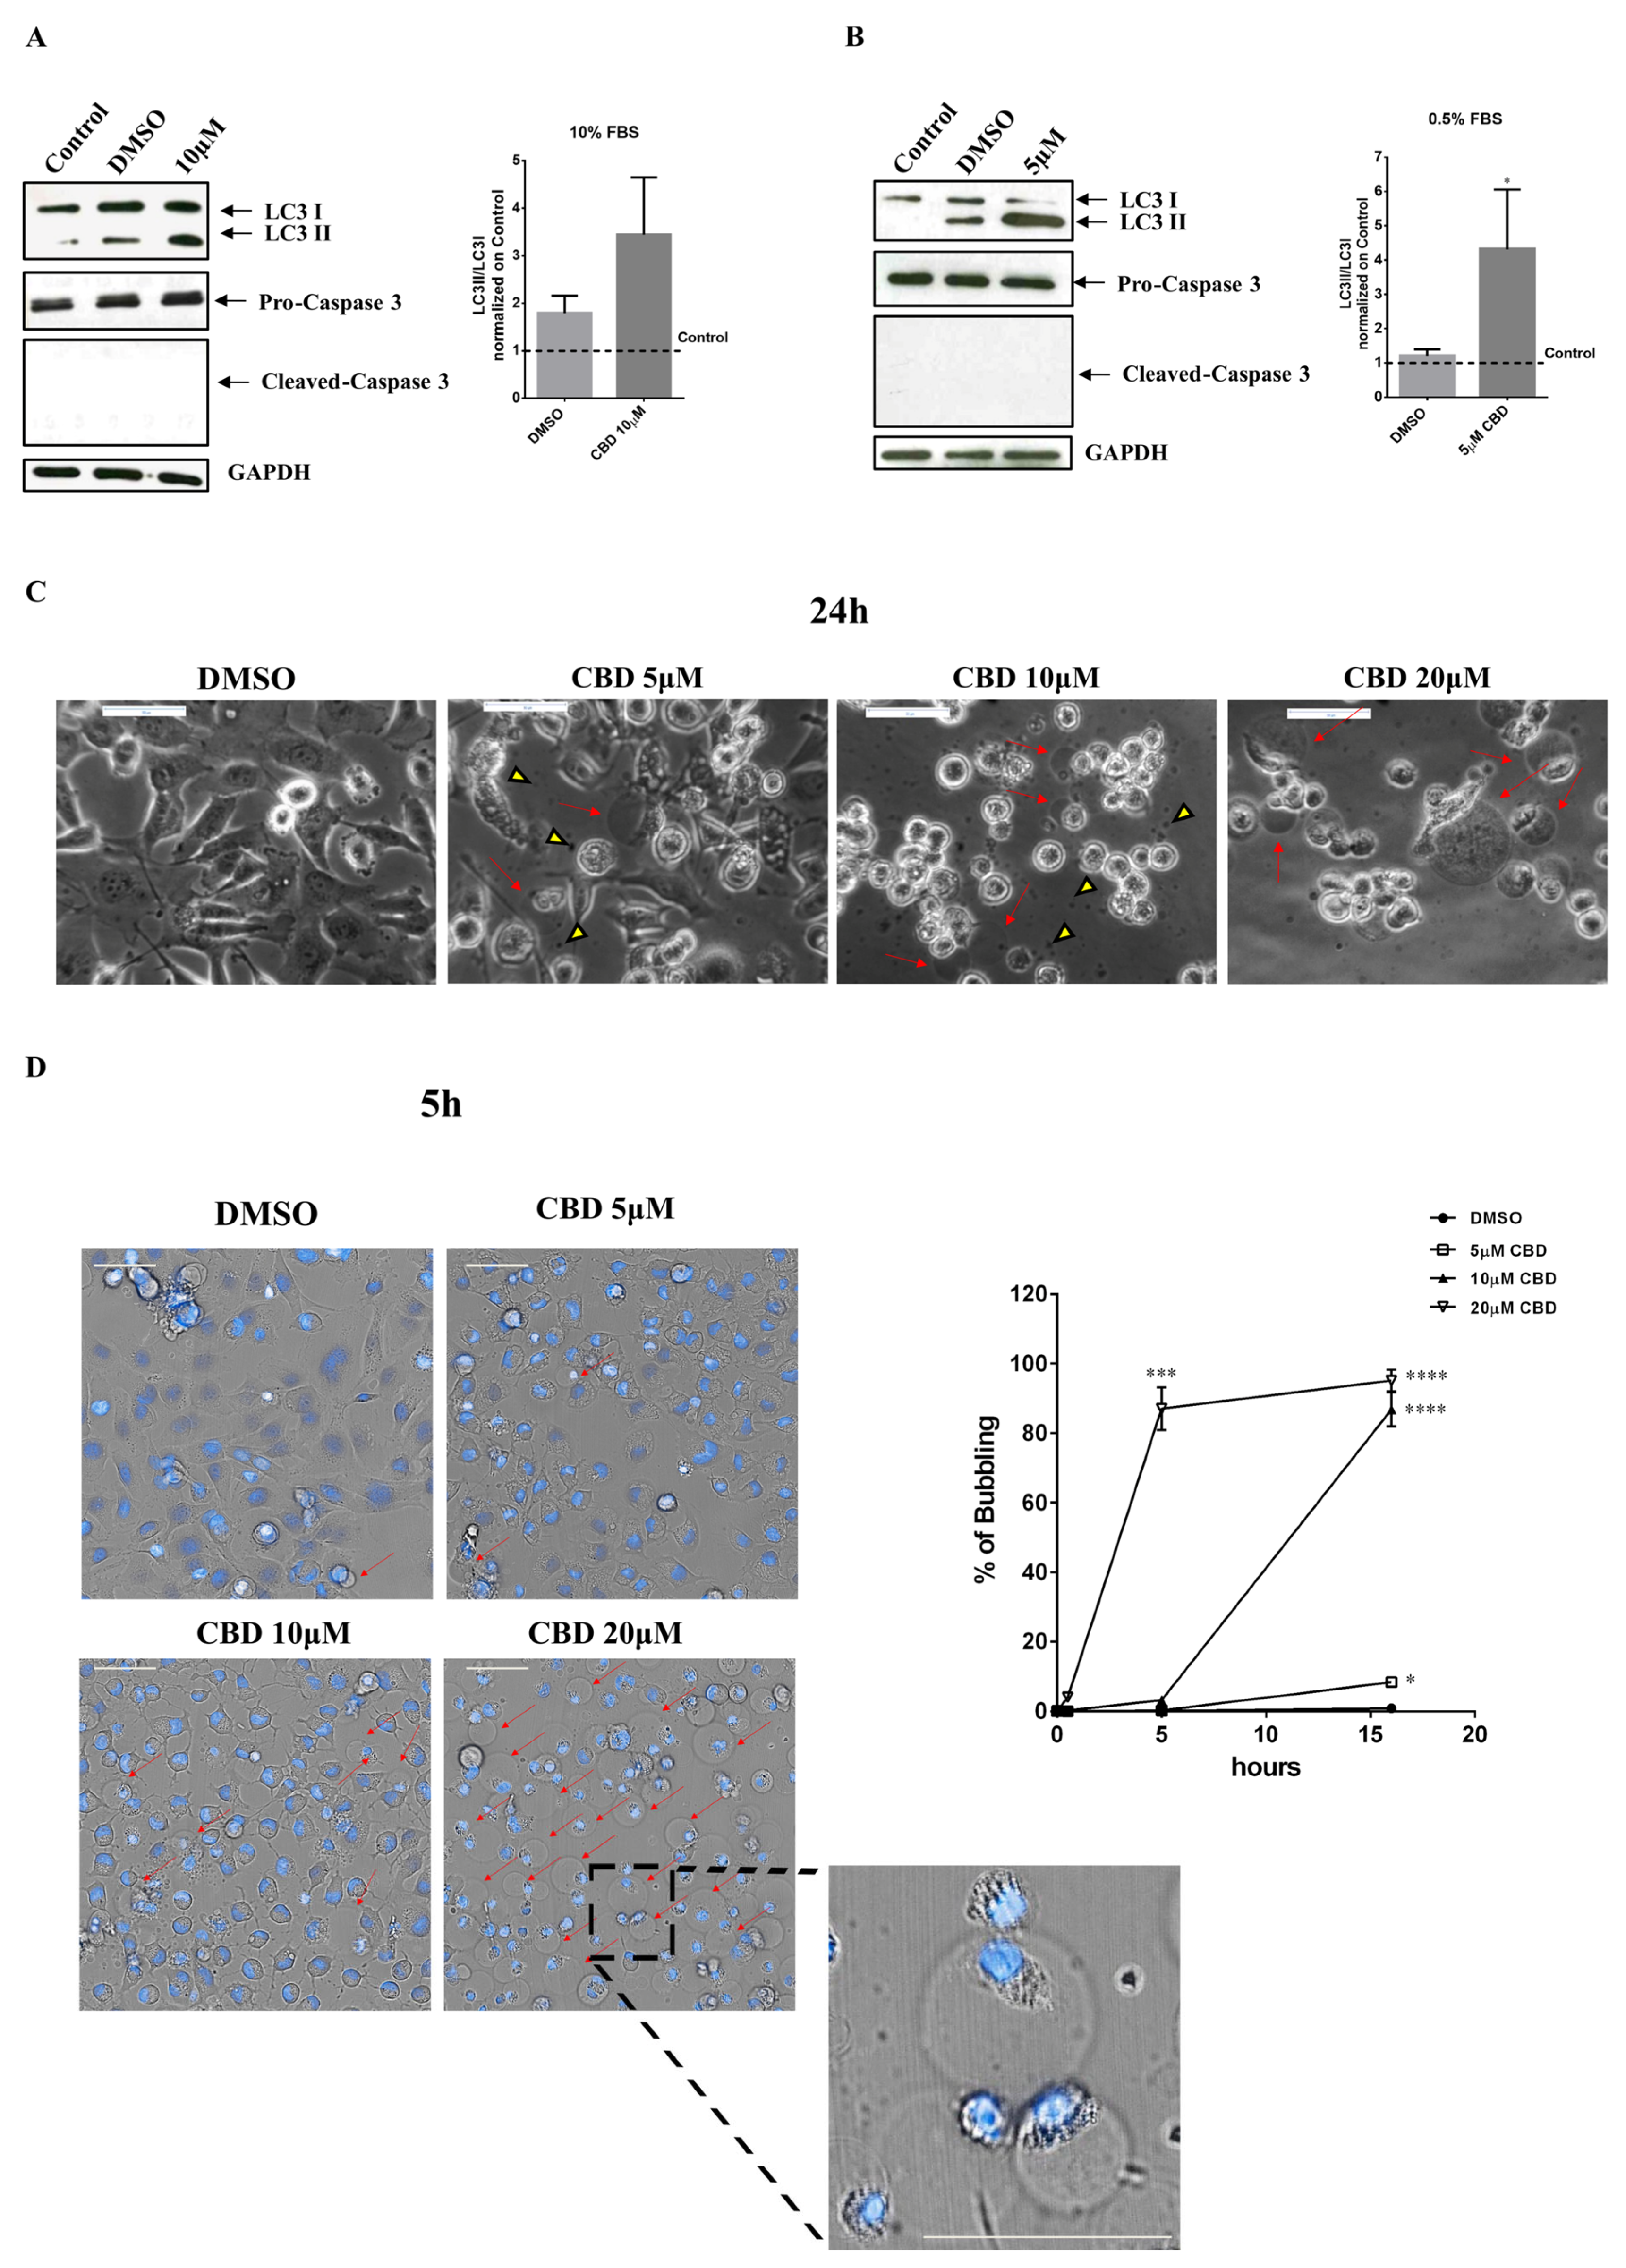
2.3. Effect of CBD on Autophagy, Apoptosis, and Induction of Bubbling Cell Death in the MDA-MB-231 Cell Line
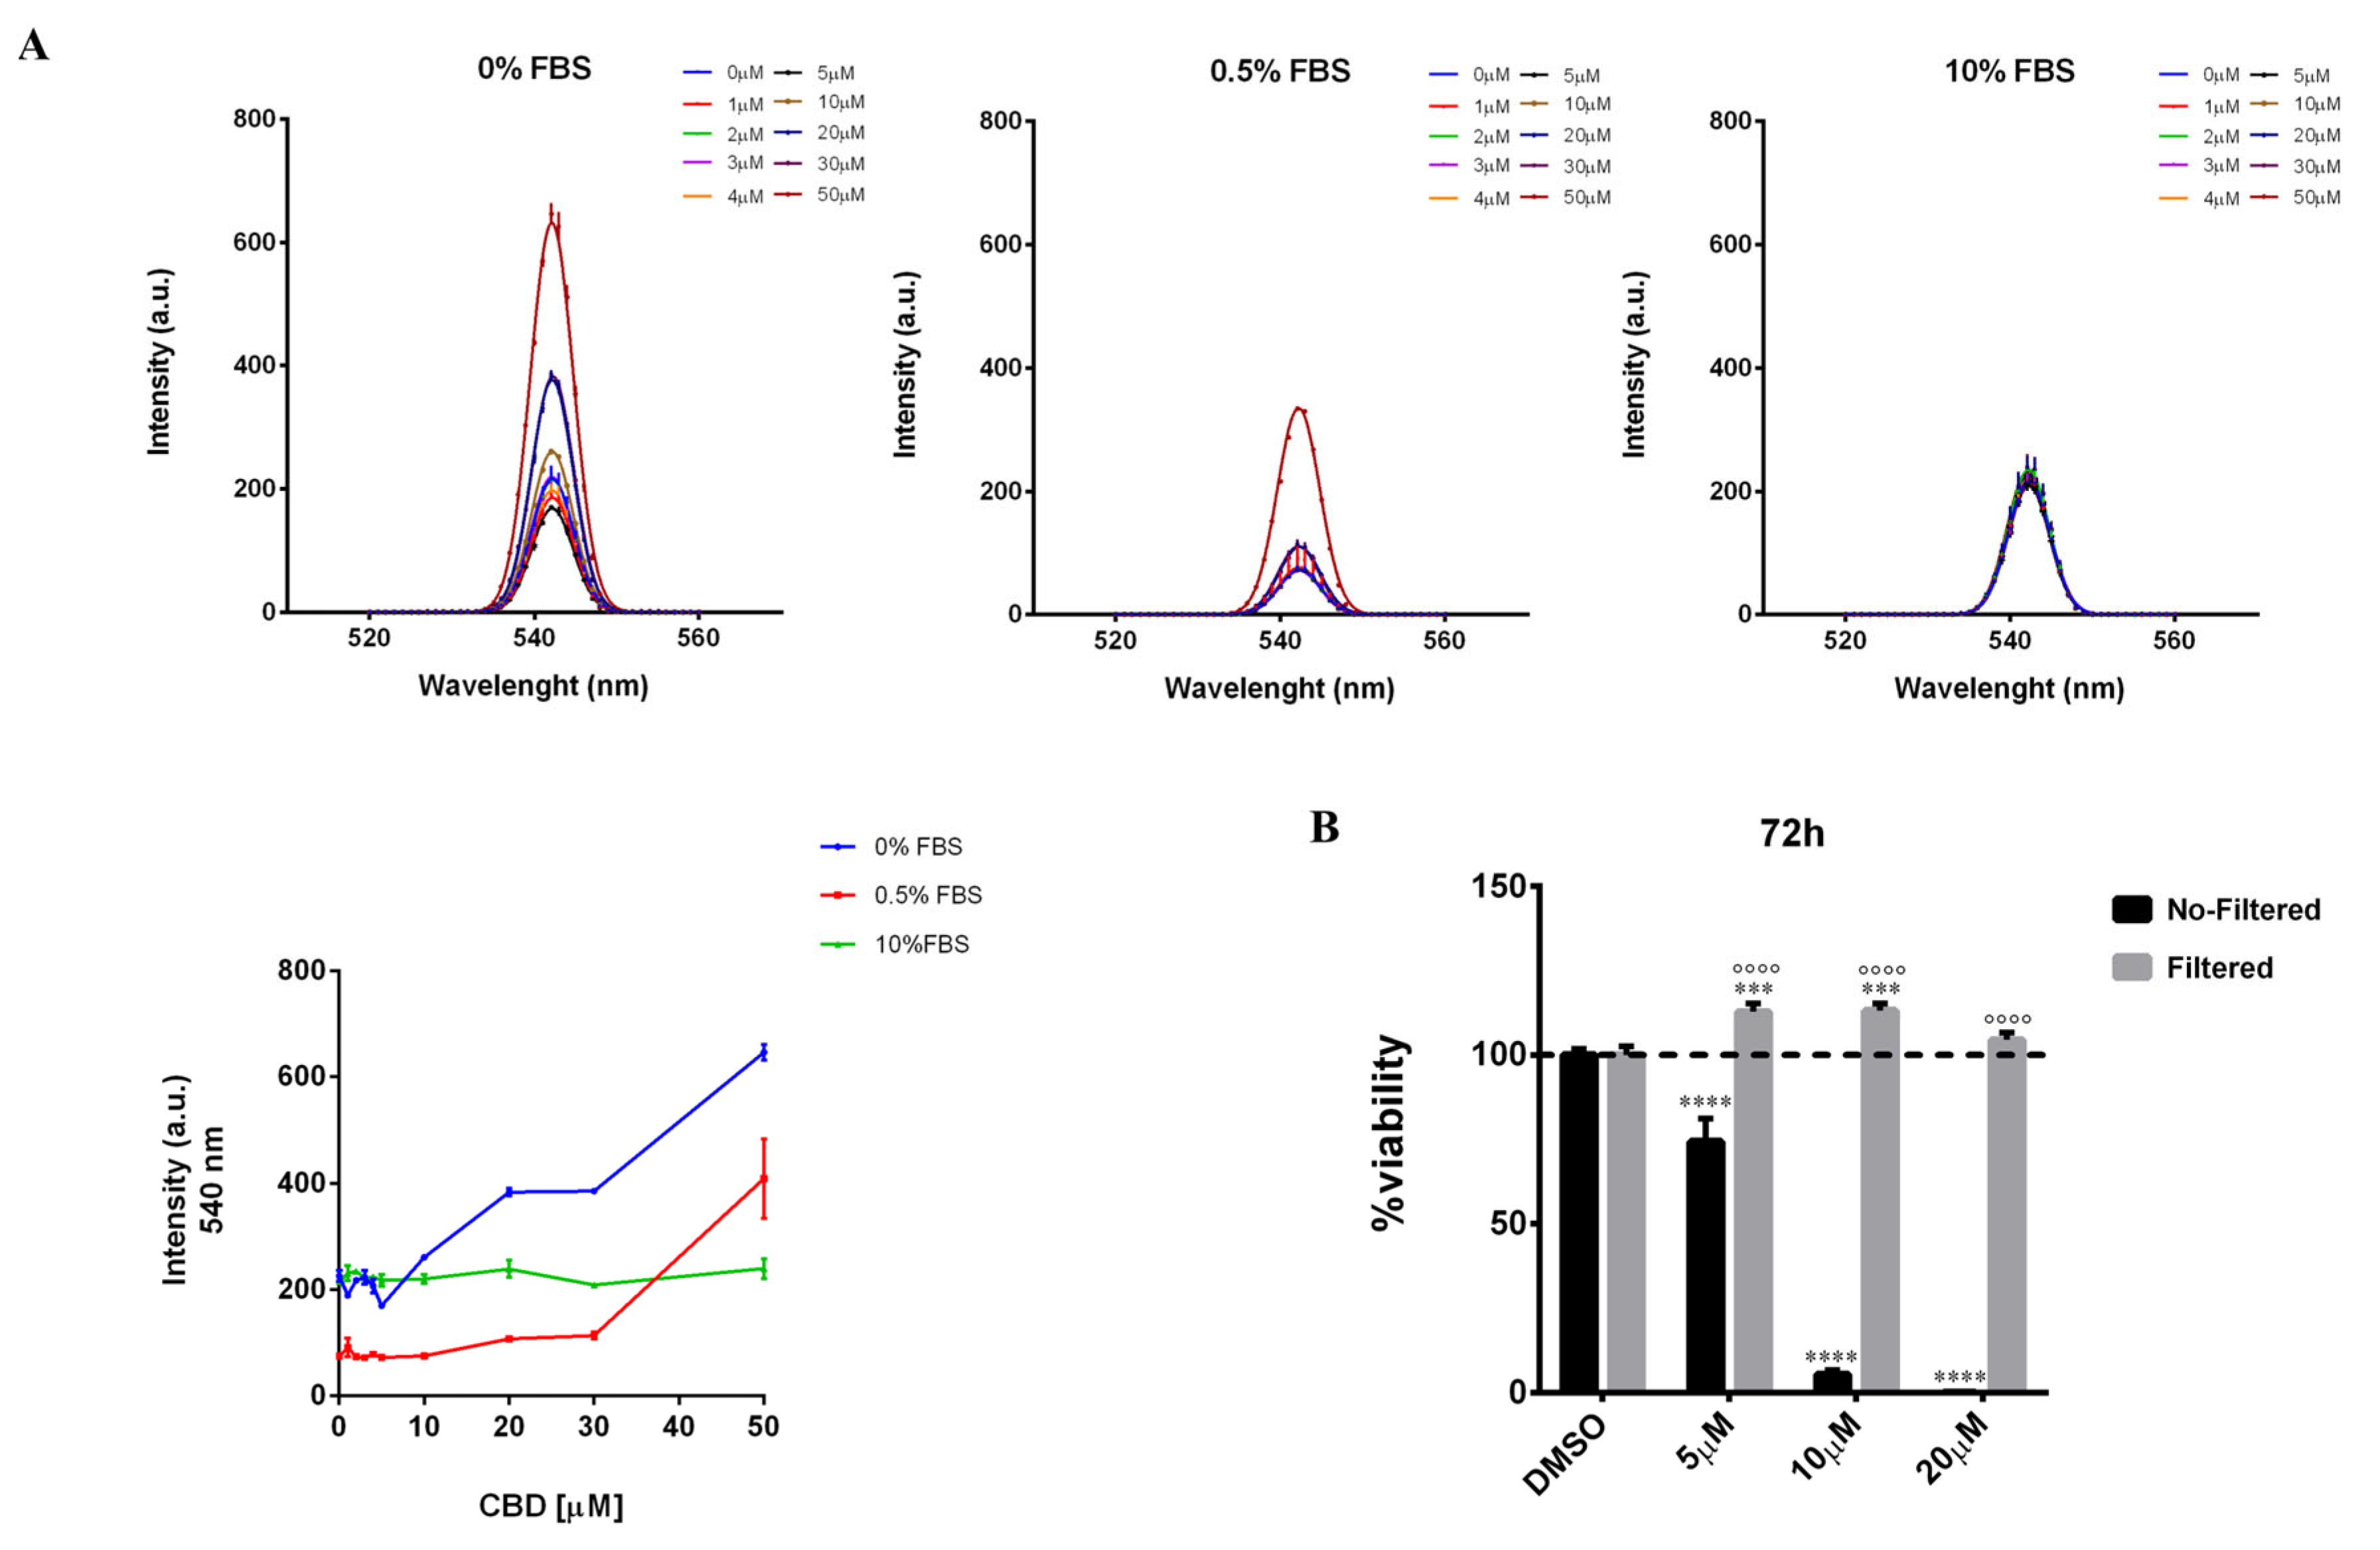
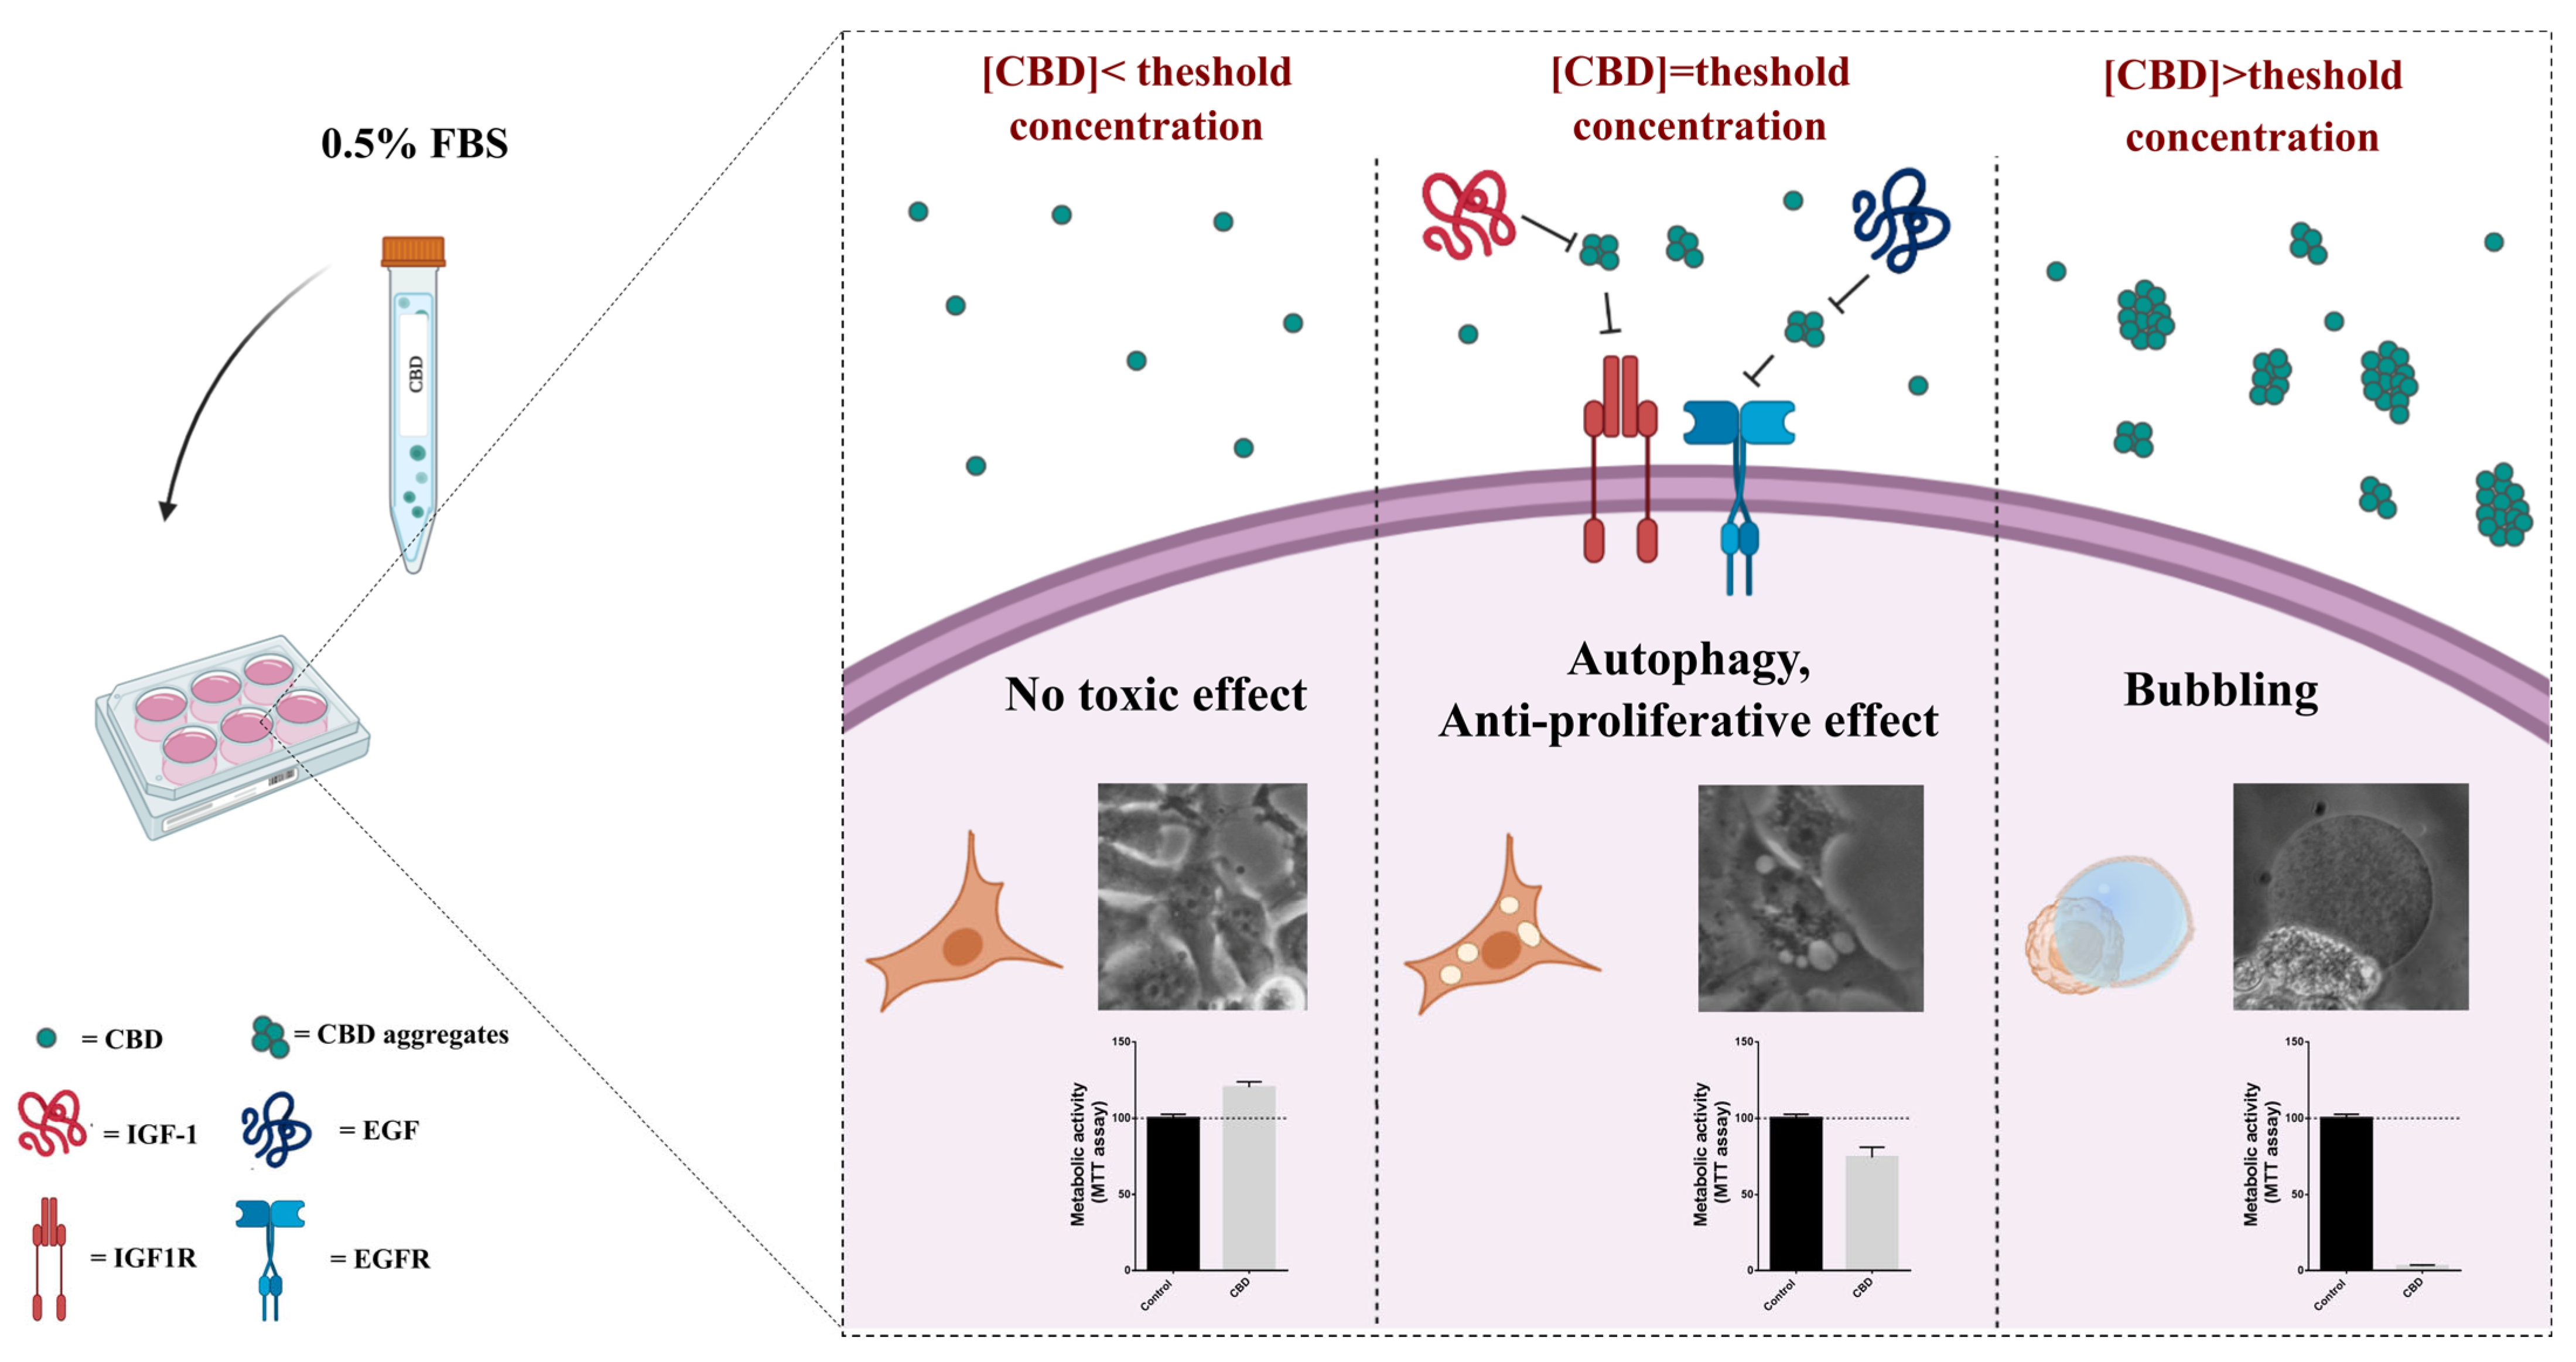
2.4. Serum Interferes with the Threshold Effect of CBD on Cells
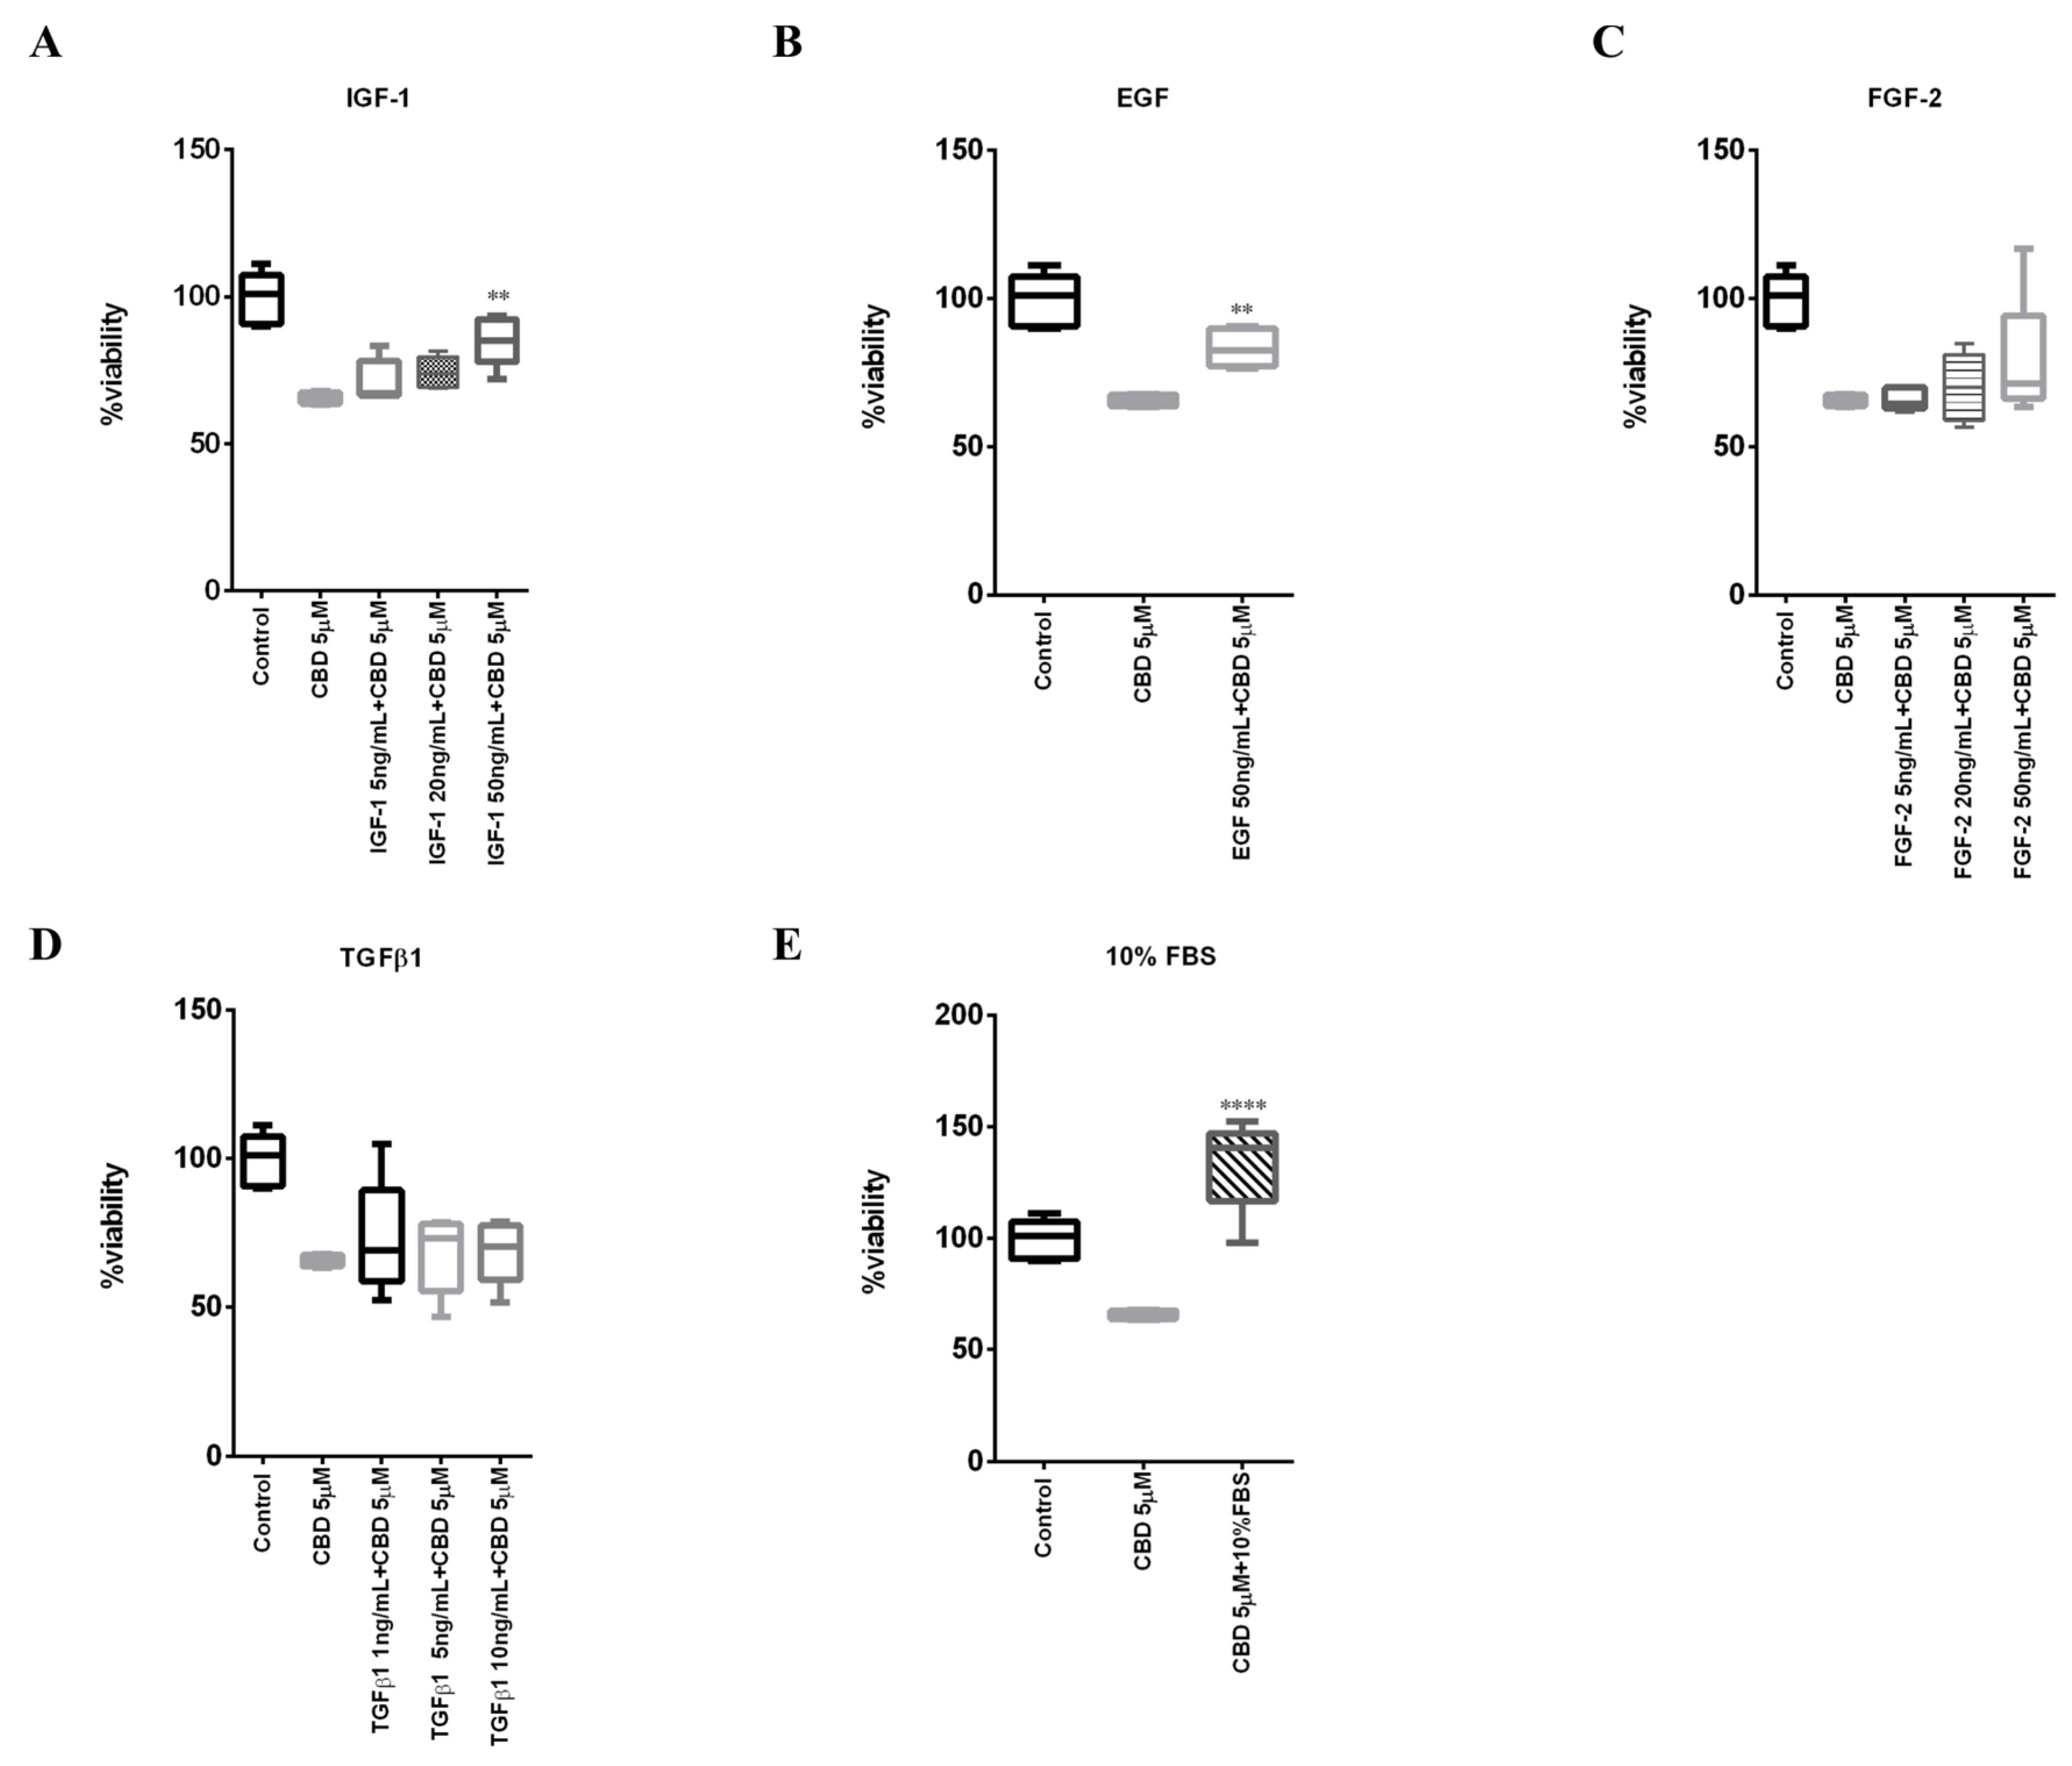
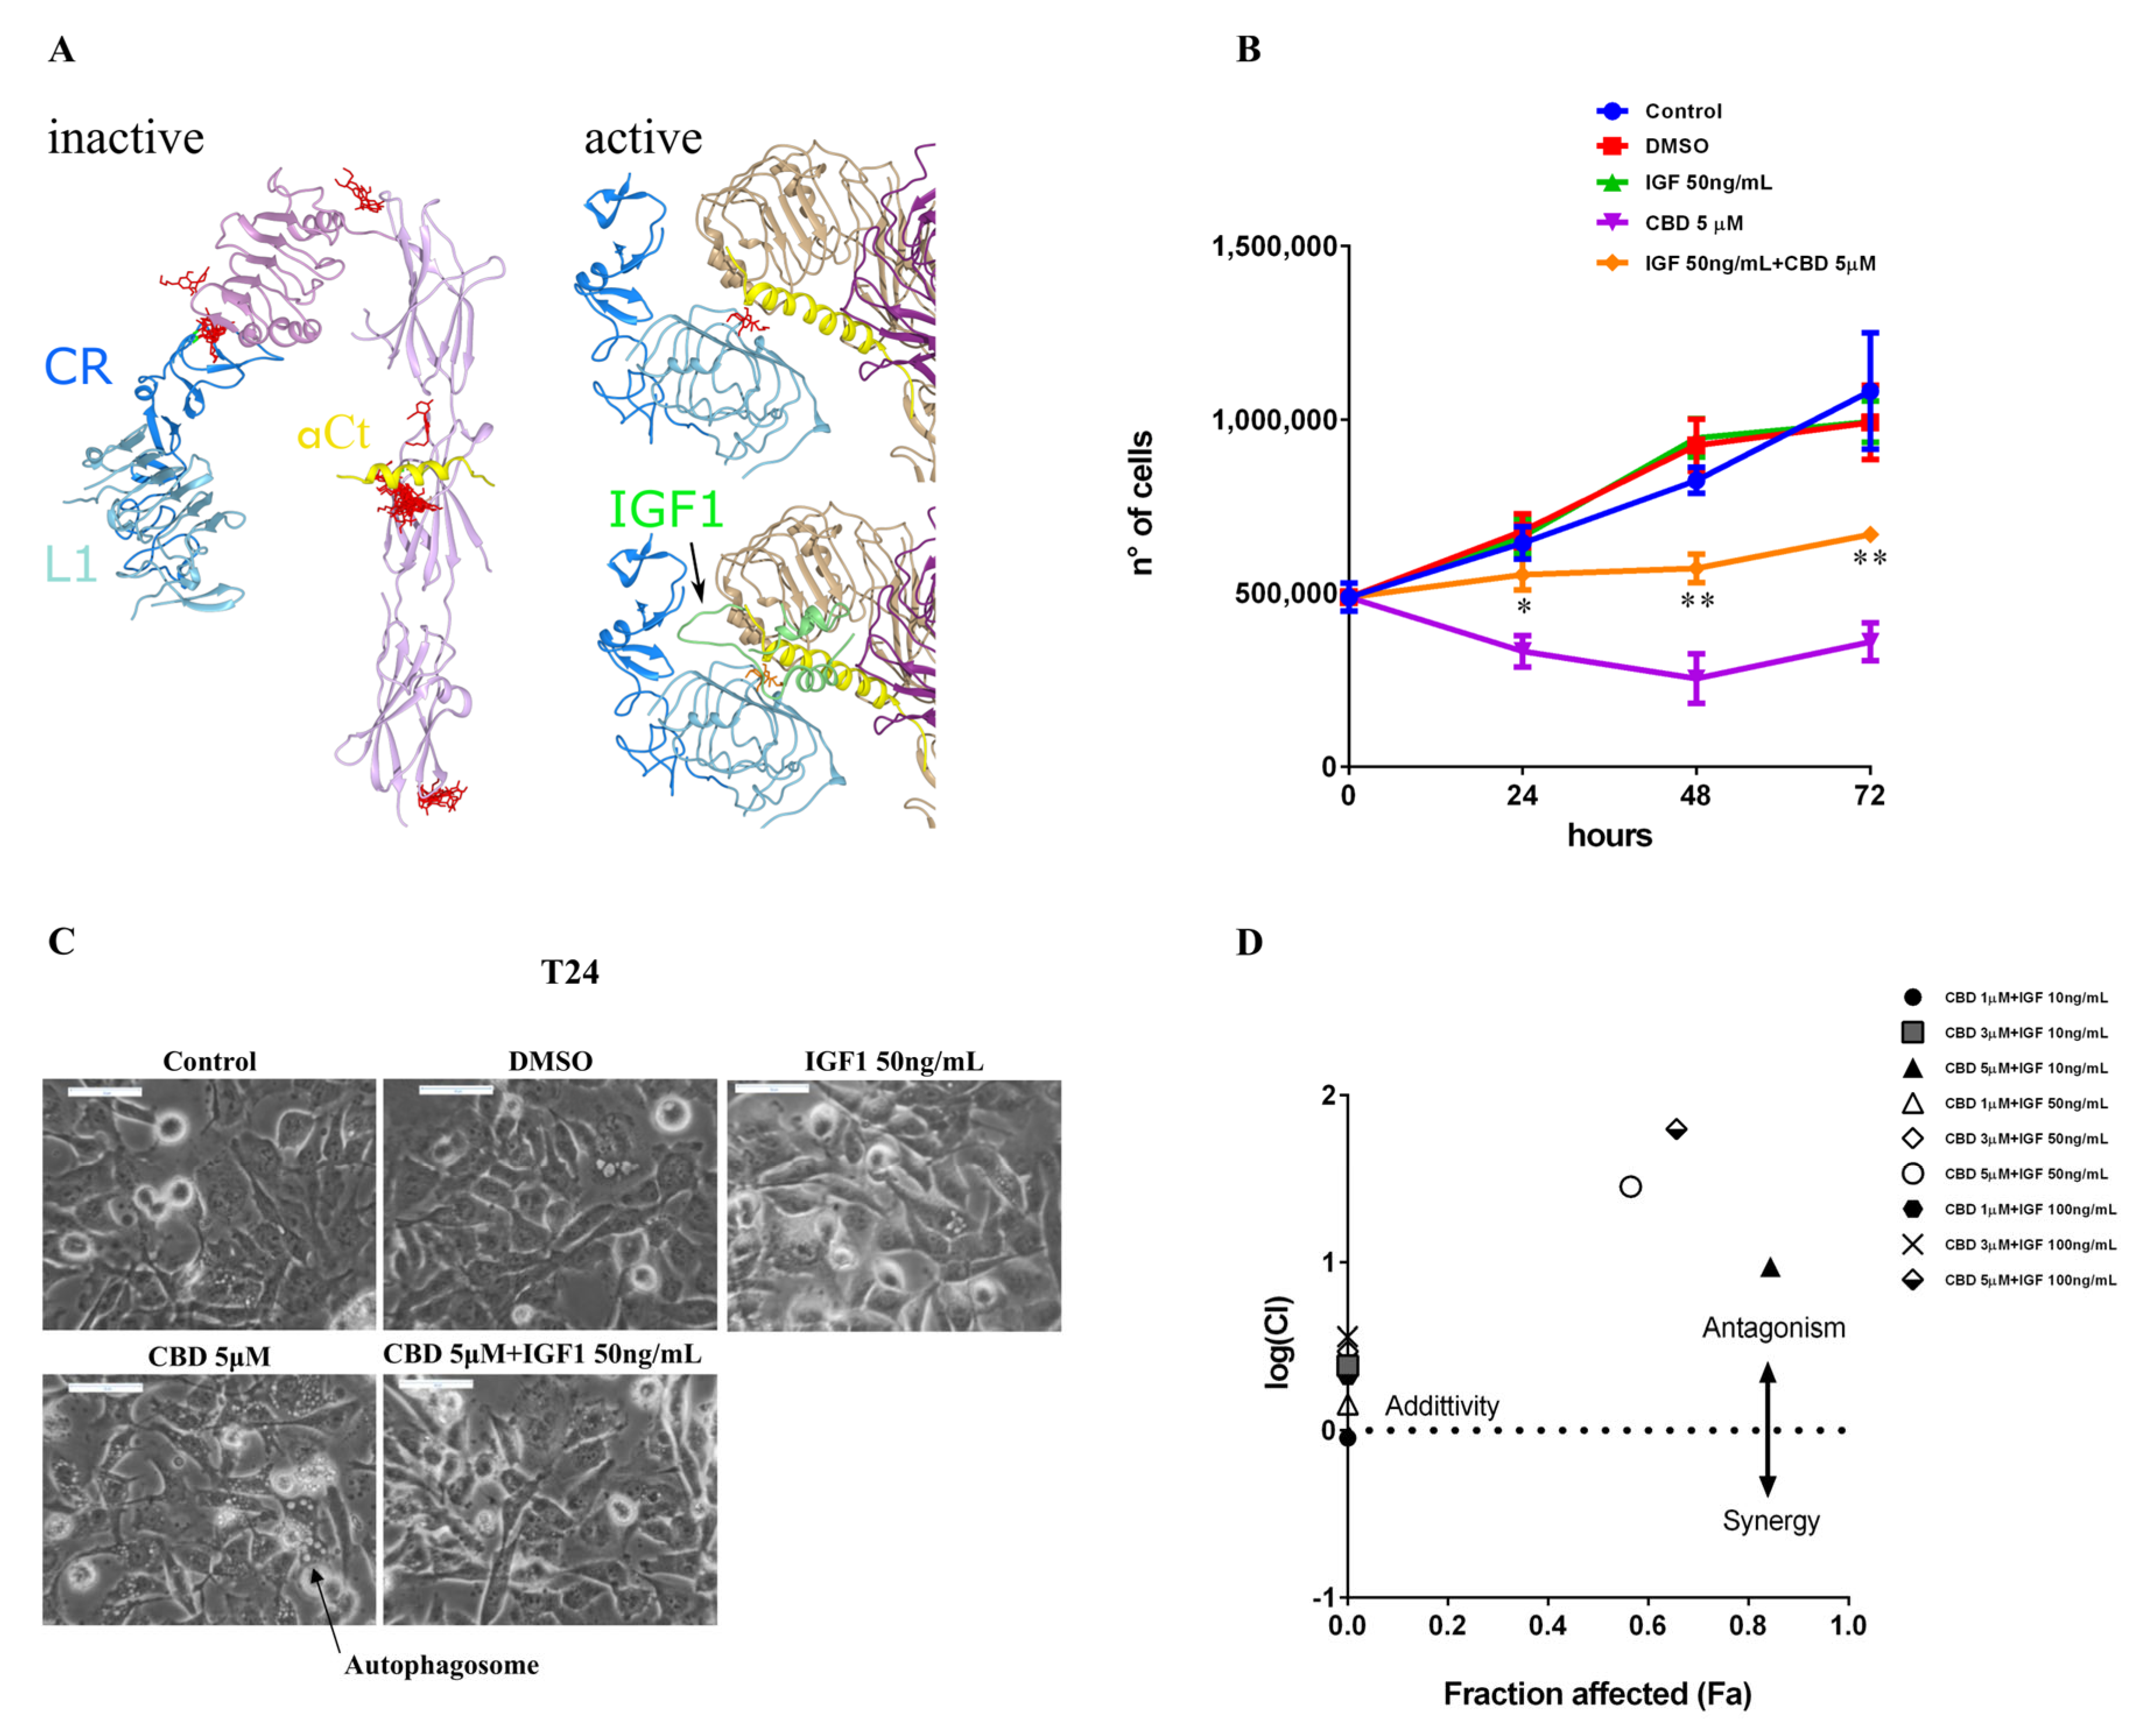
2.5. IGF-1 Antagonizes CBD in Triple-Negative Breast Cancer MDA-MB-231 Cells
3. Discussion
4. Materials and Methods
4.1. Drugs
4.2. Cell Culture
4.3. Cell Viability Trypan Blue Exclusion Assay
4.4. Cell Viability MTT Assay
4.5. Adhesive Properties Analysis
4.6. Soft Agar Colony Formation Assay
4.7. Wound-Healing Assay
4.8. Treatment with Chemotherapeutic Drugs
4.9. Co-Treatment with CBD and DDP
4.10. Cell Cycle Analysis by Flow Cytometry
4.11. Western Blot Analysis
4.12. Bubbling Cell Death
4.13. Light Scattering
4.14. Cell Viability MTT Assay in Presence of Filtered CBD
4.15. Co-Treatment with CBD and Different Growth Factors
4.16. Co-Treatment with CBD and IGF-1
4.17. Drug Combination Analysis
4.18. Docking Analyses
5. Conclusions
Supplementary Materials
Author Contributions
Funding
Institutional Review Board Statement
Informed Consent Statement
Data Availability Statement
Acknowledgments
Conflicts of Interest
References
- Mangal, N.; Erridge, S.; Habib, N.; Sadanandam, A.; Reebye, V.; Sodergren, M.H. Cannabinoids in the Landscape of Cancer. J. Cancer Res. Clin. Oncol. 2021, 147, 2507–2534. [Google Scholar] [CrossRef] [PubMed]
- Nahler, G. Cannabidiol and Other Phytocannabinoids as Cancer Therapeutics. Pharm. Med. 2022, 36, 99–129. [Google Scholar] [CrossRef] [PubMed]
- Munson, A.E.; Harris, L.S.; Friedman, M.A.; Dewey, W.L.; Carchman, R.A. Antineoplastic Activity of Cannabinoids2. J. Natl. Cancer Inst. 1975, 55, 597–602. [Google Scholar] [CrossRef] [PubMed]
- Ligresti, A.; Moriello, A.S.; Starowicz, K.; Matias, I.; Pisanti, S.; De Petrocellis, L.; Laezza, C.; Portella, G.; Bifulco, M.; Di Marzo, V. Antitumor Activity of Plant Cannabinoids with Emphasis on the Effect of Cannabidiol on Human Breast Carcinoma. J. Pharmacol. Exp. Ther. 2006, 318, 1375–1387. [Google Scholar] [CrossRef] [PubMed] [Green Version]
- Fowler, C.J. Delta(9)-Tetrahydrocannabinol and Cannabidiol as Potential Curative Agents for Cancer: A Critical Examination of the Preclinical Literature. Clin. Pharmacol. Ther. 2015, 97, 587–596. [Google Scholar] [CrossRef]
- Ramer, R.; Heinemann, K.; Merkord, J.; Rohde, H.; Salamon, A.; Linnebacher, M.; Hinz, B. COX-2 and PPAR-γ Confer Cannabidiol-Induced Apoptosis of Human Lung Cancer Cells. Mol. Cancer Ther. 2013, 12, 69–82. [Google Scholar] [CrossRef] [Green Version]
- Inhibition of Colon Carcinogenesis by a Standardized Cannabis Sativa Extract with High Content of Cannabidiol. Phytomedicine 2014, 21, 631–639. [CrossRef]
- Morelli, M.B.; Offidani, M.; Alesiani, F.; Discepoli, G.; Liberati, S.; Olivieri, A.; Santoni, M.; Santoni, G.; Leoni, P.; Nabissi, M. The Effects of Cannabidiol and Its Synergism with Bortezomib in Multiple Myeloma Cell Lines. A Role for Transient Receptor Potential Vanilloid Type-2. Int. J. Cancer 2014, 134, 2534–2546. [Google Scholar] [CrossRef]
- Go, Y.Y.; Kim, S.R.; Kim, D.Y.; Chae, S.-W.; Song, J.-J. Cannabidiol Enhances Cytotoxicity of Anti-Cancer Drugs in Human Head and Neck Squamous Cell Carcinoma. Sci. Rep. 2020, 10, 20622–20632. [Google Scholar] [CrossRef]
- Novel Mechanism of Cannabidiol-Induced Apoptosis in Breast Cancer Cell Lines. Breast 2018, 41, 34–41. [CrossRef]
- Shrivastava, A.; Kuzontkoski, P.M.; Groopman, J.E.; Prasad, A. Cannabidiol Induces Programmed Cell Death in Breast Cancer Cells by Coordinating the Cross-Talk between Apoptosis and Autophagy. Mol. Cancer Ther. 2011, 10, 1161–1172. [Google Scholar] [CrossRef] [PubMed] [Green Version]
- Solinas, M.; Massi, P.; Cinquina, V.; Valenti, M.; Bolognini, D.; Gariboldi, M.; Monti, E.; Rubino, T.; Parolaro, D. Cannabidiol, a Non-Psychoactive Cannabinoid Compound, Inhibits Proliferation and Invasion in U87-MG and T98G Glioma Cells through a Multitarget Effect. PLoS ONE 2013, 8, e76918. [Google Scholar] [CrossRef] [PubMed] [Green Version]
- Macpherson, T.; Armstrong, J.A.; Criddle, D.N.; Wright, K.L. Physiological Intestinal Oxygen Modulates the Caco-2 Cell Model and Increases Sensitivity to the Phytocannabinoid Cannabidiol. In Vitro Cell. Dev. Biol. Anim. 2014, 50, 417–426. [Google Scholar] [CrossRef] [PubMed]
- Sainz-Cort, A.; Müller-Sánchez, C.; Espel, E. Anti-Proliferative and Cytotoxic Effect of Cannabidiol on Human Cancer Cell Lines in Presence of Serum. BMC Res. Notes 2020, 13, 389–394. [Google Scholar] [CrossRef] [PubMed]
- Jacobsson, S.O.; Rongård, E.; Stridh, M.; Tiger, G.; Fowler, C.J. Serum-Dependent Effects of Tamoxifen and Cannabinoids upon C6 Glioma Cell Viability. Biochem. Pharmacol. 2000, 60, 1807–1813. [Google Scholar] [CrossRef]
- Haustein, M.; Ramer, R.; Linnebacher, M.; Manda, K.; Hinz, B. Cannabinoids Increase Lung Cancer Cell Lysis by Lymphokine-Activated Killer Cells via Upregulation of ICAM-1. Biochem. Pharmacol. 2014, 92, 312–325. [Google Scholar] [CrossRef]
- Zhang, X.; Qin, Y.; Pan, Z.; Li, M.; Liu, X.; Chen, X.; Qu, G.; Zhou, L.; Xu, M.; Zheng, Q.; et al. Cannabidiol Induces Cell Cycle Arrest and Cell Apoptosis in Human Gastric Cancer SGC-7901 Cells. Biomolecules 2019, 9, 302–318. [Google Scholar] [CrossRef] [Green Version]
- Eisenberg-Lerner, A.; Bialik, S.; Simon, H.-U.; Kimchi, A. Life and Death Partners: Apoptosis, Autophagy and the Cross-Talk between Them. Cell Death Differ. 2009, 16, 966–975. [Google Scholar] [CrossRef]
- Kang, R.; Zeh, H.J.; Lotze, M.T.; Tang, D. The Beclin 1 Network Regulates Autophagy and Apoptosis. Cell Death Differ. 2011, 18, 571–580. [Google Scholar] [CrossRef]
- Vrechi, T.A.M.; Leão, A.H.F.F.; Morais, I.B.M.; Abílio, V.C.; Zuardi, A.W.; Hallak, J.E.C.; Crippa, J.A.; Bincoletto, C.; Ureshino, R.P.; Smaili, S.S.; et al. Cannabidiol Induces Autophagy via ERK1/2 Activation in Neural Cells. Sci. Rep. 2021, 11, 5434–5446. [Google Scholar] [CrossRef]
- Chen, S.-J.; Lin, P.-W.; Lin, H.-P.; Huang, S.-S.; Lai, F.-J.; Sheu, H.-M.; Hsu, L.-J.; Chang, N.-S. UV Irradiation/cold Shock-Mediated Apoptosis Is Switched to Bubbling Cell Death at Low Temperatures. Oncotarget 2015, 6, 8007–8018. [Google Scholar] [CrossRef] [PubMed] [Green Version]
- Chang, N.-S. Bubbling Cell Death: A Hot Air Balloon Released from the Nucleus in the Cold. Exp. Biol. Med. 2016, 241, 1306–1315. [Google Scholar] [CrossRef] [PubMed] [Green Version]
- Pagano, S.; Coniglio, M.; Valenti, C.; Federici, M.I.; Lombardo, G.; Cianetti, S.; Marinucci, L. Biological Effects of Cannabidiol on Normal Human Healthy Cell Populations: Systematic Review of the Literature. Biomed. Pharmacother. 2020, 132, 110728–110744. [Google Scholar] [CrossRef]
- Davison, Z.; de Blacquière, G.E.; Westley, B.R.; May, F.E.B. Insulin-like Growth Factor-Dependent Proliferation and Survival of Triple-Negative Breast Cancer Cells: Implications for Therapy. Neoplasia 2011, 13, 504–515. [Google Scholar] [CrossRef] [Green Version]
- Lee, J.S.; Weiss, J.; Martin, J.L.; Scott, C.D. Increased expression of the mannose 6-phosphate/insulin-like growth factor-II receptor in breast cancer cells alters tumorigenic properties in Vitro and in Vivo. Int. J. Cancer 2003, 107, 564–570. [Google Scholar] [CrossRef] [PubMed]
- Elbaz, M.; Nasser, M.W.; Ravi, J.; Wani, N.A.; Ahirwar, D.K.; Zhao, H.; Oghumu, S.; Satoskar, A.R.; Shilo, K.; Carson, W.E.; et al. Modulation of the Tumor Microenvironment and Inhibition of EGF/EGFR Pathway: Novel Anti-Tumor Mechanisms of Cannabidiol in Breast Cancer. Mol. Oncol. 2015, 9, 906–919. [Google Scholar] [CrossRef] [PubMed] [Green Version]
- Mauro, L.; Bartucci, M.; Morelli, C.; Andò, S.; Surmacz, E. IGF-I Receptor-Induced Cell-Cell Adhesion of MCF-7 Breast Cancer Cells Requires the Expression of Junction Protein ZO-1. J. Biol. Chem. 2001, 276, 39892–39897. [Google Scholar] [CrossRef] [Green Version]
- Mauro, L.; Salerno, M.; Morelli, C.; Boterberg, T.; Bracke, M.E.; Surmacz, E. Role of the IGF-I Receptor in the Regulation of Cell-Cell Adhesion: Implications in Cancer Development and Progression. J. Cell. Physiol. 2003, 194, 108–116. [Google Scholar] [CrossRef]
- Xu, Y.; Kong, G.K.-W.; Menting, J.G.; Margetts, M.B.; Delaine, C.A.; Jenkin, L.M.; Kiselyov, V.V.; De Meyts, P.; Forbes, B.E.; Lawrence, M.C. How Ligand Binds to the Type 1 Insulin-like Growth Factor Receptor. Nat. Commun. 2018, 9, 821–833. [Google Scholar] [CrossRef] [Green Version]
- Ferro, R.; Adamska, A.; Lattanzio, R.; Mavrommati, I.; Edling, C.E.; Arifin, S.A.; Fyffe, C.A.; Sala, G.; Sacchetto, L.; Chiorino, G.; et al. GPR55 Signalling Promotes Proliferation of Pancreatic Cancer Cells and Tumour Growth in Mice, and Its Inhibition Increases Effects of Gemcitabine. Oncogene 2018, 37, 6368–6382. [Google Scholar] [CrossRef]
- Heider, C.G.; Itenberg, S.A.; Rao, J.; Ma, H.; Wu, X. Mechanisms of Cannabidiol (CBD) in Cancer Treatment: A Review. Biology 2022, 11, 817–833. [Google Scholar] [CrossRef] [PubMed]
- Seltzer, E.S.; Watters, A.K.; MacKenzie, D.; Granat, L.M.; Zhang, D. Cannabidiol (CBD) as a Promising Anti-Cancer Drug. Cancers 2020, 12, 3203–3228. [Google Scholar] [CrossRef] [PubMed]
- Wu, W.; Ma, J.; Shao, N.; Shi, Y.; Liu, R.; Li, W.; Lin, Y.; Wang, S. Co-Targeting IGF-1R and Autophagy Enhances the Effects of Cell Growth Suppression and Apoptosis Induced by the IGF-1R Inhibitor NVP-AEW541 in Triple-Negative Breast Cancer Cells. PLoS ONE 2017, 12, e0169229. [Google Scholar] [CrossRef]
- Pathania, A.S.; Guru, S.K.; Kumar, S.; Kumar, A.; Ahmad, M.; Bhushan, S.; Sharma, P.R.; Mahajan, P.; Shah, B.A.; Sharma, S.; et al. Interplay between Cell Cycle and Autophagy Induced by Boswellic Acid Analog. Sci. Rep. 2016, 6, 33146–33159. [Google Scholar] [CrossRef] [Green Version]
- Carrasco-Garcia, E.; Martinez-Lacaci, I.; Mayor-López, L.; Tristante, E.; Carballo-Santana, M.; García-Morales, P.; Ventero Martin, M.P.; Fuentes-Baile, M.; Rodriguez-Lescure, Á.; Saceda, M. PDGFR and IGF-1R Inhibitors Induce a G2/M Arrest and Subsequent Cell Death in Human Glioblastoma Cell Lines. Cells 2018, 7, 131–150. [Google Scholar] [CrossRef] [PubMed] [Green Version]
- Cox, O.T.; O’Shea, S.; Tresse, E.; Bustamante-Garrido, M.; Kiran-Deevi, R.; O’Connor, R. IGF-1 Receptor and Adhesion Signaling: An Important Axis in Determining Cancer Cell Phenotype and Therapy Resistance. Front. Endocrinol. 2015, 6, 106–112. [Google Scholar] [CrossRef] [PubMed] [Green Version]
- Hsu, L.-J.; Chiang, M.-F.; Sze, C.-I.; Su, W.-P.; Yap, Y.V.; Lee, I.-T.; Kuo, H.-L.; Chang, N.-S. HYAL-2-WWOX-SMAD4 Signaling in Cell Death and Anticancer Response. Front Cell Dev. Biol 2016, 4, 141–151. [Google Scholar] [CrossRef] [Green Version]
- Nelson, K.M.; Bisson, J.; Singh, G.; Graham, J.G.; Chen, S.-N.; Friesen, J.B.; Dahlin, J.L.; Niemitz, M.; Walters, M.A.; Pauli, G.F. The Essential Medicinal Chemistry of Cannabidiol (CBD). J. Med. Chem. 2020, 63, 12137–12155. [Google Scholar] [CrossRef]
- D’Aloia, A.; Berruti, G.; Costa, B.; Schiller, C.; Ambrosini, R.; Pastori, V.; Martegani, E.; Ceriani, M. RalGPS2 Is Involved in Tunneling Nanotubes Formation in 5637 Bladder Cancer Cells. Exp. Cell Res. 2018, 362, 349–361. [Google Scholar] [CrossRef]
- Sacco, E.; Metalli, D.; Spinelli, M.; Manzoni, R.; Samalikova, M.; Grandori, R.; Morrione, A.; Traversa, S.; Alberghina, L.; Vanoni, M. Novel RasGRF1-Derived Tat-Fused Peptides Inhibiting Ras-Dependent Proliferation and Migration in Mouse and Human Cancer Cells. Biotechnol. Adv. 2012, 30, 233–243. [Google Scholar] [CrossRef]
- Pasquale, V.; Ducci, G.; Campioni, G.; Ventrici, A.; Assalini, C.; Busti, S.; Vanoni, M.; Vago, R.; Sacco, E. Profiling and Targeting of Energy and Redox Metabolism in Grade 2 Bladder Cancer Cells with Different Invasiveness Properties. Cells 2020, 9, 2669–2694. [Google Scholar] [CrossRef] [PubMed]
- D’Aloia, A.; Molteni, L.; Gullo, F.; Bresciani, E.; Artusa, V.; Rizzi, L.; Ceriani, M.; Meanti, R.; Lecchi, M.; Coco, S.; et al. Palmitoylethanolamide Modulation of Microglia Activation: Characterization of Mechanisms of Action and Implication for Its Neuroprotective Effects. Int. J. Mol. Sci. 2021, 22, 3054–3076. [Google Scholar] [CrossRef]
- D’Aloia, A.; Arrigoni, E.; Costa, B.; Berruti, G.; Martegani, E.; Sacco, E.; Ceriani, M. RalGPS2 Interacts with Akt and PDK1 Promoting Tunneling Nanotubes Formation in Bladder Cancer and Kidney Cells Microenvironment. Cancers 2021, 13, 6330–6358. [Google Scholar] [CrossRef] [PubMed]
- Grosdidier, A.; Zoete, V.; Michielin, O. SwissDock, a Protein-Small Molecule Docking Web Service Based on EADock DSS. Nucleic Acids Res. 2011, 39, W270–W277. [Google Scholar] [CrossRef] [PubMed] [Green Version]
- Millar, S.A.; Maguire, R.F.; Yates, A.S.; O’Sullivan, S.E. Towards Better Delivery of Cannabidiol (CBD). Pharmaceuticals 2020, 13, 219–233. [Google Scholar] [CrossRef] [PubMed]
- Sosnik, A.; Shabo, R.B.; Halamish, H.M. Cannabidiol-Loaded Mixed Polymeric Micelles of Chitosan/Poly(Vinyl Alcohol) and Poly(Methyl Methacrylate) for Trans-Corneal Delivery. Pharmaceutics 2021, 13, 2142–2162. [Google Scholar] [CrossRef] [PubMed]
- Hatziagapiou, K.; Bethanis, K.; Koniari, E.; Christoforides, E.; Nikola, O.; Andreou, A.; Mantzou, A.; Chrousos, G.P.; Kanaka-Gantenbein, C.; Lambrou, G.I. Biophysical Studies and In Vitro Effects of Tumor Cell Lines of Cannabidiol and Its Cyclodextrin Inclusion Complexes. Pharmaceutics 2022, 14, 706–736. [Google Scholar] [CrossRef]


Publisher’s Note: MDPI stays neutral with regard to jurisdictional claims in published maps and institutional affiliations. |
© 2022 by the authors. Licensee MDPI, Basel, Switzerland. This article is an open access article distributed under the terms and conditions of the Creative Commons Attribution (CC BY) license (https://creativecommons.org/licenses/by/4.0/).
Share and Cite
D’Aloia, A.; Ceriani, M.; Tisi, R.; Stucchi, S.; Sacco, E.; Costa, B. Cannabidiol Antiproliferative Effect in Triple-Negative Breast Cancer MDA-MB-231 Cells Is Modulated by Its Physical State and by IGF-1. Int. J. Mol. Sci. 2022, 23, 7145. https://doi.org/10.3390/ijms23137145
D’Aloia A, Ceriani M, Tisi R, Stucchi S, Sacco E, Costa B. Cannabidiol Antiproliferative Effect in Triple-Negative Breast Cancer MDA-MB-231 Cells Is Modulated by Its Physical State and by IGF-1. International Journal of Molecular Sciences. 2022; 23(13):7145. https://doi.org/10.3390/ijms23137145
Chicago/Turabian StyleD’Aloia, Alessia, Michela Ceriani, Renata Tisi, Simone Stucchi, Elena Sacco, and Barbara Costa. 2022. "Cannabidiol Antiproliferative Effect in Triple-Negative Breast Cancer MDA-MB-231 Cells Is Modulated by Its Physical State and by IGF-1" International Journal of Molecular Sciences 23, no. 13: 7145. https://doi.org/10.3390/ijms23137145