
Transcriptomic Analysis and the Effect of Maturity Stage on Fruit Quality Reveal the Importance of the L-Galactose Pathway in the Ascorbate Biosynthesis of Hardy Kiwifruit (Actinidia arguta)

 , , , , , , and
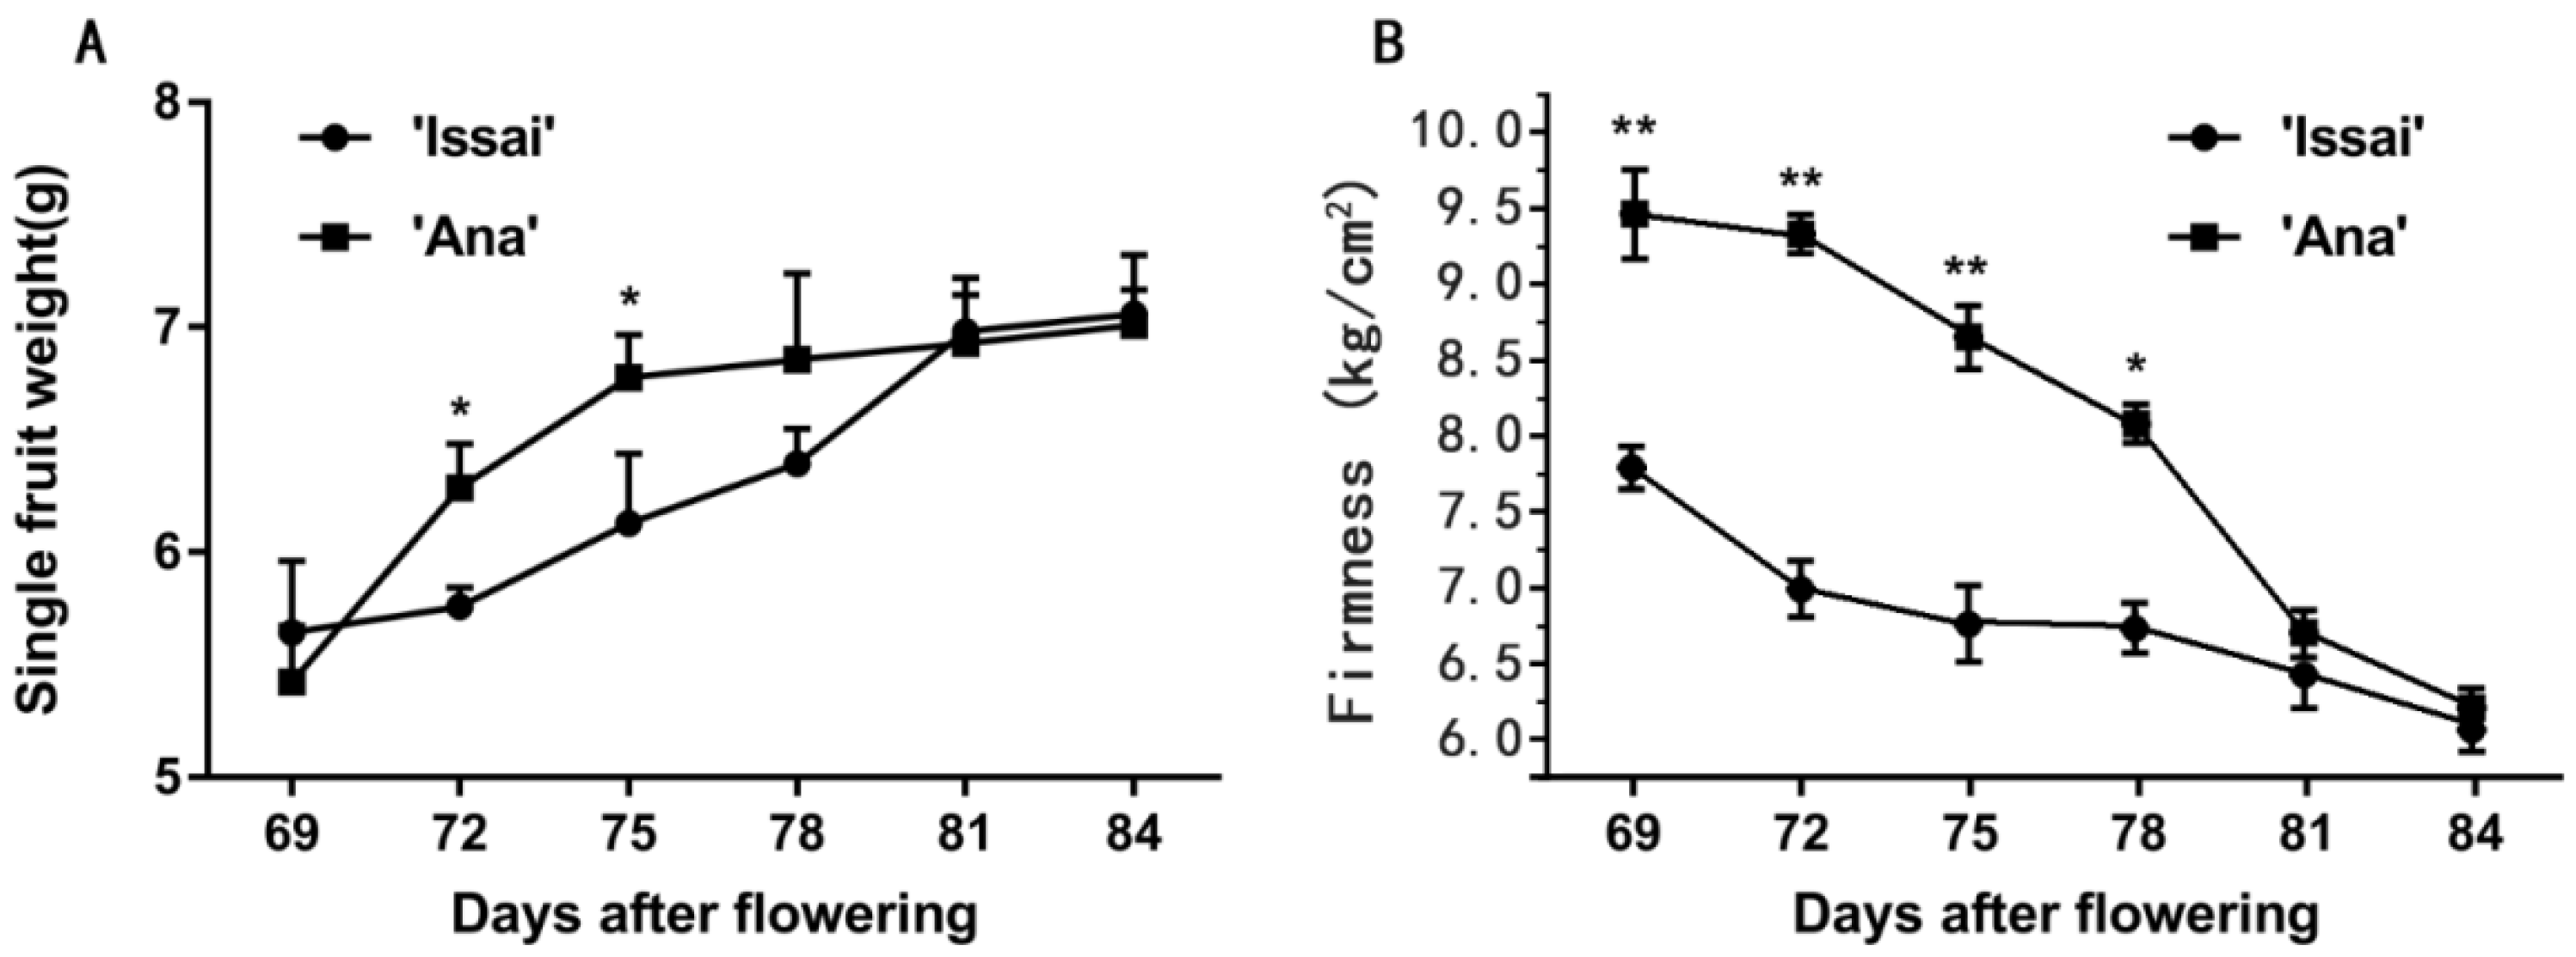
Abstract
:1. Introduction
2. Results
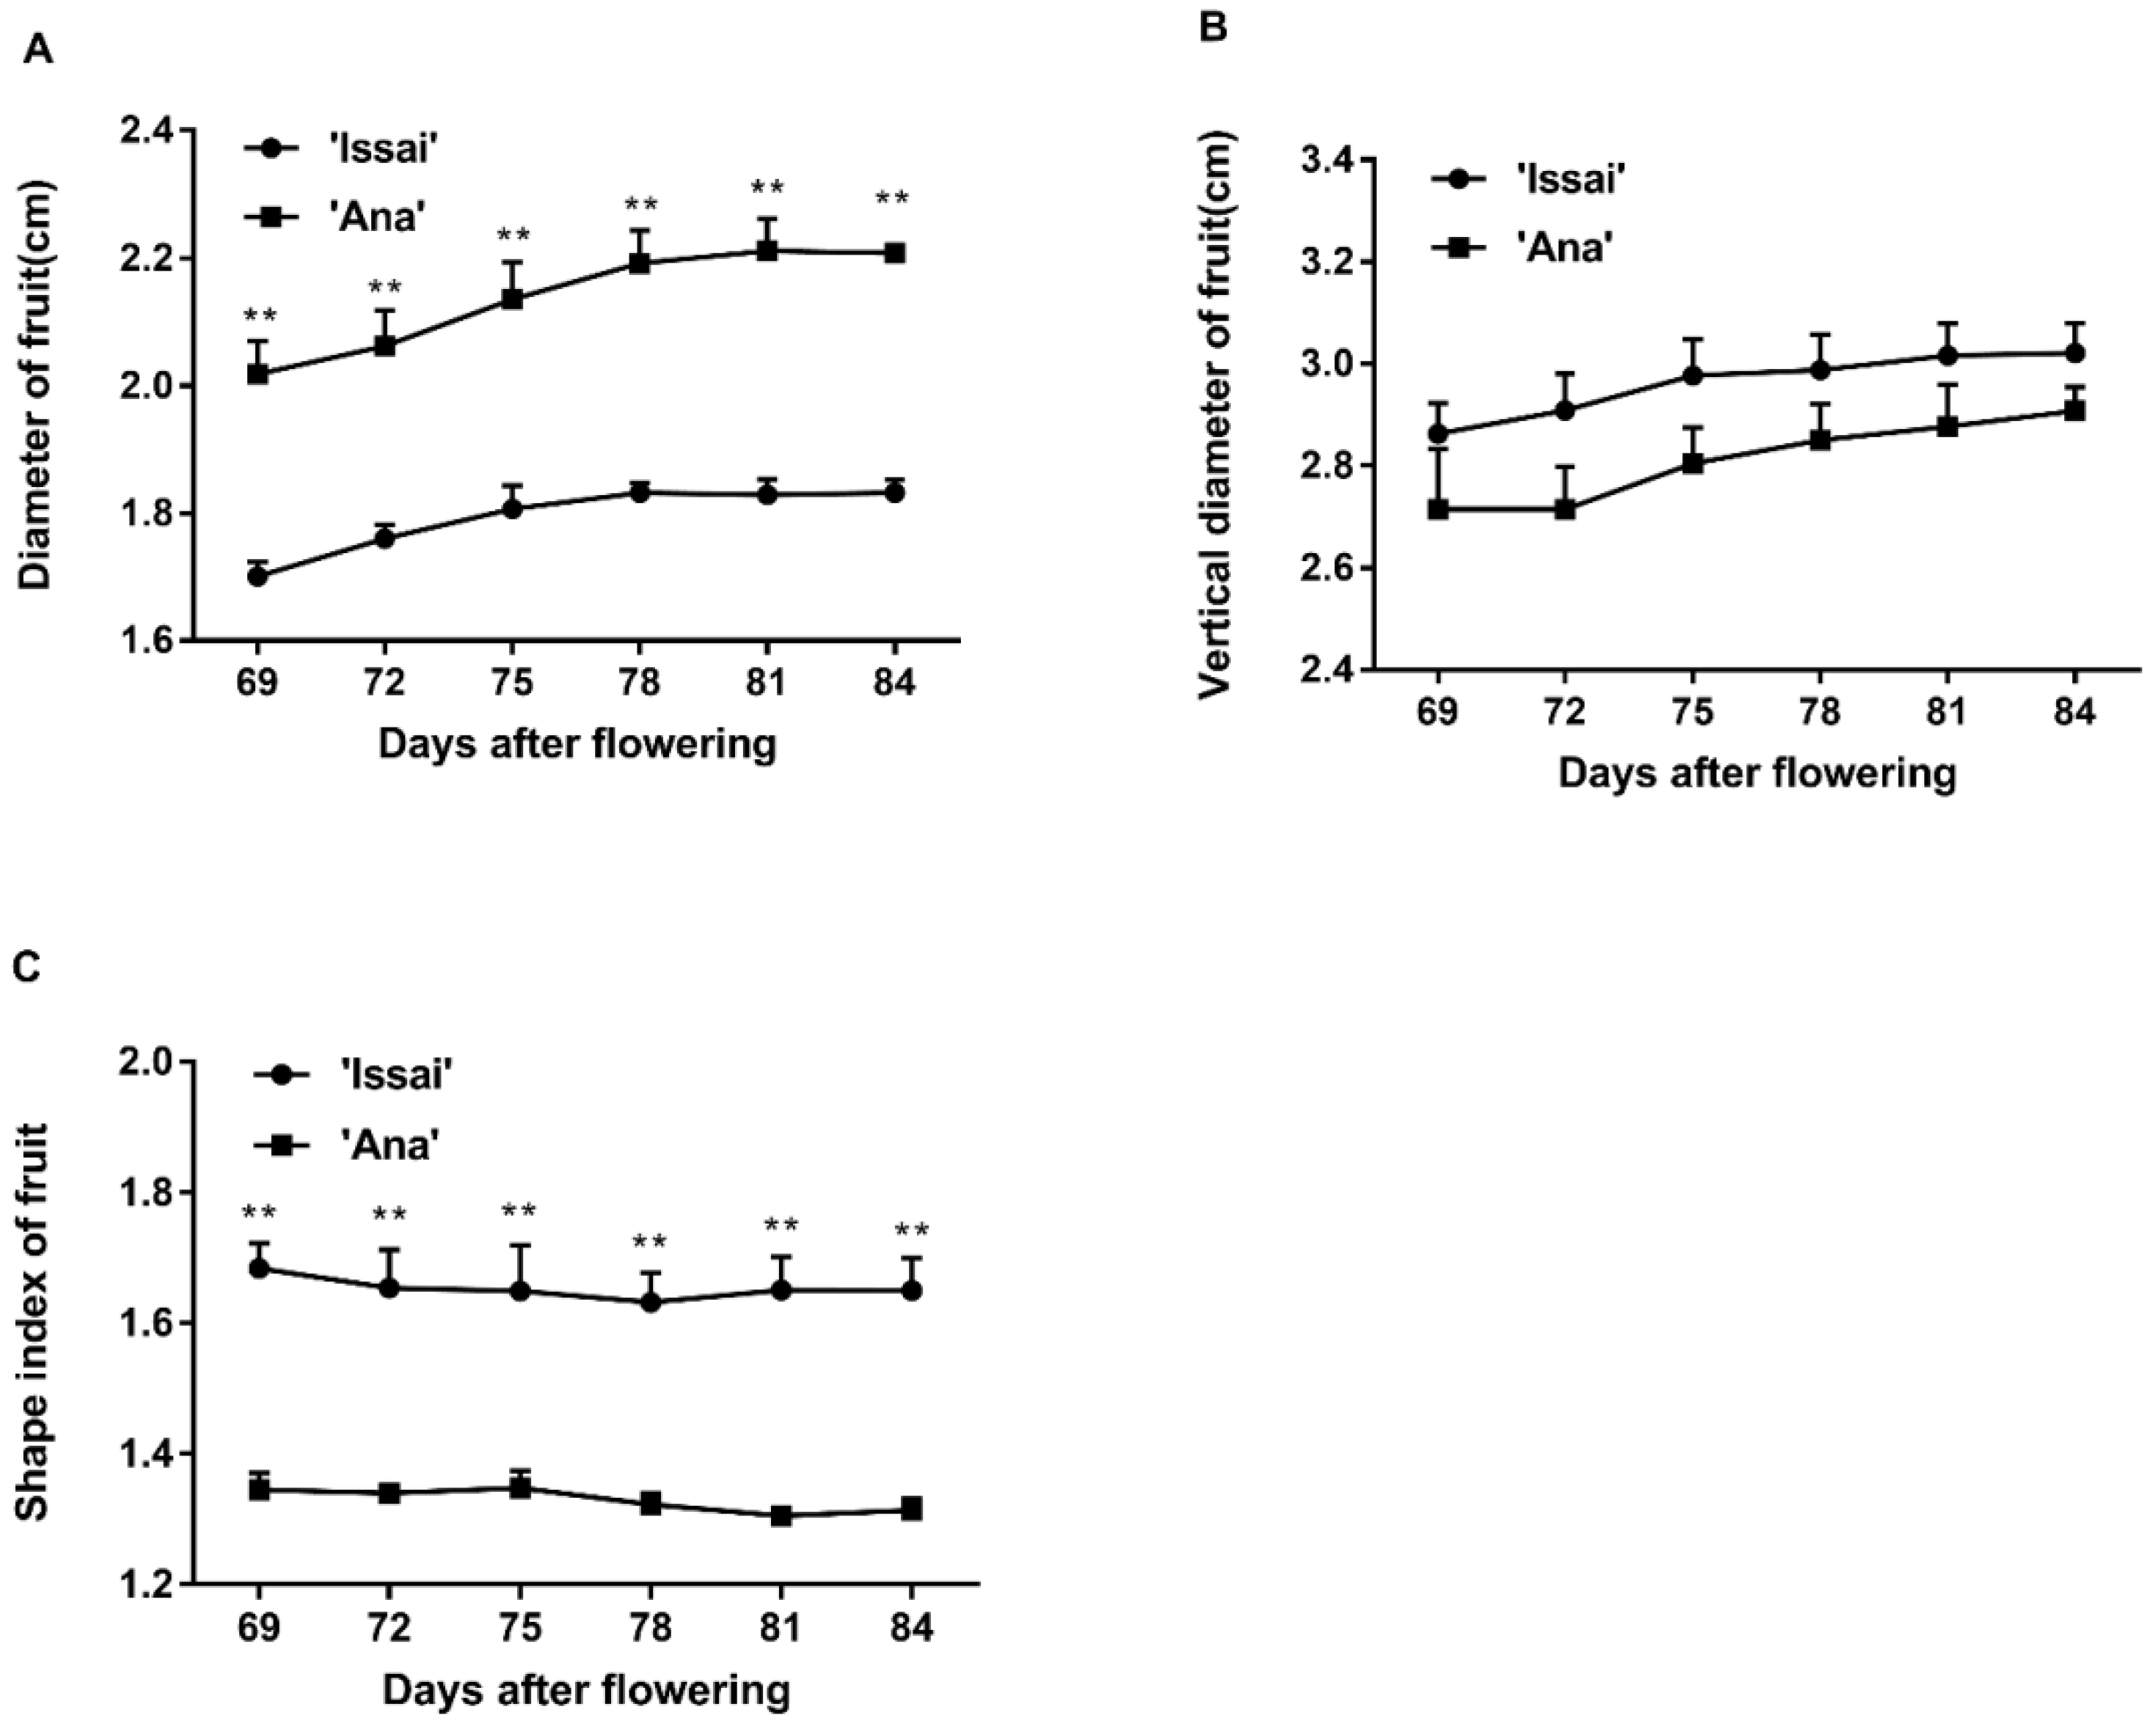
2.1. Effect of Maturity Stage at Harvest on Changes in Phenotypic Characterization
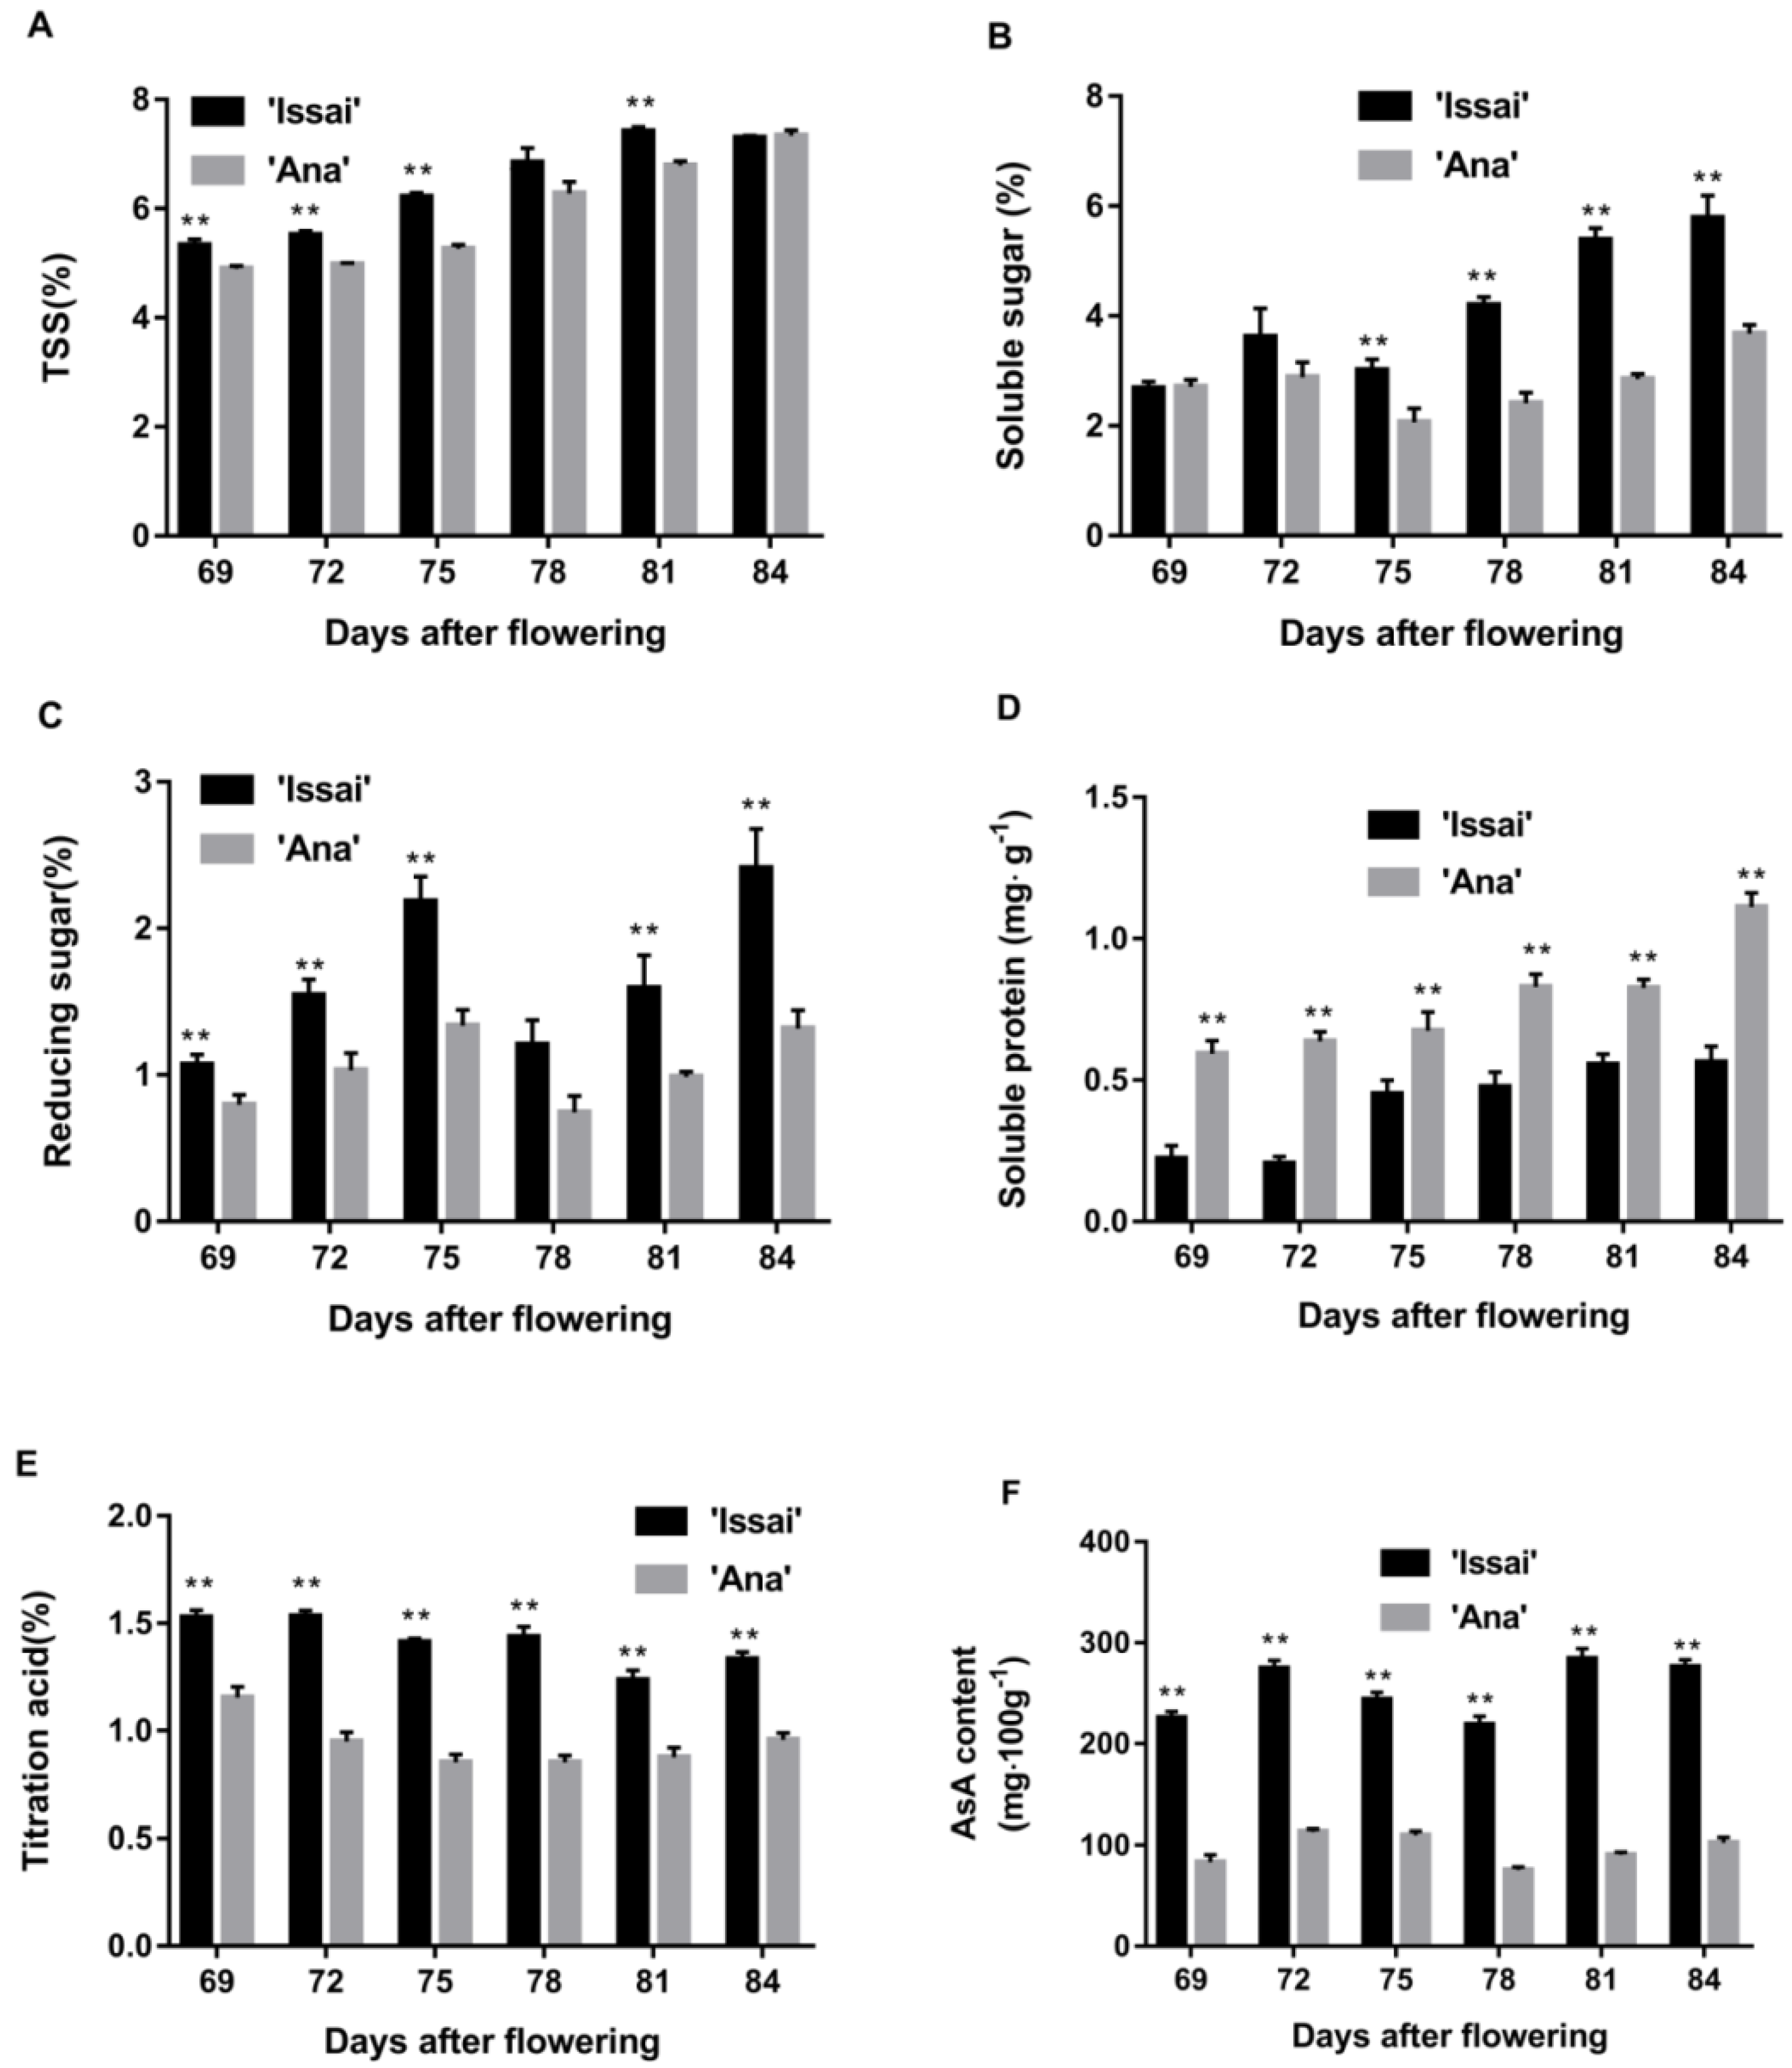
2.2. The Effect of Maturity Stage at Harvest on Changes in the Nutritional Quality of the Fruit
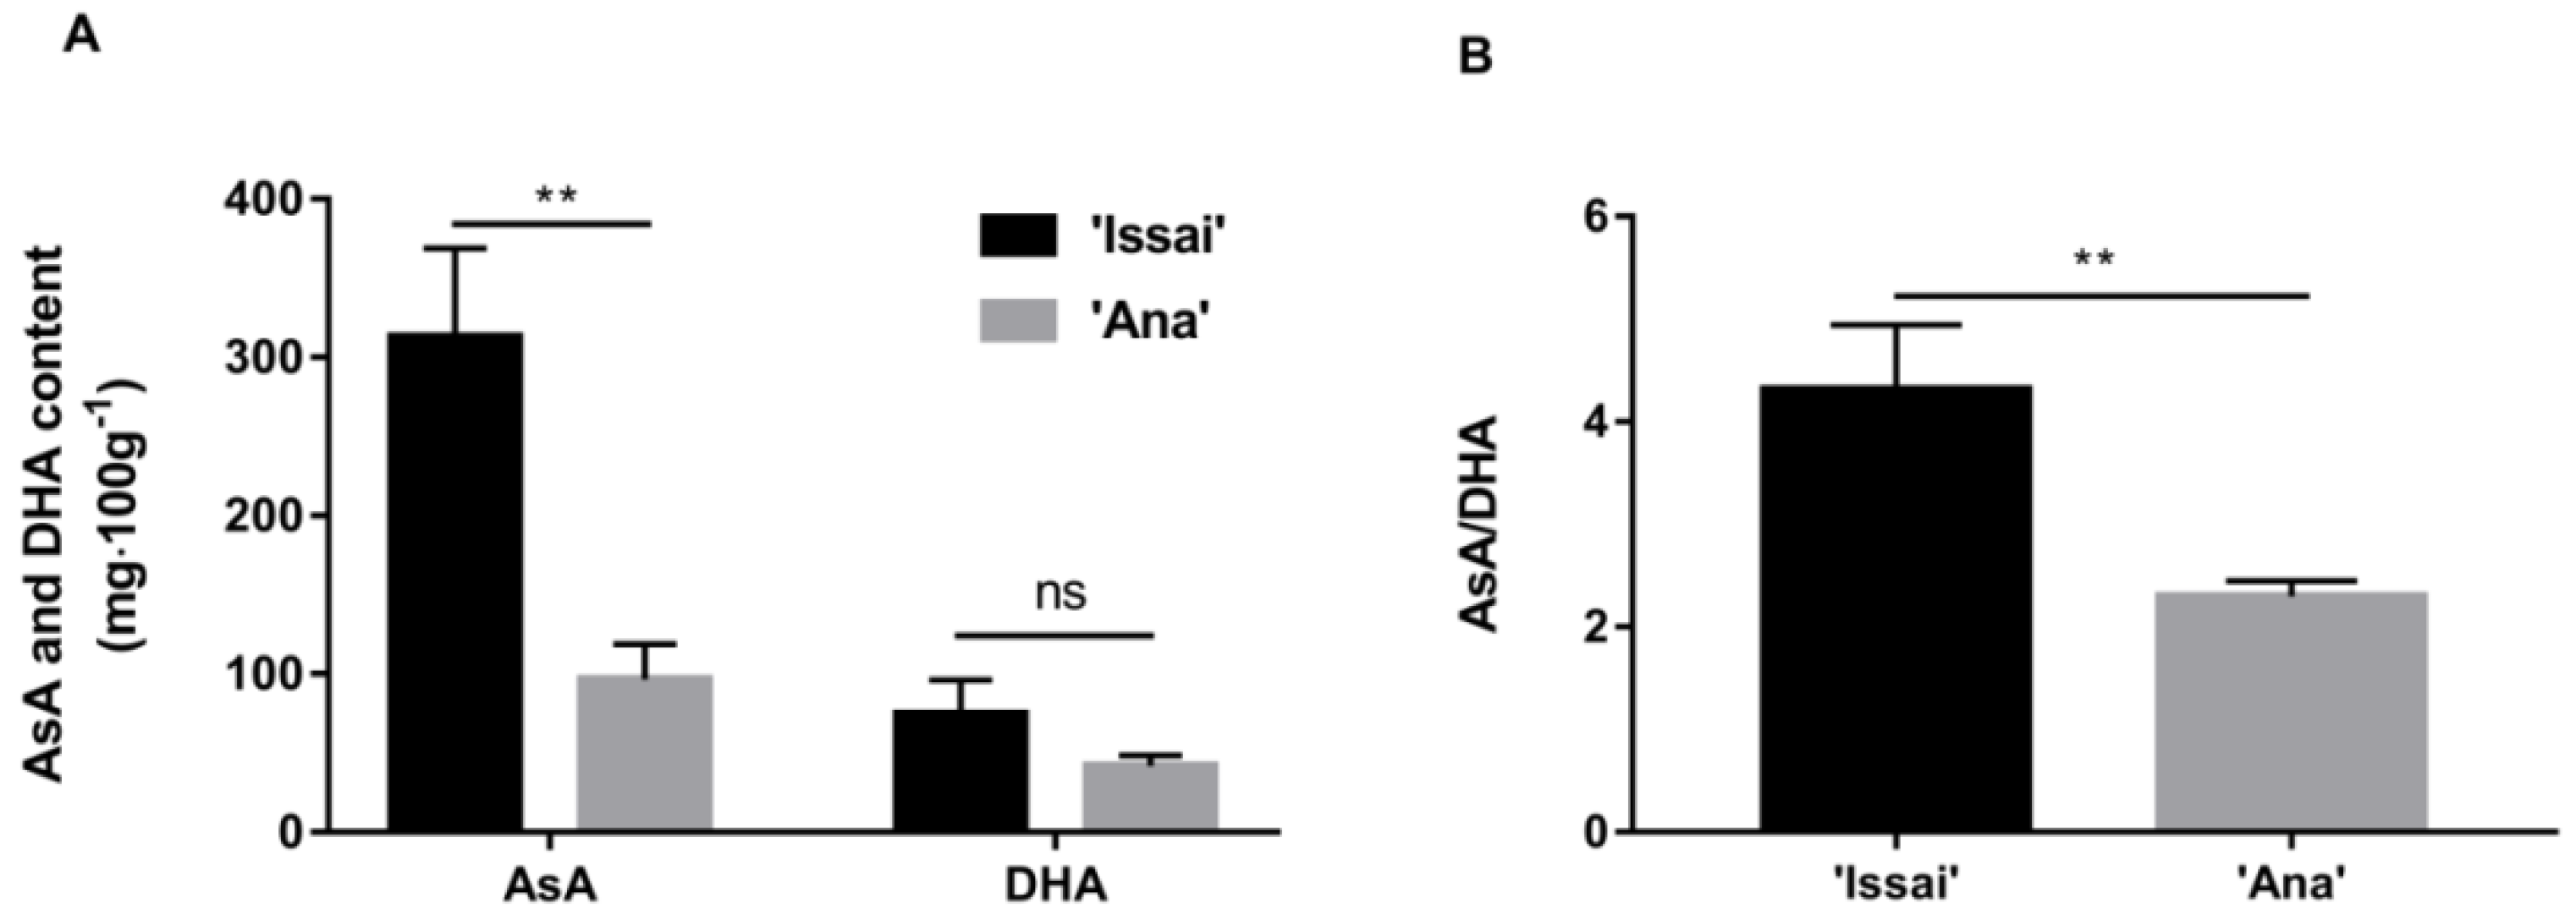
2.3. Comparison of ASA and DHA Content
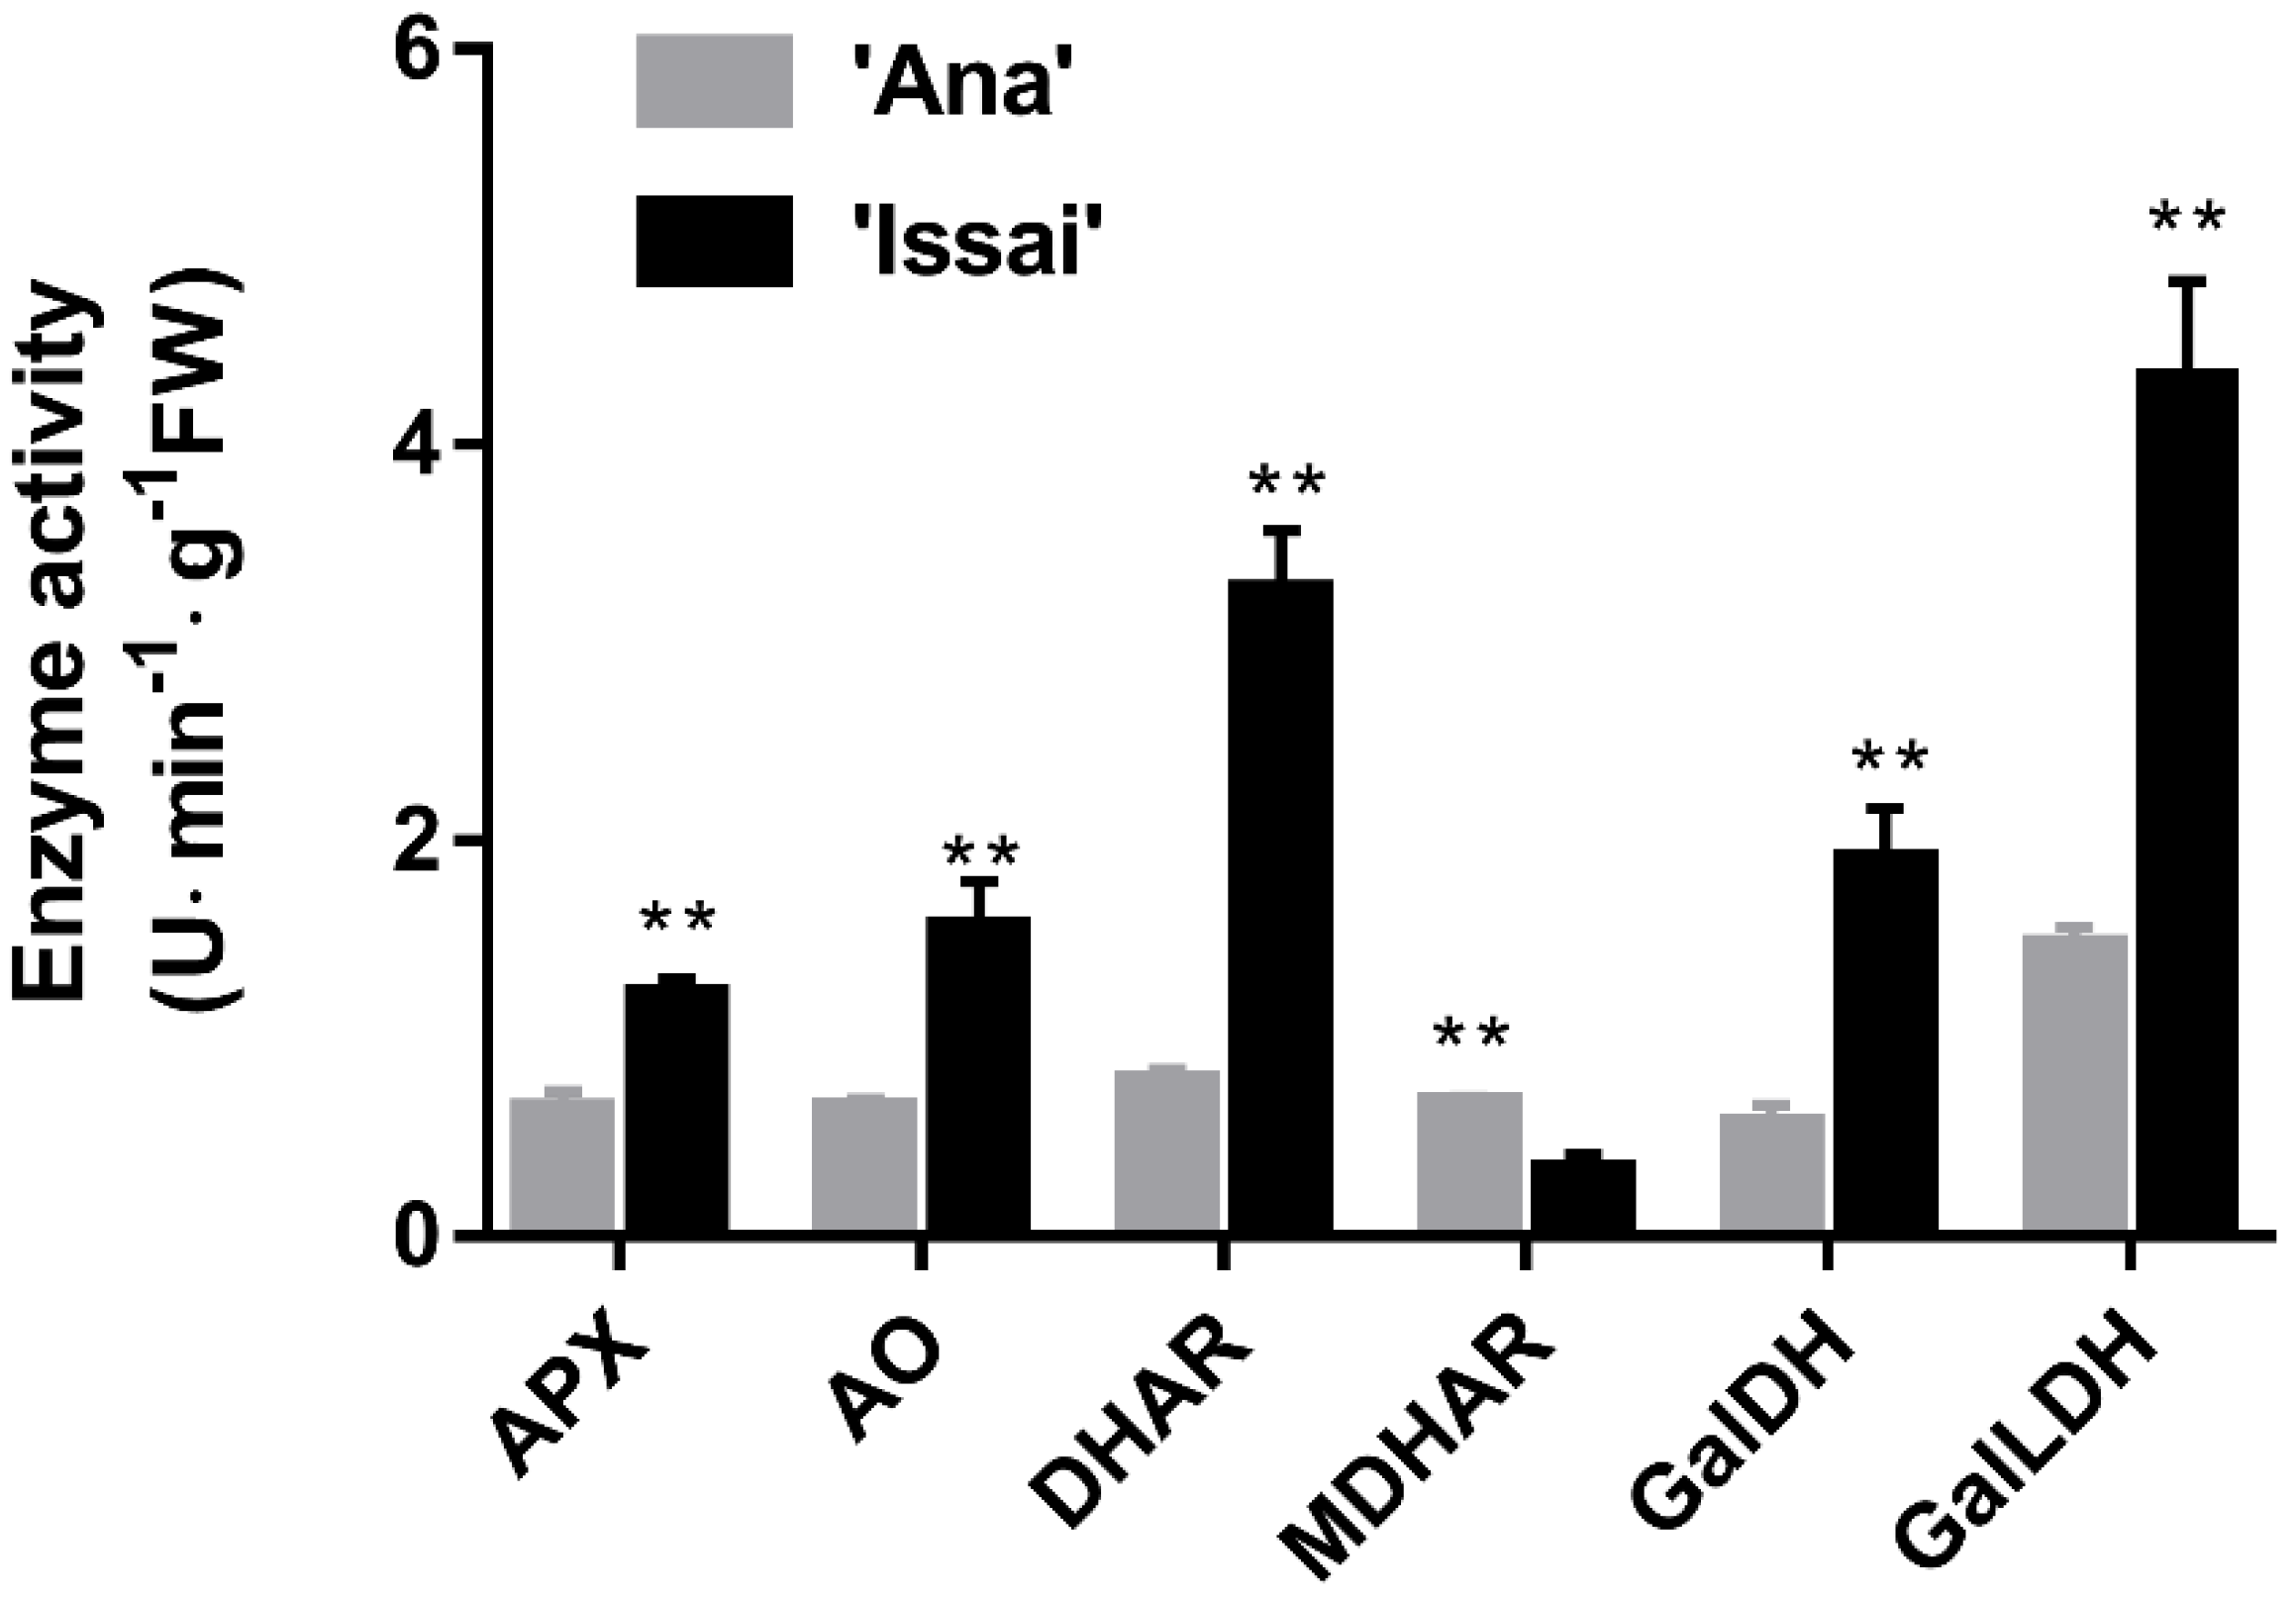
2.4. Activities of Key Enzymes Involved in AsA Metabolism
2.5. DEGs Obtained and qRT-PCR Validation
2.6. Expression Patterns of AsA Metabolism Genes
3. Discussion
4. Materials and Methods
4.1. Plant Materials and Sample Preparation
4.2. Determination of Fruit Quality
4.3. HPLC Analysis of AsA
4.4. Measurement of AsA Metabolism–Related Enzymes
4.5. RNA-seq and Selection of Genes Involved in the AsA Matabolism
4.6. qRT-PCR Analysis
4.7. Statistical Analysis
5. Conclusions
Supplementary Materials
Author Contributions
Funding
Institutional Review Board Statement
Informed Consent Statement
Data Availability Statement
Acknowledgments
Conflicts of Interest
References
- Fisk, C.L.; Silver, A.M.; Strik, B.C.; Zhao, Y. Postharvest quality of hardy kiwifruit (Actinidia arguta, ‘Ananasnaya’) associated with packaging and storage conditions. Postharvest Biol. Technol. 2008, 47, 338–345. [Google Scholar] [CrossRef]
- Krupa, T.; Latocha, P.; Liwińska, A. Changes of physicochemical quality, phenolics and vitamin C content in hardy kiwifruit (Actinidia arguta, and its hybrid) during storage. Sci. Hortic. 2011, 130, 410–417. [Google Scholar] [CrossRef]
- Beirão-da-Costa, S.; Steiner, A.; Correia, L.; Empis, J.; Moldão-Martins, M. Effects of maturity stage and mild heat treatments on quality of minimally processed kiwifruit. J. Food Eng. 2006, 76, 616–625. [Google Scholar] [CrossRef]
- Amodio, M.L.; Colelli, G.; Hasey, J.K.; Kader, A.A. A comparative study of composition and postharvest performance of organically and conventionally grown kiwifruits. J. Sci. Food Agric. 2007, 87, 1228–1236. [Google Scholar] [CrossRef]
- Fisk, C.L.; Mcdaniel, M.R.; Strik, B.C.; Zhao, Y. Physicochemical, Sensory, and Nutritive Qualities of Hardy Kiwifruit (Actinidia arguta ‘Ananasnaya’) as Affected by Harvest Maturity and Storage. J. Food Sci. 2006, 71, S204–S210. [Google Scholar] [CrossRef]
- Lee, C.; Yang, H.; Kim, S.; Kim, M.; Kang, H.; Kim, N.; An, S.; Koh, J.; Jung, H. Evaluation of the anti-wrinkle effect of an ascorbic acid-loaded dissolving microneedle patch via a double-blind, placebo-controlled clinical study. Int. J. Cosmet. Sci. 2016, 38, 375–381. [Google Scholar] [CrossRef]
- Paciolla, C.; Fortunato, S.; Dipierro, N.; Paradiso, A.; De Leonardis, S.; Mastropasqua, L.; De Pinto, M.C. Vitamin C in plants: From functions to biofortification. Antioxidants 2019, 8, 519. [Google Scholar] [CrossRef] [Green Version]
- Nishikimi, M.; Yagi, K. Biochemistry and molecular biology of ascorbic acid biosynthesis. Subcell Biochem. 1996, 25, 17–39. [Google Scholar]
- Zhang, C.; Huang, J.; Li, X. Transcriptomic Analysis Reveals the Metabolic Mechanism of L-Ascorbic Acid in Ziziphus jujuba Mill. Front. Plant Sci. 2015, 7, 122. [Google Scholar] [CrossRef] [PubMed] [Green Version]
- Foyer, C.H.; Noctor, G. Ascorbate and glutathione: The heart of the redox hub. Plant Physiol. 2011, 155, 2–18. [Google Scholar] [CrossRef] [Green Version]
- Huang, S.; Ding, J.; Deng, D.; Tang, W.; Sun, H.; Liu, D.; Zhang, L.; Niu, X.; Zhang, X.; Meng, M.; et al. Draft genome of the kiwifruit Actinidia chinensis. Nat. Commun. 2013, 4, 2640. [Google Scholar] [CrossRef] [PubMed]
- Mellidou, I.; Koukounaras, A.; Kostas, S.; Patelou, E.; Kanellis, A.K. Regulation of vitamin C accumulation for improved tomato fruit quality and alleviation of abiotic stress. Genes 2021, 12, 694. [Google Scholar] [CrossRef] [PubMed]
- Nishiyama, I.; Yamashita, Y.; Yamanaka, M.; Shimohashi, A.; Fukuda, T.; Oota, T. Varietal difference in vitamin C content in the fruit of kiwifruit and other actinidia species. J. Agric. Food Chem. 2004, 52, 5472–5475. [Google Scholar] [CrossRef] [PubMed]
- Ma, T.; Luo, J.; Tian, C.; Sun, X.; Quan, M.; Zheng, C.; Kang, L.; Zhan, J. Influence of technical processing units on chemical composition and antimicrobial activity of carrot (Daucus carrot L.) juice essential oil. Food Chem. 2015, 170, 394–400. [Google Scholar] [CrossRef]
- Burdon, J.; Lallu, N.; Pidakala, P.; Barnett, A. Soluble solids accumulation and postharvest performance of ‘Hayward’ kiwifruit. Postharvest Biol. Technol. 2013, 80, 1–8. [Google Scholar] [CrossRef]
- Latocha, P.; Wołosiak, R.; Worobiej, E.; Krupa, T. Clonal differences in antioxidant activity and bioactive constituents of hardy kiwifruit (Actinidia arguta) and its year-to-year variability. J. Sci. Food Agric. 2013, 93, 1412–1419. [Google Scholar] [CrossRef]
- Lin, S.T.; Chiou, C.W.; Chu, Y.L.; Hsiao, Y.; Tseng, Y.F.; Chen, Y.C.; Chen, H.J.; Chang, H.Y.; Lee, T.M. Enhanced Ascorbate Regeneration via Dehydroascorbate Reductase Confers Tolerance to Photooxidative Stress in Chlamydomonas reinhardtii. Plant Cell Physiol. 2016, 57, 2104. [Google Scholar] [CrossRef] [Green Version]
- Millar, A.H.; Mittova, V.; Kiddle, G.; Heazlewood, J.L.; Bartoli, C.G.; Theodoulou, F.L.; Foyer, C.H. Control of Ascorbate Synthesis by Respiration and Its Implications for Stress Responses. Plant Physiol. 2003, 133, 443–447. [Google Scholar] [CrossRef] [PubMed] [Green Version]
- Wheeler, G.L.; Jones, M.A.; Smirnoff, N. The biosynthetic pathway of vitamin C in higher plants. Nature 1998, 393, 365–369. [Google Scholar] [CrossRef]
- Hancock, R.D.; Viola, R. Biosynthesis and catabolism of L-ascorbic acid in plants. Crit. Rev. Plant Sci. 2005, 24, 167–188. [Google Scholar] [CrossRef]
- Gatzek, S.; Wheeler, G.L.; Smirnoff, N. Antisense suppression of l-galactose dehydrogenase in Arabidopsis thaliana provides evidence for its role in ascorbate synthesis and reveals light modulated L-galactose synthesis. Plant J. 2002, 30, 541–553. [Google Scholar] [CrossRef] [PubMed] [Green Version]
- Bulley, S.M.; Rassam, M.; Hoser, D.; Otto, W.; Schünemann, N.; Wright, M.; MacRae, E.; Gleave, A.; Laing, W. Gene expression studies in kiwifruit and gene over-expression in Arabidopsis indicates that GDP-L-galactose guanyltransferase is a major control point of vitamin C biosynthesis. J. Exp. Bot. 2009, 60, 765–778. [Google Scholar] [CrossRef] [Green Version]
- Di Matteo, A.; Sacco, A.; Anacleria, M.; Pezzotti, M.; Delledonne, M.; Ferrarini, A.; Frusciante, L.; Barone, A. The ascorbic acid content of tomato fruits is associated with the expression of genes involved in pectin degradation. BMC Plant Biol. 2010, 10, 163. [Google Scholar] [CrossRef] [PubMed] [Green Version]
- Laing, W.A.; Wright, M.A.; Cooney, J.; Bulley, S.M. The missing step of the L-galactose pathway of ascorbate biosynthesis in plants, an L-galactose guanyltransferase, increases leaf ascorbate content. Proc. Natl. Acad. Sci. USA 2007, 104, 9534–9539. [Google Scholar] [CrossRef] [Green Version]
- Linster, C.L.; Clarke, S.G. L-Ascorbate biosynthesis in higher plants: The role of VTC2. Trends Plant Sci. 2008, 13, 567–573. [Google Scholar] [CrossRef] [PubMed] [Green Version]
- Rigano, M.M.; Lionetti, V.; Raiola, A.; Bellincampi, D.; Barone, A. Pectic enzymes as potential enhancers of ascorbic acid production through the D-galacturonate pathway in Solanaceae. Plant Sci. 2018, 266, 55–63. [Google Scholar] [CrossRef] [PubMed]
- Ishikawa, T.; Shigeoka, S. Recent advances in ascorbate biosynthesis and the physiological significance of ascorbate peroxidase in photosynthesizing organisms. J. Agric. Chem. Soc. Jpn. 2008, 72, 1143–1154. [Google Scholar] [CrossRef] [PubMed]
- Li, M.; Liang, D.; Pu, F.; Ma, F.; Hou, C.; Lu, T. Ascorbate levels and the activity of key enzymes in ascorbate biosynthesis and recycling in the leaves of 22 Chinese persimmon cultivars. Sci. Hortic. 2009, 120, 250–256. [Google Scholar] [CrossRef]
- Jiang, Z.Y.; Zhong, Y.; Zheng, J.; Ali, M.; Liu, G.D.; Zheng, X.L. L-ascorbic acid metabolism in an ascorbate-rich kiwifruit (Actinidia. Eriantha Benth.) cv.‘White’during postharvest. Plant Physiol. Biochem. 2018, 124, 20–28. [Google Scholar] [CrossRef]
- Chen, Z.; Gallie, D.R. Increasing Tolerance to Ozone by Elevating Foliar Ascorbic Acid Confers Greater Protection against Ozone Than Increasing Avoidance. Plant Physiol. 2005, 138, 1673–1689. [Google Scholar] [CrossRef] [PubMed] [Green Version]
- Boldingh, H.; Smith, G.S.; Klages, K. Seasonal concentrations of non-structural carbohydrates of five Actinidia species in fruit, leaf and fine root tissue. Ann. Bot. 2000, 85, 469–476. [Google Scholar] [CrossRef] [Green Version]
- Weng, X.; Xin, G.; Li, Y.X. Study on determination conditions of total sugar from potato starch by anthrone colorimetry. Food Res. Dev. 2013, 34, 86–88. [Google Scholar]
- Karlmark, B.; Jaeger, P.; Fein, H.; Giebisch, G. Coulometric acid-base titration in nanoliter samples with glass and antimony electrodes. Am. J. Physiol.-Ren. Physiol. 1982, 242, F95–F99. [Google Scholar] [CrossRef] [PubMed]
- Xiao, Y.C.; Lei, E.C.; Guan, X.J.; Guan, X.L. Determining the content of reduced vitamin C in vegetables by two methods. Hubei Agr. Sci. 2011, 50, 1035–1037. [Google Scholar]
- Wang, L.; Luan, B.; Liu, X.; Wang, P.; Wang, Y. Relationship between the contents of nutrients and chlorophylls in leaves of different grape varieties and their resistance to Apolygus lucorum (Hemiptera: Miridae). Acta Entomol. Sin. 2017, 60, 570–575. [Google Scholar]
- Santos, A.A.D.; Deoti, J.R.; Müller, G.; Dário, M.G.; Stambuk, B.U.; Alves, S.L. Dosagem de açúcares redutores com o reativo DNS em microplaca. Braz. J. Food Technol. 2017, 20, e2015113. [Google Scholar] [CrossRef] [Green Version]
- Huang, M.; Xu, Q.; Deng, X.X. L-Ascorbic acid metabolism during fruit development in an ascorbate-rich fruit crop chestnut rose (Rosa roxburghii Tratt). J. Plant Physiol. 2014, 171, 1205–1216. [Google Scholar] [CrossRef]
- Gökmen, V.; Kahraman, N.; Demir, N.; Acar, J. Enzymatically validated liquid chromatographic method for the determination of ascorbic and dehydroascorbic acids in fruit and vegetables. J. Chromatogr. A 2000, 881, 309–316. [Google Scholar] [CrossRef]
- Tabata, K.; Ôba, K.; Suzuki, K.; Esaka, M. Generation and properties of ascorbic acid-deficient transgenic tobacco cells expressing antisense RNA for L-galactono-1, 4-lactone dehydrogenase. Plant J. 2005, 220, 854–863. [Google Scholar] [CrossRef] [PubMed]
- Gatzek SStasolla, C.; Yeung, E.C. Ascorbic acid metabolism during white spruce somatic embryo maturation and germination. Physiol. Plant. 2001, 111, 196–205. [Google Scholar] [CrossRef]
- Chen, Q.; Yu, H.W.; Wang, X.R.; Xie, X.L.; Yue, X.Y.; Tang, H.R. An alternative cetyltrimethylammonium bromide-based, protocol for RNA isolation from blackberry (Rubus L.). Genet. Mol. Res. 2012, 11, 1773–1782. [Google Scholar] [CrossRef] [PubMed]


Publisher’s Note: MDPI stays neutral with regard to jurisdictional claims in published maps and institutional affiliations. |
© 2022 by the authors. Licensee MDPI, Basel, Switzerland. This article is an open access article distributed under the terms and conditions of the Creative Commons Attribution (CC BY) license (https://creativecommons.org/licenses/by/4.0/).
Share and Cite
Lei, D.; Lin, Y.; Chen, Q.; Zhao, B.; Tang, H.; Zhang, Y.; Chen, Q.; Wang, Y.; Li, M.; He, W.; et al. Transcriptomic Analysis and the Effect of Maturity Stage on Fruit Quality Reveal the Importance of the L-Galactose Pathway in the Ascorbate Biosynthesis of Hardy Kiwifruit (Actinidia arguta). Int. J. Mol. Sci. 2022, 23, 6816. https://doi.org/10.3390/ijms23126816
Lei D, Lin Y, Chen Q, Zhao B, Tang H, Zhang Y, Chen Q, Wang Y, Li M, He W, et al. Transcriptomic Analysis and the Effect of Maturity Stage on Fruit Quality Reveal the Importance of the L-Galactose Pathway in the Ascorbate Biosynthesis of Hardy Kiwifruit (Actinidia arguta). International Journal of Molecular Sciences. 2022; 23(12):6816. https://doi.org/10.3390/ijms23126816
Chicago/Turabian StyleLei, Diya, Yuanxiu Lin, Qiyang Chen, Bing Zhao, Honglan Tang, Yunting Zhang, Qing Chen, Yan Wang, Mengyao Li, Wen He, and et al. 2022. "Transcriptomic Analysis and the Effect of Maturity Stage on Fruit Quality Reveal the Importance of the L-Galactose Pathway in the Ascorbate Biosynthesis of Hardy Kiwifruit (Actinidia arguta)" International Journal of Molecular Sciences 23, no. 12: 6816. https://doi.org/10.3390/ijms23126816