Article

Exogenous Melatonin Enhances Photosynthetic Capacity and Related Gene Expression in A Dose-Dependent Manner in the Tea Plant (Camellia sinensis (L.) Kuntze)

1
Tea Science Research Institute, College of Horticulture, Nanjing Agricultural University, Nanjing 210095, China
2
State Key Laboratory of Crop Genetics and Germplasm Enhancement, Nanjing Agricultural University, Nanjing 210095, China
*
Author to whom correspondence should be addressed.
Int. J. Mol. Sci. 2022, 23(12), 6694; https://doi.org/10.3390/ijms23126694
Submission received: 12 May 2022 / Revised: 7 June 2022 / Accepted: 10 June 2022 / Published: 15 June 2022

Abstract

:
The enhancement of photosynthesis of tea leaves can increase tea yield. In order to explore the regulation mechanism of exogenous melatonin (MT) on the photosynthetic characteristics of tea plants, tea variety ‘Zhongcha 108’ was used as the experimental material in this study. The effects of different concentrations (0, 0.2, 0.3, 0.4 mM) of melatonin on the chlorophyll (Chl) content, stomatal opening, photosynthetic and fluorescence parameters, antioxidant enzyme activity, and related gene expression of tea plants were detected and analyzed. The results showed that under 0.2-mM MT treatment, chlorophyll (Chl) content, photosynthetic rate (Pn), stomatal conductance (Gs), intercellular CO2 concentration (Ci), and transpiration rate (Tr) improved, accompanied by a decrease in stomata density and increase in stomata area. Zero point two millimolar MT increased Chl fluorescence level and superoxide dismutase (SOD) activity, and reduced hydrogen peroxide (H2O2) and malondialdehyde (MDA) contents, indicating that MT alleviated PSII inhibition and improved photochemical efficiency. At the same time, 0.2 mM MT induced the expression of genes involved in photosynthesis and chlorophyll metabolism to varying degrees. The study demonstrated that MT can effectively enhance the photosynthetic capacity of tea plants in a dose-dependent manner. These results may promote a comprehensive understanding of the potential regulatory mechanism of exogenous MT on photosynthesis in tea plants.

1. Introduction

The tea plant (Camellia sinensis (L.) O. Kuntze) is known as a leaf-type beverage crop [1]. Tender buds and leaves of the tea are usually picked to produce tea. Tea beverages have significant health benefits for humans with a unique flavor due to the existence of characteristic secondary metabolites, such as theanine, tea polyphenols, caffeine, and ascorbic acid, and are, therefore, popular all over the world [2,3,4]. Photosynthesis provides substrate and energy for the biosynthesis of secondary metabolites which are obtained from primary metabolites [5]. As the main organ for tea plant growth and development, the tea leaf is the basic site for plants to obtain energy. It fixes carbon through photosynthesis and accumulates nutrients. Light affects the metabolism of tea plants, and then affects the yield and quality of tea. Melatonin (N-acetyl-5-methoxy-tryptamine, MT) is involved in all stages of plant growth and development and can be used as a dark signal to regulate the circadian and photoperiod [6]. However, the regulation of melatonin on photosynthesis in tea plants remains unclear.
Photosynthesis serves as one of the major determinants of carbon balance and growth in plants, and is a complex process that converts light energy into chemical energy [7]. The photosynthates can be used as the carbon skeleton for plant assembly, or provide power for cell metabolism and material transport through respiration [8]. The ability and efficiency of photosynthesis are the bottlenecks to improve productivity. Carbon assimilation is integrated into the whole growing season and crop canopy. Therefore, if other constraints are not restricted, a small increase in net photosynthetic rate (Pn) can be converted into substantial increase in yield [9]. The improvement in photosynthetic efficiency of tea plants can increase tea yield.
Melatonin, a multifunctional signaling molecule, was initially discovered in the bovine pineal tissue in 1958 and identified in plants in 1995 [10]. It can influence flowering of short-day plants, such as affecting photoperiodic flower induction or flower development in the early stages of Chenopodium rubrum [11]. MT significantly promoted soybean growth and fatty acid content through the enhancement of photosynthesis and sugar metabolism [12]. Additionally, the important role of MT in living organisms is to scavenge reactive oxygen species (ROS), reactive nitrogen species (RNS), and lipid radicals, as well as improve antioxidant activities, prevent cells, tissues, and organisms from oxidative stress [12,13]. MT-rich transgenic rice plants exhibited higher superoxide dismutase (SOD) and catalase (CAT) activities and herbicide resistance compared with transgenic control [14]. Compared with high concentrations (300, 500 µM), a relatively low concentration (100 µM) of MT treatment promoted the germination rate and germination index of Naked Oat seedlings [15]. Low concentrations of MT (10~30 µM) promoted the growth of primary roots and fresh weight of the seedlings of Arabidopsis thaliana, while high doses of MT (200~400 µM) had a poor promotion effect, and even had harmful effects in some cases [16]. MT serves as a multifunctional factor in the plant kingdom and is widely involved in stress response, growth, and development regulation of plants.
Wang and Zhang’s groups have confirmed the positive regulation of MT on photosynthetic efficiency [17,18]. Metabolomics analysis revealed that MT regulated metabolic processes, including chlorophyll synthesis, carbon fixation, and sugar metabolism, of grafted Carya cathayensis under drought stress [19]. The potential role of MT in protecting photosynthetic apparatus was found by monitoring maximum photochemical quantum yield of PSII (Fv/Fm) in apple leaves [20]. Exogenous MT increased the number of open reaction centers of photosystem II (PSII), thus improving the photochemical quantum yield of PSII in Chara australis [21]. Information about the role of MT in the photosystem in tea plants remains limited, and the specific process needs further study. Research on the potential interaction between MT and cell photosynthetic reactions are rarely reported in tea plants.
The present study aimed to investigate the effect of exogenous MT treatment on photosynthesis of tea plants. We detected changes in physiology and molecules in response to different concentrations of MT at days 0, 8, and 16, respectively. Chl content, photosynthetic parameters, including photosynthetic rate (Pn), stomatal conductance (Gs), intercellular CO2 concentration (Ci), and transpiration rate (Tr), were measured to explore the effects of MT on tea plants. Stomatal characteristics and Chl fluorescence parameters were also detected. The antioxidant properties that MT induced in tea plants were determined by measuring the activities of antioxidant enzymes and hydrogen peroxide (H2O2) and malondialdehyde (MDA) contents. From the analysis of chlorophyll content, stomatal opening, photosynthetic and fluorescence parameters, treatment with 0.2 mM MT showed the most effect among the three treatments. Then, the tea plant with a 0.2-mM MT treatment was used in further transcriptome analysis. Moreover, the genes involved in photosynthesis and the Chl metabolic pathway were identified based on transcriptome data, and the expression gene profiles were detected by RT-qPCR. This study provides potential references to unraveling the response of MT on photosynthesis of tea plant.

2. Results

2.1. Effects of Exogenous MT Application on the Contents of Chl in Tea Leaves

The contents of Chl a, b, and total Chl with different concentrations of MT treatments are shown in Table 1. Chl a and b contents in the control group were reduced at days 8 and 16, resulting in a decrease in total Chl content. Compared to day 0, MT treatment at 0.2 mM continuously increased the total Chl content, which was 33.92% higher at day 16 than day 0. The Chl content of tea leaves under a 0.3-mM MT treatment declined at day 8, and then increased at day 16. The reduction in Chl content at day 8 was consistent with the control group, indicating that MT had no significant effect on Chl content at that time. The total Chl content under a 0.4-mM MT treatment decreased at day 8, and the reduction was lower than that of the control. Our results suggested that MT application could increase the Chl content or delay Chl degradation of tea leaves.

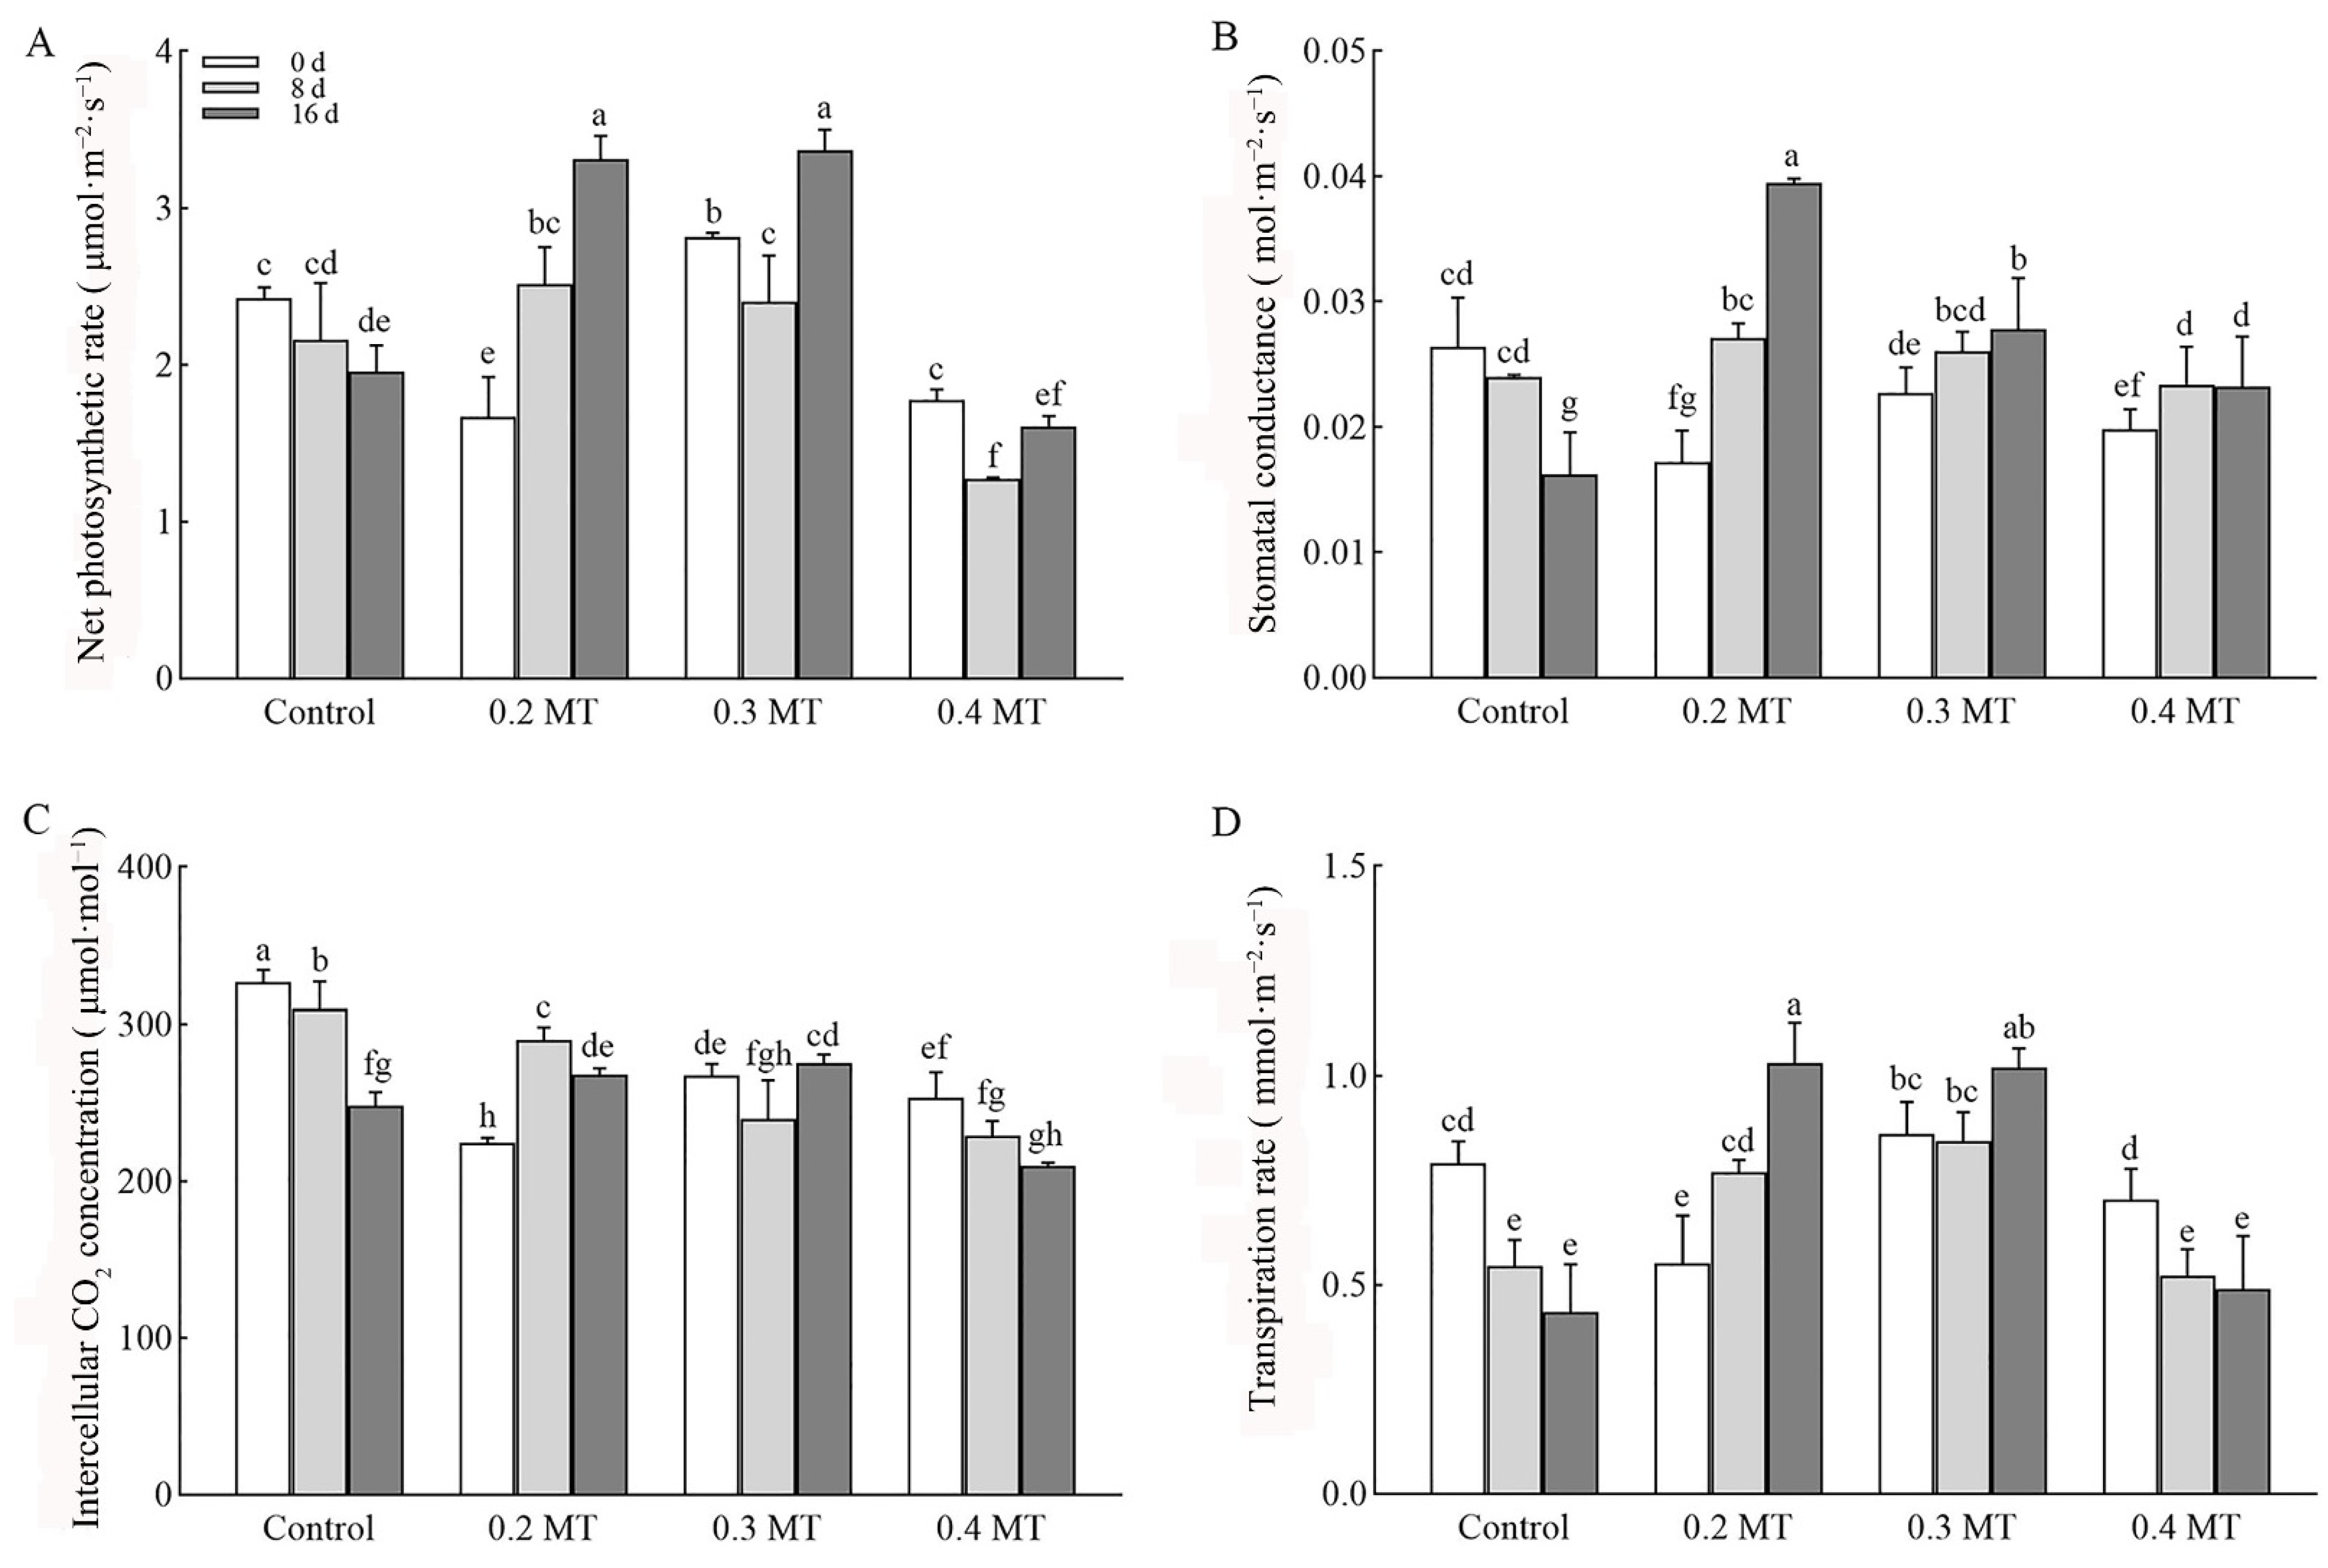
2.2. Effects of Exogenous MT Application on Photosynthetic Parameters in Tea Plants

The effects of MT on photosynthesis are presented in Figure 1. The net photosynthetic rate (Pn), stomatal conductance (Gs), intercellular CO2 concentration (Ci), and transpiration rate (Tr) decreased in the control group during the treatment times, especially at day 16. Exogenous MT improved these parameters. Compared to day 0, tea leaves under a 0.2-mM MT treatment had higher Pn, Gs, Ci, Tr levels at days 8 and 16. The Pn and Gs of tea leaves treated with 0.3 mM MT at day 16 were higher than at day 0, without obvious changes in Ci and Tr. MT treatment at 0.4 mM had a negative effect on Pn and Ci, the decrease in them was higher than that of the control at day 8. The above data indicated that the application of 0.2 and 0.3 mM MT improved photosynthesis of tea leaves.

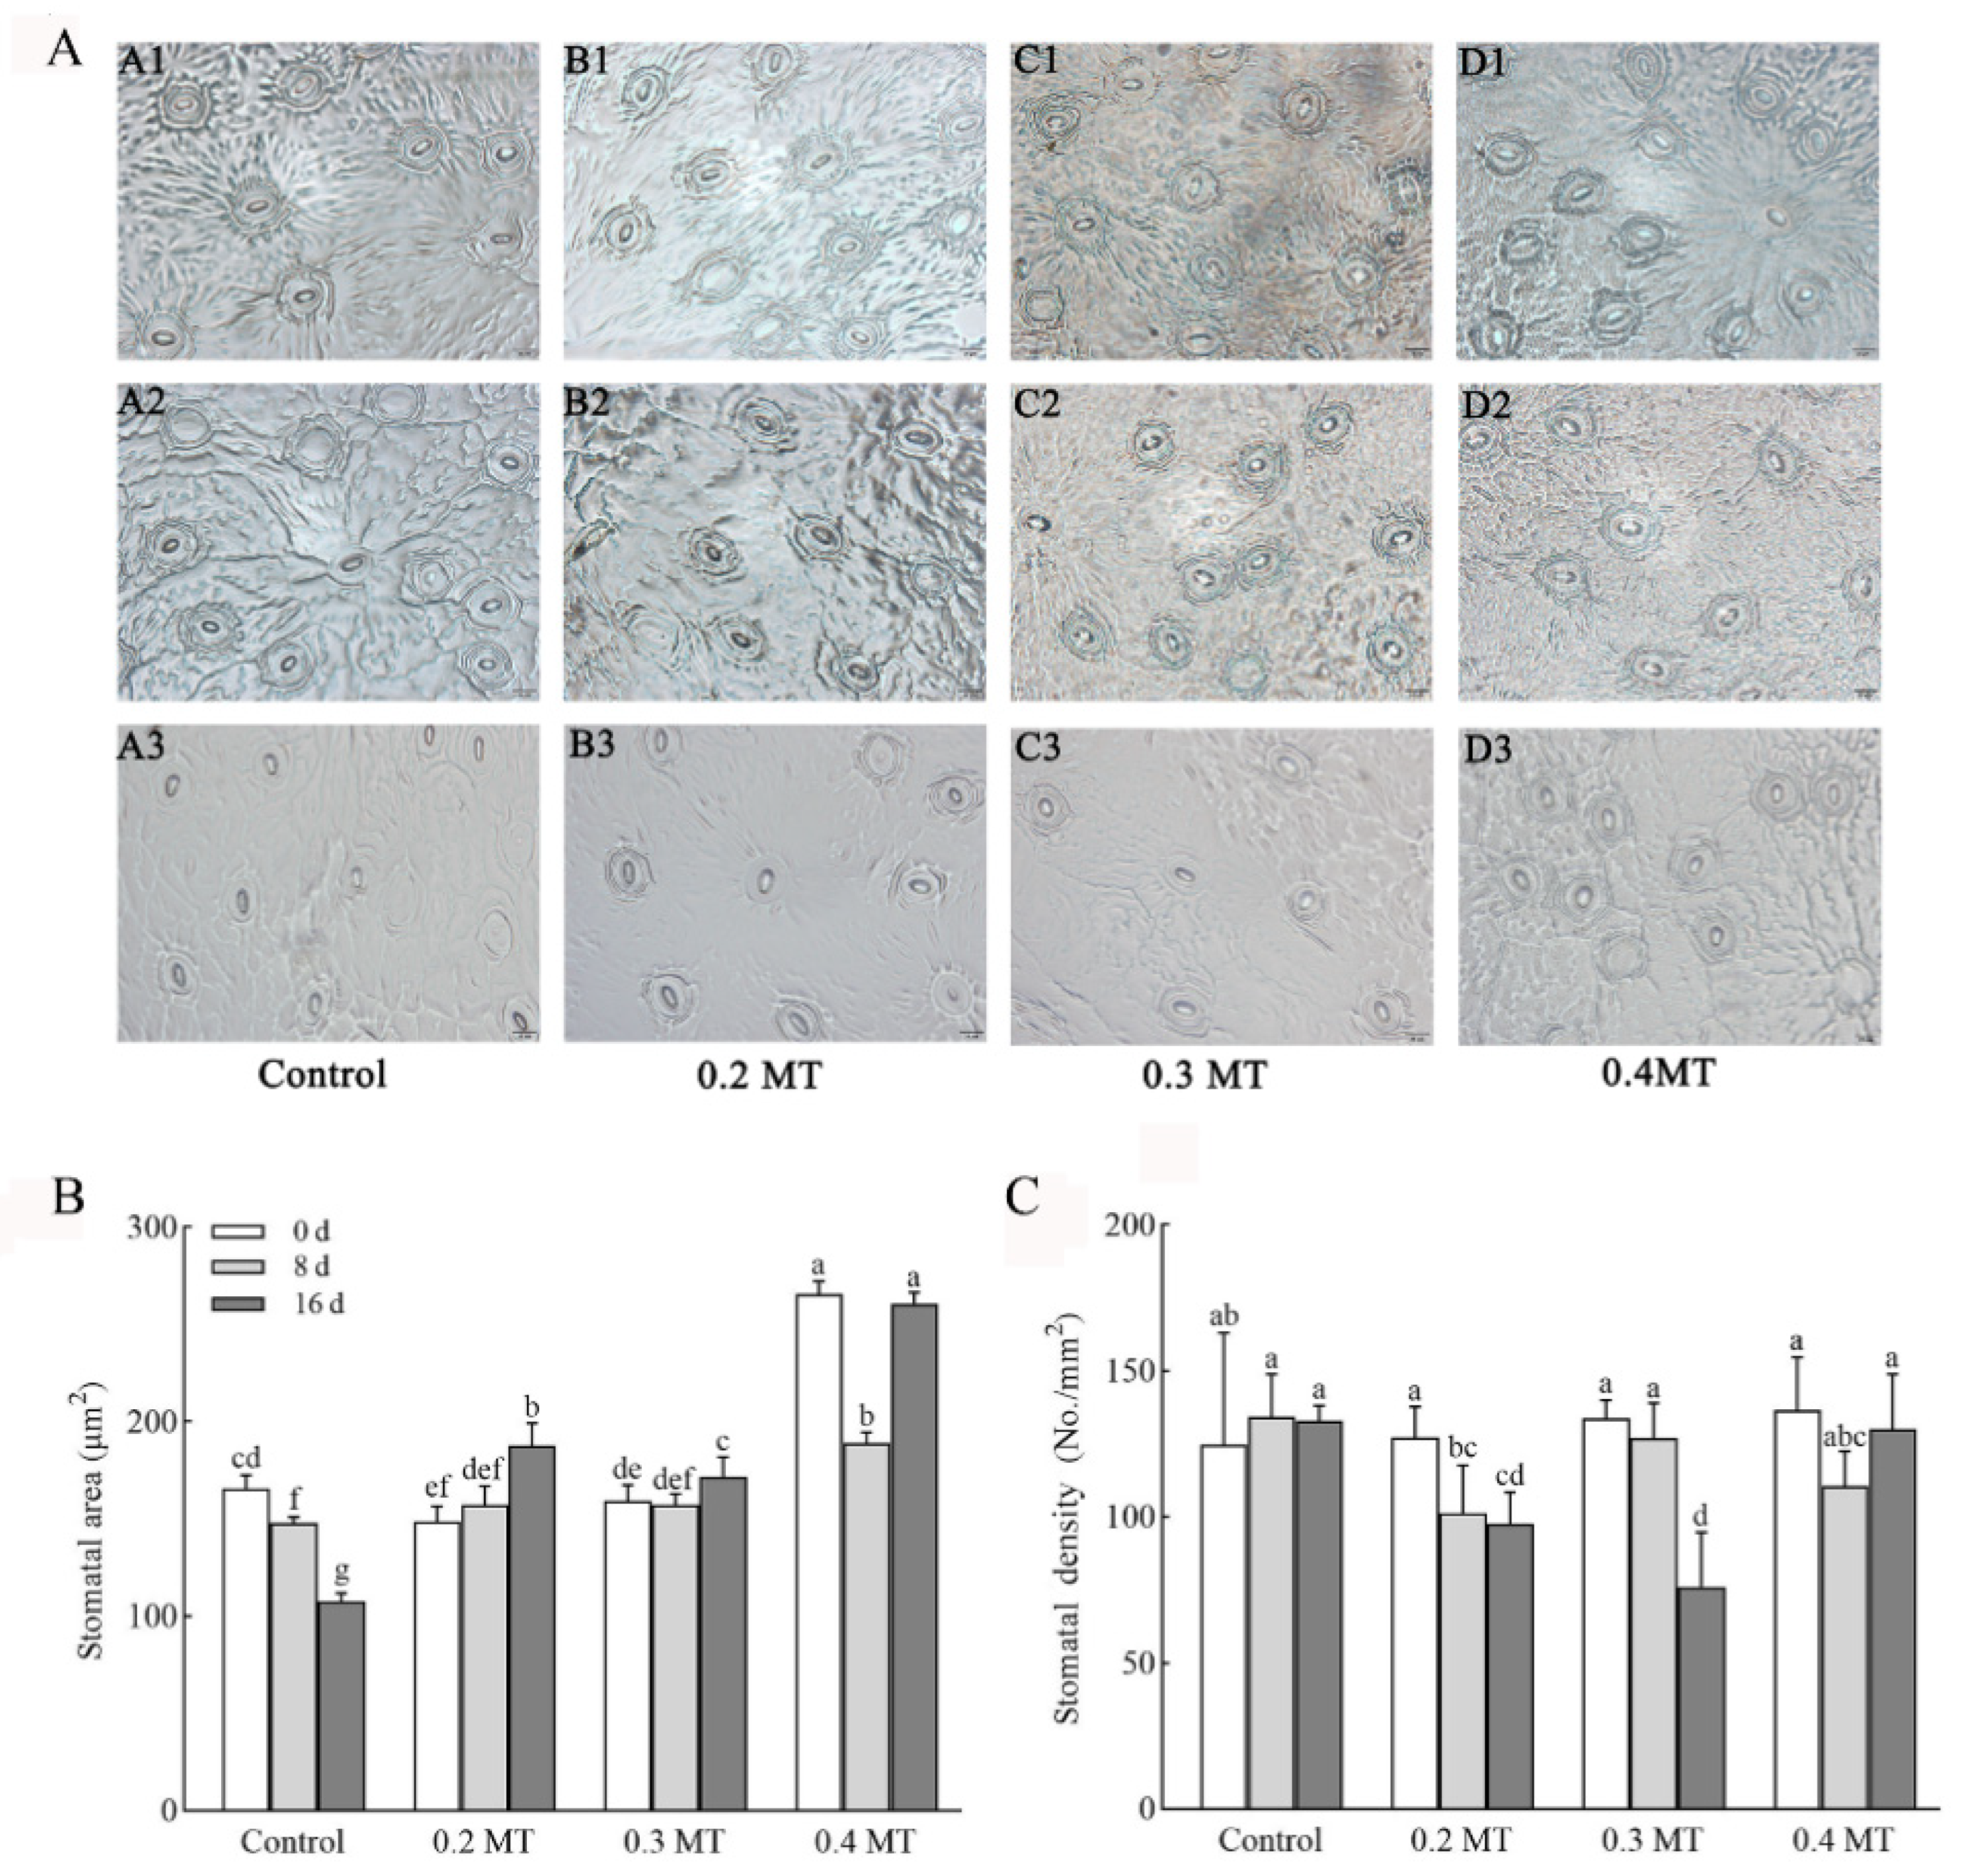
2.3. Effects of Exogenous MT Application on Stomatal Characteristics in Tea Leaves

We observed the stomatal morphology (Figure 2A) under different concentrations of MT treatments and calculated the stomatal area (Figure 2B) and density (Figure 2C). Compared to day 0, the stomatal area of the control reduced significantly over time, and decreased by 35.02% at day 16 (Figure 2B). The stomatal area increased under 0.2- and 0.3-mM MT treatments at day 16, which was 1.26 and 1.08 times that at day 0, respectively. At day 8, a 0.4 mM MT treatment accelerated the decrease in stomatal area, but it showed the opposite trend at day 16. There was no significant change in stomatal density of the control (Figure 2C). Leaves exposed to 0.2 and 0.3 mM MT had lower stomatal density than that at day 0, which decreased by 23.40 and 43.24% at day 16, respectively. The trend of stomatal density under a 0.4-mM MT treatment was consistent with that of the control.

2.4. Effects of Exogenous MT Application on Chl Fluorescence Parameters in Tea Plants

2.4.1. Effects of Exogenous MT Application on Fv/Fm in Tea Plants

The Chl fluorescence parameter Fv/Fm is often used to determine the photosynthetic physiological state of leaves. The effects of exogenous MT application on Fv/Fm of tea leaves are listed in Table 2. In the control group, compared with day 0, Fv/Fm had no significant difference on day 8 and decreased on day 16. In the 0.2-mM MT treatment group, Fv/Fm showed a significant upward trend compared with day 0, reaching the maximum (0.793) at day 16. The decrease in Fv/Fm in tea leaves treated with 0.3 mM MT was higher than that in the control group at day 16, which indicated that MT treatment with this concentration displayed an inhibitory effect on Fv/Fm. Compared with day 0, the 0.4-mM MT treatment increased Fo and significantly reduced Fv/Fm in tea leaves at days 8 and 16. Therefore, high concentrations of MT (0.3 mM and 0.4 mM) had negative effects on Fv/Fm.

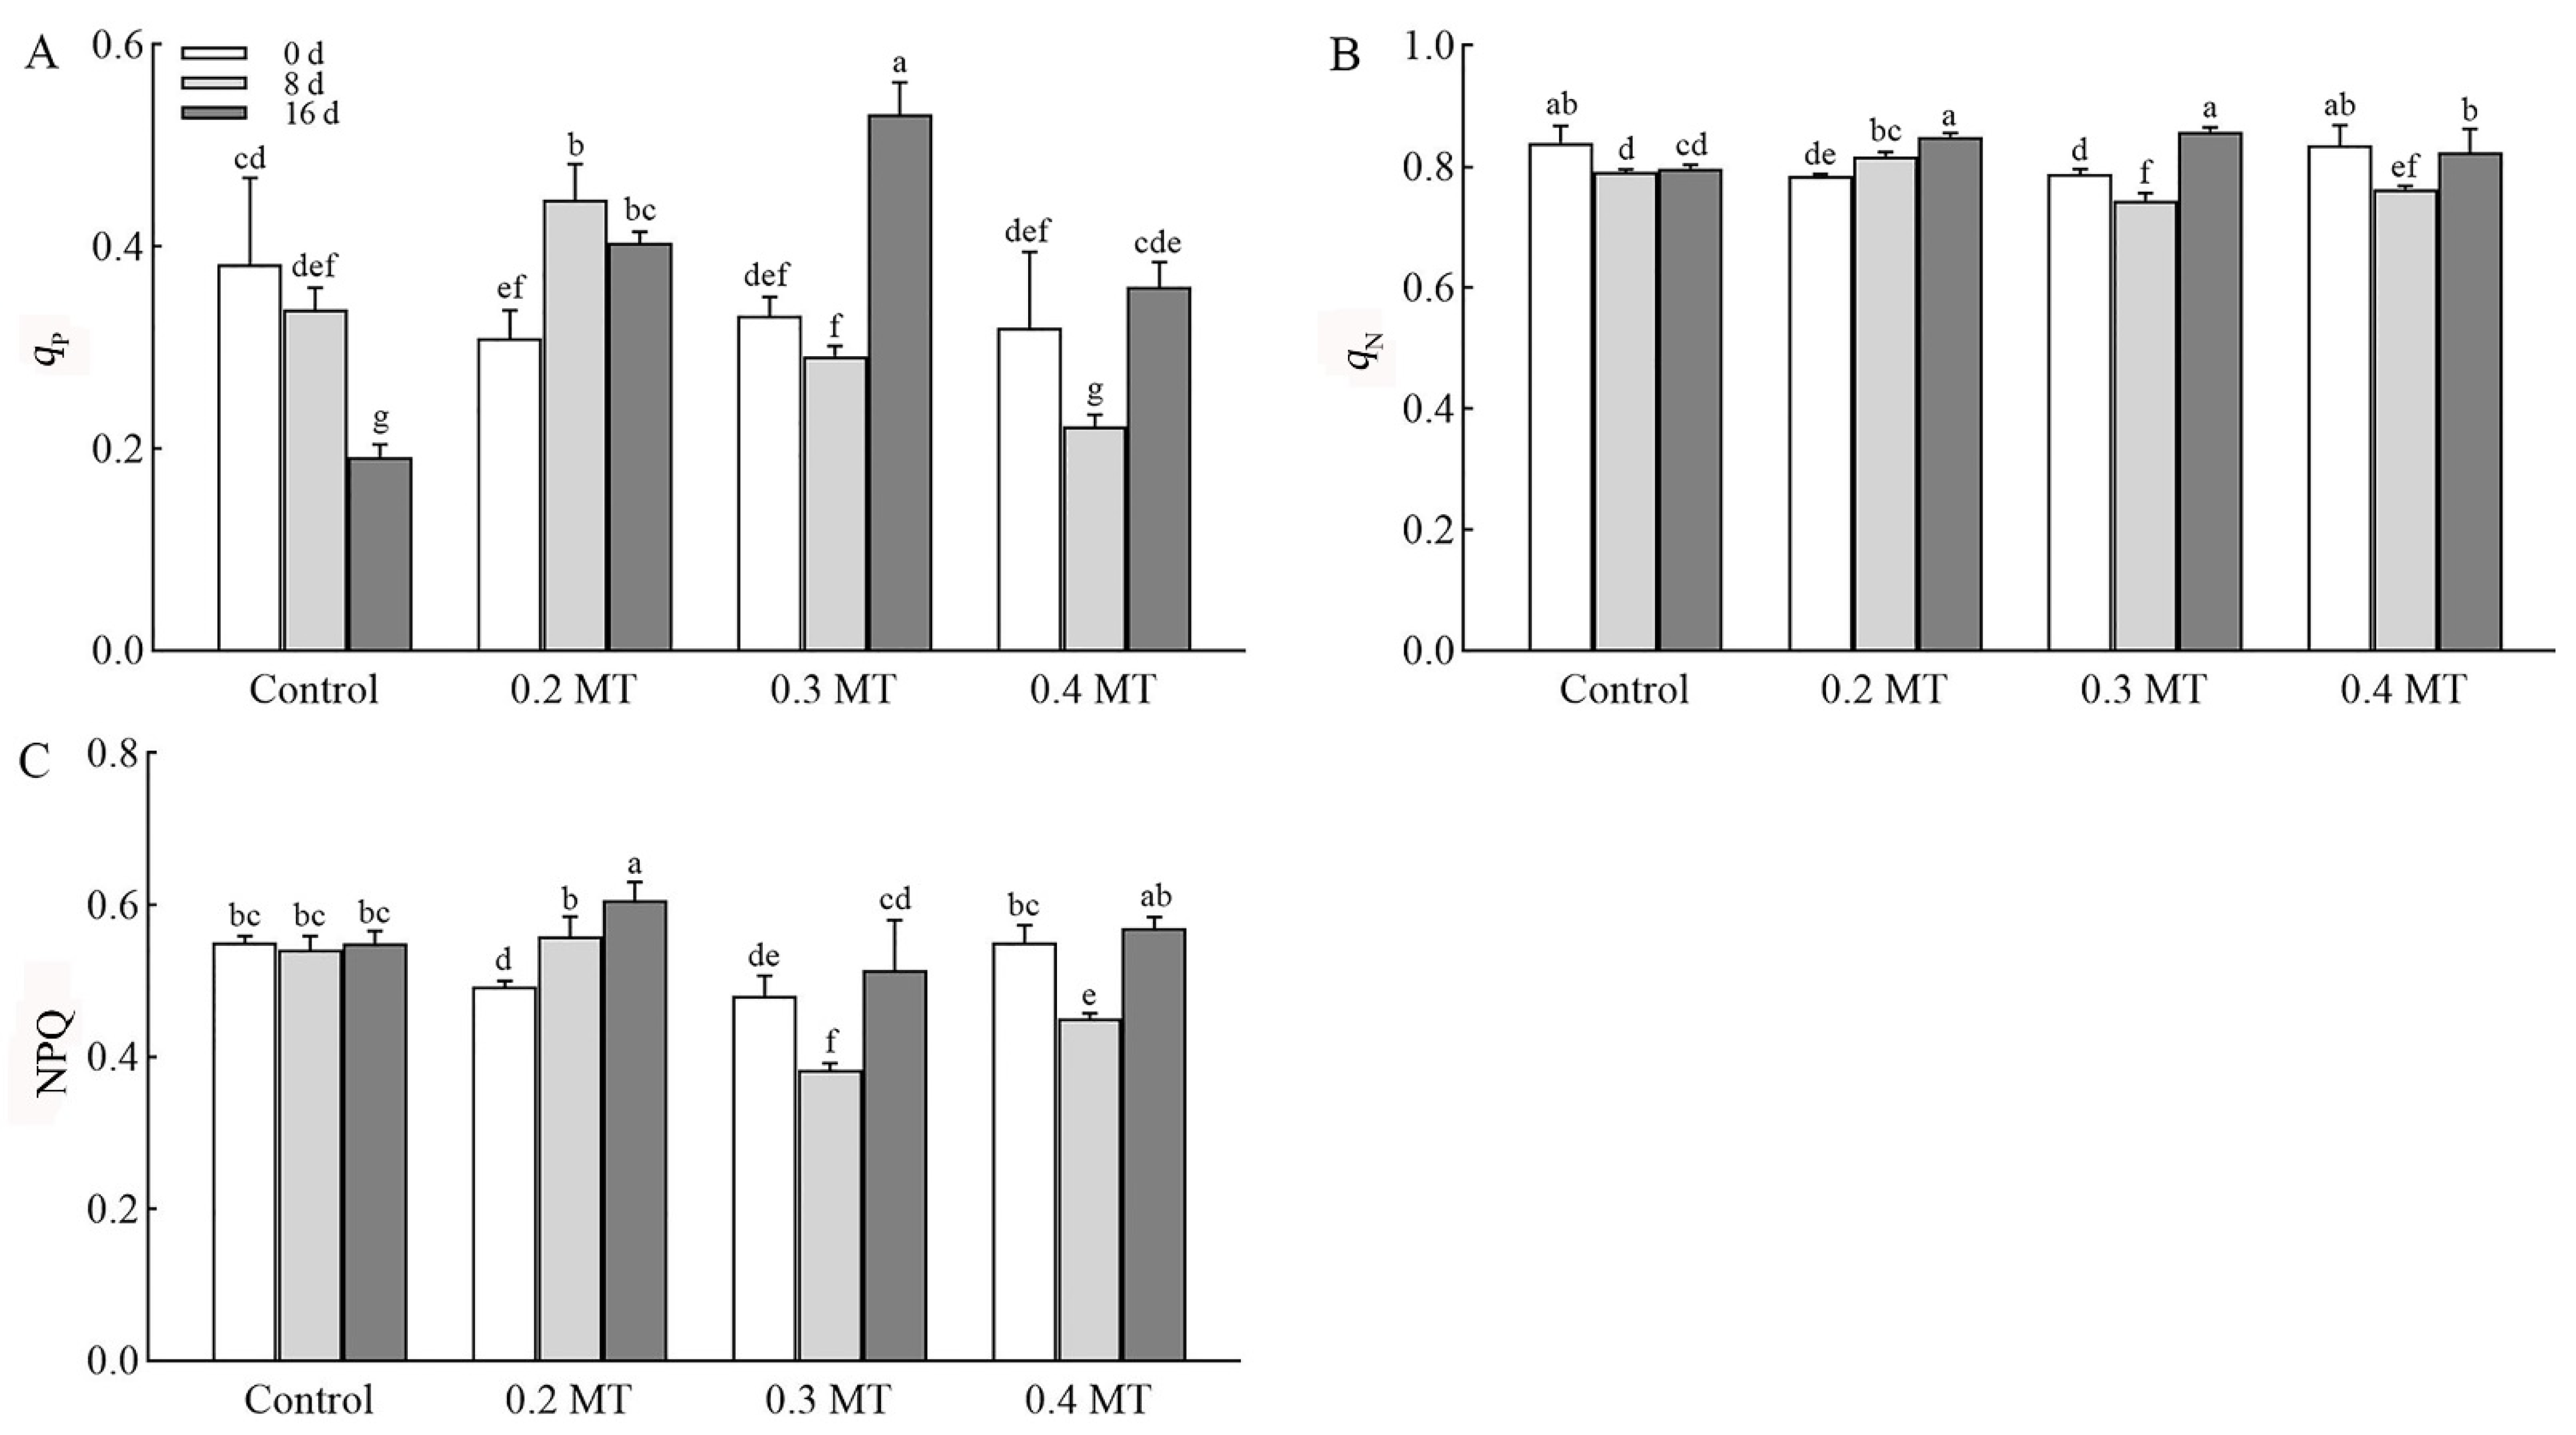
2.4.2. Effects of Exogenous MT Application on Chl Fluorescence Quenching Coefficients

The variable Chl fluorescence fraction quenched by photochemical or non-photochemical process is represented by qP and qN, respectively. Photochemical quenching reflects the redox state of PSII primary quinone electron acceptor (QA), and high qP level indicates strong electron transfer activity of PSII. In the control group, the qP decreased significantly at day 16 (Figure 3A). Under 0.2-mM MT treatment, the level of qP increased significantly at days 8 and 16, which was 1.44 and 1.31 times of that before treatment, respectively. MT treatment at 0.3 mM had a promoting effect on qP at day 16, for which the level was increased by 3.14%. The qP level was decreased at day 8 and then increased at day 16 under 0.4-mM MT treatment. Non-photochemical quenching mechanisms can dissipate excessive light energy absorbed by leaves in the form of heat. The qN level of tea leaves without MT treatment at days 8 and 16 were significantly lower than that at day 0 (Figure 3B). Under 0.2-mM MT treatment, the qN level gradually increased during the treatment times, which was 1.04 and 1.08 times at days 8 and 16 of that before treatment, respectively. The trend of qN under a 0.3-mM MT treatment showed a pattern similar to that of 0.4 mM MT, which decreased at day 8 and then increased at day 16. The NPQ value reflects the heat dissipation level of non-photochemical process. The effects of MT treatments with various concentrations on the level of NPQ showed a high similarity with qN (Figure 3C). Tea leaves exposed to 0.2 mM MT had the highest NPQ level at day 16.

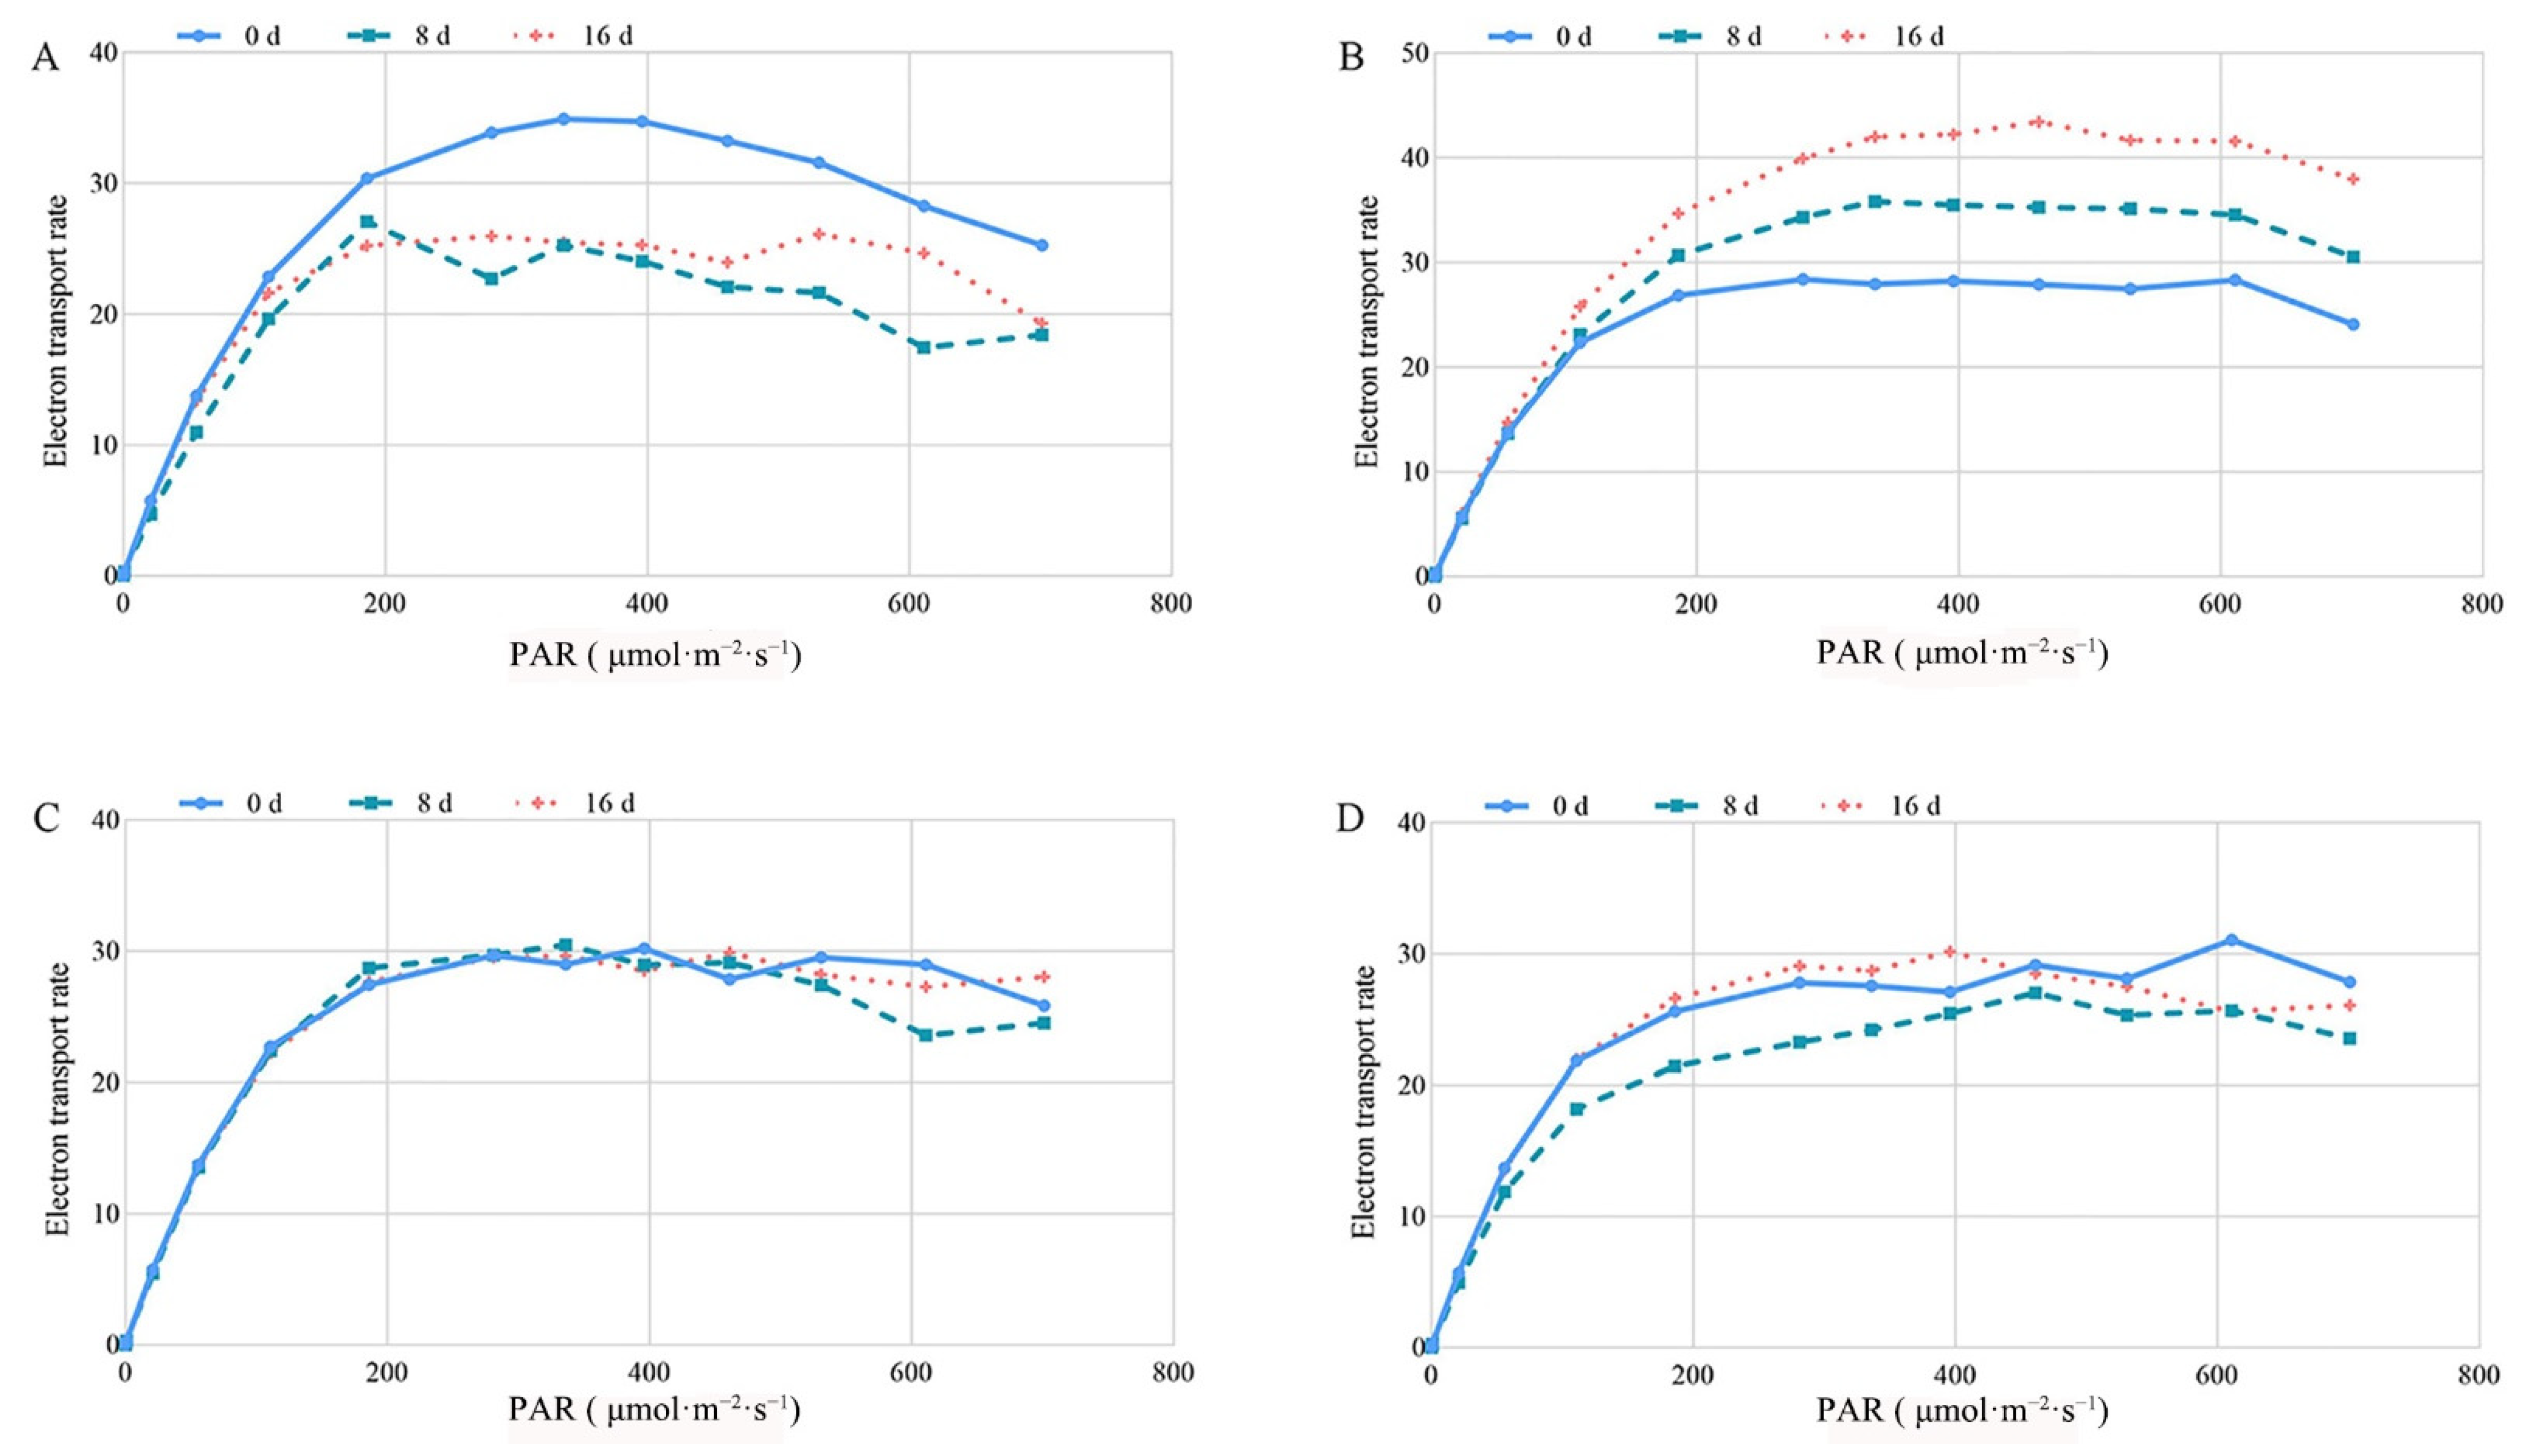
2.4.3. Effects of Exogenous MT Application on the Light Response Curve in Tea Plants

By fitting the light response curve, the effect of MT on electron transfer rate (ETR) of tea leaves under different photosynthetically active radiance (PAR) was investigated (Figure 4). The ETR in each group improved with the increase in PAR, and then the growth rate slowed until it decreased. Compared to day 0, the electron transfer ability of the control decreased at days 8 and 16, while gradually increasing over time under a 0.2-mM MT treatment (Figure 4A,B). Additionally, the electron transport capacity remained relatively stable of tea leaves treated with 0.3 mM and 0.4 mM MT in comparison with control group (Figure 4C,D). Our results indicated that MT improved or maintained the photosynthetic capacity of tea plants.

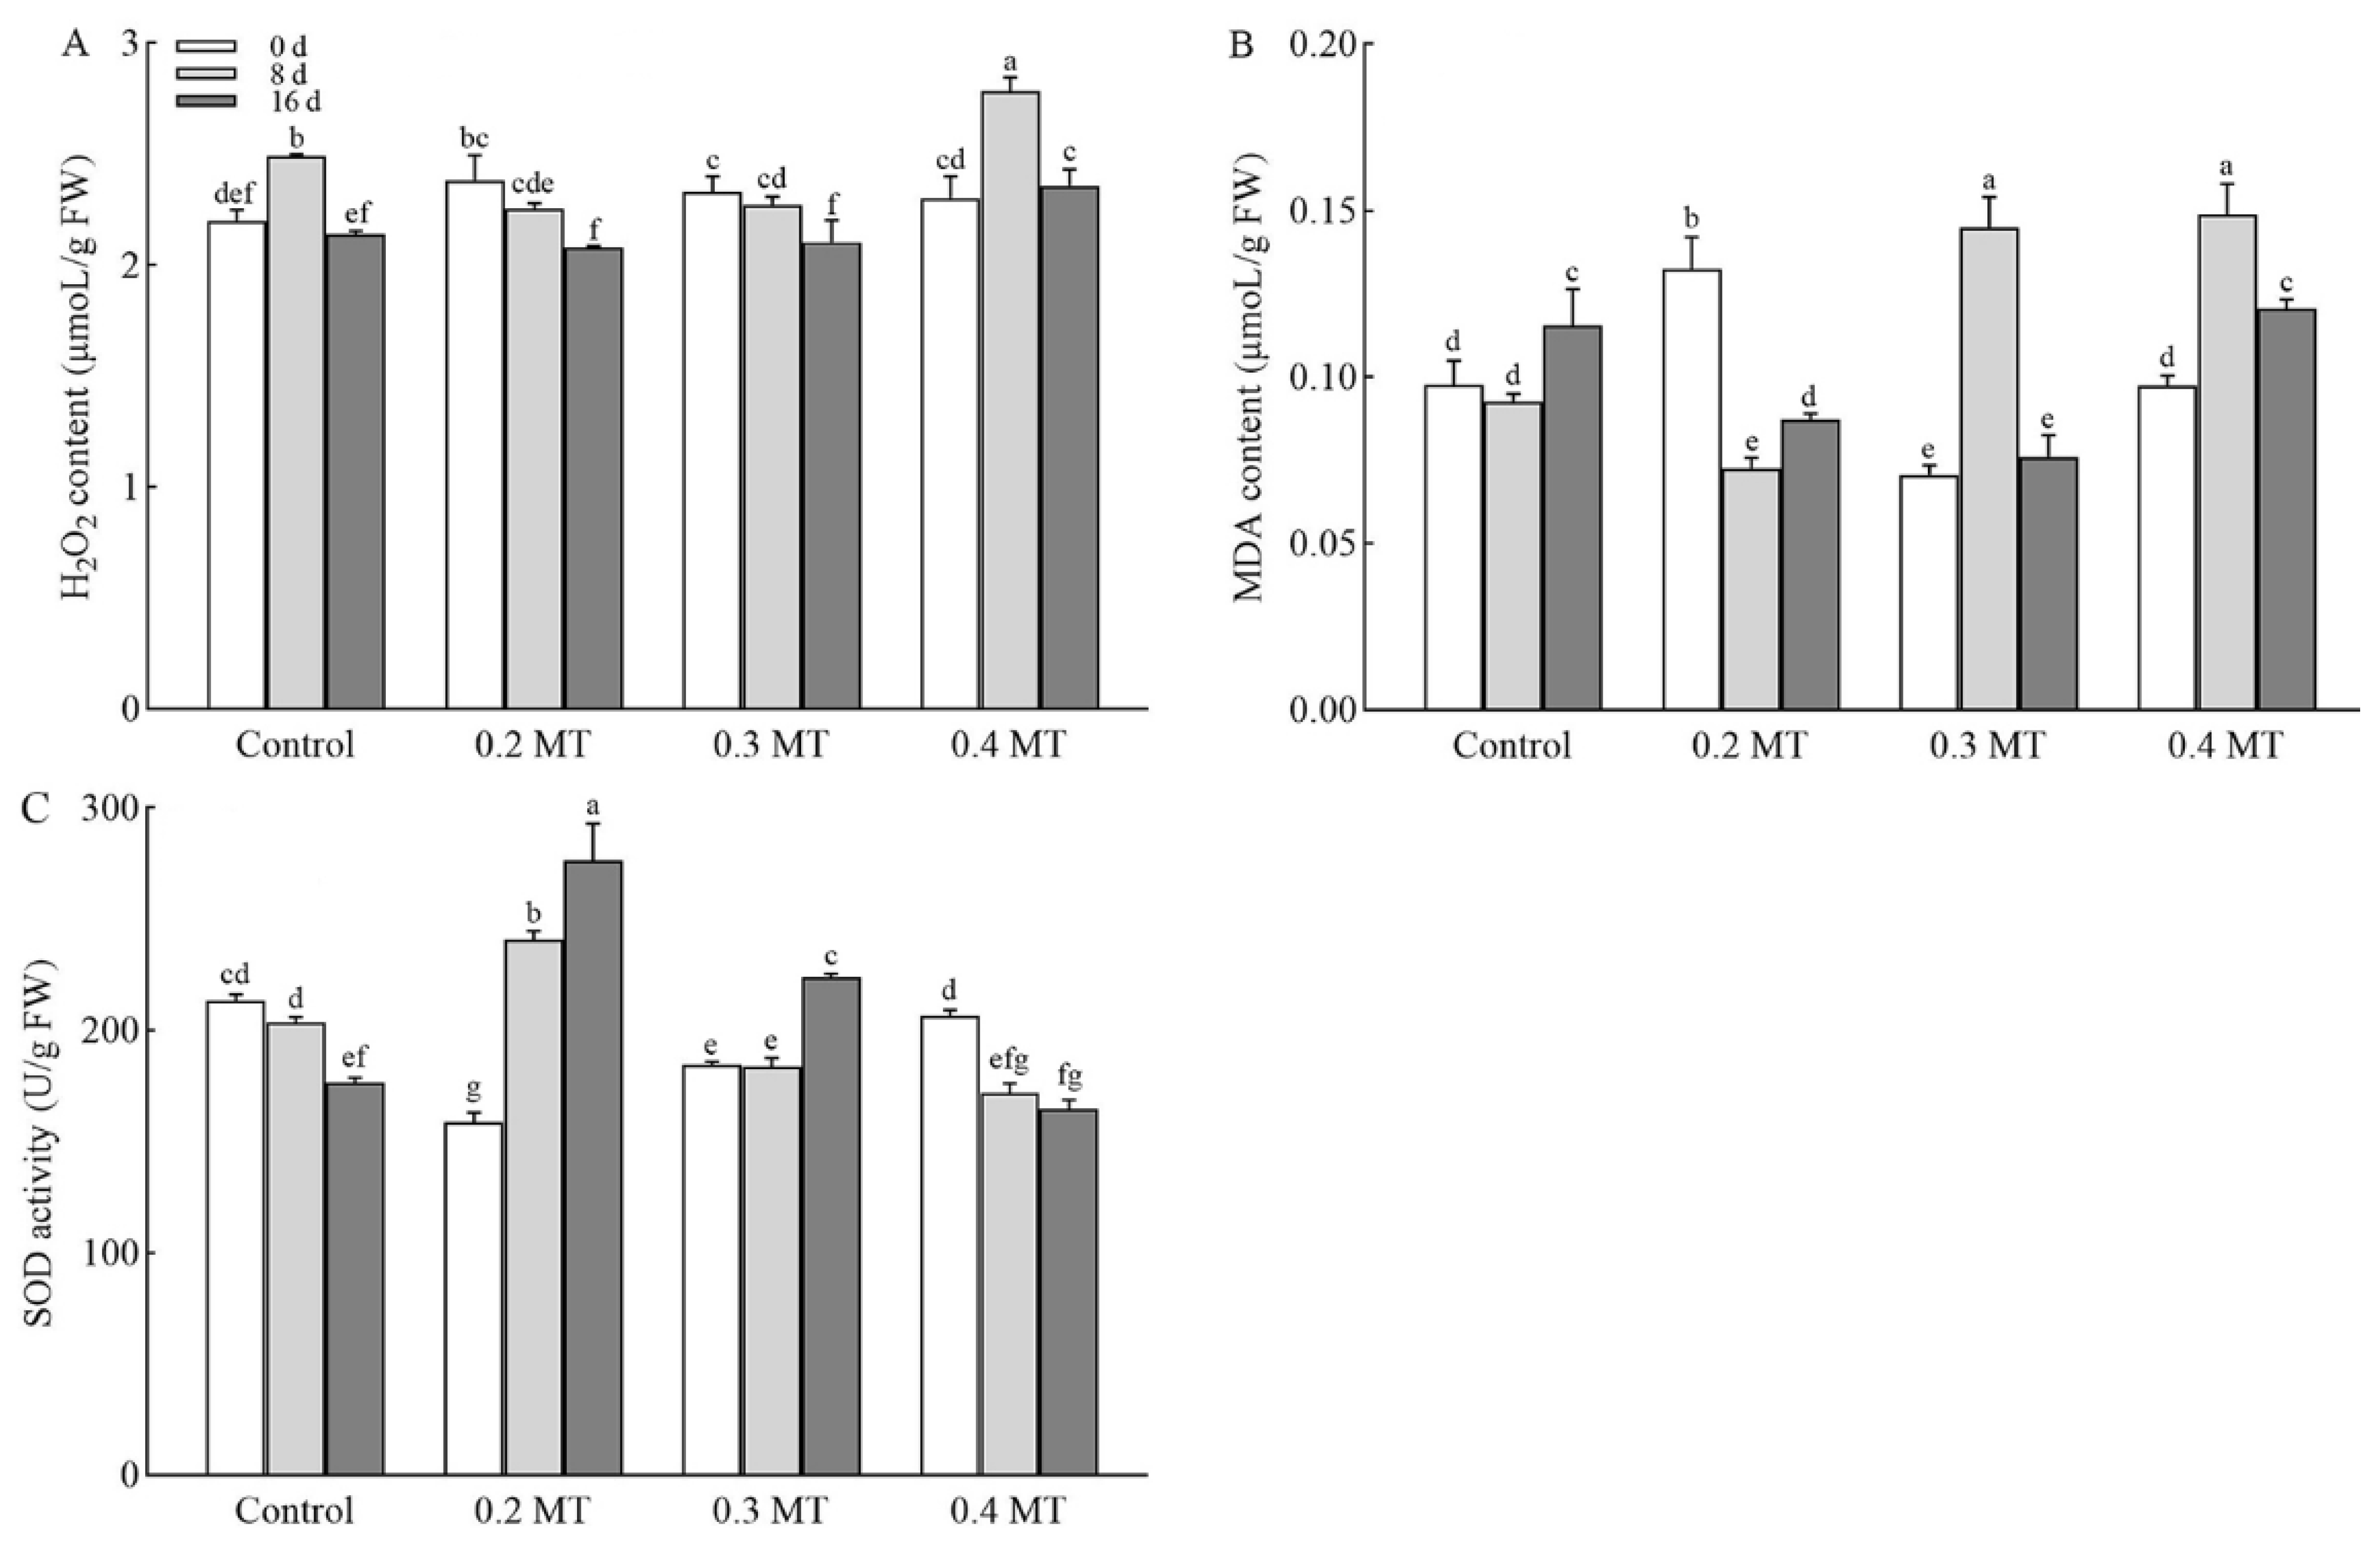
2.5. Effects of Exogenous MT Application on H2O2 and MDA Contents in Tea Plants

The change in H2O2 content in MT treatments is shown in Figure 5A. In the control group, the content of H2O2 at day 8 was 1.13 times that at day 0. Treatment with 0.2 mM MT reduced H2O2 content by 12.70 % at day 16 in comparison with day 0, and with a 0.3-mM MT treatment, it decreased by 9.72%. The trend of H2O2 content under 0.4-mM MT treatment was consistent with that of the control, and the increase was higher than that of the control at day 8. The MDA content is evaluated in tea leaves at different MT concentrations and was used to assess the degree of membrane damage. The accumulation of MDA was obviously suppressed in the leaves treated with 0.2 mM MT, especially at day 8 (Figure 5B). Under the 0.3-mM MT treatment, MDA content significantly increased and then declined over time. At day 16, the increase was suppressed in comparison with the control. The MDA content of leaves treated with 0.4 mM MT increased by 34.57% at day 8, and the same increase was found at day 16 as that of the control. This result showed that MT might inhibit ROS accumulation and alleviate the oxidation of membrane lipids. The addition of 0.2 mM MT showed the greatest inhibitory effect, while 0.4 mM MT had the opposite effect.

2.6. SOD Activity as Influenced by Exogenous MT Application in Tea Leaves

In order to explore the effect of exogenous MT on antioxidant enzyme activity, we monitored the activities of SOD (Figure 5C). In the control group, SOD activity decreased at day 16. MT treatment at 0.2 mM increased SOD activity at days 8 and 16 in comparison with day 0, which was 1.52 and 1.74 times that at day 0, respectively. Leaves treated with 0.3 mM MT had higher SOD activity at day 16 than that day 0. Under the 0.4-mM MT treatment, the activity of SOD was decreased over time, and the reduction was higher than that of the control at day 8.

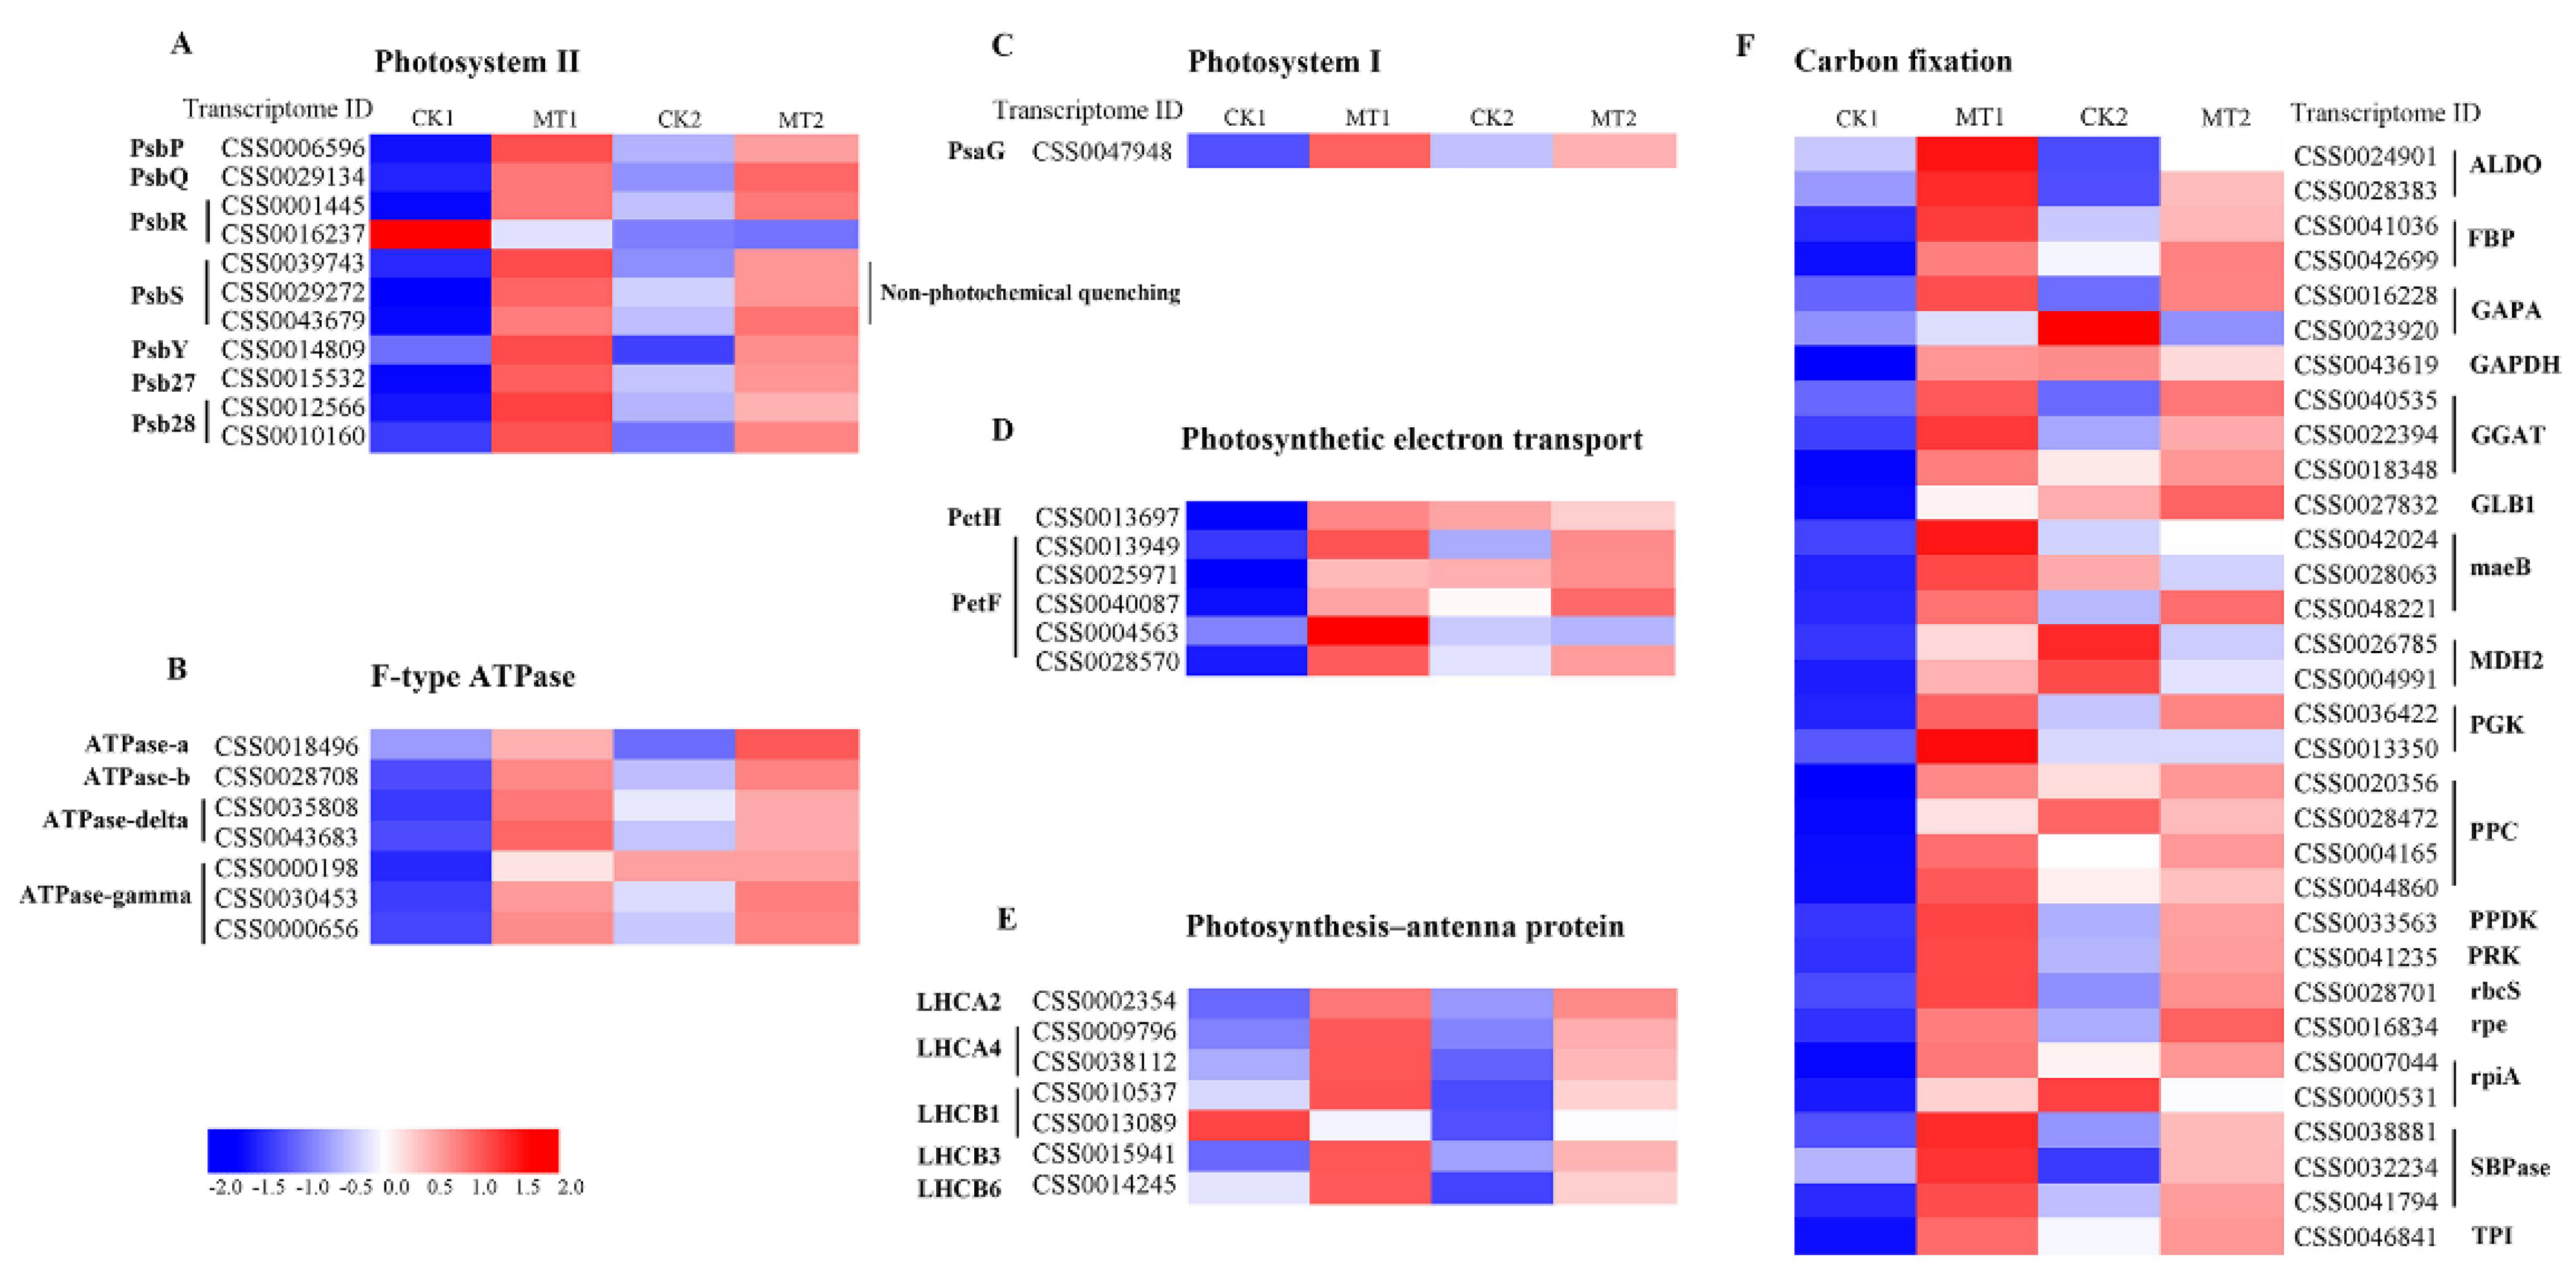
2.7. Transcriptome-Based Identification of DEGs Involved in Photosynthesis under MT Treatments

The genes related to photosynthesis were screened from the tea transcriptome, and their sequences were compared with the tea reference genome to further verify their molecular functions. CK1 and MT1 represent the control and 0.2-mM treatment groups at day 8, respectively, while CK2 and MT2 represent day 16. Among them, a total of 64 DEGs were identified in photosystem (Figure 6A–E) and carbon fixation (Figure 6F). Genes involved in PSII (PsbP, PsbQ, PsbR, PsbS, PsbY, Psb27, and Psb28) and photosystem I (PSI) (PsaG) core proteins showed upregulation in MT1 and MT2 in comparison with the control group, except PsbR (CSS0016237) (Figure 6A,C). Among them, three PsbS genes (CSS0039743, CSS0029272, and CSS0043679) were associated with non-photochemical quenching. The photoreactions include absorption of light energy by photosynthetic pigments, photosynthetic electron transfer (PetH and PetF), and ATP synthesis (ATPase-a, ATPase-b, ATPase-delta, and ATPase-gamma). Sixty-two and fifty-four DEGs encoding these proteins showed upregulation in MT1 and MT2 relative to that CK1 and CK2, respectively (Figure 6B,D). Six genes of light-harvesting complex I and II Chl a/b binding proteins that acted as photosynthesis antenna systems, LHCA2 (CSS0002354), LHCA4 (CSS0009796 and CSS0038112), LHCB1 (CSS0010537), LHCB3 (CSS0015941), and LHCB6 (CSS0014245) were upregulated under MT treatment (Figure 6E). In the carbon fixation pathway, compared with the corresponding control group, all the identified DEGs were found to be upregulated in MT1, while seven genes had the opposite expression in MT2 (Figure 6F).

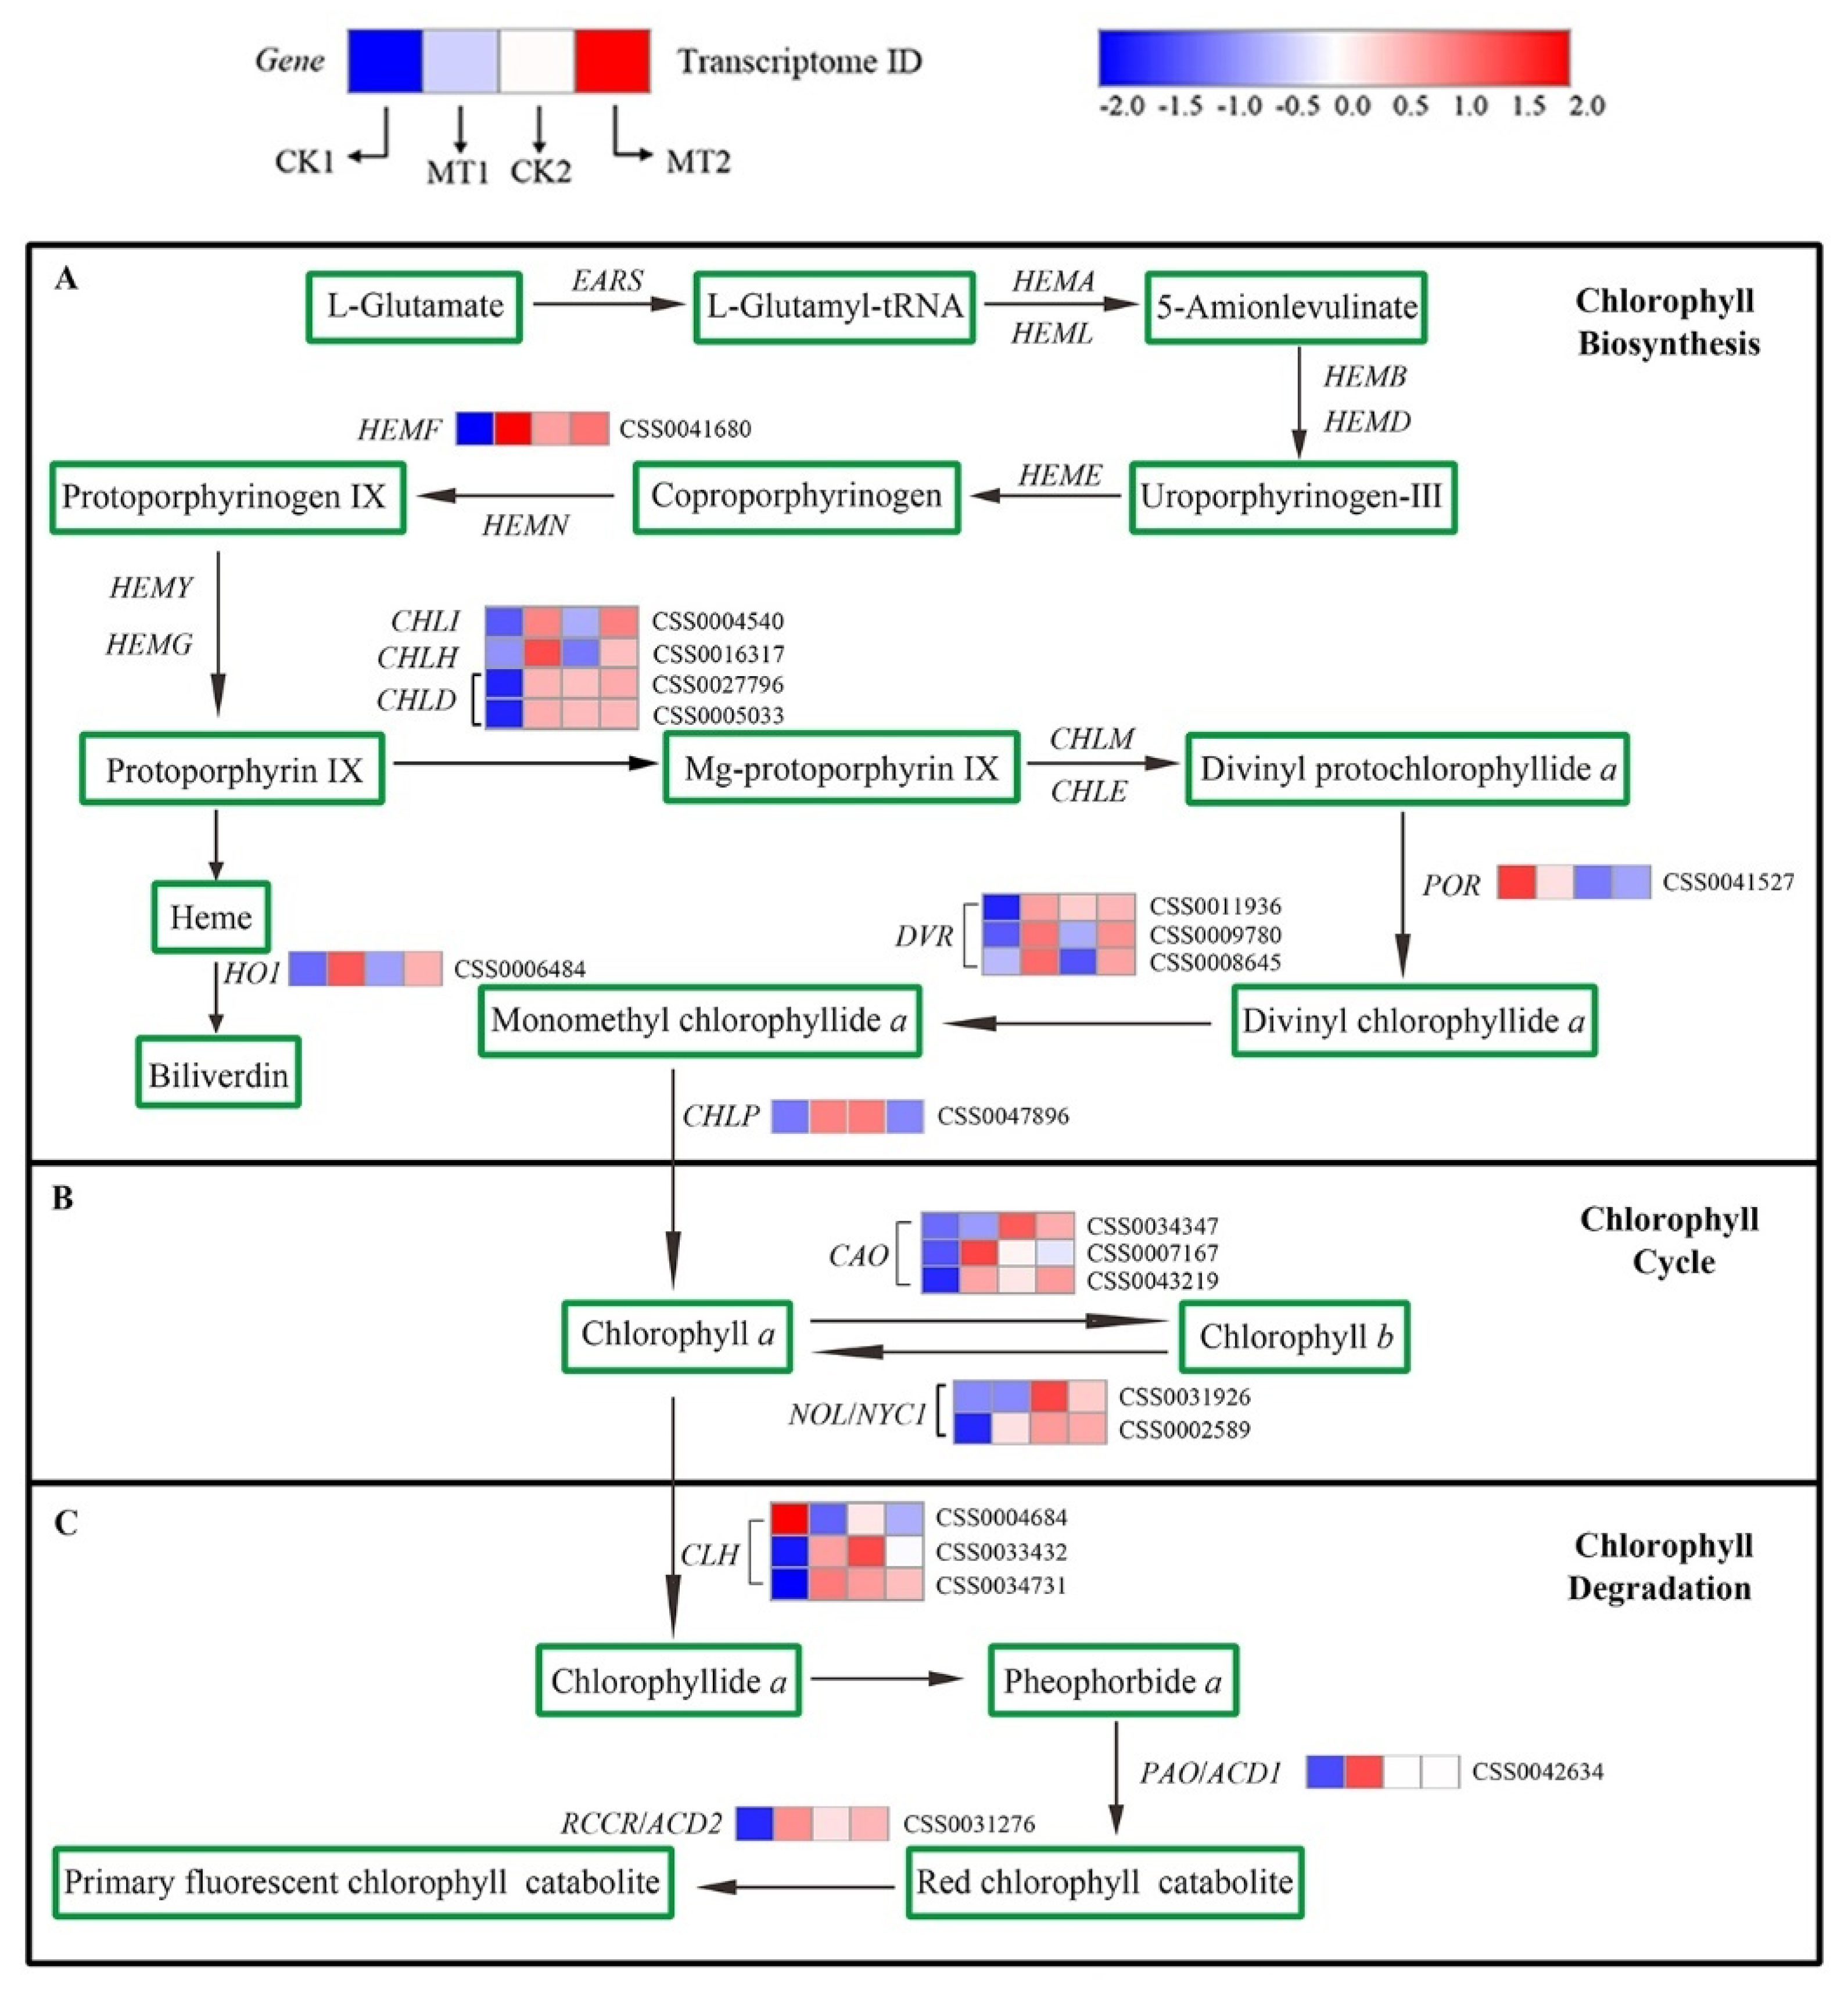
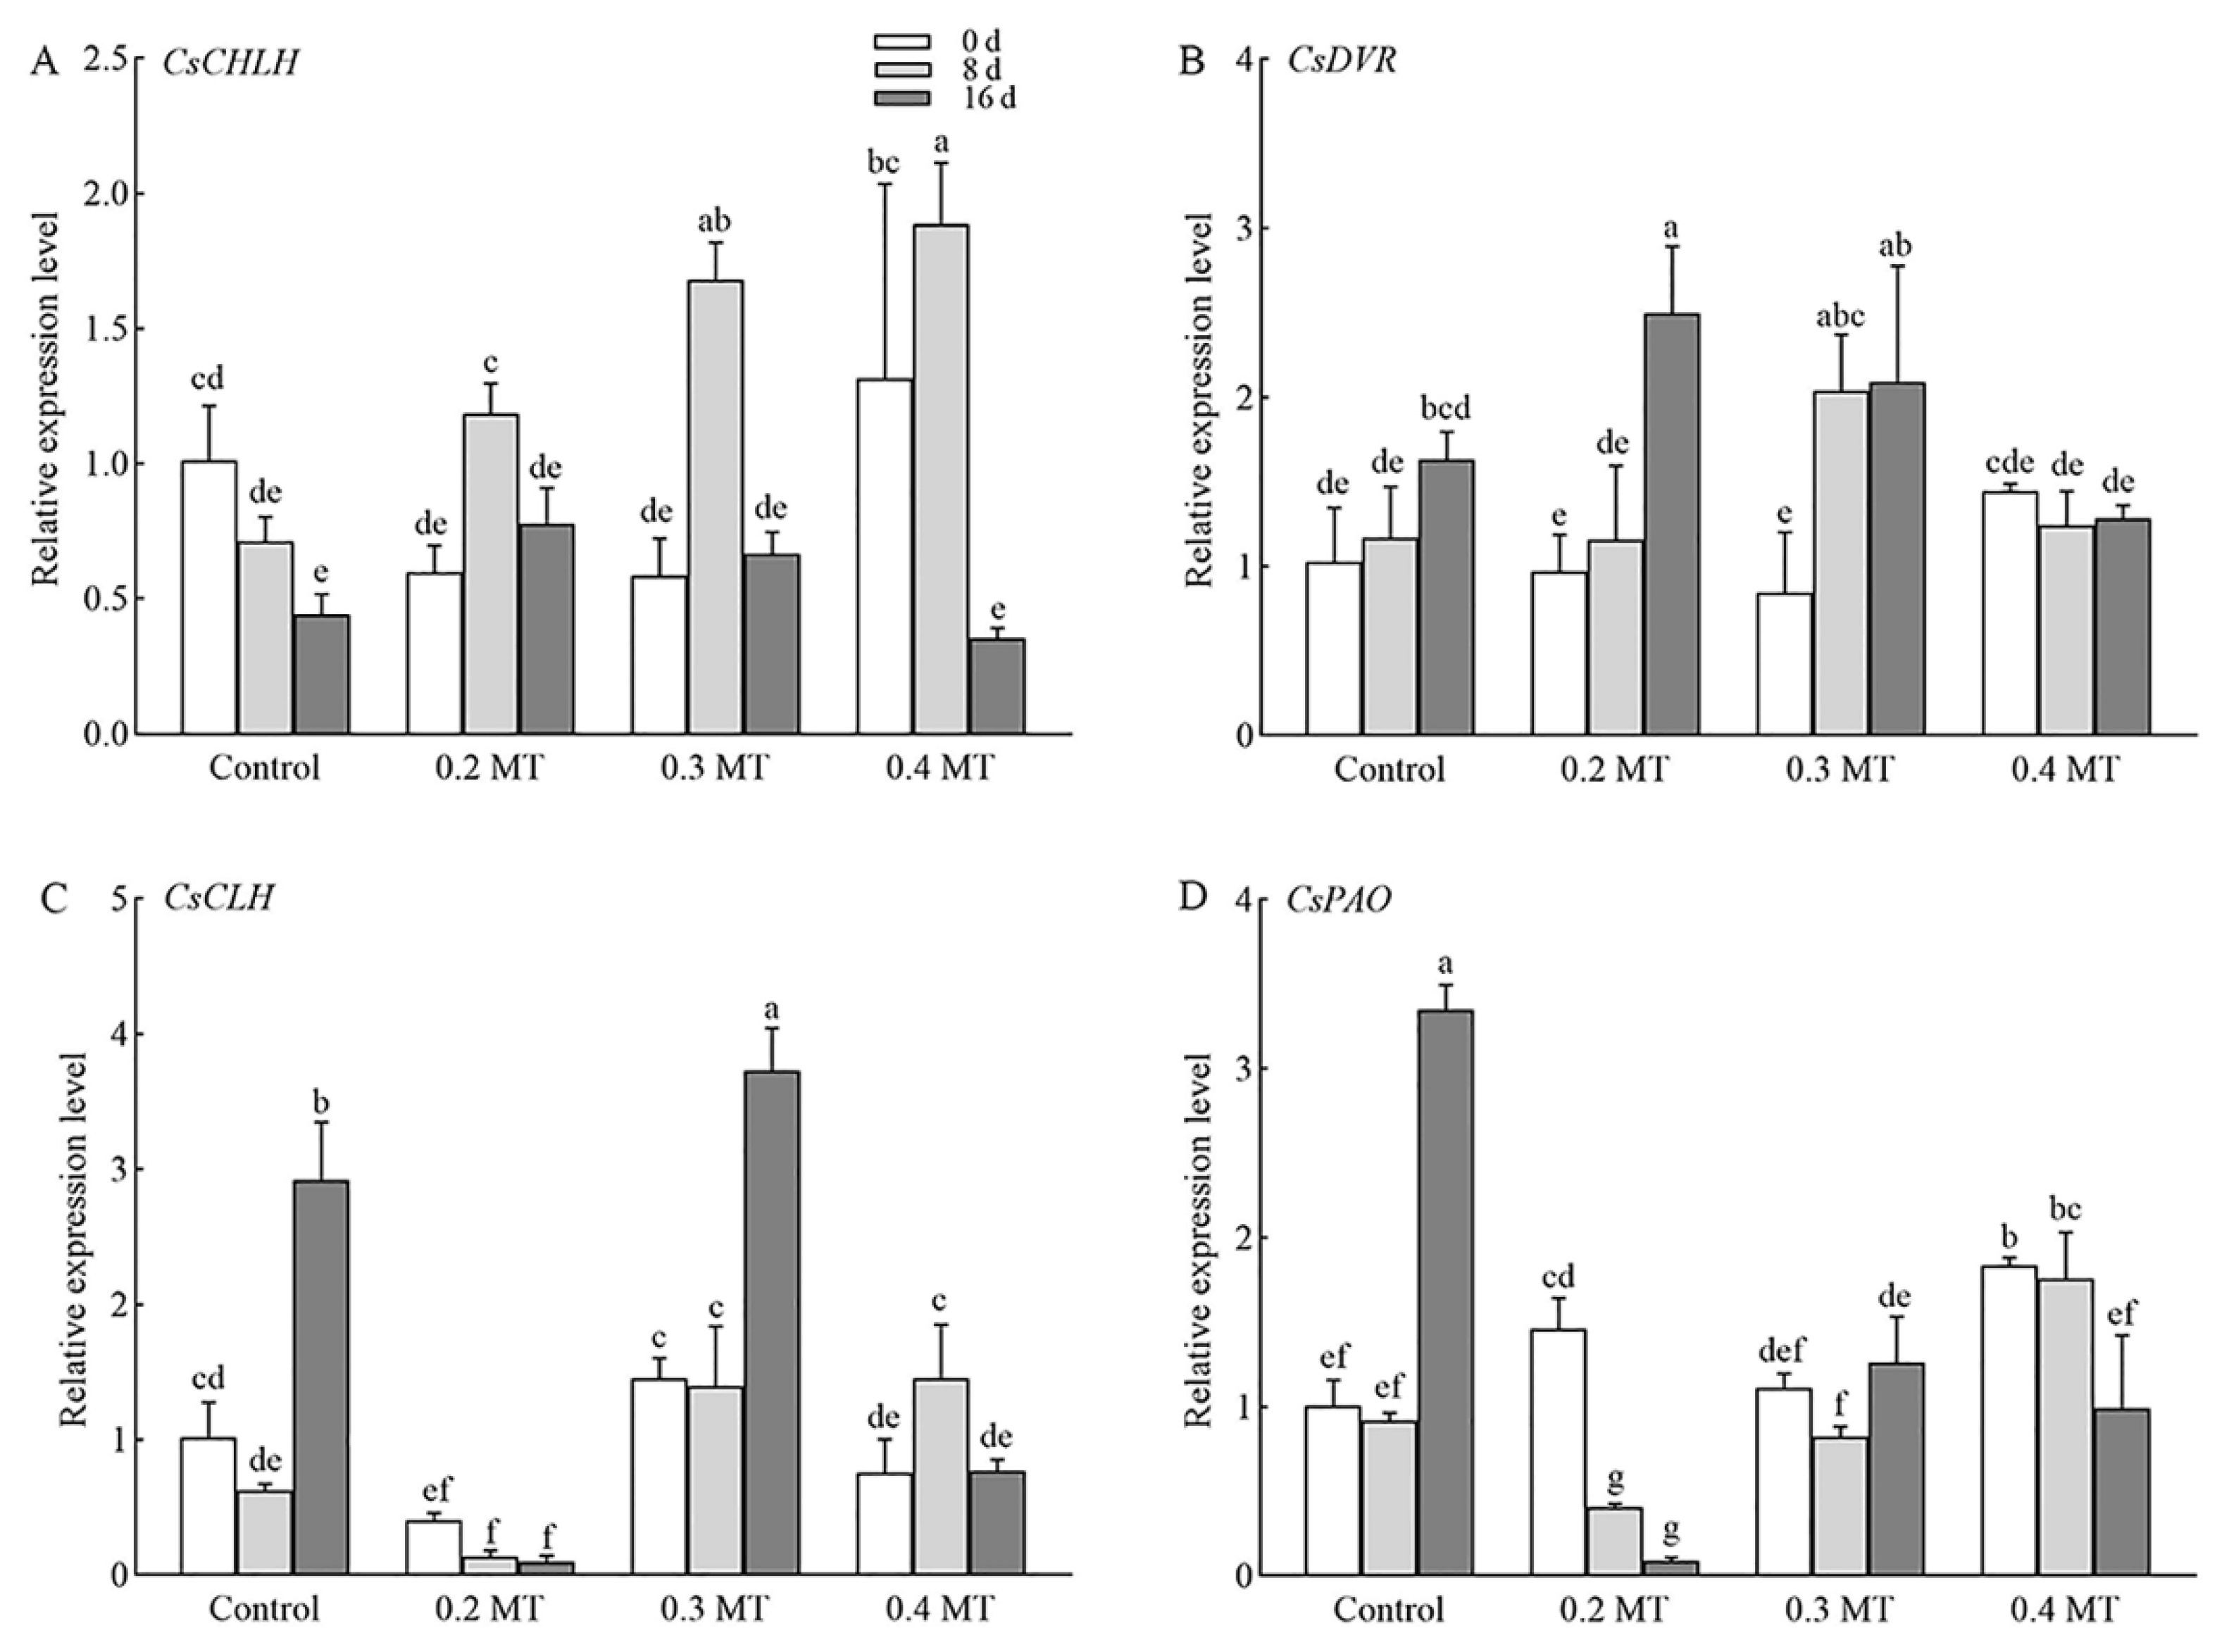
2.8. Transcriptome-Based Identification of DEGs Involved in Chl Metabolism under MT Treatments

The pathway of Chl metabolism is shown in Figure 7, and a total of 21 DGEs identified from the transcriptome were involved in Chl metabolism under MT treatments. Among the DEGs related to Chl biosynthesis and the cycle pathway, a total of 15 and 14 genes had higher expression levels in MT1 and MT2 treatments than that of the CK1 and CK2, respectively (Figure 7A,B). In addition, among the five DEGs involved in Chl degradation pathway, one and three genes were downregulated in MT1 and MT2 relative to that CK1 and CK2, respectively (Figure 7C). Based on RNA-seq, 3 three genes identified with CLH, which regulate Chl degradation, were downregulated under MT treatment at day 16 in comparison with CK2. Expression profiles showed that MT regulated the transcription level of genes which participate in Chl metabolic processes.

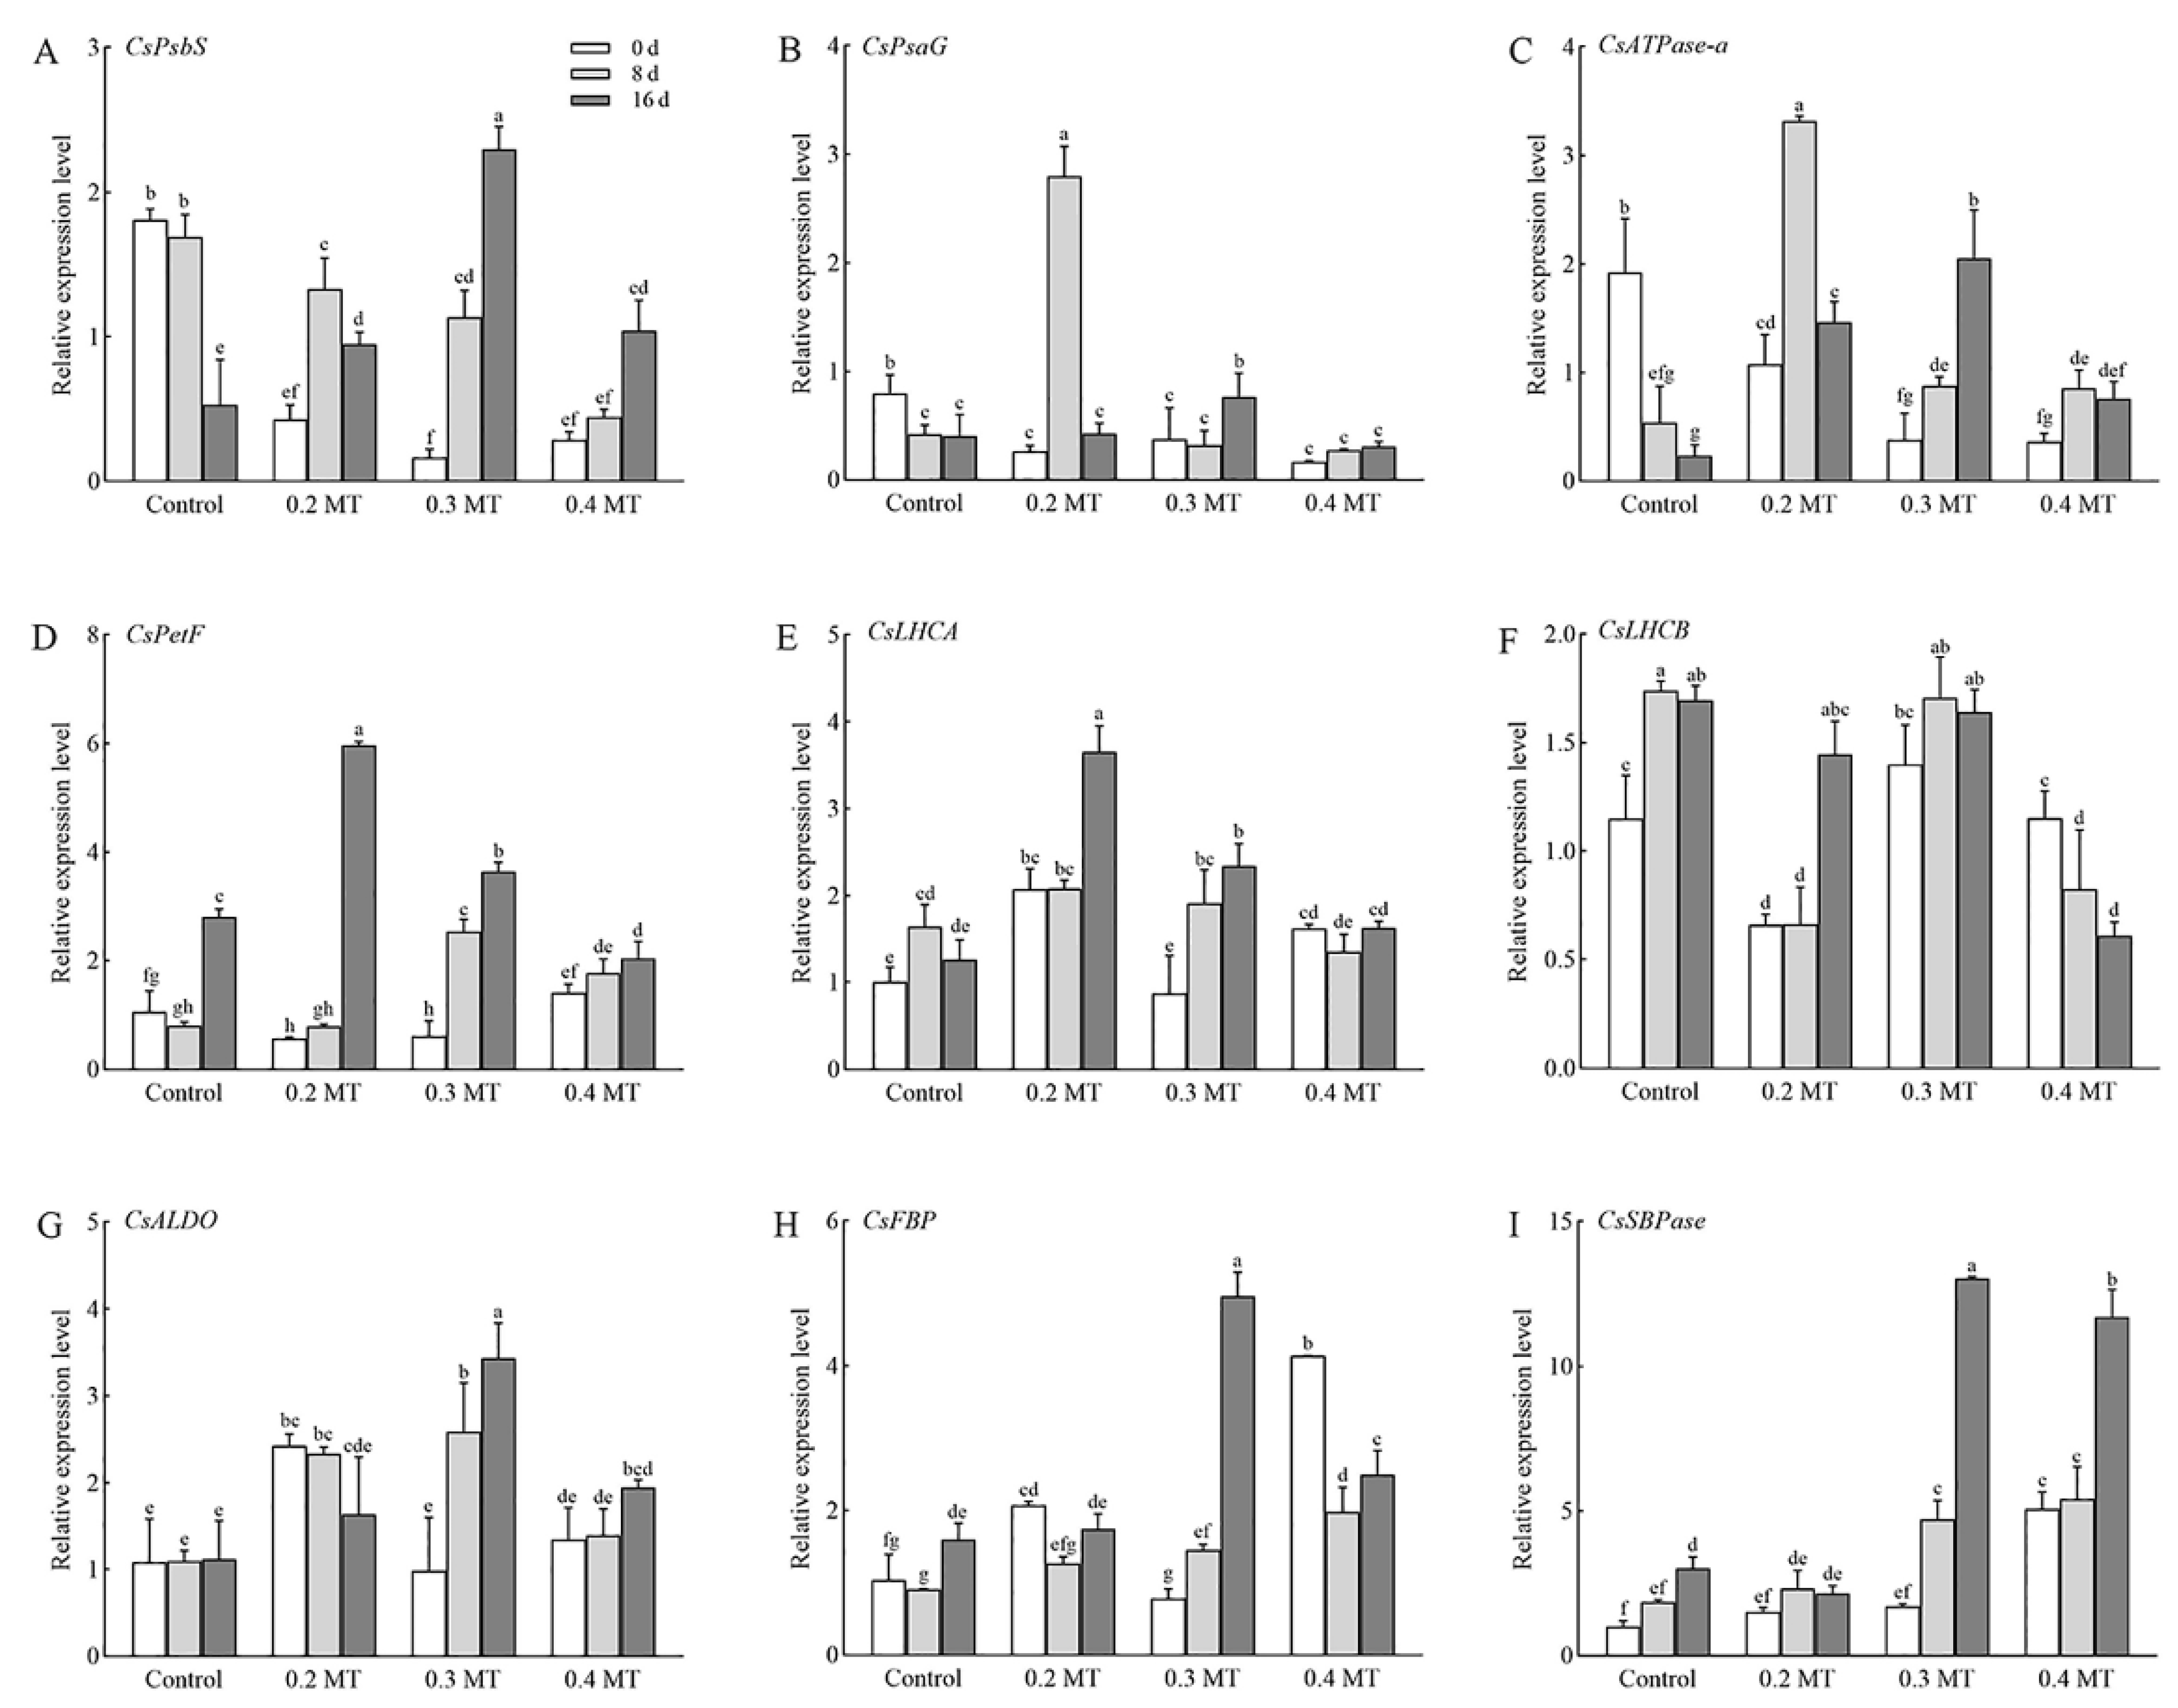
2.9. Expression Profiles of Genes Involved in Photosynthesis and Chl Metabolism in Tea Leaves under MT Treatments

To elucidate the molecular mechanism of MT in photosynthesis of tea plants, we selected the genes involved in photosynthesis and Chl metabolism, and their expression profiles were determined (Figure 8 and Figure 9). Their nucleotide sequences are listed in Supplementary Table S1. Transcription of CsPsbS (CSS0043679) showed a pattern similar to those of CsPsaG (CSS0047948) and CsATPase-a (CSS0018496) under the 0.2-mM MT treatment, which had a high expression level at day 8, and then declined at day 16 (Figure 8A–C). Additionally, MT treatment at 0.2 mM significantly increased CsPetF (CSS0040087), CsLHCA (CSS0038112), and CsLHCB (CSS0010537) expression at day 16 (Figure 8D–F). CsALDO (CSS0028383) and CsSBPase (CSS0032234) remained at a relatively stable expression (Figure 8G,I). Compared to the control, the expression of CsLHCB (CSS0010537) and CsFBP (CSS0042699) were inhibited at day 8 under the 0.2-mM MT treatment (Figure 8F,H). The genes CsPsaG (CSS0047948), CsPsbS (CSS0043679), CsATPase-a (CSS0018496), CsPetF (CSS0040087), CsALDO (CSS0028383), CsFBP (CSS0042699), and CsSBPase (CSS0032234) exposed to 0.3 mM MT were significantly upregulated over time (Figure 8A–D,G–I). The upregulation of CsLHCB (CSS0010537) of the control was inhibited by the 0.3-mM MT treatment at days 8 and 16 (Figure 8F). The expression patterns of CsPsbS (CSS0043679) under the 0.4-mM MT treatment were similar to that of CsSBPase (CSS0032234), in which the expression levels were significantly increased at day 16 in comparison with day 0 (Figure 8A,I). Treatment at 0.4 mM inhibited the downregulation of CsPsaG (CSS0047948) and CsATPase-a (CSS0018496) in comparison with control (Figure 8B,C). The transcript levels of CsLHCB (CSS0010537) and CsFBP (CSS0042699) were significantly downregulated under the 0.4-mM MT treatment (Figure 8F,H).
The gene CsCHLH (CSS0016317) showed a similar pattern under different MT concentration treatments, which was increased at day 8 and decreased at day 16 (Figure 9A). CsDVR (CSS0008645) showed a relatively stable expression in control and 0.4-mM MT treatment groups, whereas its expression obviously increased under the 0.2- and 0.3-mM MT treatments at day 16 (Figure 9B). CsCLH (CSS0004684) and CsPAO (CSS0042634) are involved in the process of Chl degradation, and were upregulated in control group at day 16 (Figure 9C,D). MT treatment at 0.2 mM inhibited the increase in CsCLH (CSS0004684) expression, and its expression was relatively stable. The transcription of CsCLH (CSS0004684) was increased under the 0.3-mM MT treatment at day 16 and 0.4-mM MT treatment at day 8, respectively (Figure 9C). CsPAO (CSS0042634) had a lower mRNA abundance under the 0.2-mM MT treatment at days 8 and 16 compared to day 0 (Figure 9D). It remained relatively stable expression under the 0.3-mM MT treatment, but 0.4 mM MT significantly downregulated the expression at day 16 (Figure 9D).

3. Discussion

Chl is one of the main pigments in leaf tissues and it is important for capturing light energy in photosynthetic organisms. A change in environmental factors will lead to a change in chlorophyll content, and then a change in photosynthetic performance [22]. Variation in Chl concentration directly affects the photosynthetic rate. Melatonin may help maintain high photosynthesizing efficiency by maintaining the integrity of chlorophyll molecules [20]. Melatonin can downregulate chlorophyll degrading enzymes in Arabidopsis and Begonia [23]. In our study, the Chl content of tea leaves in the control group decreased gradually over time, consistent with the change in the nett photosynthetic rate, which might be caused by the adaptation of tea plants to environmental changes. In addition, with the extension of time, tea plants also grew and developed. This self-physiological regulation may have led to changes in parameters in the control group. Exogenous application of MT increased Chl content (0.2 and 0.3 mM) or delayed Chl degradation (0.4 mM). This indicates that melatonin treatment is associated with enhancing chlorophyll biosynthesis and slowing chlorophyll decomposition. The reason may be that melatonin can maintain the stability of the chlorophyll structure and delay the degradation process of chlorophyll by affecting the activity of the key enzymes of chlorophyll biosynthesis and degradation. While a higher concentration (0.4 mM) delayed the degradation of chlorophyll, it may also be the self-stress caused by the high concentration of MT. This result was consistent with the findings in apple, rice, and kiwifruit [24,25,26]. The RNA-seq data also showed that 15 and 14 DEGs involved in Chl biosynthesis and cycle pathways were upregulated under the 0.2-mM MT treatment, respectively. These genes were considered as the candidate genes that regulated Chl biosynthesis in tea leaves. In addition, the expression of genes (downregulation of three CLH genes) related to the Chl degradation pathway caused Chl breakdown [27]. The pathway of Chl catabolism ‘PAO/phyllobilin’ occurs in all photosynthetic organisms [28]. MT treatment decreased or inhibited the transcription of CsCLH and CsPAO.
The change in stomatal area and density regulate photosynthetic rate and transpiration [29]. The conductance and development of the stomatal were regulated by environmental changes, such as light, CO2 concentration, and plant hormone [30]. In the study, the decrease in Pn and Gs of the control was accompanied by a decline in Ci, which indicated that the decrease in Pn was mainly due to stomatal limitation [31]. The application of 0.2 mM MT improved Pn, Gs, and Ci. Previous studies have reported the photosynthetic rate in the tea leaves is small compared to many other tropical plants, being in the range of 2~14 μmol m−2 s−1 [32]. Further, the photosynthetic rate of tea leaves is closely related to tea varieties and leaf age, which is determined by its inherent genetic characteristics. The photosynthetic rate depends strongly on environmental conditions, such as irradiance, temperature, and nutrient supply, so that the photosynthetic rate changes with time and season [33]. The photosynthetic rate of tea leaves is relatively low in autumn. Additionally, the increase in stomatal area at day 16 and decrease in stomatal density from day 8 indicated that MT improved the photosynthetic capacity of leaves through stomatal regulation. With an increase in stomatal area, the inhibition of the gas and water exchange process was weakened [34]. This regulation mechanism helped reach a proper balance between water transport and photosynthesis, which maintained a photosynthetic capacity without losing excessive moisture. The lower the stomata density, the less moisture is lost through the leaves [34]. Stomatal density was negatively correlated with stomatal area, suggesting that plants adopted an ecological equilibrium strategy at the stomatal level to adapt to environmental cues [34]. We therefore hypothesized that MT could enhance photosynthesis in tea plants by short-term regulation of Gs and long-term regulation of stomatal development.
Photosynthesis requires some major protein complexes, such as PSI, PSII, ATP synthase, etc. [35]. A total of 64 DEGs associated with these complexes were identified in our work, and 62 and 54 genes were upregulated at days 8 and 16 under the 0.2-mM MT treatment, respectively. These include genes involved in PSI(PsaG) and PSII (PsbP, PsbQ, PsbR, PsbS, PsbY, Psb27, and Psb28). PsbS proteins dissipate excess light energy by regulating non-photochemical quenching, a regulatory mechanism of reducing photoinhibition damage in plants, thereby protecting the PSII apparatus [36]. Based on the RT-qPCR, the expression level of CsPsbS decreased in the control group during treatment times, which might lead to the photoinhibition of PSII. Exogenous MT treatment at 0.2 and 0.3 mM partly protected and improved the activities of PSII by upregulating the expression of CsPsbS. The improvement in the photosynthetic electron transport process can provide NADPH and ATP for the dark reaction. PetF is an enzyme involved in the process of photosynthetic electron transport. Both the 0.2- and 0.3-mM MT treatment increased the transcription level of CsPetF. Plants develop LHC to reduce light absorption and protect PSII from excessive excitation [35]. LHC can absorb photons and transfers the energy to the center of the photosynthetic reaction to maximize the photosynthetic efficiency [37]. Compared with the control, six DEGs genes (LHCA2, two LHCA4, LHCB1, LHCB3, LHCB6) were upregulated. RT-qPCR showed MT treatment at 0.2 mM increased the expression of CsLHCA and CsLHCB, indicating that MT participated in the regulation of light energy capture. The improvement in photosynthesis-related gene expression in tea plants might be an important regulatory pathway for exogenous MT to enhance photosynthesis in tea plants.
The fluorescence level in plants is a probe of photosynthesis, which hides much important photosynthetic information [38]. qP is the fraction of open reaction centers in PSII [39]. MT application increased the qP level or alleviated the decline, which played an important role in enhancing electron transfer activity of PSII. Fv/Fm can be used to characterize the conversion efficiency of light energy in PSII reaction center, which is usually between 0.75 and 0.85. A decrease in Fv/Fm indicates PSII damage or photoinhibition [38]. It was found that ROS degrades the D1 protein of PSII center, destroys the structure of PSII, and leads to a decrease in Fv/Fm. ROS will also peroxidation with unsaturated acids (especially phospholipids) on the cell membrane to produce a large amount of MDA. MDA will further aggravate the oxidation reaction of cell biofilm and cause the destruction of biofilm structure [40,41]. A major function of melatonin may be to directly clear H2O2 and maintain it at stable levels [17]. Our results revealed that the Fv/Fm of the control was obviously reduced at day 16. The Fv/Fm level was still within the normal range, but the decrease in SOD activity and increase in MDA content manifested that the tea plants might be suffering oxidative damage at that time. The application of 0.2 mM MT significantly improved this situation. It was found that melatonin plays a role in scavenging ROS in various stress responses. Previous studies have confirmed that melatonin can enhance the activity of antioxidant enzymes and the accumulation of non-enzymatic antioxidants [42]. Similarly, in our study, 0.2 mM MT exogenous melatonin activated SOD activity and reduced the contents of H2O2 and MDA. The reason for this phenomenon may be that melatonin can improve the expression of plant antioxidant enzyme synthesis genes and enhance the ability of antioxidant protection system. SOD converts O2− into H2O2, and POD, CAT converts H2O2 into harmless H2O and O2 [43]. When the effect of high concentrations of MT is reversed, it may be related to the stress caused by high MT concentration. The contents of H2O2 and MDA in tea plants treated by MT were decreased. These results suggested that melatonin helps to reduce membrane damage caused by ROS accumulation. The reason may be that exogenous melatonin has essential groups for scavenging reactive oxygen species, and melatonin can react with free radicals of reactive oxygen species to remove ROS together with protective enzymes. Melatonin itself is an efficient oxidant. It was found that after being absorbed by tea plants, melatonin reacted directly with ROS molecules such as H2O2 in cells, so as to eliminate ROS molecules and reduce MDA production. Antioxidant enzymes are distributed in various parts of plant cells and work together to remove ROS. SOD, POD, CAT, APX are the most important antioxidant enzymes in tea plant. Through a division of labor, they can effectively decompose excess O2- into H2O2 and then into H2O [44]. Aghdam et al. found that melatonin can increase the activity of antioxidant enzymes in the leaves of Anthurium under low temperature storage, so as to reduce the contents of H2O2 and MDA [45]. The positive effect of exogenous MT on Fv/Fm, ROS scavenging and SOD activity suggested that MT might alleviate PSII inhibition and partially display direct antioxidant effect [46].
The physiological and metabolic processes in higher plants are complex. The effects of melatonin on the growth and development of tea plants need further study. With the further development of integrative omics analysis and deep genome sequencing of tea plants and other higher plants [4,47,48,49,50], new ideas and schemes will be provided for the effects of melatonin on photosynthetic characteristics and growth and development of tea plant and other higher plant.

4. Materials and Methods

4.1. Plant Materials and Exogenous Melatonin Treatments

The experiment was conducted in September 2020. Two-year-old vegetatively propagated tea plants (Camellia sinensis L. cv. ‘Zhongcha 108’) were used as experimental material. They were grown at the Tea Science Research Institute of the Nanjing Agricultural University (Nanjing, China). The cultivation substrate of the tea plants was composed of organic soil, vermiculite, and perlite (3:2:1, v/v). The tea plants were divided into four groups and sprayed with various concentrations of MT: 0 (control), 0.2, 0.3, and 0.4 mM every day, 16 times in total, 200 mL each time, and sprayed evenly on the front and back sides of the tea leaves with the sprayer. The standard was that the liquid was attached to the leaf surface but did not drip. The control group was sprayed with the same amount of distilled water. One hundred and fifty healthy tea plants were selected for each treatment. The first leaf and the second leaf of each treatment tea plants were collected at days 0, 8 and 16, respectively. Samples of each treatment were selected from 12 tea plants, mixed, and divided into three biological replicates. The harvested samples were used for physiological indicator measurement or stored at −80 ℃ for gene expression or transcriptome analysis.

4.2. Determination of Chl a, b and Total Chl Contents

Chl was extracted from the leaf samples with acetone, anhydrous ethanol, and distilled water, the volume ratio was 4.5:4.5:1.0. After removing the leaf veins, the leaves were cut into pieces, weighed at 0.1 g of tea leaves, 10 mL of extraction solution was added, and extracted in the dark for 24 h until the leaves were completely white. The mixed extract was used as a blank control, the absorbance values of each sample were measured by a microplate analyzer at 645 and 663 nm, respectively. The concentrations of Chl a, b, and total Chl were calculated according to Yang et al. [51]. Three independent biological replicates were performed for the determination of Chl a, b, and total Chl contents.

4.3. Determination of Pn, Gs, Ci, and Tr

For each treatment, nine tea plants were randomly selected and labeled, and the second leaf from the top was measured for each tea plant. The photosynthetic parameters (Pn, Gs, Ci, Tr) were determined by photosynthesis system (Li-6400, LI-COR, Inc. Lincoln, NE, USA) at days 0, 8 and 16, respectively. The determination conditions were as follows: light intensity 600 μmol·m−2·s−1, CO2 concentration 400 μmol·mol−1, leaf chamber temperature (25 ± 1) °C, relative humidity 70%~80%. Each measurement time was 9:00. The determination was repeated 3 times for each tea plant leaf.

4.4. Stoma Observation

The lower epidermis of tea leaves were stripped to observe stomatal [52] and measured by the nail polish blotting method, and the slides were observed under BX-53 fluorescence microscope (Olympus, Tokyo, Japan). Three tea plants were randomly selected from each treatment, and the second leaf was measured from each tea plant. CellSens Standard software was used to take photos and measure stomatal diameter. The calculation formula of stomata density and area referred to in Zhu et al. [34].

4.5. Measurement of Chl Fluorescence Parameters

The Chl fluorescence parameters of the tea leaf were determined by multifunctional modulation fluorescence imaging system IMAGING-PAM (IMAG-MAXI, Effeltrich, Germany). Before the measurement, the tea plants were exposed to darkness for at least 30 min, and the whole process was carried out in the dark [53]. The minimal Chl fluorescence (Fo), maximal fluorescence (Fm), and maximum photochemical quantum yield of PS II (Fv/Fm) was measured by IMAGING-PAM under dark adaptation. Subsequently, the light intensity of the photochemical stage was set as 600 μmol·m−2·s−1, and when the fluorescence was constant, intensive flash (saturated pulse light, 4000 μmol·m−2·s−1, 0.8 s) was applied. Other fluorescence parameters were obtained, such as minimal Chl fluorescence (Fo’), maximal fluorescence (Fm’), steady state fluorescence (F), photochemical quenching coefficient (qP) = (Fm’ − F)/(Fm’ − Fo’), non-photochemical quenching coefficient (qN) = (Fm − Fm’)/(Fm − Fo’), and non-photochemical quenching (NPQ) = (Fm − Fm’)/Fm’.

4.6. Determination of H2O2 and MDA Contents

Potassium iodide (KI) was used to quantify H2O2 content in accordance with the method described by Alexieva et al. [54]. Briefly, tea leaves of 0.1 g were ground in 1 mL 0.1% trichloroacetic acid (TCA) and centrifuged to obtain the supernatant for subsequent experiment. The reaction solution included 1 M KI solution, 0.1 M potassium phosphate buffer (pH 7.8) and supernatant. The control was 0.1% TCA. After reacting in darkness for 1 h, the absorbance at 390 nm was determined by a quartz plate. The H2O2 content in the sample was calculated according to the standard curve of known concentration of H2O2. Based on the principle and method mentioned by Hodges [55] and Tsikas [56], the assessment of lipid peroxidation was determined by MDA measurements. MDA is regarded as a component of thiobarbituric acid-reactive substances (TBARS). Tea leaves of 0.2 g were ground in 1 mL 5% trichloroacetic acid (TCA), and the homogenate after grinding was centrifuged at 12,000 rpm for 20 min to obtain the supernatant. Then, 1 mL supernatant and 1 mL 0.67% thiobarbituric acid (TBA) were mixed, and pre-warmed at 100 °C in a water bath for 30 min. The absorbance of supernatant was recorded at 450, 532, and 600 nm, respectively. All measurements were repeated independently three times.

4.7. Determination of Antioxidant Enzyme (SOD) Activity

Referred to the methods described by Wang et al. [24] for enzyme activity determination with slight modifications. In brief, tea leaves of 0.2 g were ground in 1 mL phosphate buffer (PBS, pH 7.8). The obtained homogenate was centrifuged, and the supernatant was the enzyme solution. The photochemical reduction of nitro blue tetrazolium (NBT) was used for the measurement of SOD activity. The total reaction system included 3 mL: 1.5 mL 50 mM phosphate buffered saline (PBS, pH 7.8), 300 μL 14.5 mM methionine, 2.25 mM NBT, 30 μM ethylenediaminetetraacetic acid disodium salt, 60 μM riboflavin each, 250 μL distilled water, 50 μL enzyme solution. PBS was used instead of enzyme solution as light control. The reaction started under the light, and it was allowed to run until the color turned purple. The absorbance of the reaction liquid at 560 nm was determined by a microplate reader. All measurements were repeated independently three times.

4.8. Transcriptome-Based Identification of Chl Biosynthesis and Photosynthesis-Related Differentially Expressed Genes (DEGs)

Our previous work had established transcriptome data at days 8 and 16 under the 0.2-mM MT treatment [57]. Herein, we screened the DEGs involved in Chl metabolism and photosynthesis. The Fragments Per Kilobase of exon model per million mapped fragments (FPKM) method was used to transform the gene expression in each sample, and the heat map was drawn to visualize the expression level by TBtools software (Guangzhou, China) [58].

4.9. RNA Isolation and Gene Expression Analysis

Total RNA was extracted from tea plant samples. First-strand cDNA was synthesized from the isolated total RNA with a Prime Script RT reagent kit (TaKaRa, Beijing, China) as instructed by the manufacturer. The quantitative real-time reverse transcription–polymerase chain reaction (RT-qPCR) was performed with Hieff qPCR SYBR Green Master Mix (Yeasen, Shanghai, China) on CFX96 Real-Time System (Bio-Rad, Hercules, CA, USA). Specific primers (Table 3) used for RT-qPCR assays were designed by Primer Premier 5.0 software (Vancouver, BC, Canada). CsACT7 acted as an internal control gene [57,59]. The reaction mixture contained 1 μL of each primer, 10 μL of enzyme, 1 μL of diluted cDNA and 7 μL of double-distilled water. The reaction conditions were set as follows: 95 °C for 30 s, followed by 40 cycles of denaturation at 95 °C for 5 s, and 55 °C for 25 s. Relative gene expression was calculated following the 2−∆∆CT method based on Pfaffl [60] mentioning. Total RNA isolated in tea leaves were repeated independent at least three times.

4.10. Statistical Analysis
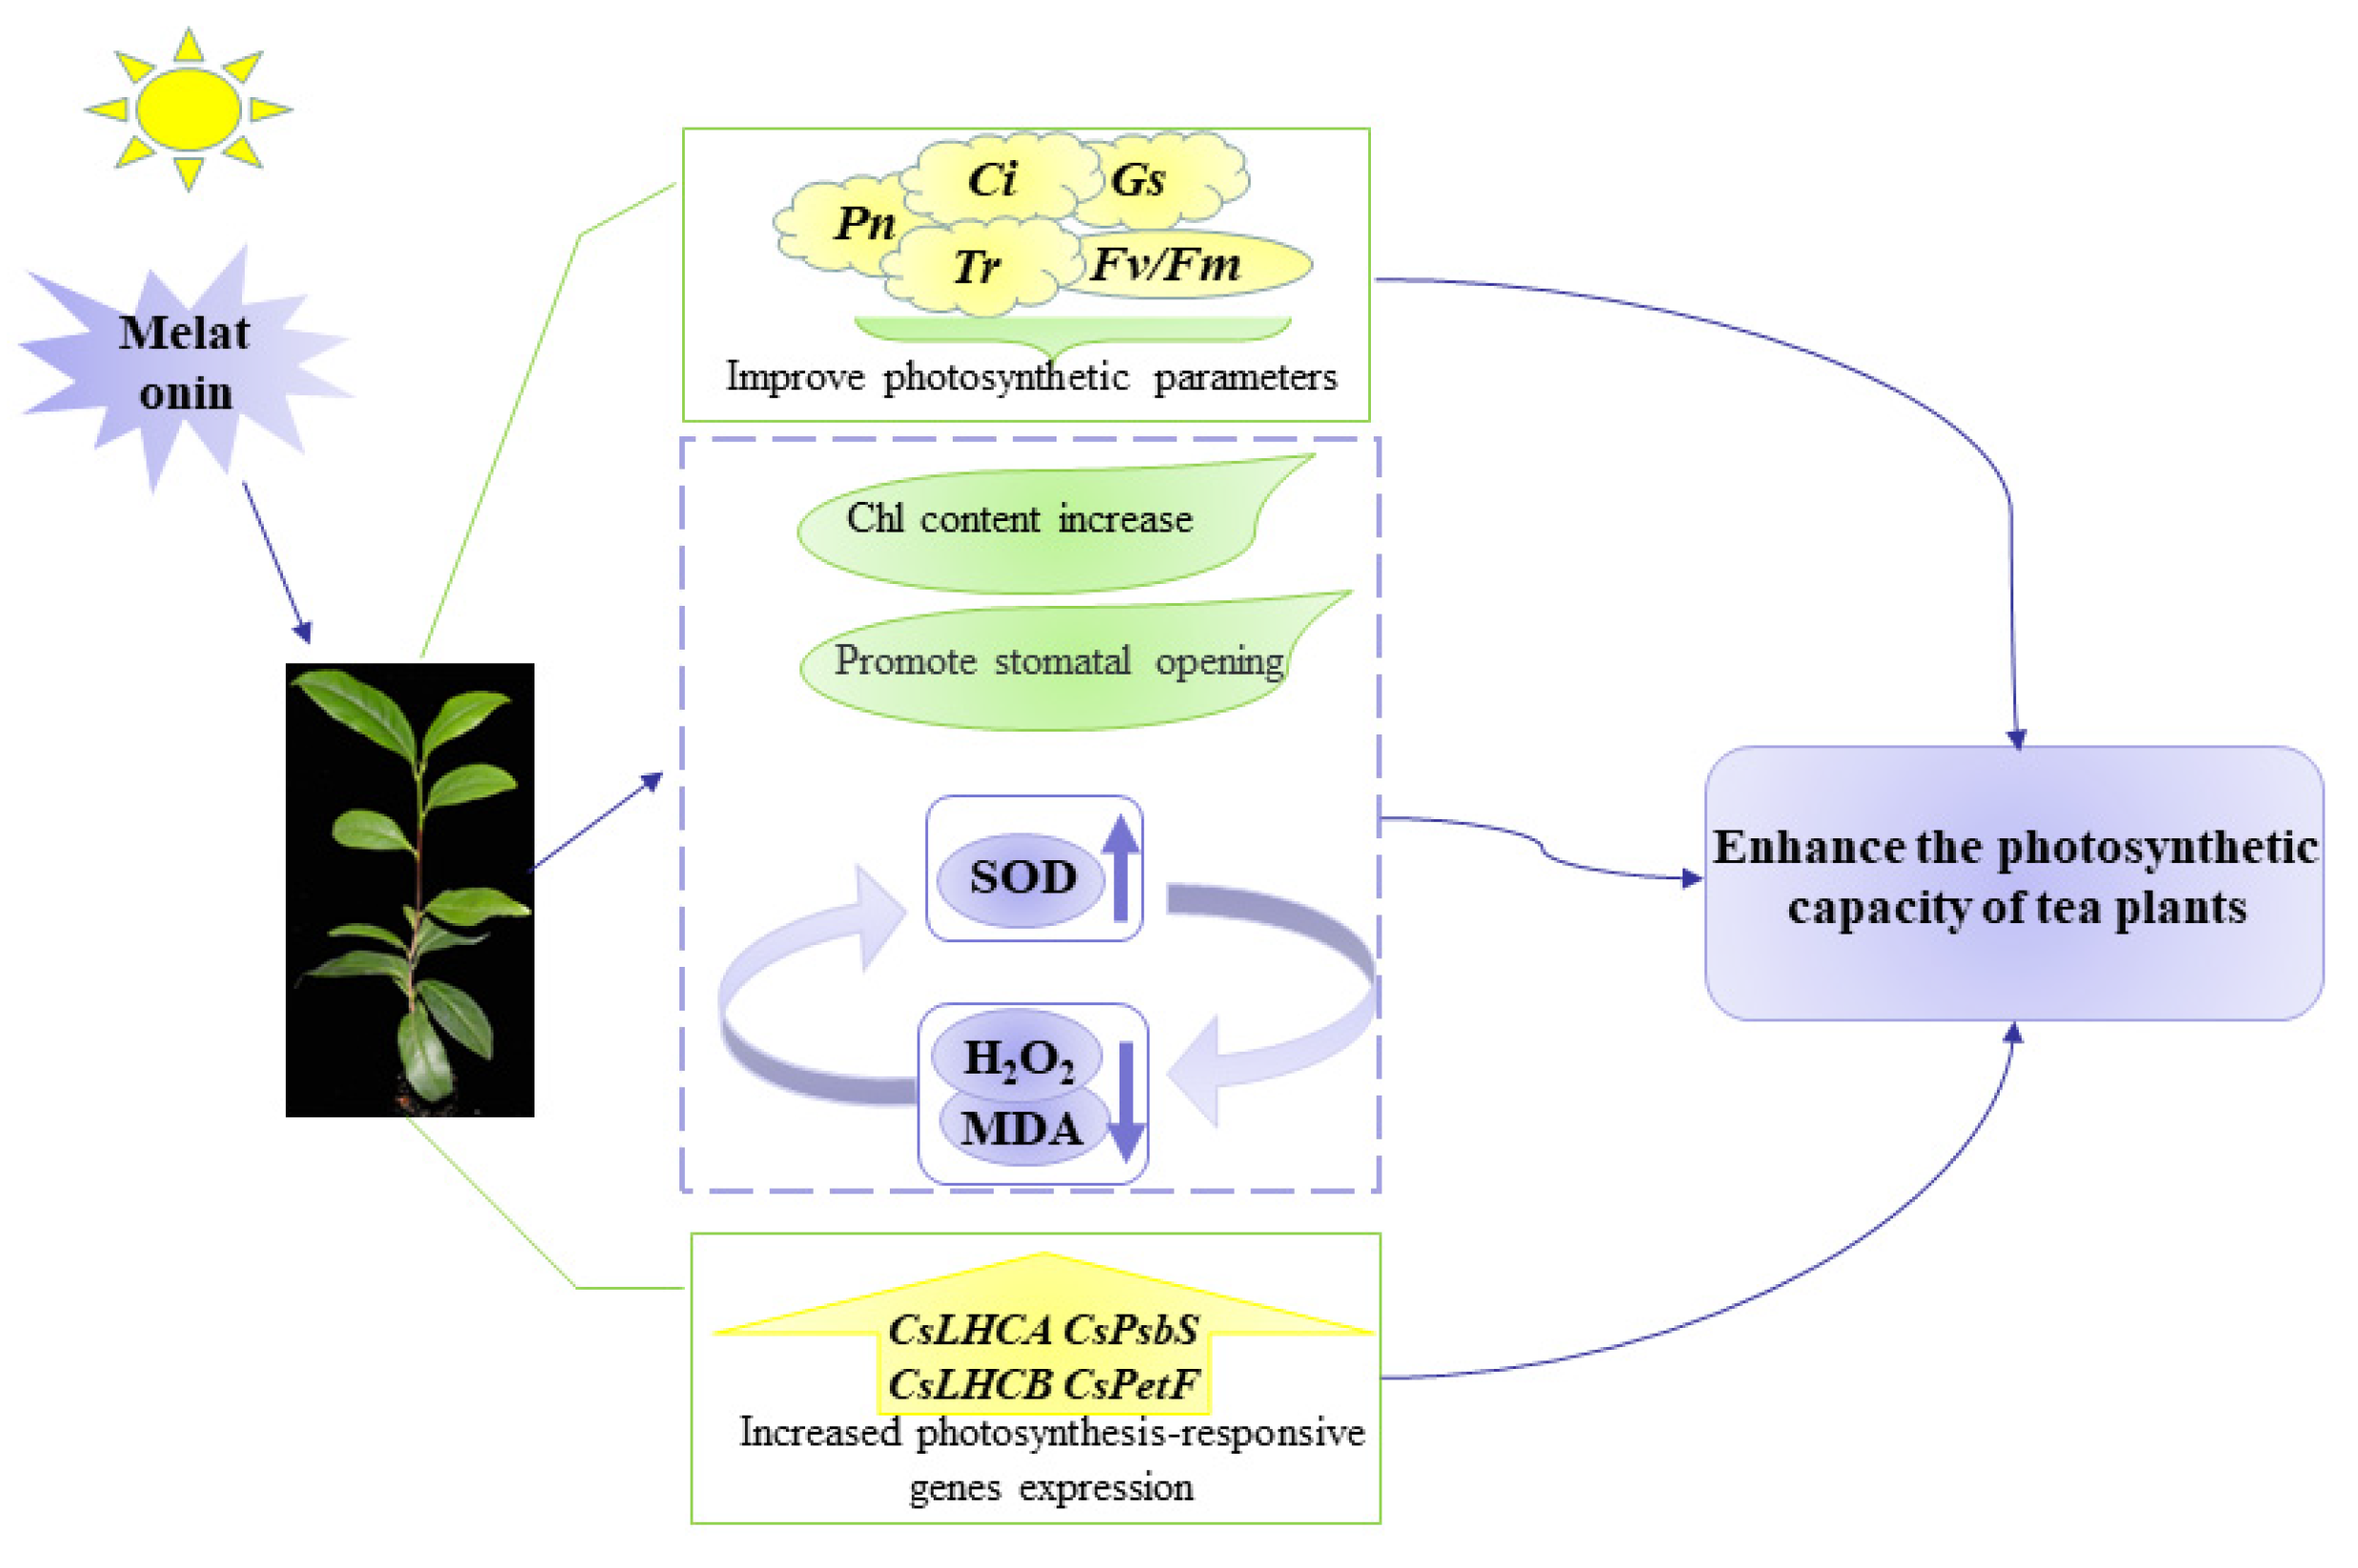
All statistical analysis was conducted using SPSS 25 software (Chicago, IL, USA). Each value was expressed as the mean ± standard deviation (SD). Variance (ANOVA) was used to perform data analysis, and significant differences were detected by Duncan’s multiple range tests at a probability level of 0.05. GraphPad Prism 8.0 software (San Diego, CA, USA) was used to plot charts.

5. Conclusions

A possible mode network model based on the current study is shown in Figure 10. The application of 0.2 mM MT increased Chl contents and improved Pn, Gs, Ci, and Tr in tea leaves. Under MT treatment, the chlorophyll fluorescence level and SOD activity of tea plants were increased, and the contents of H2O2 and MDA were inhibited, indicating that exogenous MT participated in the regulation of photochemical efficiency of PSII. Transcriptome data based on RNA-seq and gene validation measured by RT-qPCR showed that MT could regulate the gene expression involved in photosynthesis and Chl metabolism. In general, our findings provide a reference for further exploring the role of MT in photosynthetic capacity of tea plants.

Supplementary Materials

The following supporting information can be downloaded at: https://www.mdpi.com/article/10.3390/ijms23126694/s1.

Author Contributions

Conceptualization, J.Z., N.Y. and M.-H.H.; methodology, N.Y., M.-H.H. and R.-M.T.; investigation, N.Y., M.-H.H., R.-M.T., Y.-Z.Y., Y.-H.W. and A.-S.X.; data curation, M.-H.H. and N.Y.; writing—original draft preparation, N.Y. and M.-H.H.; writing—review and editing, N.Y. and J.Z. All authors have read and agreed to the published version of the manuscript.

Funding

This study was financed by the Jiangsu Agriculture Science and Technology Innovation Fund (JASTIF, CX (20)3114), National Natural Science Foundation of China (31870681), and Priority Academic Program Development of Jiangsu Higher Education Institutions Project (PAPD).

Institutional Review Board Statement

Not applicable.

Informed Consent Statement

Not applicable.

Data Availability Statement

In this section, transcriptional data, physiological and anatomic metabolic data were measured by the authors themselves.

Conflicts of Interest

The authors declare no conflict of interest.

References

  1. Xia, E.H.; Zhang, H.B.; Sheng, J.; Li, K.; Zhang, Q.J.; Kim, C.; Zhang, Y.; Liu, Y.; Zhu, T.; Li, W.; et al. The tea tree genome provides insights into tea flavor and independent evolution of caffeine biosynthesis. Mol. Plant 2017, 10, 866–877. [Google Scholar] [CrossRef] [PubMed] [Green Version]
  2. Li, H.; Liu, H.; Wang, Y.; Teng, R.M.; Liu, J.X.; Lin, S.J.; Zhuang, J. Cytosolic ascorbate peroxidase 1 modulates ascorbic acid metabolism through cooperating with nitrogen regulatory protein P-II in tea plant under nitrogen deficiency stress. Genomics 2020, 112, 3497–3503. [Google Scholar] [CrossRef] [PubMed]
  3. Li, H.; Liu, Z.W.; Wu, Z.J.; Wang, X.Y.; Teng, R.M.; Zhuang, J. Differentially expressed protein and gene analysis revealed the effects of temperature on changes in ascorbic acid metabolism in harvested tea leaves. Hortic. Res. 2018, 5, 65. [Google Scholar] [CrossRef] [PubMed] [Green Version]
  4. Liu, Z.W.; Li, H.; Liu, J.X.; Wang, Y.; Zhuang, J. Integrative transcriptome, proteome, and microRNA analysis reveals the effects of nitrogen sufficiency and deficiency conditions on theanine metabolism in the tea plant (Camellia sinensis). Hortic. Res. 2020, 7, 65. [Google Scholar] [CrossRef]
  5. Verma, N.; Shukla, S. Impact of various factors responsible for fluctuation in plant secondary metabolites. J. Appl. Res. Med. Aroma. 2015, 2, 105–113. [Google Scholar] [CrossRef]
  6. Zhang, Z.X.; Hu, Q.; Liu, Y.N.; Cheng, P.L.; Cheng, H.; Liu, W.X.; Xing, X.J.; Guan, Z.Y.; Fang, W.M.; Chen, S.M.; et al. Strigolactone represses the synthesis of melatonin, thereby inducing floral transition in Arabidopsis thaliana in an FLC-dependent manner. J. Pineal Res. 2019, 67, e12582. [Google Scholar] [CrossRef]
  7. Posch, B.C.; Kariyawasam, B.C.; Helen, B.; Onoriode, C.; Richards, R.A.; Reynolds, M.P.; Richard, T.; Atkin, O.K. Exploring high temperature responses of photosynthesis and respiration to improve heat tolerance in wheat. J. Exp. Bot. 2019, 70, 5051–5069. [Google Scholar] [CrossRef]
  8. Heyneke, E.; Fernie, A.R. Metabolic regulation of photosynthesis. Biochem. Soc. Trans. 2018, 46, 321–328. [Google Scholar] [CrossRef]
  9. Parry, M.A.J.; Reynolds, M.; Salvucci, M.E.; Raines, C.; Andralojc, P.J.; Zhu, X.G.; Price, G.D.; Condon, A.G.; Furbank, R.T. Raising yield potential of wheat. II. Increasing photosynthetic capacity and efficiency. J. Exp. Bot. 2011, 62, 453–467. [Google Scholar] [CrossRef]
  10. Dubbels, R.; Reiter, R.J.; Klenke, E.; Goebel, A.; Schnakenberg, E.; Ehlers, C.; Schiwara, H.W.; Schloot, W. Melatonin in edible plants identified by radioimmunoassay and by high performance liquid chromatography-mass spectrometry. J. Pineal Res. 1995, 18, 28–31. [Google Scholar] [CrossRef]
  11. Kolář, J.; Johnson, C.H.; Macháčková, I. Exogenously applied melatonin (N-acetyl-5-methoxytryptamine) affects flowering of the short-day plant Chenopodium rubrum. Acta Physiol. Plant. 2003, 118, 605–612. [Google Scholar] [CrossRef] [Green Version]
  12. Wei, W.; Li, Q.T.; Chu, Y.N.; Reiter, R.J.; Yu, X.M.; Zhu, D.H.; Zhang, W.K.; Ma, B.; Lin, Q.; Zhang, J.S.; et al. Melatonin enhances plant growth and abiotic stress tolerance in soybean plants. J. Exp. Bot. 2015, 66, 695–707. [Google Scholar] [CrossRef] [Green Version]
  13. Debnath, B.; Islam, W.; Li, M.; Sun, Y.T.; Lu, X.C.; Mitra, S.; Hussain, M.; Liu, S.; Qiu, D.L. Melatonin mediates enhancement of stress tolerance in plants. Int. J. Mol. Sci. 2019, 20, 1040. [Google Scholar] [CrossRef] [Green Version]
  14. Park, S.; Lee, D.E.; Jang, H.; Byeon, Y.; Kim, Y.S.; Back, K. Melatonin-rich transgenic rice plants exhibit resistance to herbicide-induced oxidative stress. J. Pineal Res. 2013, 54, 258–263. [Google Scholar] [CrossRef]
  15. Gao, W.Y.; Zhang, Y.J.; Feng, Z.; Bai, Q.Q.; He, J.J.; Wang, Y.J. Effects of melatonin on antioxidant capacity in naked oat seedlings under drought stress. Molecules 2018, 23, 1580. [Google Scholar] [CrossRef] [Green Version]
  16. Bajwa, V.S.; Shukla, M.R.; Sherif, S.M.; Murch, S.J.; Saxena, P.K. Role of melatonin in alleviating cold stress in Arabidopsis thaliana. J. Pineal Res. 2014, 56, 238–245. [Google Scholar] [CrossRef]
  17. Wang, L.Y.; Liu, J.L.; Wang, W.X.; Sun, Y. Exogenous melatonin improves growth and photosynthetic capacity of cucumber under salinity-induced stress. Photosynthetica 2016, 54, 19–27. [Google Scholar] [CrossRef]
  18. Zhang, Y.P.; Yang, S.J.; Chen, Y.Y. Effects of melatonin on photosynthetic performance and antioxidants in melon during cold and recovery. Biol. Plant. 2017, 61, 571–578. [Google Scholar] [CrossRef]
  19. Sharma, A.; Wang, J.F.; Xu, D.B.; Tao, S.C.; Chong, S.L.; Yan, D.L.; Li, Z.; Yuan, H.W.; Zheng, B.S. Melatonin regulates the functional components of photosynthesis, antioxidant system, gene expression, and metabolic pathways to induce drought resistance in grafted Carya cathayensis plants. Sci. Total Environ. 2020, 713, 136675. [Google Scholar] [CrossRef]
  20. Wang, P.; Yin, L.H.; Liang, D.; Li, C.; Ma, F.W.; Yue, Z.Y. Delayed senescence of apple leaves by exogenous melatonin treatment: Toward regulating the ascorbate-glutathione cycle. J. Pineal Res. 2012, 53, 11–20. [Google Scholar] [CrossRef]
  21. Lazar, D.; Murch, S.J.; Beilby, M.J.; Khazaaly, S.A.l. Exogenous melatonin affects photosynthesis in characeae Chara australis. Plant Signal. Behav. 2013, 8, 23279. [Google Scholar] [CrossRef] [Green Version]
  22. Wang, L.; Yue, C.; Cao, H.L.; Zhou, Y.H.; Zeng, J.M.; Yang, Y.J.; Wang, X.C. Biochemical and transcriptome analyses of a novel chlorophyll-deficient chlorina tea plant cultivar. BMC Plant Biol. 2014, 14, 352. [Google Scholar] [CrossRef] [Green Version]
  23. Mir, A.R.; Faizan, M.; Bajguz, A.; Sami, F.; Siddiqui, H.; Hayat, S. Occurrence and biosynthesis of melatonin and its exogenous effect on plants. Acta Soc. Bot. Pol. 2020, 89, 1–23. [Google Scholar] [CrossRef]
  24. Wang, Y.C.; Gao, C.Q.; Liang, Y.N.; Wang, C.; Yang, C.P.; Liu, G.F. A novel bZIP gene from Tamarix hispida mediates physiological responses to salt stress in tobacco plants. J. Plant Physiol. 2010, 167, 222–230. [Google Scholar] [CrossRef]
  25. Liang, C.Z.; Zheng, G.Y.; Li, W.Z.; Wang, Y.Q.; Hu, B.; Wang, H.R.; Wu, H.K.; Qian, Y.W.; Zhu, X.G.; Tan, D.X.; et al. Melatonin delays leaf senescence and enhances salt stress tolerance in rice. J. Pineal Res. 2015, 59, 91–101. [Google Scholar] [CrossRef]
  26. Wang, P.; Sun, X.; Li, C.; Wei, Z.W.; Liang, D.; Ma, F.W. Long-term exogenous application of melatonin delays drought-induced leaf senescence in apple. J. Pineal Res. 2013, 54, 292–302. [Google Scholar] [CrossRef]
  27. Kuai, B.K.; Chen, J.Y.; Hrtensteiner, S. The biochemistry and molecular biology of chlorophyll breakdown. Environ. Exp. Bot. 2018, 69, 751–767. [Google Scholar] [CrossRef]
  28. Roca, M.; Pérez-Gálvez, A. Profile of chlorophyll catabolites in senescent leaves of epipremnun aureum includes a catabolite esterified with hydroxytyrosol 1- O -Glucoside. J. Nat. Prod. 2020, 83, 873–880. [Google Scholar] [CrossRef] [PubMed]
  29. Nilson, S.E.; Assmann, S.M. The control of transpiration. insights from Arabidopsis. Plant Physiol. 2007, 143, 19–27. [Google Scholar] [CrossRef] [PubMed] [Green Version]
  30. Yun, S.C.; Laurence, J.A. The response of clones of populus tremuloides differing in sensitivity to ozone in the field. New Phytol. 1999, 141, 411–421. [Google Scholar] [CrossRef]
  31. Flexas, J.; Medrano, H. Drought-inhibition of photosynthesis in C3 plants: Stomatal and non-stomatal limitations revisited. Ann. Bot. 2002, 89, 183–189. [Google Scholar] [CrossRef] [Green Version]
  32. Mohotti, A.J.; Lawlor, D.W. Diurnal variation of photosynthesis and photoinhibition in tea: Effects of irradiance and nitrogen supply during growth in the field. J. Exp. Bot. 2002, 53, 313–322. [Google Scholar] [CrossRef]
  33. Lawlor, D.W. Photosynthesis, productivity and environment. J. Exp. Bot. 1995, 46, 1449–1461. [Google Scholar] [CrossRef]
  34. Zhu, J.Y.; Yu, Q.; Xu, C.Y.; Li, J.H.; Qin, G.M. Rapid estimation of stomatal density and stomatal area of plant leaves based on object-oriented classification and its ecological trade-off strategy analysis. Forests 2018, 9, 616. [Google Scholar] [CrossRef] [Green Version]
  35. Shen, J.Z.; Zhang, D.Y.; Zhou, L.; Zhang, X.Z.; Liao, J.R.; Duan, Y.; Wen, B.; Ma, Y.C.; Wang, Y.H.; Fang, W.P.; et al. Transcriptomic and metabolomic profiling of Camellia sinensis L. cv. ‘Suchazao’ exposed to temperature stresses reveals modification in protein synthesis and photosynthetic and anthocyanin biosynthetic pathways. Tree Physiol. 2019, 39, 1583–1599. [Google Scholar] [CrossRef]
  36. Roach, T.; Krieger-Liszkay, A. The role of the PsbS protein in the protection of photosystems I and II against high light in Arabidopsis thaliana. BBA Bioenerg. 2012, 1817, 2158–2165. [Google Scholar] [CrossRef] [Green Version]
  37. Palm, D.M.; Agostini, A.; Averesch, V.; Girr, P.; Werwie, M.; Takahashi, S.; Satoh, H.; Jaenicke, E.; Paulsen, H. Chlorophyll a/b binding-specificity in water-soluble chlorophyll protein. Nat. Plants 2018, 4, 920–929. [Google Scholar] [CrossRef]
  38. Baker, N.R. Chlorophyll fluorescence: A probe of photosynthesis in vivo. Annu. Rev. Plant Biol. 2008, 59, 89–113. [Google Scholar] [CrossRef] [Green Version]
  39. Liang, D.; Ni, Z.Y.; Xia, H.; Xie, Y.; Lv, X.L.; Wang, J.; Lin, L.J.; Deng, Q.X.; Luo, X. Exogenous melatonin promotes biomass accumulation and photosynthesis of kiwifruit seedlings under drought stress. Sci. Hortic. 2019, 246, 34–43. [Google Scholar] [CrossRef]
  40. Wu, S.Q.; Wang, Y.; Zhang, J.K.; Gong, X.J.; Zhang, Z.; Sun, J.J.; Chen, X.S.; Wang, Y.L. Exogenous melatonin improves physiological characteristics and promotes growth of strawberry seedlings under cadmium stress. Hortic. Plant J. 2020, 7, 13–22. [Google Scholar] [CrossRef]
  41. Zhuang, K.Y.; Kong, F.Y.; Zhang, S.; Meng, C.; Yang, M.M.; Liu, Z.B.; Wang, Y.; Ma, N.; Meng, Q.W. Whirly1 enhances tolerance to chilling stress in tomato via protection of photosystem II and regulation of starch degradation. New Phytol. 2019, 221, 1998–2012. [Google Scholar] [CrossRef]
  42. Fan, J.B.; Hu, Z.R.; Xie, Y.; Chan, Z.L.; Chen, K.; Amombo, E.; Chen, L.; Fu, J.M. Alleviation of cold damage to photosystem II and metabolisms by melatonin in Bermudagrass. Front. Plant Sci. 2014, 6, 925. [Google Scholar] [CrossRef] [Green Version]
  43. Aghdam, M.S.; Moradi, M.; Razavi, F.; Rabiei, V. Exogenous phenylalanine application promotes chilling tolerance in tomato fruits during cold storage by ensuring supply of NADPH for activation of ROS scavenging systems. Sci. Hortic. 2019, 246, 818–825. [Google Scholar] [CrossRef]
  44. Haskirli, H.; Ylmaz, O.; Ozgur, R.; Uzilday, B.; Turkan, I. Melatonin mitigates UV-B stress via regulating oxidative stress response, cellular redox and alternative electron sinks in Arabidopsis thaliana. Phytochemistry 2020, 182, 112592. [Google Scholar] [CrossRef]
  45. Aghdam, M.S.; Jannatizadeh, A.; Nojadeh, M.S.; Ebrahimzadeh, A. Exogenous melatonin ameliorates chilling injury in cut anthurium flowers during low temperature storage. Postharvest Biol. Technol. 2019, 148, 184–191. [Google Scholar] [CrossRef]
  46. Li, X.; Wei, J.P.; Scott, E.R.; Liu, J.W.; Guo, S.; Li, Y.; Zhang, L.; Han, W.Y. Exogenous melatonin alleviates cold stress by promoting antioxidant defense and redox homeostasis in Camellia sinensis L. Molecules 2018, 23, 165. [Google Scholar] [CrossRef] [PubMed] [Green Version]
  47. Wang, X.C.; Feng, H.; Chang, Y.X.; Ma, C.L.; Wang, L.Y.; Hao, X.Y.; Li, A.L.; Cheng, H.; Wang, L.; Cui, P.; et al. Population sequencing enhances understanding of tea plant evolution. Nat. Commun. 2020, 11, 4447. [Google Scholar] [CrossRef] [PubMed]
  48. Li, M.Y.; Feng, K.; Hou, X.L.; Jiang, Q.; Xu, Z.S.; Wang, G.L.; Liu, J.X.; Wang, F.; Xiong, A.S. The genome sequence of celery (Apium graveolens L.), an important leaf vegetable crop rich in apigenin in the Apiaceae family. Hortic. Res. 2020, 7, 9. [Google Scholar] [CrossRef] [PubMed] [Green Version]
  49. Xia, E.H.; Li, F.D.; Tong, W.; Li, P.H.; Wu, Q.; Zhao, H.J.; Ge, R.H.; Li, R.P.; Li, Y.Y.; Zhang, Z.Z.; et al. Tea Plant Information Archive: A comprehensive genomics and bioinformatics platform for tea plant. Plant Biotechnol. J. 2019, 17, 1938–1953. [Google Scholar] [CrossRef]
  50. Liu, J.X.; Jiang, Q.; Tao, J.P.; Feng, K.; Li, T.; Duan, A.Q.; Wang, H.; Xu, Z.S.; Liu, H.; Xiong, A.S. Integrative genome, transcriptome, microRNA, and degradome analysis of water dropwort (Oenanthe javanica) in response to water stress. Hortic. Res. 2021, 8, 262. [Google Scholar] [CrossRef]
  51. Yang, N.; Wan, Q.W.; Li, Y.M.; Han, M.H.; Teng, R.M.; Liu, J.X.; Zhuang, J. Effects of exogenous spermidine on photosynthetic characteristics and gene expression of key enzymes under salt stress in tea plant. Acta Hortic. Sinica 2022, 49, 378–394. [Google Scholar]
  52. Li, T.; Huang, Y.; Khadr, A.; Wang, Y.H.; Xu, Z.S.; Xiong, A.S. DcDREB1A, a DREB-binding transcription factor from Daucus carota, enhances drought tolerance in transgenic Arabidopsis thaliana and modulates lignin levels by regulating lignin-biosynthesis-related genes. Environ. Exp. Bot. 2020, 169, 103896. [Google Scholar] [CrossRef]
  53. Li, J.H.; Yang, Y.Q.; Sun, K.; Chen, Y.; Chen, X.; Li, X.H. Exogenous melatonin enhances cold, salt and drought stress tolerance by improving antioxidant defense in tea plant [Camellia sinensis (L.) O. Kuntze]. Molecules 2019, 24, 1826. [Google Scholar] [CrossRef] [Green Version]
  54. Alexieva, V.; Sergiev, I.; Mapelli, S.; Karanov, E. The effect of drought and ultraviolet radiation on growth and stress markers in pea and wheat. Plant Cell Environ. 2001, 24, 1337–1344. [Google Scholar] [CrossRef]
  55. Hodges, D.M.; DeLong, J.M.; Forney, C.F.; Prange, R.K. Improving the thiobarbituric acid-reactive-substances assay for estimating lipid peroxidation in plant tissues containing anthocyanin and other interfering compounds. Planta 1999, 207, 604–611. [Google Scholar] [CrossRef]
  56. Tsikas, D. Assessment of lipid peroxidation by measuring malondialdehyde (MDA) and relatives in biological samples: Analytical and biological challenges. Anal. Biochem. 2017, 524, 13–30. [Google Scholar] [CrossRef]
  57. Han, M.H.; Yang, N.; Wan, Q.W.; Teng, R.M.; Duan, A.Q.; Wang, Y.H.; Zhuang, J. Exogenous melatonin positively regulates lignin biosynthesis in Camellia sinensis. Int. J. Biol. Macromol. 2021, 179, 485–499. [Google Scholar] [CrossRef]
  58. Chen, C.J.; Chen, H.; Zhang, Y.; Thomas, H.R.; Frank, M.H.; He, Y.H.; Xia, R. TBtools: An integrative toolkit developed for interactive analyses of big biological data. Mol. Plant 2020, 13, 1194–1202. [Google Scholar] [CrossRef]
  59. Wu, Z.J.; Tian, C.; Jiang, Q.; Li, X.H.; Zhuang, J. Selection of suitable reference genes for qRT-PCR normalization during leaf development and hormonal stimuli in tea plant (Camellia sinensis). Sci. Rep. 2016, 6, 19748. [Google Scholar] [CrossRef] [Green Version]
  60. Pfaffl, M.W. A new mathematical model for relative quantification in real-time RT-PCR. Nucleic Acids Res. 2001, 29, e45. [Google Scholar] [CrossRef]
Figure 1. Effect of exogenous MT on Pn (A), Gs (B), Ci (C), and Tr (D). The tea plants were exposed to control, 0.2 mM melatonin (0.2 MT), 0.3 mM melatonin (0.3 MT), and 0.4 mM melatonin (0.4 MT). Data are shown as means ± SD in three independent replicates. Different superscript letters indicate significant differences between different treatments at p < 0.05 level.
Ijms 23 06694 g001
Figure 2. Effect of exogenous MT on stomatal morphology (A) stomatal area (B), and density (C). A, B, C, and D represent control group, 0.2 mM MT, 0.3 mM MT, and 0.4 mM MT treatment groups, respectively. A1, A2, and A3 represent control treatment at days 0, 8, and 16, respectively. The rest can be done in the same manner. Scale bars = 20 μm. Data are shown as means ± SD in three independent replicates. Different superscript letters indicate significant differences between different treatments at p < 0.05 level.
Ijms 23 06694 g002
Figure 3. Effect of exogenous MT on Chl fluorescence quenching coefficients. (A) Photochemical quenching coefficient (qP): the share of light energy absorbed by PSII antenna pigment used for photochemical electron transfer, reflecting the level of plant photosynthesis. (B) Non-photochemical quenching coefficient (qN) and (C) Non-photochemical quenching (NPQ): the thermal dissipation of excitation energy by PSII antenna pigment system, reflecting the thermal dissipation level of non-photochemical process. The difference between the two is that NPQ characterizes qN, and different calculation methods. Data are shown as means ± SD in three independent replicates. Different superscript letters indicate significant differences between different treatments at p < 0.05 level.
Ijms 23 06694 g003
Figure 4. Effect of exogenous MT on ETR. The tea plants were exposed to control (A), 0.2 mM MT (B), 0.3 mM MT (C), and 0.4 mM MT (D).
Ijms 23 06694 g004
Figure 5. Effect of applied MT on H2O2 (A) and MDA (B) contents and SOD (C) activity. Data are shown as means ± SD in three independent replicates. Different superscript letters indicate significant differences between different treatments at p < 0.05 level.
Ijms 23 06694 g005
Figure 6. Heatmap of expression levels of photosynthesis related genes identified in DEGs. Blue and red represent low and high expression, respectively. (A) Photosystem II; (B) F-type ATPase; (C) Photosystem I; (D) Photosynthetic electron transport; (E) Photosynthesis-antenna protein; (F) Carbon fixation.
Ijms 23 06694 g006
Figure 7. Chl metabolic pathway and heatmap of expression levels of Chl metabolism related genes identified in DEGs. (A) Chlorophyll Biosynthesis; (B) Chlorophyll Cycle; (C) Chlorophyll Degradation. Blue and red represent low and high expression, respectively. The different vertical columns represent different treatments, from left to right: CK1, MT1, CK2, and MT2.
Ijms 23 06694 g007
Figure 8. Expression validation based on RT-qPCR genes related to photosynthesis. (A) CsPsbS; (B) CsPsaG; (C) CsATPase-a; (D) CsPetF; (E) CsLHCA; (F) CsLHCB; (G) CsALDO; (H) CsFBP; (I) CsSBPase. Data are shown as means ± SD in three independent replicates. Different superscript letters indicate significant differences between different treatments at p < 0.05 level.
Ijms 23 06694 g008
Figure 9. Expression validation based on RT-qPCR of genes involved in Chl metabolism. (A) CsCHLH; (B) CsDVR; (C) CsCLH; (D) CsPAO. Data are shown as means ± SD in three independent replicates. Different superscript letters indicate significant differences between different treatments at p < 0.05 level.
Ijms 23 06694 g009
Figure 10. Possible mode of exogenous melatonin enhancing photosynthetic capacity of tea plants.
Ijms 23 06694 g010
Table 1. Effect of exogenous melatonin on chlorophyll a, b, and total chlorophyll contents in tea leaves.
TreatmentsChl a Content (mg/g FW)Chl b Content (mg/g FW)Total Chl Content (mg/g FW)
Day 0Day 8Day 16Day 0Day 8Day 16Day 0Day 8Day 16
Control1.073 ± 0.008 b0.967 ± 0.020 d0.975 ± 0.042 d0.593 ± 0.004 c0.497 ± 0.004 f0.427 ± 0.005 g1.667 ± 0.001 b1.464 ± 0.018 f1.403 ± 0.046 g
0.2 MT0.980 ± 0.031 d1.072 ± 0.001 b1.115 ± 0.013 a0.388 ± 0.006 g0.550 ± 0.036 de0.718 ± 0.012 a1.368 ± 0.026 gh1.621 ± 0.035 c1.832 ± 0.025 a
0.3 MT1.037 ± 0.002 c0.867 ± 0.007 e1.089 ± 0.010 ab0.477 ± 0.009 f0.473 ± 0.013 f0.718 ± 0.012 a1.515 ± 0.007 e1.340 ± 0.006 h1.807 ± 0.002 a
0.4 MT1.099 ± 0.006 ab1.017 ± 0.005 c0.896 ± 0.009 e0.532 ± 0.011 e0.562 ± 0.007 d0.680 ± 0.016 b1.631 ± 0.004 bc1.579 ± 0.001 d1.576 ± 0.011 d
Data are shown as means ± standard deviation (SD) in three independent replicates. Different superscript letters indicate significant differences between different treatments at p < 0.05 level.
Table 2. Effect of exogenous melatonin on Fo, Fm, and Fv/Fm in tea leaves.
TreatmentsFoFmFv/Fm
Day 0Day 8Day 16Day 0Day 8Day 16Day 0Day 8Day 16
Control0.109 ± 0.005 e0.141 ± 0.011 a0.142 ± 0.005 a0.516 ± 0.020 e0.688 ± 0.043 a0.629 ± 0.034 b0.789 ± 0.002 ab0.795 ± 0.003 a0.775 ± 0.005 cde
0.2 MT0.133 ± 0.004 bc0.129 ± 0.009 bcd0.125 ± 0.005 d0.580 ± 0.014 cd0.595 ± 0.038 cd0.602 ± 0.019 c0.771 ± 0.002 e0.783 ± 0.002 bcd0.793 ± 0.001 a
0.3 MT0.127 ± 0.007 cd0.133 ± 0.013 bc0.141 ± 0.007 a0.567 ± 0.025 d0.588 ± 0.032 cd0.591 ± 0.023 cd0.776 ± 0.004 de0.775 ± 0.012 de0.761 ± 0.006 f
0.4 MT0.111 ± 0.005 e0.135 ± 0.009 ab0.135 ± 0.008 ab0.517 ± 0.023 e0.521 ± 0.052 e0.527 ± 0.032 e0.786 ± 0.001 abc0.738 ± 0.032 g0.743 ± 0.008 g
Data are shown as means ± standard deviation (SD) in three independent replicates. Different superscript letters indicate significant differences between different treatments at p < 0.05 level.
Table 3. Primer sequences of photosynthesis and Chl metabolism related genes for RT-qPCR.
Transcriptome IDGene
Symbol
Molecular FunctionForward Primer
(5′-3′)
Reverse Primer
(5′-3′)
CSS0047948CsPsaGPhotosystem I subunit GGTCATACCGTTCTGTTCGGCACTGGTCTGTCCCT
CSS0043679CsPsbSPhotosystem II subunit STCTCACATCTTACTACCTCCACAAACCCAATCCCACCC
CSS0018496CsATPase-aF-type H+-transporting ATPase subunit aATCAATACTCGCTTCGCCATCCTGGTCTTCCTCT
CSS0040087CsPetFFerredoxinTGGGATGATGGTTTCTGTGAGCACGTACCCTTTC
CSS0038112CsLHCALight-harvesting complex I chlorophyll a/b binding proteinGGACCCTGAGAACCTAAAGACGATGACGCGAAGTA
CSS0010537CsLHCBLight-harvesting complex II chlorophyll a/b binding proteinCGGAAAGGCGGTGAAACAGACAATGGACCCAAATAC
CSS0028383CsALDOFructose-bisphosphate aldolaseAAAGCGAGGAAGAGGCCCGAATGAGAACGAAAGT
CSS0042699CsFBPFructose-bisphosphataseGTATTTCAATGGCGTGTATTATCCCTGTCCTCCC
CSS0032234CsSBPaseSedoheptulose-bisphosphataseTGAGGCTGCTGTTTGAATCGGATAATCTCGTTCT
CSS0016317CsCHLHMagnesium chelatase H subunitGCTGCTTACTACTCGTTTCTCATTCCCACCTGCT
CSS0008645CsDVRDivinyl chlorophyllide a 8-vinyl-reductaseTGGGTGGACAGGTTGACACAGTCTGCGATAAATG
CSS0004684CsCLHChlorophyllaseATCATCACCACCTAAACCCTGAGGAGCAACGACTA
CSS0042634CsPAOPheophorbide a oxygenaseGACTTGACCCTGTTGCAAGCCAGTACCGATGA
Publisher’s Note: MDPI stays neutral with regard to jurisdictional claims in published maps and institutional affiliations.

