Article

Intermittent Hypoxia Increased the Expression of DBH and PNMT in Neuroblastoma Cells via MicroRNA-375-Mediated Mechanism

1
Department of Biochemistry, Nara Medical University, 840 Shijo-cho, Kashihara 634-8521, Nara, Japan
2
Department of Neurology, Nara Medical University, 840 Shijo-cho, Kashihara 634-8522, Nara, Japan
3
Department of Obstetrics and Gynecology, Nara Medical University, 840 Shijo-cho, Kashihara 634-8522, Nara, Japan
4
Department of Diagnostic Pathology, Nara Medical University, 840 Shijo-cho, Kashihara 634-8522, Nara, Japan
5
Department of Respiratory Medicine, Nara Medical University, 840 Shijo-cho, Kashihara 634-8522, Nara, Japan
*
Author to whom correspondence should be addressed.
Int. J. Mol. Sci. 2022, 23(11), 5868; https://doi.org/10.3390/ijms23115868
Submission received: 2 May 2022 / Revised: 19 May 2022 / Accepted: 23 May 2022 / Published: 24 May 2022
(This article belongs to the Special Issue Sleep Apnea and Intermittent Hypoxia 3.0)

Abstract

:
Sleep apnea syndrome (SAS), characterized by recurrent episodes of oxygen desaturation and reoxygenation (intermittent hypoxia (IH)), is a risk factor for hypertension and insulin resistance. We report a correlation between IH and insulin resistance/diabetes. However, the reason why hypertension is induced by IH is elusive. Here, we investigated the effect of IH on the expression of catecholamine-metabolizing enzymes using an in vitro IH system. Human and mouse neuroblastoma cells (NB-1 and Neuro-2a) were exposed to IH or normoxia for 24 h. Real-time RT-PCR revealed that IH significantly increased the mRNA levels of dopamine β-hydroxylase (DBH) and phenylethanolamine N-methyltransferase (PNMT) in both NB-1 and Neuro-2a. Western blot showed that the expression of DBH and PNMT in the NB-1 cells was significantly increased by IH. Reporter assays revealed that promoter activities of DBH and PNMT were not increased by IH. The miR-375 level of IH-treated cells was significantly decreased relative to that of normoxia-treated cells. The IH-induced up-regulation of DBH and PNMT was abolished by the introduction of the miR-375 mimic, but not by the control RNA. These results indicate that IH stress increases levels of DBH and PNMT via the inhibition of miR-375-mediated mRNA degradation, potentially playing a role in the emergence of hypertension in SAS patients.

1. Introduction

Sleep apnea syndrome (SAS) is a highly prevalent sleep disorder characterized by the repetitive partial or complete collapse of the pharynx during sleep. It is estimated that nearly one billion adults aged 30–69 in the world may suffer from SAS [1]. It induces apnea and hypopnea, which often result in a decreased oxygen saturation. A growing body of evidence suggests that SAS acts through recurrent episodes of oxygen desaturation and reoxygenation (intermittent hypoxia (IH)), which cause hypertension [2]. The pathophysiology of hypertension in cases of SAS is complex and dependent on various factors. The hypertension rate in SAS patients is two- to three-fold higher than that in the general population. Furthermore, habitual snoring, one of the hallmark symptoms of SAS, has been reported to be associated with hypertension in several epidemiologic studies [3,4]. Since SAS and hypertension share certain risk factors, i.e., the male gender, obesity, middle age, and a sedentary lifestyle, questions have been raised as to how much of this association may be attributable to these confounding variables. For the control of blood pressure, the sympathetic nervous system (catecholamine system), renin–angiotensin–aldosterone system and sodium reabsorption, and the endothelial system are important factors. We investigated how IH causes hypertension and report that IH up-regulates renin mRNA in juxtaglomerular cells via the down-regulation of microRNA (miR)-203 [5].
In the present study, we used catecholamine-producing human and mouse neuroblastoma cells and an in vitro IH system to investigate the direct effect of IH, a hallmark of SAS. An in vitro IH system is a controlled gas delivery system that regulates the flow of nitrogen and oxygen to generate IH [6,7]. We investigated the direct effect of IH on the gene expression(s) of catecholamine-synthesizing enzymes in neuroblastoma cells, and found significant increases in the mRNA levels of dopamine β-hydroxylase (DBH) and phenylethanolamine N-methyltransferase (PNMT) in response to IH treatment via the down-regulation of microRNA (miR)-375.

2. Results

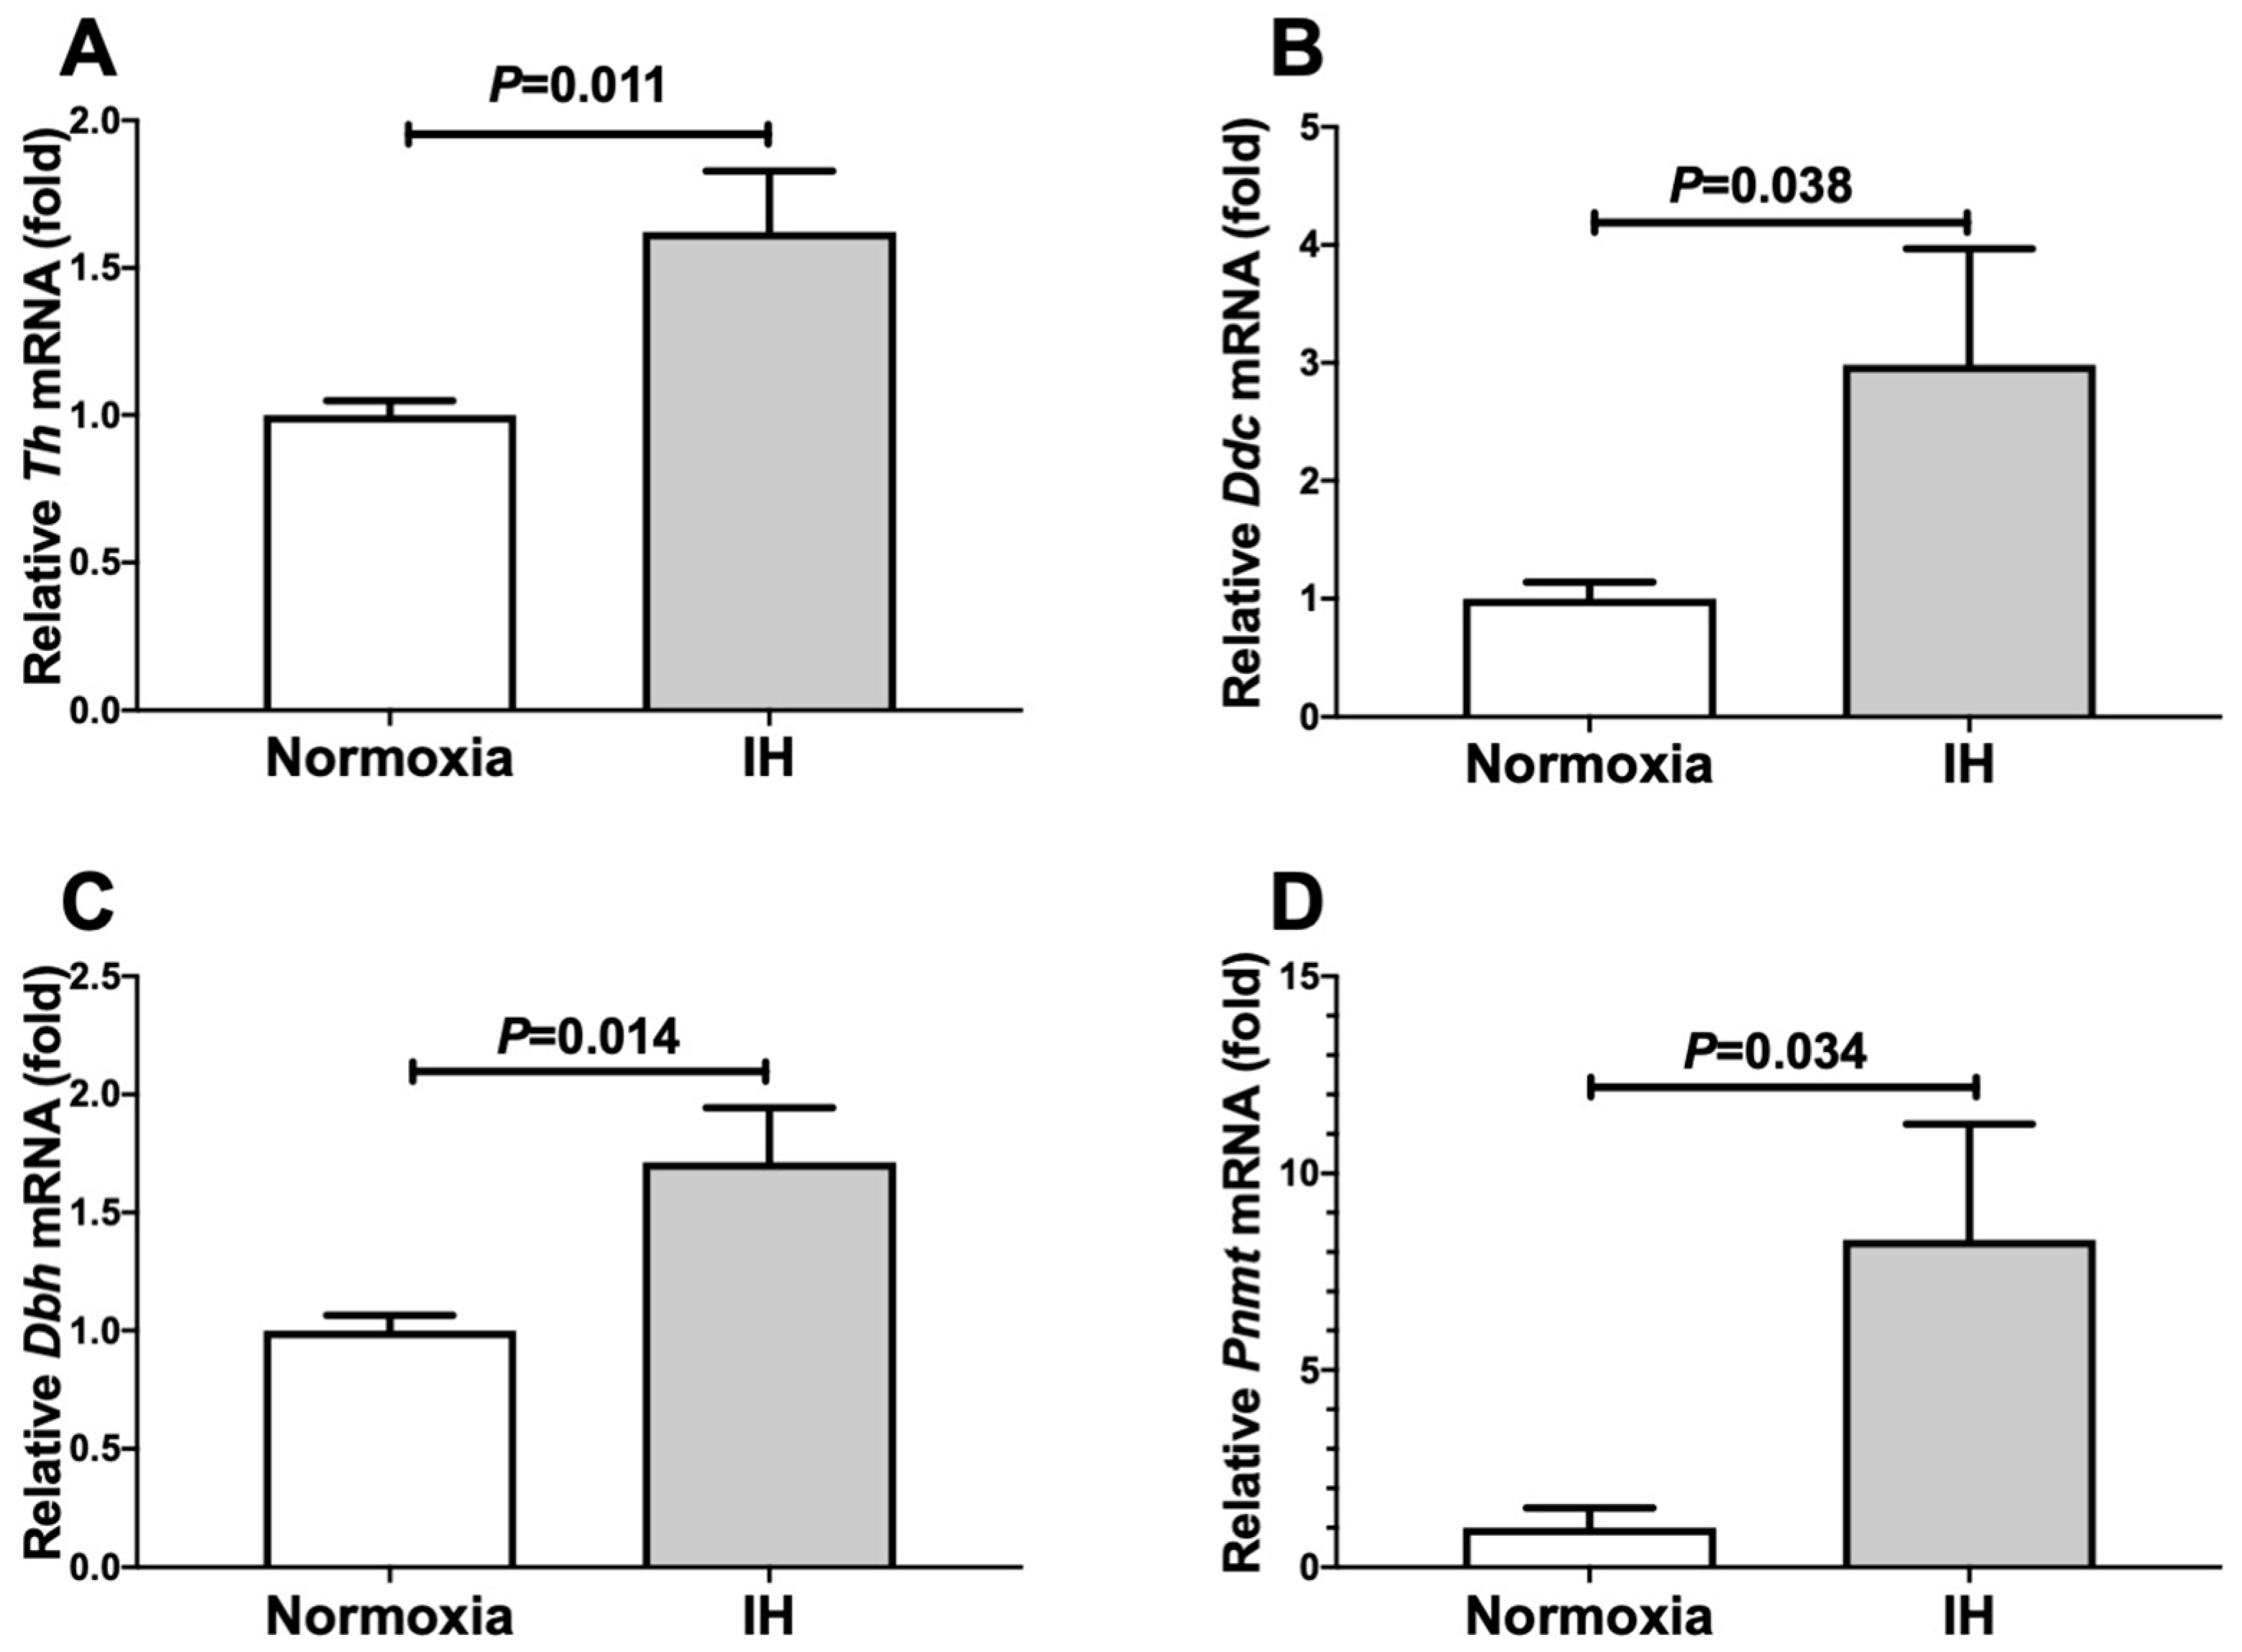
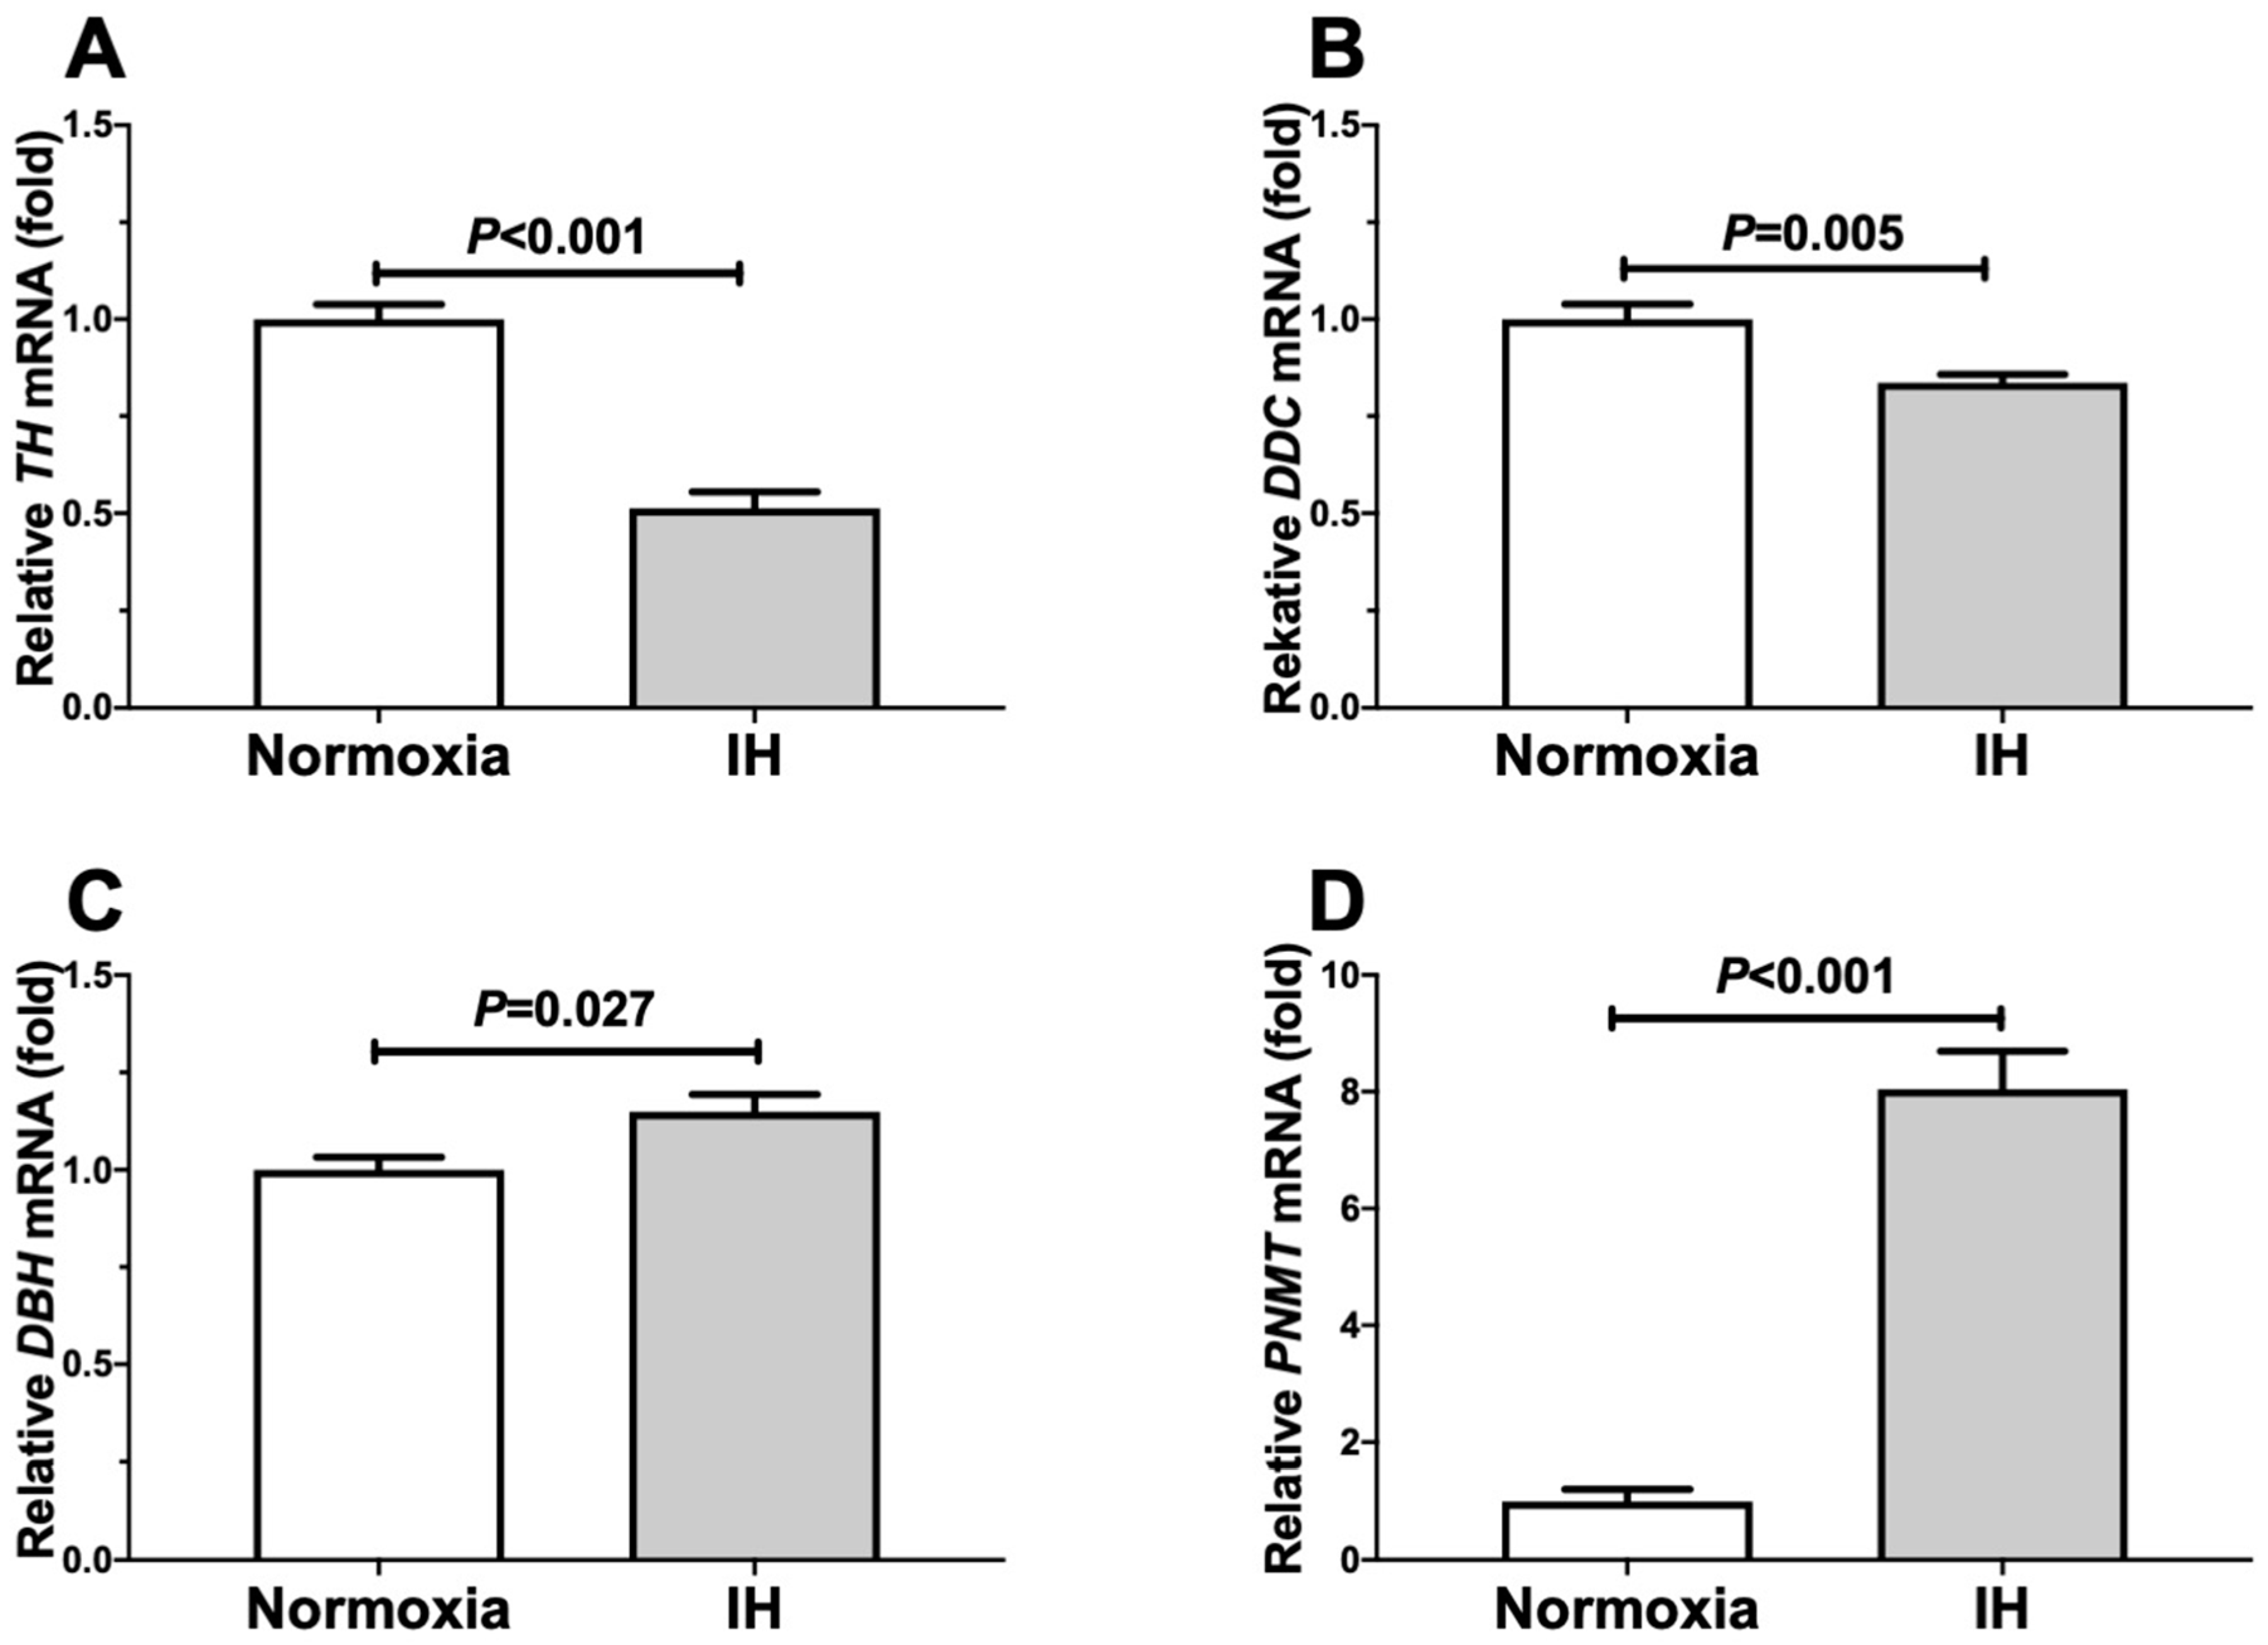
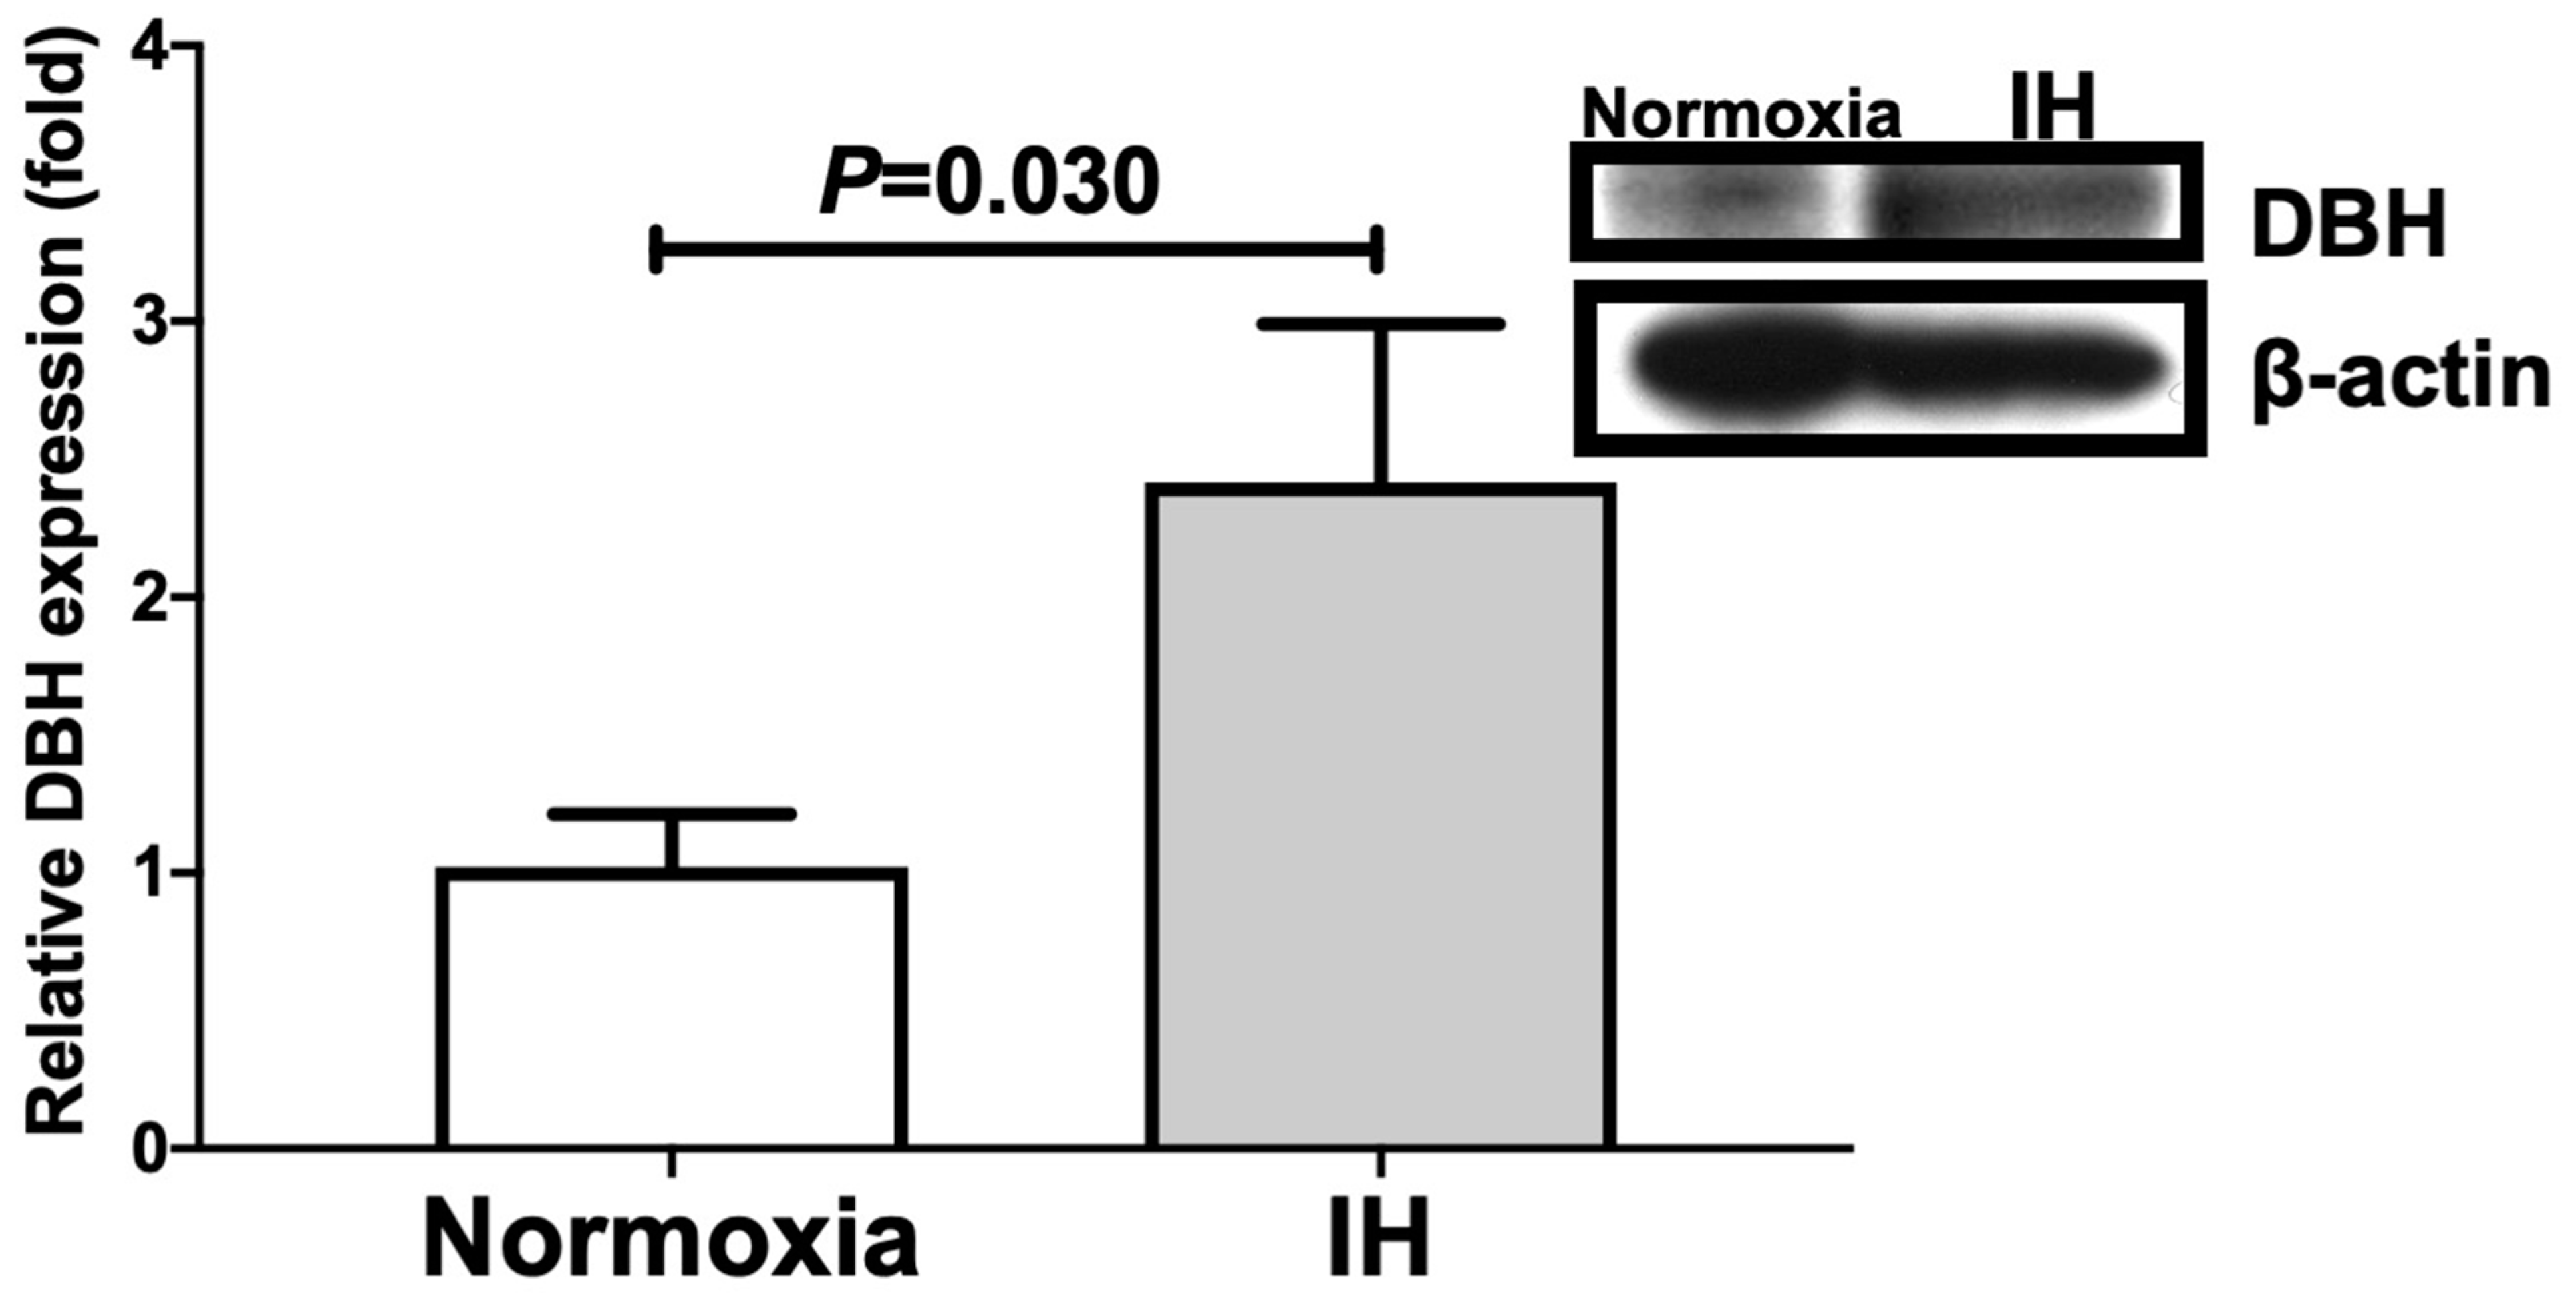
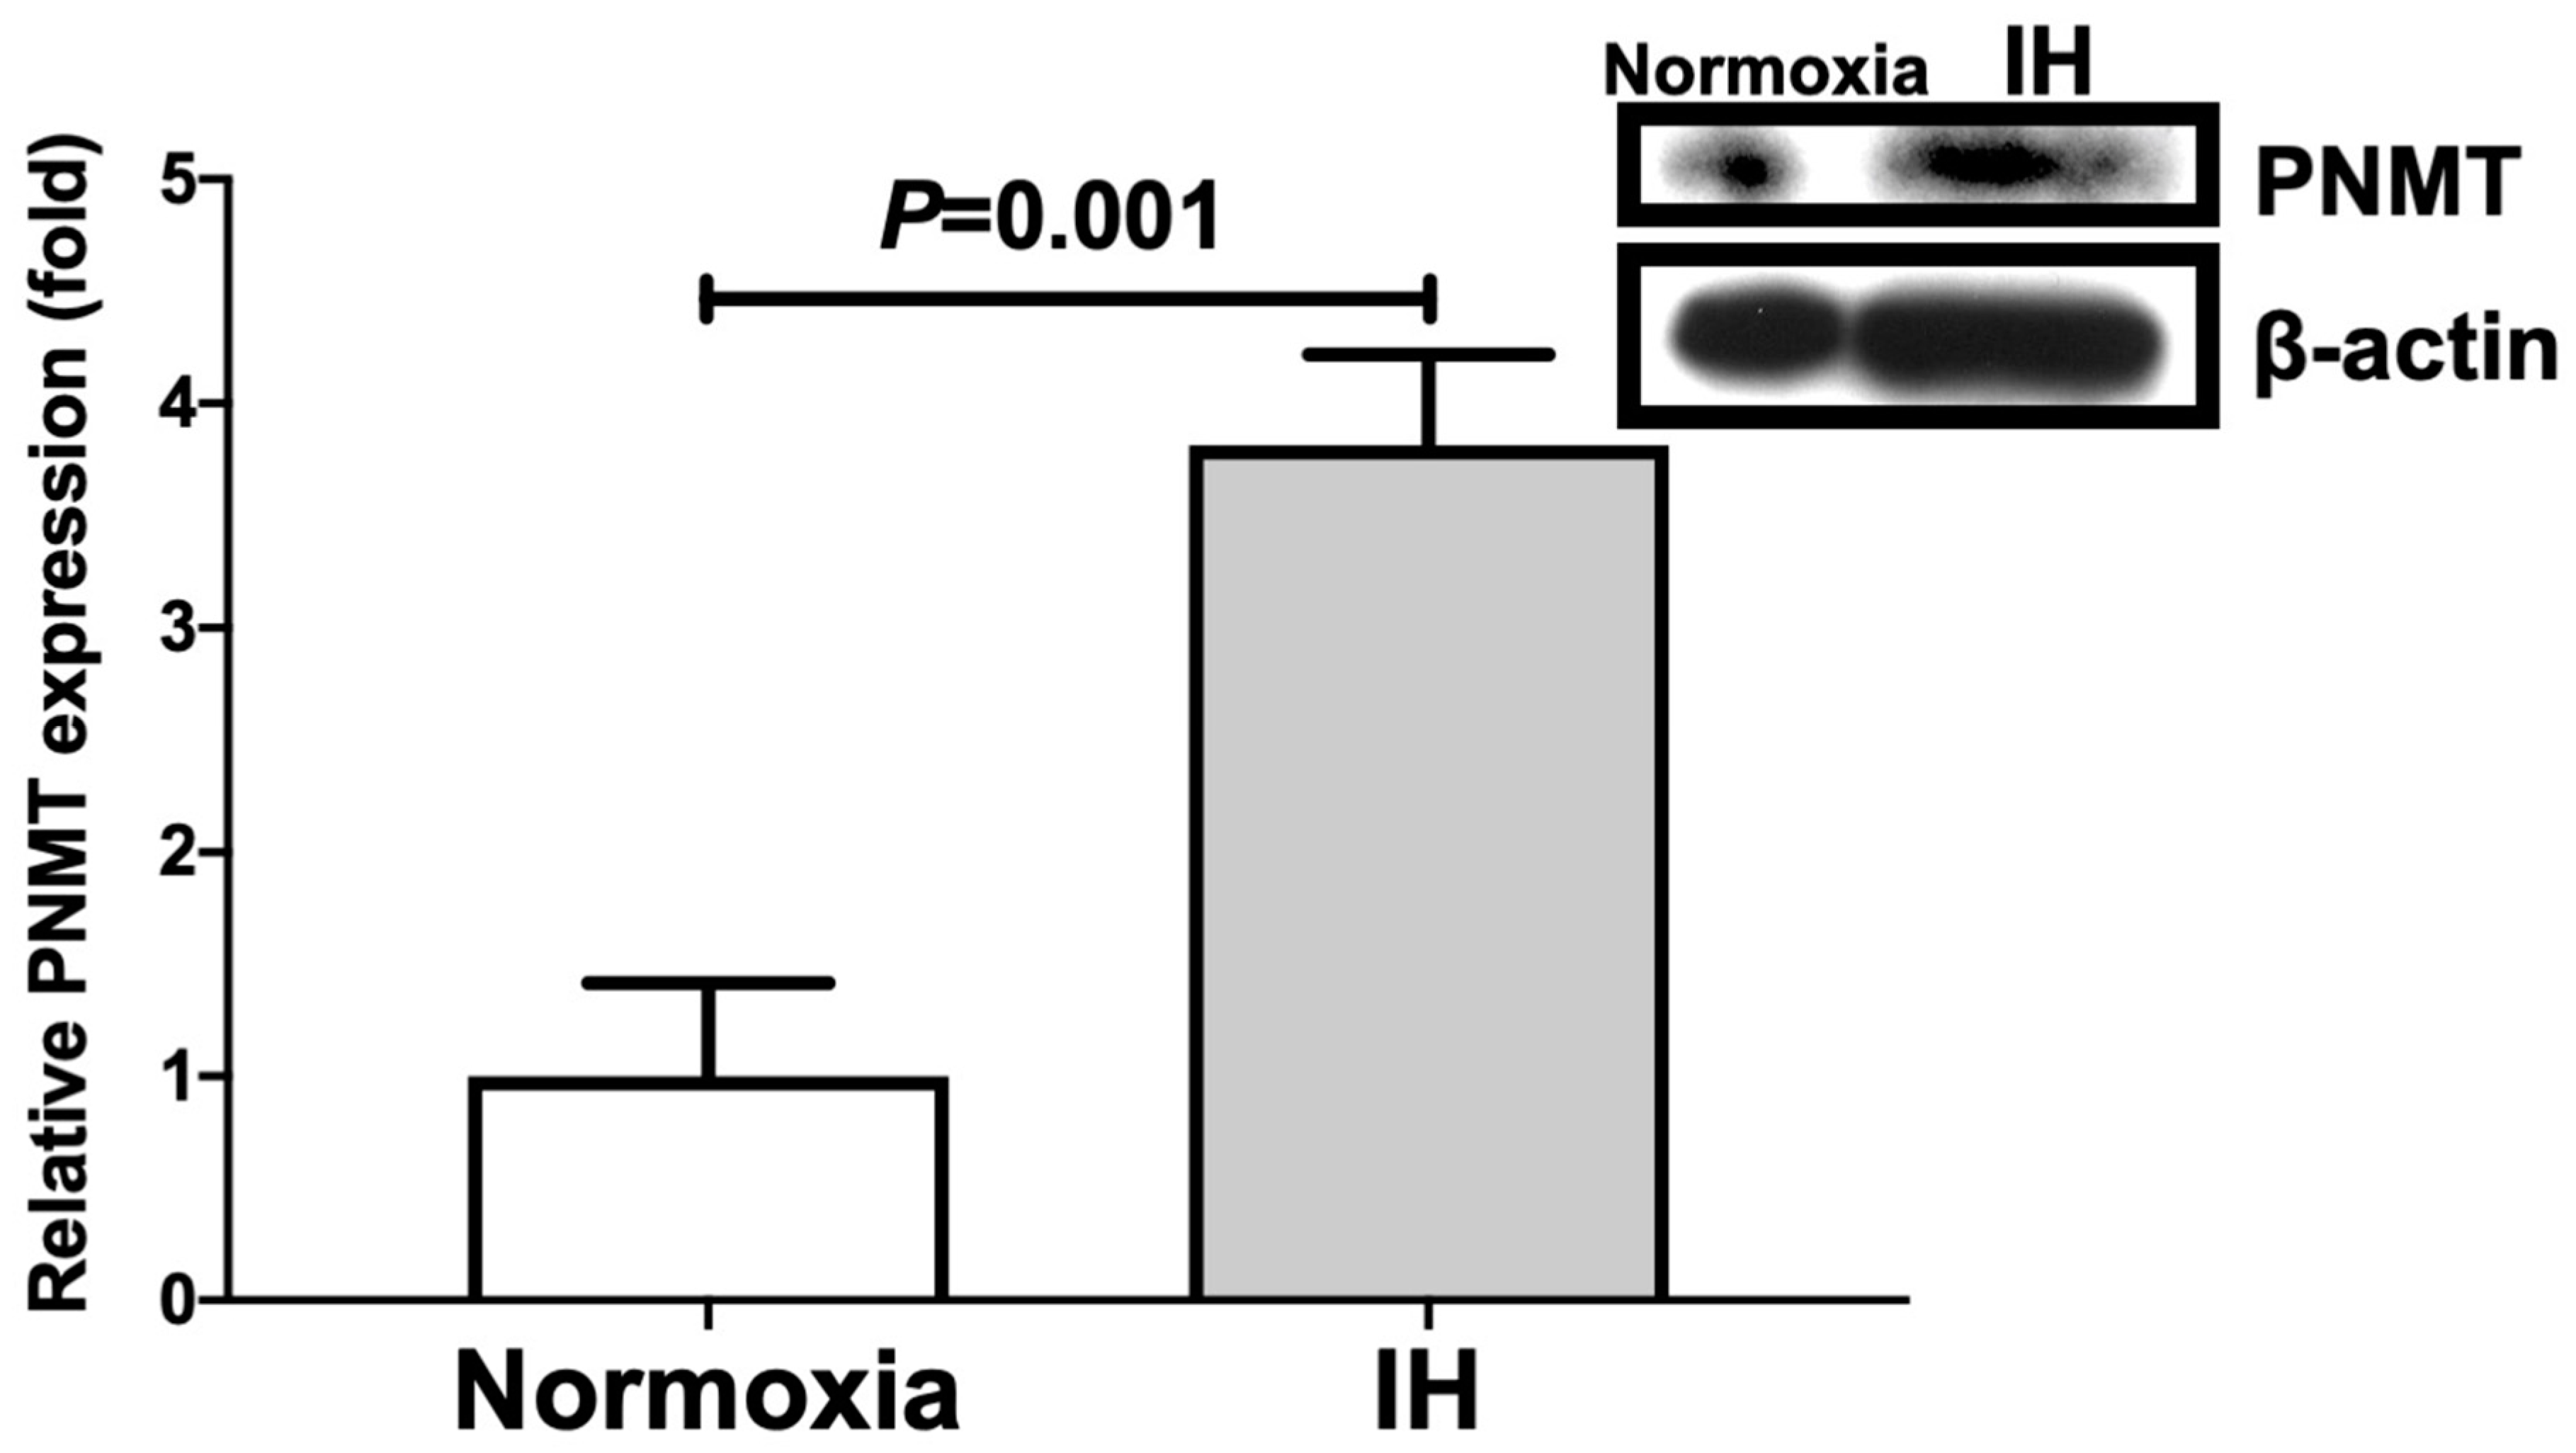
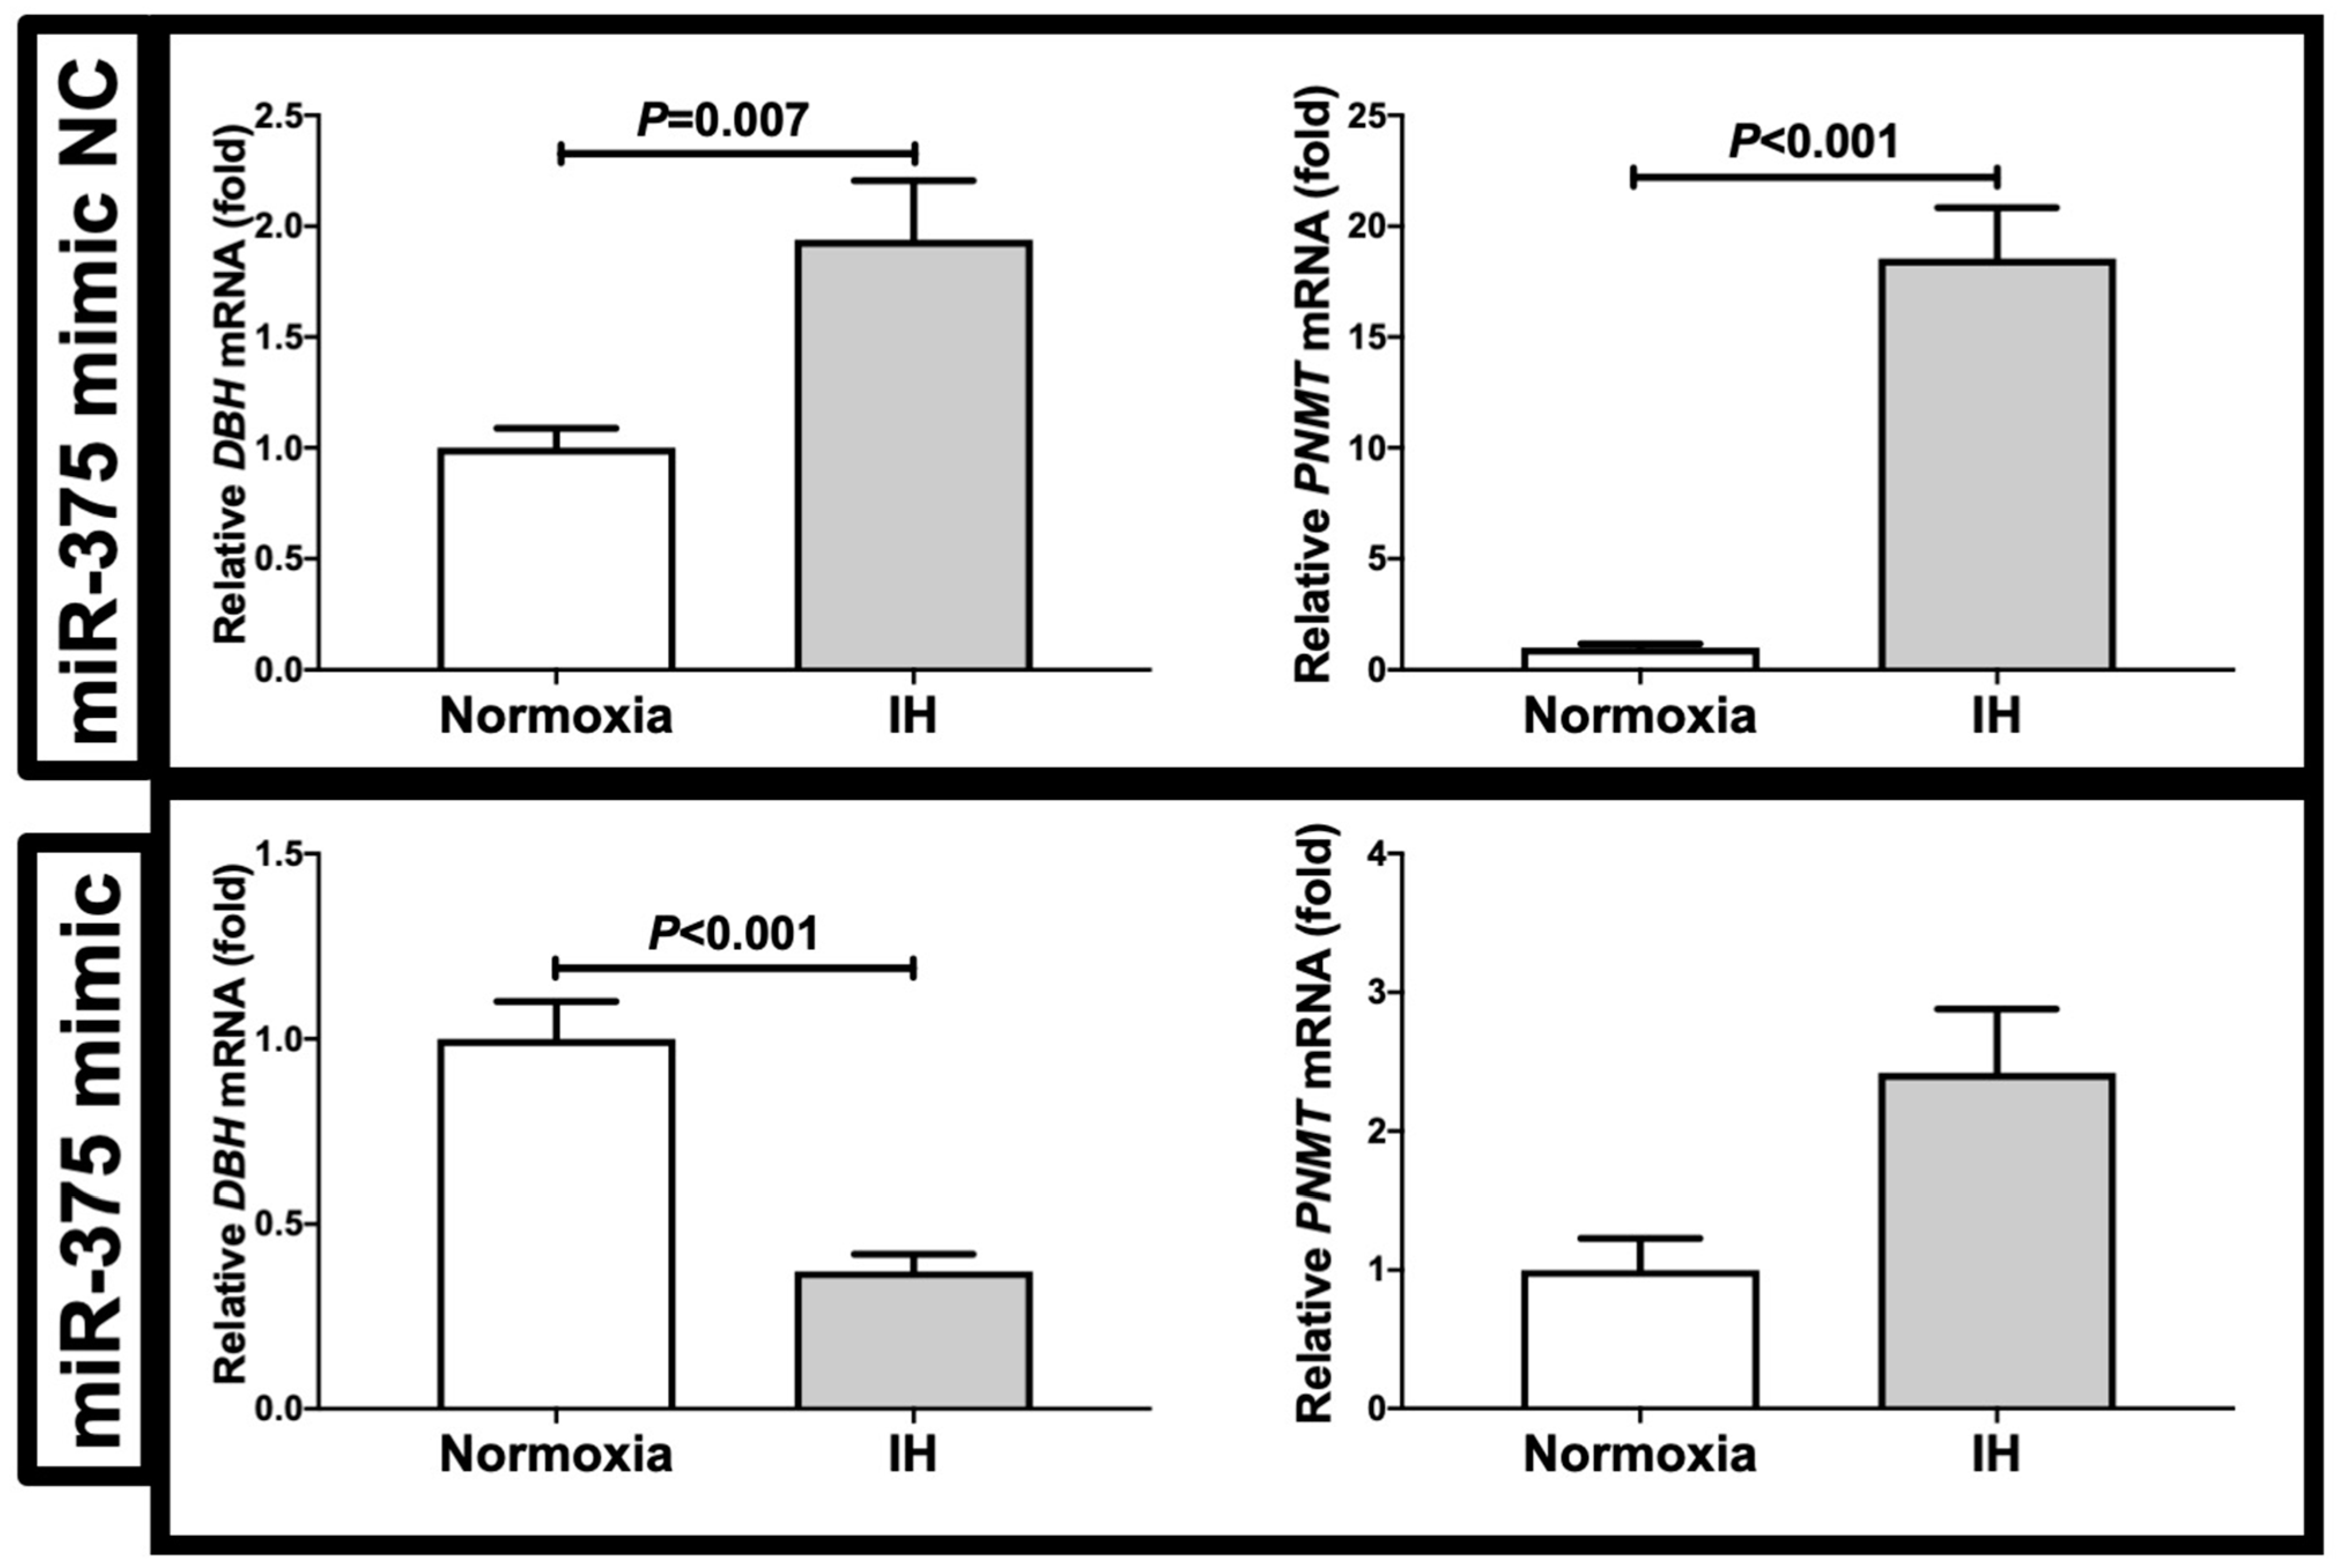
2.1. Gene Expression Levels of DBH and PNMT in Human and Mouse Neuroblastoma Cells Were Increased by IH

We exposed catecholamine-producing mouse Neuro-2a and human NB-1 neuroblastoma cells to normoxia or IH for 24 h. Following the IH treatment, we prepared cellular RNA and measured the mRNA levels of catecholamine biosynthesis enzymes such as tyrosine hydroxylase (Th), L-3,4-dihydroxyphenylalanine (DOPA) decarboxylase (Ddc), dopamine β-hydroxylase (Dbh), and phenylethanolamine N-methyltransferase (Pnmt) by means of a real-time reverse transcription-polymerase chain reaction (RT-PCR). We found that the mRNA levels of Th, Ddc, Dbh, and Pnmt were up-regulated by IH in mouse Neuro-2a cells (Figure 1).
Following the treatment, we prepared cellular RNA and measured the mRNA levels of TH, DDC, DBH, and PNMT by means of a real-time RT-PCR. As shown in Figure 2, the mRNA levels of DBH and PNMT were significantly increased in the NB-1 cells in response to IH, although the TH and DDC mRNA levels did not increase.
We further measured cellular DBH and PNMT levels by means of immunoblot analyses. As shown in Figure 3 and Figure 4, IH significantly increased the cellular DBH and PNMT levels in NB-1 cells.

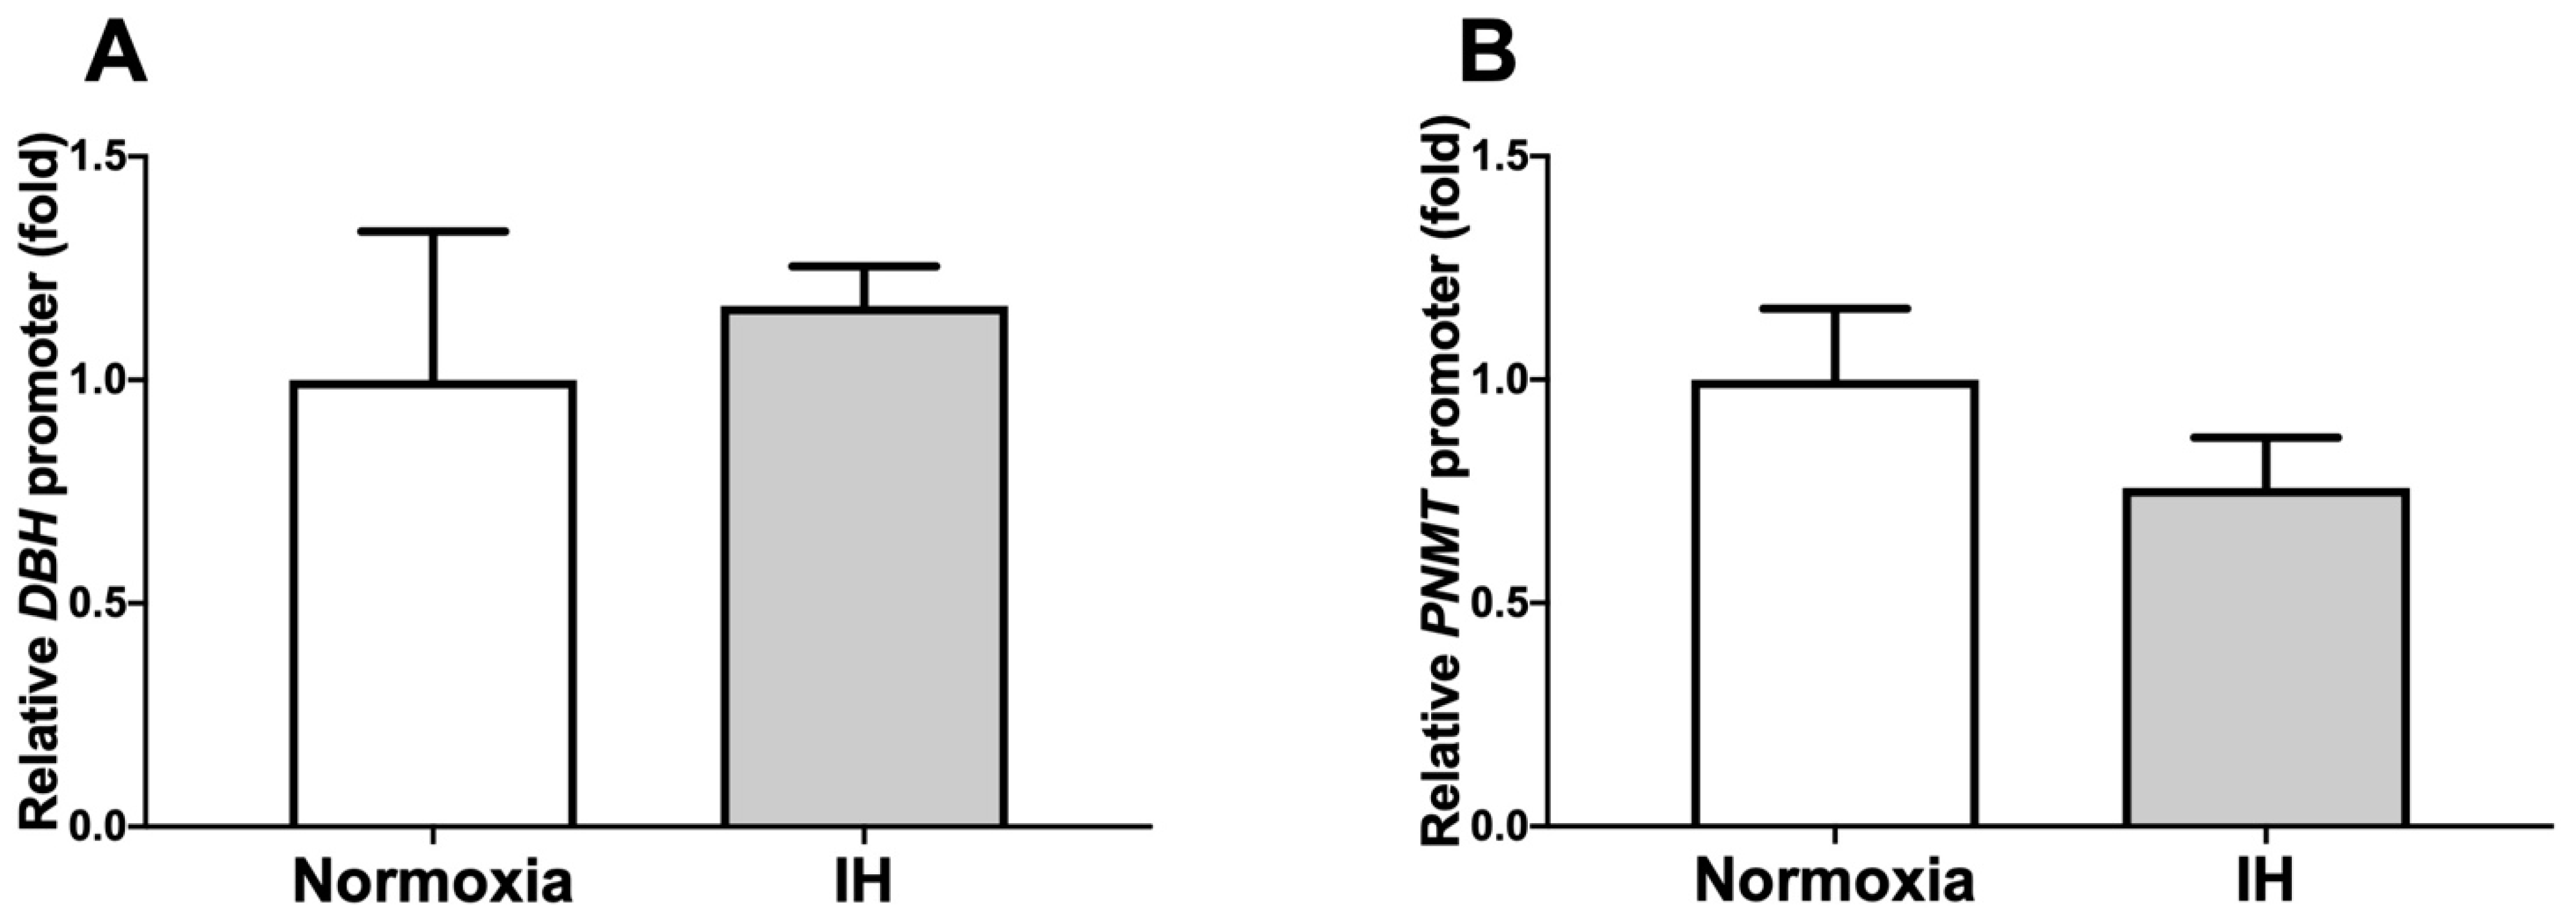
2.2. The Promoter Activities of DBH and PNMT Were Not Increased by IH

To determine whether the IH-induced increases in DBH and PNMT mRNAs were caused by the activation of transcription, a 1028 bp fragment containing 1018 bp of the human DBH promoter, and a 667 bp fragment containing 600 bp of the human PNMT promoter, were fused to the luciferase gene of pGL4.17 and transfected into NB-1 cells. After IH stimulation, we measured promoter activities and found that DBH and PNMT promoter activities were not increased by IH in NB-1 cells (Figure 5: p = 0.694 in DBH promoter and p = 0.242 in PNMT promoter). These results suggested that the gene expression of DBH and PNMT in response to IH was not regulated by transcription.

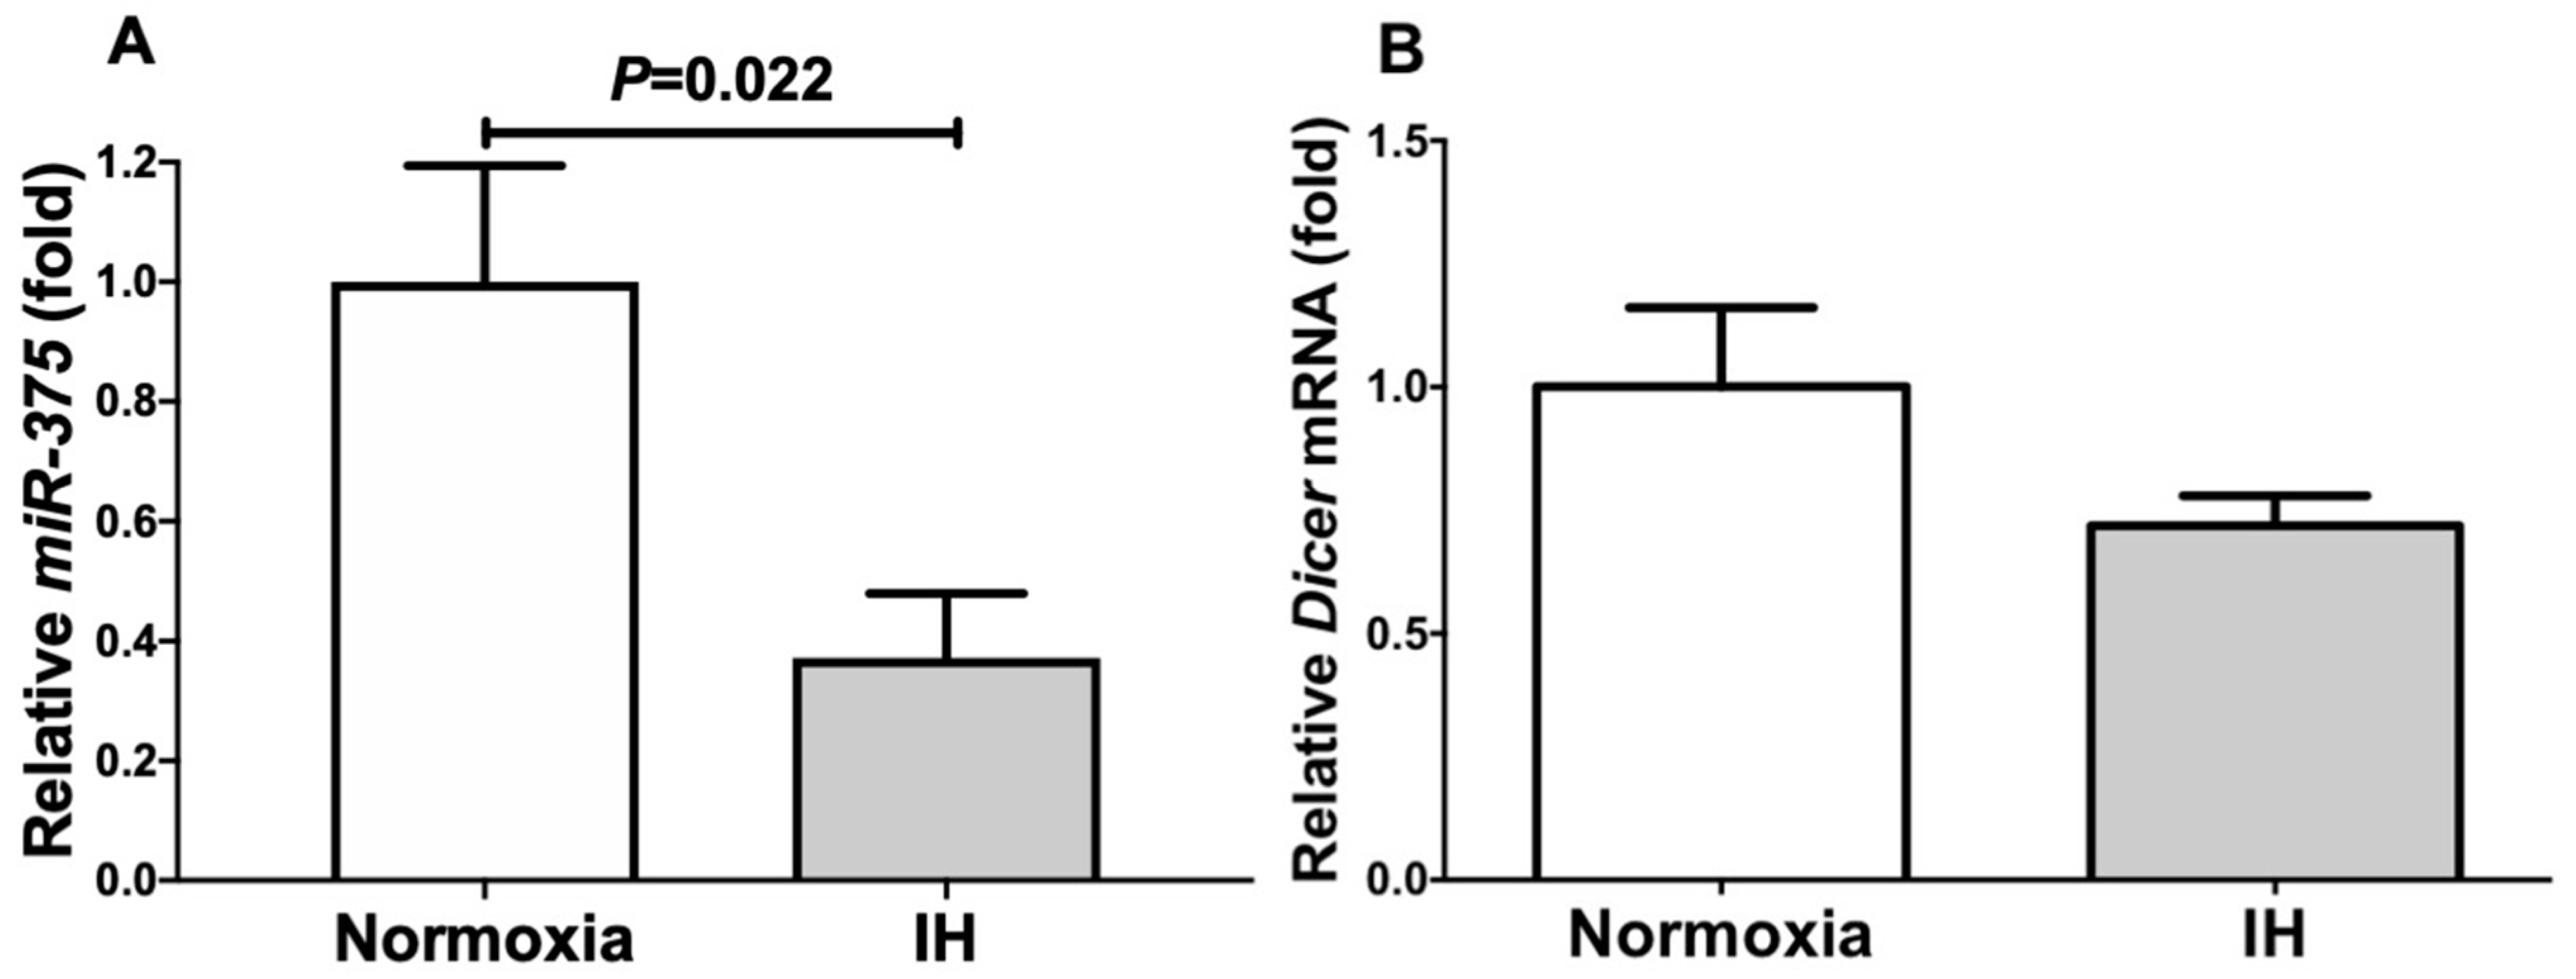
2.3. The MiR-375 Level Was Significantly Decreased by IH

We considered a possible explanation that the IH-induced up-regulation of DBH and PNMT was controlled post-transcriptionally. Therefore, we searched for targeted miRNA using the MicroRNA.org program (http://www.microrna.org/microrna/home.do, 23 October 2021), which revealed that DBH and PNMT mRNAs had a potential target sequence for miR-375. There were no other miRNA candidates targeting both genes. We measured the miR-375 levels of IH-treated cells using real-time RT-PCR and found that the level was significantly lower than that of normoxia-treated cells (Figure 6: 0.371 ± 0.108 folds vs. normoxia, p = 0.022). There are several possible reasons as to why the level of miR-375 was decreased by IH; one is that the mRNA levels of some enzymes involved in miRNA biosynthesis/degradation are influenced by IH; another is that the level of miR-375 was specifically decreased by IH, either via decreased biosynthesis or enhanced degradation. We measured the endoribonuclease Dicer (DICER), which is involved in the biosynthesis of miRNAs [8,9], and found that its expression was unchanged by IH (Figure 6: p = 0.135). These results suggest that miR-375 plays a key role in the post-transcriptional regulation of the mRNA levels of DBH and PNMT. To investigate whether DBH and PNMT expression in IH is regulated by miR-375, miR-375 mimic and non-specific control RNA (miR-375 mimic NC) were introduced into NB-1 cells with IH/normoxia exposure, and the mRNA levels of DBH and PNMT were measured using real-time RT-PCR.
As shown in Figure 7, we found that the IH-induced increases in DBH and PNMT mRNAs were abolished by the introduction of the miR-375 mimic, but not by the miR-375 mimic NC. These findings indicate that IH stress down-regulated the miR-375 level in human neuroblastoma cells (Figure 6) and that the levels of DBH and PNMT mRNAs were increased via the miR-375-mediated mechanism.

3. Discussion

SAS patients and their organs, tissues, and cells are exposed to IH. Thus, we exposed catecholamine-synthesizing neuroblastoma cells to IH in the present study and found that IH exposure induced increases in the DBH and PNMT mRNA levels in human neuroblastoma cells. We further studied the mechanisms by which IH up-regulates the mRNA levels of DBH and PNMT and found the possibility of post-transcriptional miRNA-regulated mechanisms. The expression of DBH and PNMT was up-regulated by IH via the miR-375-mediated mechanism. Hypertension in SAS patients could be caused by the IH-induced up-regulation of DBH and PNMT.
Recent epidemiological research demonstrated that SAS may be associated with various metabolic dysfunctions, including dyslipidemia, cardiovascular diseases, insulin resistance, and hypertension. The pathophysiology of hypertension in relation to SAS is dependent on various factors; for example, the sympathetic tone, peripheral vasoconstriction, altered baroreceptor reflexes, increased renin–angiotensin system activity [2,5], and increased plasma noradrenaline concentrations [10]. In particular, there are numerous reports concerning catecholamine synthesis in SAS patients and experimental models—more specifically, increased catecholamine secretion [11,12] the and up-regulation of the PNMT gene by IH [13]. Regarding catecholamine secretion from neuronal/adrenal chromaffin cells in hypoxia, hypoxia stimulates catecholamine secretion/gene expression in vitro and in vivo [14,15,16].
Previous studies focusing on catecholamine biosynthetic enzyme activities in the adrenal medulla, which is derived from the neural crest of spontaneously hypertensive rats (SHRs), showed inconsistent results. This was reported to be decreased [17,18,19], unchanged [20], and increased [21,22] in young SHRs. Ddc, Dbh, and Pnmt activities were decreased [18,23] or increased [24,25] in young SHRs, but unchanged in adult SHRs [18,25]. Due to the apparent correlation of the catecholamine biosynthetic enzyme activities, some authors have suggested that these genes may be co-regulated by a single locus [26].
We also investigated the mechanisms by which IH up-regulates the mRNA levels of DBH and PNMT. We found that the promoter activities of the genes were not increased by IH, which suggested that the IH-induced up-regulation of the DBH and PNMT mRNAs is regulated during the post-transcriptional step. miRNAs are small non-coding RNAs (≈22 nucleotides in length) that modulate gene expression by either translational suppression or the degradation of the mRNA through binding to the 3′-untranslated regions of the target genes in a base-pairing manner [27]. They affect the stability of their target mRNAs, resulting in changes in the amount of target mRNA, which is one of the mechanisms associated with post-transcriptional regulation. To date, a number of studies concerning the role of miR-375 have been reported to be influenced in normal pancreatic genesis [28], the proinflammatory macrophage response [29], pituitary prolactin synthesis [30], neuroendocrine differentiation and tumorigenesis in lung carcinoid cells [31], inhibition in proliferation and invasion of nasopharyngeal carcinomas [32], and inhibition in the proliferation, migration, and invasion of esophageal squamous cell carcinomas [33]. Several such studies have indicated that miRNAs are involved in the regulation of many biological processes (migration, metastasis, cell proliferation, apoptosis, chemosensitivity, etc.) in these various types of cells.
A few studies have addressed the correlation between miRNAs and hypertension in patients with SAS. For example, three plasma miRNAs (miR-378a-3p, miR-100-5p, and miR-486-5p) have been found to predict blood pressure responses to the continuous positive airway pressure treatment in patients with resistant hypertension and SAS [34]. Several miRs with altered expression in catecholamine-producing pheochromocytomas and paragangliomas (such as miR-15, -16, -21-3p, -96, -101-, -133, -137, -139-3p, -183, -195, -210, -338-3p, -375, -382, -483-5p, -488, -508, -765, -855, and -1225-3p) were reported [35]. In particular, there are a few reports on the function of miR-375, and they suggested it to be involved in the regulation of cytokines, extracellular matrix–receptor interaction, focal adhesion, phosphatidylinositol-3 kinase-protein kinase B (Akt), amoebiasis, and protein-processing pathways [36]. Single nucleotide polymorphisms (rs11174811 and rs3803107) in miR-375 target sites of the 3′-untranslated region in the arginine vasopressin receptor 1a gene were reported to be associated with the risk of hypertension [37]. However, these studies did not indicate the involvement of miR-375 in SAS patients’ hypertension. In the present study, the decline in miR-375 with a target sequence in the DBH and PNMT mRNAs could have contributed to the worsening hypertension in the IH condition induced by the up-regulation of the DBH and PNMT mRNAs. Therefore, it is quite important and necessary to clarify the relationships between miR-375, catecholamine-metabolizing enzyme expression, and hypertension using experimental animal models and/or clinical samples in the future. Additionally, since miRNA is easily measured in a clinical laboratory using clinically obtained blood samples of patients, it is possible that the measurement of miR-375 is used for the prediction and diagnosis of hypertension in SAS and/or habitual snoring patients.
In this study, the gene expression of DBH and PNMT was increased via the down-regulation of the miR-375 level in the IH-treated neuroblastoma cells. It is suggested that, in SAS patients, the up-regulation of DBH and PNMT in neural cells in the adrenal medulla may induce hypertension, while miR-375 could play a crucial role in the regulation of such gene expressions.

4. Materials and Methods

4.1. Cell Culture

The mouse neuroblastoma Neuro-2a cells utilized were purchased from the Japanese Collection of Research Bioresources Cell Bank (Ibaraki, Japan). The Neuro-2a cells were grown in E-MEM medium (FUJIFILM Wako Pure Chemical Corporation, Osaka, Japan) containing 10% (v/v) fetal calf serum (FCS), 100 units/mL penicillin G (FUJIFILM Wako), and 100 µg/mL streptomycin (FUJIFILM Wako), and human neuroblastoma NB-1 cells were grown in RPMI1640 medium (Nacalai Tesque, Inc., Kyoto, Japan) containing 10% (v/v) FCS, 100 units/mL penicillin G (FUJIFILM Wako), and 100 µg/mL streptomycin (FUJIFILM Wako), as described in prior studies [38,39,40]. The cells were exposed to either normoxia (21% O2, 5% CO2, and balanced N2) or IH (70 cycles of 5 min sustained hypoxia (1% O2, 5% CO2, and balanced N2) and 10 min normoxia) in a custom-designed, computer-controlled incubation chamber attached to an external O2-CO2-N2 computer-driven controller (O2 programmable control, 9200EX, Wakenyaku Co., Ltd., Kyoto, Japan), as described in previous studies [5,40,41,42,43,44,45,46]. We used this in vitro model of IH, which resulted in fluctuations in the pressure of oxygen similar to the IH condition observed in patients with severe SAS, to repeatedly expose the cells to severe hypoxemia followed by mild hypoxemia or normoxia (i.e., IH) [47]. We previously reported that the magnitude of the IH expressed by SpO2 fluctuated between 75% and 98% and between 50% and 80% in patients with SAS [6,7,48], which was nearly equivalent to the medium condition in the present study.

4.2. RT-PCR

Total RNA was isolated using an RNeasy Plus Cell Mini Kit (Qiagen, Hilden, Germany) for Neuro-2a and NB-1 cells, and cDNA was synthesized from total RNA as a template using a High-Capacity cDNA Reverse Transcription kit (Applied Biosystems, Foster City, CA, USA), as previously described [5,40,41,42,43,44,45,46,49,50,51]. A real-time polymerase chain reaction (PCR) was performed using an SYBR® Fast qPCR kit (KAPA Biosystems, Boston, MA) and a Thermal Cycler Dice Real Time [JP1] System (Takara Bio, Kusatsu, Japan). All the PCR primers were synthesized by Nihon Gene Research Laboratories, Inc. (NGRL; Sendai, Japan), and the primer sequences for each primer set are described in Table 1 and Table 2. PCR was performed in an initial step of 3 min at 95 °C, followed by 40 cycles of 3 s at 95 °C and 20 s at 60 °C for β-actin; 45 cycles of 10 s at 95 °C, 5 s at 60 °C, and 20 s at 72 °C for Rig/RpS15; and 45 cycles of 3 s at 95 °C and 20 s at 60 °C for Th (human and mouse), Ddc (human and mouse), Dbh (human and mouse), Pnmt (human and mouse), endoribonuclease Dicer (DICER), and microRNA-375 (miR-375). The mRNA expression levels were normalized to the mRNA level of Rig/RpS15 in mouse samples or β-actin in human samples, and the miR-375 level was normalized to the U6 RNA level.

4.3. Construction of Reporter Plasmid and Luciferase Assay

Reporter plasmids were prepared by inserting the promoter fragments of human DBH (−1018–+10) and PNMT (−600–+67) up-stream of a firefly luciferase reporter gene in the pGL4.17 vector (Promega, Madison, WI, USA). The reporter plasmids were transfected into human NB-1 neuroblastoma cells using Lipofectamine® 3000 (Invitrogen, Waltham, MA, USA), as previously described [5,40,43,45,46,50], and the cells were exposed to either 70 cycles/24 h of IH or normoxia for 24 h. After the cells were exposed to IH, they were harvested, and cell extracts were prepared in extraction buffer (0.1 M potassium phosphate, pH 7.8/0.2% Triton X-100; Life Technologies, Carlsbad, CA, USA). To monitor the transfection efficiency, pCMV-SPORT-βgal plasmid (Life Technologies) was co-transfected in all experiments at a 1:10 dilution. Luciferase activity was measured using a PicaGene luciferase assay system (Toyo-ink, Tokyo, Japan), and was normalized by the β-galactosidase activity, as described previously [5,40,41,43,46,49,50].

4.4. Immunoblot Analysis

The immunoblot analysis was performed using an NB-1 cell extract (5 × 10⁵ cells), as described in previous studies [5,39,52,53,54], an anti-DBH or -PNMT rabbit polyclonal antibody (Proteintech, Rosemont, IL, USA) and an anti-β-actin monoclonal antibody (Sigma, St. Louis, MO, USA) raised against Ac-Asp-Asp-Asp-Ile-Ala-Ala-Leu-Val-Ile-Asp-Asn-Gly-Ser-Gly-Lys, a SNAP id® 2.0 Protein Detection System (Merck Millipore, Burlington, MA, USA), and an ECL Select detection reagent (Cytiva, Marlborough, MA, USA). The band intensities were analyzed using ImageJ software (National Institute of Health, Bethesda, MD, USA), as previously described [5,53,55,56].

4.5. MiRNA Extraction, Reverse Transcription, and Real-Time Quantitative PCR

Total RNA, including miRNA, was isolated from NB-1 cells using the miRNeasy mini kit (Qiagen) according to the manufacturer’s instructions. An equal amount of DNase-treated RNA was Poly-A-tailed using a Mir-XTM miRNA first-strand synthesis kit (Clontech Laboratories, Inc., Mountain View, CA, USA) according to the manufacturer’s protocol. The conditions for PCR were 95 °C for 10 s, followed by 45 cycles of amplification (95 °C, 5 s, 60 °C, 20 s). U6 small nuclear RNA was used as an endogenous control for miRNA, as previously described [5,43,45,50]. The primers are listed in Table 2.

4.6. MiR-375 Mimic Transfection

MiR-375 mimic (5′-UUUGUUCGUUCGGCUCGCGUGAtt-3′, 5′-UCACGCGAGCCGAACGAACAAAtt-3′) and non-specific control RNA (miR-375 mimic NC) (5′-UUUGUACUACACAAAAGUACUGtt-3′, 5′-CAGUACUUUUGUGUAGUACAAAtt-3′) were synthesized by NGRL and introduced into NB-1 cells using Lipofectamine® RNAiMAX (Invitrogen) [5,43,45,46,50] just before IH/normoxia exposure, and the mRNA levels of DBH and PNMT were measured by real-time RT-PCR, as previously described in Section 4.2.

4.7. Data Analysis

The results are expressed as mean ± SE. Statistical significance was determined by Student’s t-test using GraphPad Prism software (GraphPad Software, La Jolla, CA, USA).

Author Contributions

S.T. contributed to the study design. S.T. and R.S. contributed to the data collection. S.T., R.S., Y.T. and A.I.-H. contributed to the data analysis. S.T., R.S., Y.T., T.U., A.Y., M.M., S.S.-T., K.A., H.O. and A.I.-H. contributed to the data interpretation. S.T. and R.S. contributed to the preparation of the manuscript. All authors have read and agreed to the published version of the manuscript.

Funding

This research was supported in part by the Grant-in-Aid for Scientific Research from the Ministry of Education, Culture, Sports, Science and Technology, Japan (grant numbers 08102003, 15K19425, and 21K16344), the Japan Society for the Promotion of Science, and the Japan Science and Technology Agency.

Acknowledgments

We are indebted to Satoshi Ueno (Nara Medical University) for encouragement.

Conflicts of Interest

The authors declare no conflict of interest.

Abbreviations

DBHDopamine β-hydroxylase
DDCDOPA decarboxylase
DOPAL-3,4-dihydroxyphenylalanine
DicerEndoribonuclease Dicer
FCSFetal calf serum
IHIntermittent hypoxia
miRNAMicroRNA
PNMTPhenylethanolamine N-methyltransferase
RigRat insulinoma gene
RpS15Ribosomal protein S15
SASSleep apnea syndrome
SHRsSpontaneously hypertensive rats
THTyrosine hydroxylase

References

  1. Benjafield, A.V.; Ayas, N.T.; Eastwood, P.R.; Heinzer, R.; Ip, M.S.M.; Morrell, M.J.; Nunez, C.M.; Patel, S.R.; Penzel, T.; Pépin, J.-L.; et al. Estimation of the global prevalence and burden of obstructive sleep apnoes: A literature-based analysis. Lancet Respir. Med. 2019, 7, 687–698. [Google Scholar] [CrossRef] [Green Version]
  2. Ahmad, M.; Makati, D.; Akbar, S. Review of and updates on hypertension in obstructive sleep apnea. Int. J. Hypertens. 2017, 2017, 1848375. [Google Scholar] [CrossRef] [PubMed]
  3. Gislason, T.; Aberg, H.; Taube, A. Snoring and systemic hypertension—an epidemiological study. Acta Med. Scand. 1987, 222, 415–421. [Google Scholar] [CrossRef] [PubMed]
  4. Marrone, O.; Bonsignore, M.R.; Fricano, L.; Lo Coco, R.; Cerasola, G.; Bonsignore, G. Gender and the systemic hypertension-snoring association: A questionnaire-based case-control study. Blood Press 1998, 7, 11–17. [Google Scholar] [CrossRef]
  5. Takeda, Y.; Itaya-Hironaka, A.; Yamauchi, A.; Makino, M.; Sakuramoto-Tsuchida, S.; Ota, H.; Kawaguchi, R.; Takasawa, S. Intermittent hypoxia upregulates the renin and Cd38 mRNAs in renin-producing cells via the downregulation of miR-203. Int. J. Mol. Sci. 2021, 22, 10127. [Google Scholar] [CrossRef]
  6. Ota, H.; Fujita, Y.; Yamauchi, M.; Muro, S.; Kimura, H.; Takasawa, S. Relationship between intermittent hypoxia and Type 2 diabetes in sleep apnea syndrome. Int. J. Mol. Sci. 2019, 20, 4756. [Google Scholar] [CrossRef] [Green Version]
  7. Kimura, H.; Ota, H.; Kimura, Y.; Takasawa, S. Effects of intermittent hypoxia on pulmonary vascular and systemic diseases. Int. J. Environ. Res. Public Health 2019, 16, 3101. [Google Scholar] [CrossRef] [Green Version]
  8. Francia, S.; Michelini, F.; Saxena, A.; Tang, D.; de Hoon, M.; Anelli, V.; Mione, M.; Carninci, P.; d’Adda di Fagagna, F. Site-specific DICER and DROSHA RNA products control the DNA-damage response. Nature 2012, 488, 231–235. [Google Scholar] [CrossRef]
  9. Zhang, J.; Zhang, X.-H.; Wang, C.-X.; Liu, B.; Fan, X.-S.; Wen, J.-J.; Shi, Q.-L.; Zhou, X.-J. Dysregulation of microRNA biosynthesis enzyme Dicer plays an important role in gastric cancer progression. Int. J. Clin. Exp. Pathol. 2014, 7, 1702–1707. [Google Scholar] [PubMed]
  10. Baylor, P.; Mouton, A.; Shamoon, H.H.; Goebel, P. Increased norepinephrine variability in patients with sleep apnea syndrome. Am. J. Med. 1995, 99, 611–615. [Google Scholar] [CrossRef]
  11. Ziegler, M.G.; Nelesen, R.; Mills, P.; Ancoli-Israel, S.; Kennedy, B.; Dimsdale, J.E. Sleep apnea, norepinephrine-release rate, and daytime hypertension. Sleep 1997, 20, 224–231. [Google Scholar] [CrossRef] [PubMed] [Green Version]
  12. Semenza, G.L.; Prabhakar, N.R. Neural regulation of hypoxia-inducible factors and redox state drives the pathogenesis of hypertension in a rodent model of sleep apnea. J. Appl. Physiol. 2015, 119, 1152–1156. [Google Scholar] [CrossRef] [PubMed] [Green Version]
  13. Khurana, S.; Peng, S.; McDonald, E.; Yates, W.; Venkataraman, K.; Tai, T.C. Phenylethanolamine N-methyltransferase gene expression in PC12 cells exposed to intermittent hypoxia. Neurosci. Lett. 2018, 666, 169–174. [Google Scholar] [CrossRef] [PubMed]
  14. Nurse, C.A.; Salman, S.; Scott, A.L. Hypoxia-regulated catecholamine secretion in chromaffin cells. Cell Tissue Res. 2018, 372, 433–441. [Google Scholar] [CrossRef]
  15. Makarenko, V.V.; Peng, Y.J.; Khan, S.A.; Nanduri, J.; Fox, A.P.; Prabhakar, N.R. Long-term facilitation of catecholamine secretion from adrenal chromaffin cells of neonatal rats by chronic intermittent hypoxia. J. Neurophysiol. 2019, 122, 1874–1883. [Google Scholar] [CrossRef]
  16. Gridina, A.; Su, X.; Khan, S.A.; Peng, Y.J.; Wang, B.; Nanduri, J.; Fox, A.P.; Prabhakar, N.R. Gaseous transmitter regulation of hypoxia-evoked catecholamine secretion from murine adrenal chromaffin cells. J. Neurophysiol. 2021, 125, 1533–1542. [Google Scholar] [CrossRef]
  17. Grobecker, H.; Roizen, M.F.; Weise, V.; Saavedra, J.M.; Kopin, I.J. Sympathoadrenal medullary activity in young, spontaneously hypertensive rats. Nature 1975, 258, 267. [Google Scholar] [CrossRef]
  18. Grobecker, H.; Saavedra, J.M.; Weise, V.K. Biosynthetic enzyme activities and catecholamines in adrenal glands of genetic and experimental hypertensive rats. Circ. Res. 1982, 50, 742–746. [Google Scholar] [CrossRef] [Green Version]
  19. Moura, E.; Pinho Costa, P.M.; Moura, D.; Guimarães, S.; Vieira-Coelho, M.A. Decreased tyrosine hydroxylase activity in the adrenals of spontaneously hypertensive rats. Life Sci. 2005, 76, 2953–2964. [Google Scholar] [CrossRef]
  20. Nakamura, K.; Nakamura, K. Enhanced sympathetic activity in young spontaneously hypertensive rats is not the trigger mechanism for genetic hypertension. Naunyn-Schmiedeberg’s Arch. Pharmacol. 1977, 299, 143–148. [Google Scholar] [CrossRef]
  21. Teitelman, G.; Ross, R.A.; Joh, T.H.; Reis, D.J. Differences in utero in activities of catecholamine biosynthetic enzymes in adrenals of spontaneously hypertensive rats. Clin. Sci. 1981, 61, 227s–230s. [Google Scholar] [CrossRef] [Green Version]
  22. Kumai, T.; Tanaka, M.; Watanabe, M.; Kobayashi, S. Elevated tyrosine hydroxylase mRNA levels in the adrenal medulla of spontaneously hypertensive rats. Jpn. J. Pharmacol. 1994, 65, 367–369. [Google Scholar] [CrossRef] [PubMed] [Green Version]
  23. Yamada, H.; De Jong, W.; Lovenberg, W. Further studies on catecholamine synthesis in the spontaneously hypertensive rat: Catecholamine synthesis in the central nervous system. Eur. J. Pharmacol. 1973, 22, 91–98. [Google Scholar] [CrossRef]
  24. Nagatsu, T.; Kato, T.; Numata, Y.; Ikuta, K.; Umezawa, H.; Matsuzaki, M.; Takeuchi, T. Serum dopamine β-hydroxylase activity in developing hypertensive rats. Nature 1974, 251, 630–631. [Google Scholar] [CrossRef] [PubMed]
  25. Nagatsu, T.; Ikuta, K.; Numata, Y.; Kato, T.; Sano, M. Vascular and brain dopamine β-hydroxylase activity in young spontaneously hypertensive rats. Science 1976, 191, 290–291. [Google Scholar] [CrossRef]
  26. Ciaranello, R.D.; Hoffman, H.J.; Shire, J.G.; Axelrod, J. Genetic regulation of the catecholamine biosynthetic enzymes. II. Inheritance of tyrosine hydroxylase, Dopamine-β-hydroxylase, and phenylethanolamine N-methyltransferase. J. Biol. Chem. 1974, 249, 4528–4536. [Google Scholar] [CrossRef]
  27. Esteller, M. Non-coding RNAs in human disease. Nat. Rev. Genet. 2011, 12, 861–874. [Google Scholar] [CrossRef]
  28. Poy, M.N.; Hausser, J.; Trajkovski, M.; Braun, M.; Collins, S.; Rorsman, P.; Zavolan, M.; Stoffel, M. miR-375 maintains normal pancreatic α- and β-cell mass. Proc. Natl. Acad. Sci. USA 2009, 106, 5813–5818. [Google Scholar] [CrossRef] [Green Version]
  29. Frank, A.-C.; Ebersberger, S.; Fink, A.F.; Lampe, S.; Weigert, A.; Schmid, T.; Ebersberger, I.; Syed, S.N.; Brüne, B. Apoptotic tumor cell-derived microRNA-375 uses CD36 to alter the tumor-associated macrophage phenotype. Nat. Commun. 2019, 10, 1135. [Google Scholar] [CrossRef] [Green Version]
  30. Zhang, J.; Gao, J.; Zhang, D.; Liu, H.; Gou, K.; Cui, S. miR-375 acts as a novel factor modulating pituitary prolactin synthesis through Rasd1 and Esr1. J. Endocrinol. 2021, 250, 25–35. [Google Scholar] [CrossRef]
  31. Yang, X.; Nanayakkara, J.; Claypool, D.; Saghafinia, S.; Wong, J.J.M.; Xu, M.; Wang, X.; Nicol, C.J.B.; Michael, I.P.; Hafner, M.; et al. A miR-375/YAP axis regulates neuroendocrine differentiation and tumorigenesis in lung carcinoid cells. Sci. Rep. 2021, 11, 10455. [Google Scholar] [CrossRef] [PubMed]
  32. Xu, J.-Y.; Song, W.; Lu, F.-F.; Dai, Z.-J.; Cao, L.-H.; Lin, S. miR-375 inhibits the proliferation and invasion of nasopharyngeal carcinoma cells by suppressing PDK1. Biomed. Res. Int. 2020, 2020, 9704245. [Google Scholar] [CrossRef] [PubMed]
  33. Wu, W.; Zhang, Y.; Li, X.; Wang, X.; Yuan, Y. miR-375 inhibits the proliferation, migration and invasion of esophageal squamouse cell carcinoma by targeting XPR1. Curr. Gene Ther. 2021, 21, 290–298. [Google Scholar] [CrossRef] [PubMed]
  34. Sánchez-de-la-Torre, M.; Khalyfa, A.; Sánchez-de-la-Torre, A.; Martinez-Alonso, M.; Martinez-García, M.Á.; Barceló, A.; Lloberes, P.; Campos-Rodriguez, F.; Capote, F.; Diaz-de-Atauri, M.J.; et al. Precision medicine in patients with resistant hypertension and obstructive sleep apnea: Blood pressure response to continuous positive airway pressure treatment. J. Am. Coll. Cardiol. 2015, 66, 1023–1032. [Google Scholar] [CrossRef] [Green Version]
  35. Bouça, B.; Bogalho, P.; Rizzo, M.; Silva-Nunes, J. The role of metabolome and non-coding RNA on pheochromocytomas and paragangliomas: An update. Metabolites 2022, 12, 131. [Google Scholar] [CrossRef]
  36. Chen, X.; Li, B.; Luo, R.; Cai, S.; Zhang, C.; Cao, X. Analysis of the function of microRNA-375 in humans using bioinformatics. Biomed. Rep. 2017, 6, 561–566. [Google Scholar] [CrossRef]
  37. Zhang, L.; Liu, J.; Cheng, P.; Lv, F. Correlation between miRNA target site polymorphisms in the 3′ UTR of AVPR1A and the risk of hypertension in the Chinese Han population. Biosci. Rep. 2019, 39, BSR20182232. [Google Scholar] [CrossRef] [Green Version]
  38. Nakazawa, T.; Takasawa, S.; Noguchi, N.; Nata, K.; Tohgo, A.; Mori, M.; Nakagawara, K.; Akiyama, T.; Ikeda, T.; Yamauchi, A.; et al. Genomic organization, chromosomal localization, and promoter of human gene for FK506-binding protein 12.6. Gene 2005, 360, 55–64. [Google Scholar] [CrossRef]
  39. Takasawa, S.; Kuroki, M.; Nata, K.; Noguchi, N.; Ikeda, T.; Yamauchi, A.; Ota, H.; Itaya-Hironaka, A.; Sakuramoto-Tsuchida, S.; Takahashi, I.; et al. A novel ryanodine receptor expressed in pancreatic islets by alternative splicing from type 2 ryanodine receptor gene. Biochem. Biophys. Res. Commun. 2010, 397, 140–145. [Google Scholar] [CrossRef]
  40. Shobatake, R.; Takasawa, K.; Ota, H.; Itaya-Hironaka, A.; Yamauchi, A.; Sakuramoto-Tsuchida, S.; Uchiyama, T.; Makino, M.; Sugie, K.; Takasawa, S.; et al. Up-regulation of POMC and CART mRNAs by intermittent hypoxia via GATA transcription factors in human neuronal cells. Int. J. Biochem. Cell Biol. 2018, 95, 100–107. [Google Scholar] [CrossRef]
  41. Ota, H.; Tamaki, S.; Itaya-Hironaka, A.; Yamauchi, A.; Sakuramoto-Tsuchida, S.; Morioka, T.; Takasawa, S.; Kimura, H. Attenuation of glucose-induced insulin secretion by intermittent hypoxia via down-regulation of CD38. Life Sci. 2012, 90, 206–211. [Google Scholar] [CrossRef] [PubMed]
  42. Ota, H.; Itaya-Hironaka, A.; Yamauchi, A.; Sakuramoto-Tsuchida, S.; Miyaoka, T.; Fujimura, T.; Tsujinaka, H.; Yoshimoto, K.; Nakagawara, K.; Tamaki, S.; et al. Pancreatic β cell proliferation by intermittent hypoxia via up-regulation of Reg family genes and HGF gene. Life Sci. 2013, 93, 664–672. [Google Scholar] [CrossRef] [PubMed]
  43. Uchiyama, T.; Ota, H.; Itaya-Hironaka, A.; Shobatake, R.; Yamauchi, A.; Sakuramoto-Tsuchida, S.; Makino, M.; Kimura, H.; Takeda, M.; Ohbayashi, C.; et al. Up-regulation of selenoprotein P and HIP/PAP mRNAs in hepatocytes by intermittent hypoxia via down-regulation of miR-203. Biochem. Biophys. Rep. 2017, 11, 130–137. [Google Scholar] [CrossRef]
  44. Kyotani, Y.; Itaya-Hironaka, A.; Yamauchi, A.; Sakuramoto-Tsuchida, S.; Makino, M.; Takasawa, S.; Yoshizumi, M. Intermittent hypoxia-induced epiregulin expression by IL-6 production in human coronary artery smooth muscle cells. FEBS Open Bio 2018, 8, 868–876. [Google Scholar] [CrossRef] [PubMed] [Green Version]
  45. Uchiyama, T.; Itaya-Hironaka, A.; Yamauchi, A.; Makino, M.; Sakuramoto-Tsuchida, S.; Shobatake, R.; Ota, H.; Takeda, M.; Ohbayashi, C.; Takasawa, S. Intermittent hypoxia up-regulates CCL2, RETN, and TNFα mRNAs in adipocytes via down-regulation of miR-452. Int. J. Mol. Sci. 2019, 20, 1960. [Google Scholar] [CrossRef] [PubMed] [Green Version]
  46. Shobatake, R.; Itaya-Hironaka, A.; Yamauchi, A.; Makino, M.; Sakuramoto-Tsuchida, S.; Uchiyama, T.; Ota, H.; Takahashi, N.; Ueno, S.; Sugie, K.; et al. Intermittent hypoxia up-regulates gene expressions of peptide YY (PYY), glucagon-like peptide-1 (GLP-1), and neurotensin (NTS) in enteroendocrine cells. Int. J. Mol. Sci. 2019, 20, 1849. [Google Scholar] [CrossRef] [Green Version]
  47. Murphy, A.M.; Thomas, A.; Crinion, S.J.; Kent, B.D.; Tambuwala, M.M.; Fabre, A.; Pepin, J.-L.; Roche, H.M.; Arnaud, C.; Ryan, S. Intermittent hypoxia in obstructive sleep apnoea mediates insulin resistance through adipose tissue inflammation. Eur. Respir. J. 2017, 49, 1601731. [Google Scholar] [CrossRef] [Green Version]
  48. Ota, H.; Takasawa, S.; Yamauchi, M.; Yoshikawa, M.; Tomoda, K.; Kimura, H. Intermittent hypoxia in pancreatic beta cells. Pancreat. Disord. Ther. 2015, 5, S5-004. [Google Scholar] [CrossRef] [Green Version]
  49. Tohma, Y.; Dohi, Y.; Shobatake, R.; Uchiyama, T.; Takeda, M.; Takasawa, S.; Tanaka, Y.; Ohgushi, H. Reg gene expression in periosteum after fracture and its in vitro induction triggered by IL-6. Int. J. Mol. Sci. 2017, 18, 2257. [Google Scholar] [CrossRef] [Green Version]
  50. Takasawa, S.; Tsuchida, C.; Sakuramoto-Tsuchida, S.; Takeda, M.; Itaya-Hironaka, A.; Yamauchi, A.; Misu, M.; Shobatake, R.; Uchiyama, T.; Makino, M.; et al. Expression of human REG family genes in inflammatory bowel disease and their molecular mechanism. Immunol. Res. 2018, 66, 800–805. [Google Scholar] [CrossRef]
  51. Akasaka, J.; Naruse, K.; Sado, T.; Uchiyama, T.; Makino, M.; Yamauchi, A.; Ota, H.; Sakuramoto-Tsuchida, S.; Itaya-Hironaka, A.; Takasawa, S.; et al. Involvement of receptor for advanced glycation endproducts in hypertensive disorders of pregnancy. Int. J. Mol. Sci. 2019, 20, 5462. [Google Scholar] [CrossRef] [PubMed] [Green Version]
  52. Takasawa, S.; Tohgo, A.; Noguchi, N.; Koguma, T.; Nata, K.; Sugimoto, T.; Yonekura, H.; Okamoto, H. Synthesis and hydrolysis of cyclic ADP-ribose by human leukocyte antigen CD38 and inhibition of the hydrolysis by ATP. J. Biol. Chem. 1993, 268, 26052–26054. [Google Scholar] [CrossRef]
  53. Yoshimoto, K.; Fujimoto, T.; Itaya-Hironaka, A.; Miyaoka, T.; Sakuramoto-Tsuchida, S.; Yamauchi, A.; Takeda, M.; Kasai, T.; Nakagawara, K.; Nonomura, A.; et al. Involvement of autoimmunity to REG, a regeneration factor, in patients with primary Sjögren’s syndrome. Clin. Exp. Immunol. 2013, 174, 1–9. [Google Scholar] [CrossRef]
  54. Kato, I.; Yamamoto, Y.; Fujimura, M.; Noguchi, N.; Takasawa, S.; Okamoto, H. CD38 disruption impairs glucose-induced increases in cyclic ADP-ribose, [Ca2+]i, and insulin secretion. J. Biol. Chem. 1999, 274, 1869–1872. [Google Scholar] [CrossRef] [PubMed] [Green Version]
  55. Ikehata, F.; Satoh, J.; Nata, K.; Tohgo, A.; Nakazawa, T.; Kato, I.; Kobayashi, S.; Akiyama, T.; Takasawa, S.; Toyota, T.; et al. Autoantibodies against CD38 (ADP-ribosyl cyclase/cyclic ADP-ribose hydrolase) that impair glucose-induced insulin secretion in noninsulin-dependent diabetes patients. J. Clin. Investig. 1998, 102, 395–401. [Google Scholar] [CrossRef] [PubMed] [Green Version]
  56. Shervani, N.J.; Takasawa, S.; Uchigata, Y.; Akiyama, T.; Nakagawa, K.; Noguchi, N.; Takada, H.; Takahashi, I.; Yamauchi, A.; Ikeda, T.; et al. Autoantibodies to REG, a beta-cell regeneration factor, in diabetic patients. Eur. J. Clin. Investig. 2004, 34, 752–758. [Google Scholar] [CrossRef]
Figure 1. The mRNA levels of Th (A), Ddc (B), Dbh (C), and Pnmt (D) in mouse Neuro-2a cells subjected to normoxia or IH for 24 h. The levels of the catecholamine-synthesizing enzyme mRNAs were measured by means of a real-time RT-PCR using rat insulinoma gene (Rig)/ribosomal protein S15 (Rps15) as an endogenous control. The data are expressed as the mean ± SE for each group of six independent experiments (n = 6). The statistical analyses were performed using Student’s t-test.
Ijms 23 05868 g001
Figure 2. The mRNA levels of TH (A), DDC (B), DBH (C), and PNMT (D) in human NB-1 cells subjected to normoxia or IH for 24 h. The levels of the mRNAs were measured by means of a real-time RT-PCR using β-actin as an endogenous control. The data are expressed as the mean ± SE for each group of six independent experiments (n = 6). The statistical analyses were performed using Student’s t-test.
Ijms 23 05868 g002
Figure 3. Relative protein expression of DBH in human NB-1 neuroblastoma cells subjected to IH. A representative immunoblot is shown in the right panel. The relative expression of DBH is arbitrarily presented. The DBH band densities were quantified using an image analysis and then normalized to β-actin, as measured in the same blot. Each bar represents the mean values of six independent experiments. The results are expressed as the mean ± SE in arbitrary units.
Ijms 23 05868 g003
Figure 4. Relative protein expression of PNMT in human NB-1 neuroblastoma cells subjected to IH. A representative immunoblot is shown in the right panel. The relative expression of PNMT is arbitrarily presented. The PNMT band densities were quantified using an image analysis and then normalized to β-actin, as measured in the same blot. Each bar represents the mean values of six independent experiments. The results are expressed as the mean ± SE in arbitrary units.
Ijms 23 05868 g004
Figure 5. Promoter activities of DBH (A) and PNMT (B) in human NB-1 neuroblastoma cells. Reporter plasmids prepared by inserting the promoter fragments of DBH (−1018–+10) and PNMT (−600–+67) up-stream of a firefly luciferase reporter gene in a pGL4.17 vector were transfected into the NB-1 cells. After the cells were exposed to either IH or normoxia for 24 h, they were lysed, and the promoter activities of DBH and PNMT were measured. All data are presented as the mean ± SE of the samples of six independent experiments (n = 6). The statistical analyses were performed using Student’s t-test.
Ijms 23 05868 g005
Figure 6. The levels of miR-375 (A) and Dicer mRNA (B) in human NB-1 cells subjected to normoxia or IH for 24 h. The levels of miR-375 and Dicer mRNA were measured by means of a real-time RT-PCR using U6 (for the miR-375) and β-actin (for the Dicer) as endogenous controls. The data are expressed as the mean ± SE for each group of six independent experiments (n = 6). The statistical analyses were performed using Student’s t-test.
Ijms 23 05868 g006
Figure 7. Effects of the miR-375 mimic transfection on DBH and PNMT expression. The miR-375 mimic and the non-specific control RNA (miR-375 mimic NC) were introduced into the NB-1 cells using Lipofectamine® RNAiMAX just before the IH/normoxia exposure, and the mRNA levels of DBH and PNMT were measured by means of a real-time RT-PCR, as described in the “Materials and Methods” section, using β-actin as an endogenous control. The data are expressed as the mean ± SE for each group of six independent experiments (n = 6). The statistical analyses were performed using Student’s t-test.
Ijms 23 05868 g007
Table 1. PCR primers (mouse) for the real-time RT-PCR.
Target mRNAPrimer Sequence
Th (NM_009377)5′-GCCAAGGACAAGCTCAGGAAC-3′
5′-ATCAATGGCCAGGGTGTACG-3′
Ddc (NM_001190448)5′-CTGCAGGCTTACATCCGAA-3′
5′-TTGATCTCTGAAGCAGCT-3′
Dbh (NM_138942)5′-GACTCAACTACTGCCGGCACGT-3′
5′-CTGGGTGCACTTGTCTGTGCAGT-3′
Pnmt (NM_008890)5′-GTGAAGCGAGTCCTGCCTATC-3′
5′-AAGATGCCTTTGACATCATCTACC-3′
Rig/RpS15 (NM_009091)5′-ACGGCAAGACCTTCAACCAG-3′
5′-ATGGAGAACTCGCCCAGGTAG-3′
Table 2. PCR primers (human) for the real-time RT-PCR.
Target mRNA/MiRPrimer Sequence
TH (NM_199292)5′-GGAGTTCGGGCTGTGTAAGCA-3′
5′-GACTGGTACGTCTGGTCTTGGTAGG-3′
DDC (NM_001082971)5′-GAACAGACTTAACGGGAGCCTTT-3′
5′-AATGCCGGTAGTCAGTGATAAGC-3′
DBH (NM_000787)5′-GTGCTACATTAAGGAGCTTCCAAAG-3’
5′-GGCCTCATTGCCCTTGGT-3′
PNMT (NM_002686)5′-CTGACTCGGCCCCGGGCCAG-3′
5′-GGCCTCCCCAGCCAGGTACC-3′
Dicer (NM_177438)5′-GAGCTGTCCTATCAGATCAGGG-3′
5′-ACTTGTTGAGCAACCTGGTTT-3′
β-actin (NM_001101)5′-GCGAGAAGATGACCCAGA-3′
5′-CAGAGGCGTACAGGGATA-3′
miR-375 (NR_029867)5′-AGCCGTTTGTTCGTTCGGCT-3′
5′-GTGCAGGGTCCGAGGT-3′
U6 (NR_004394)5′-CTCGCTTCGGCAGCACA-3′
5′-AACGCTTCACGAATTTGCGT-3′
Publisher’s Note: MDPI stays neutral with regard to jurisdictional claims in published maps and institutional affiliations.

