
Characterisation of Extracellular Vesicles from Equine Mesenchymal Stem Cells

 , and
, and 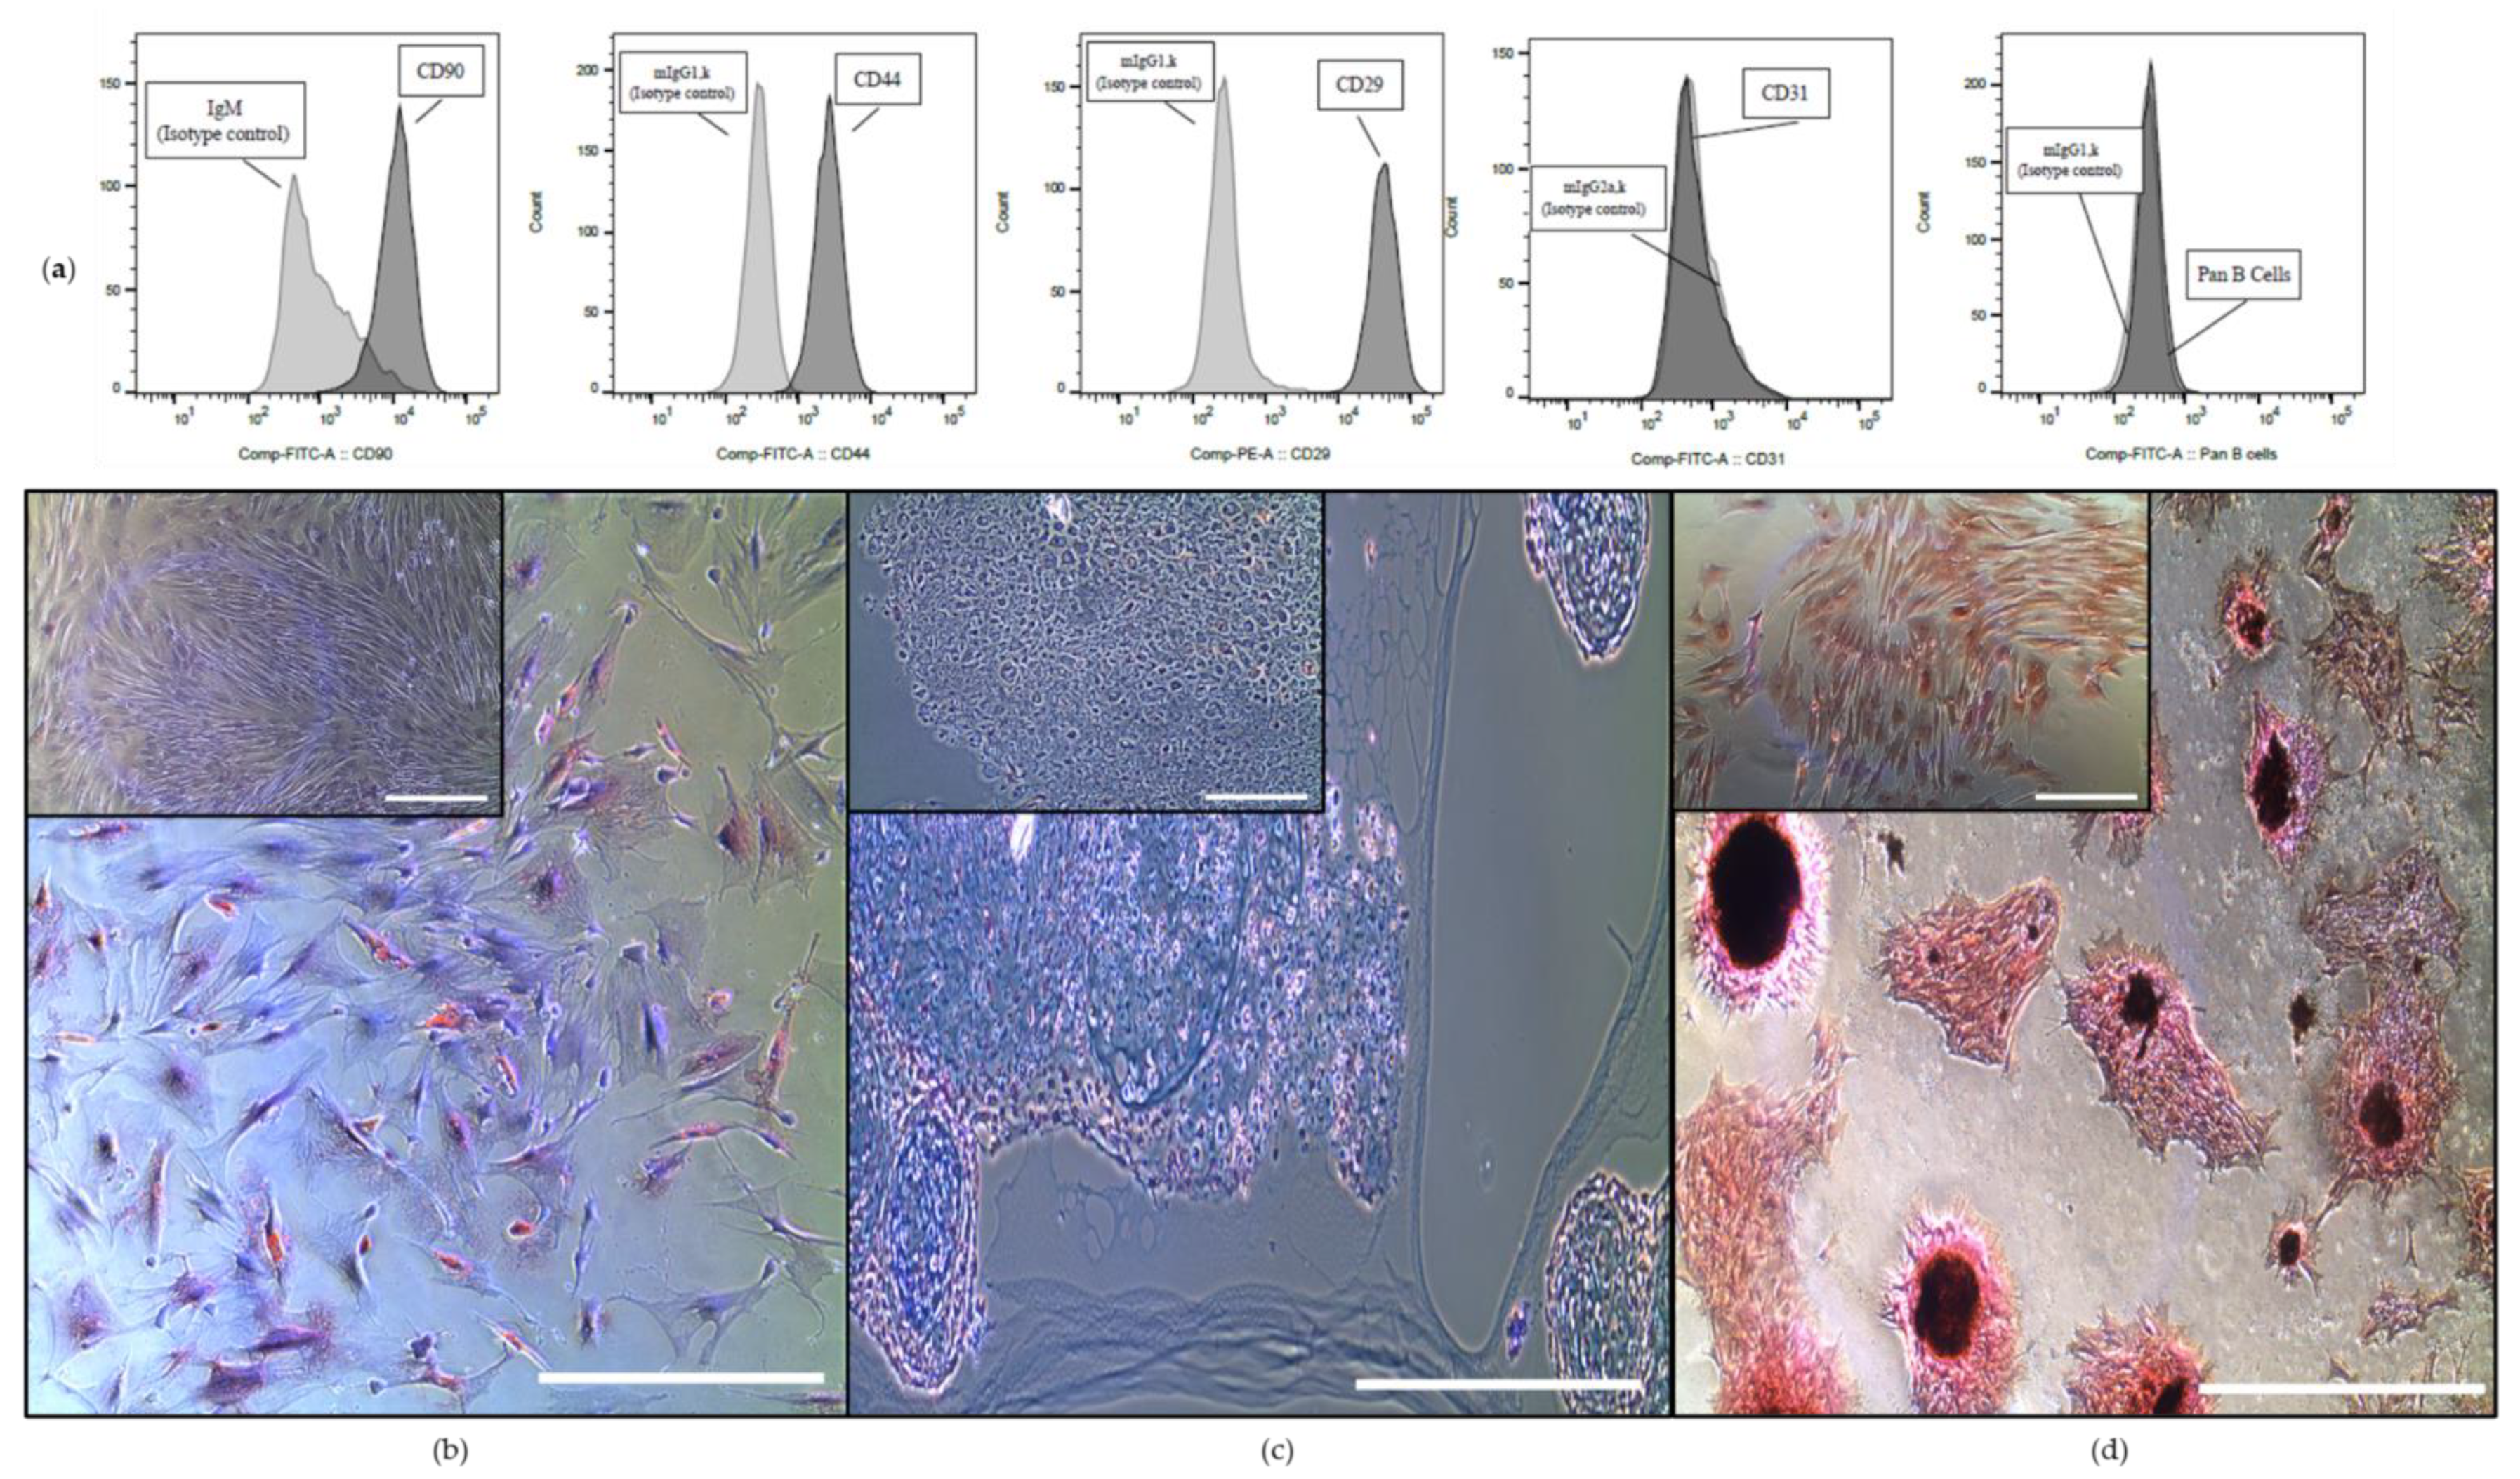
Abstract
:1. Introduction
2. Results
2.1. Cells Isolated from Equine Bone Marrow Show Distinct MSCs Characteristics
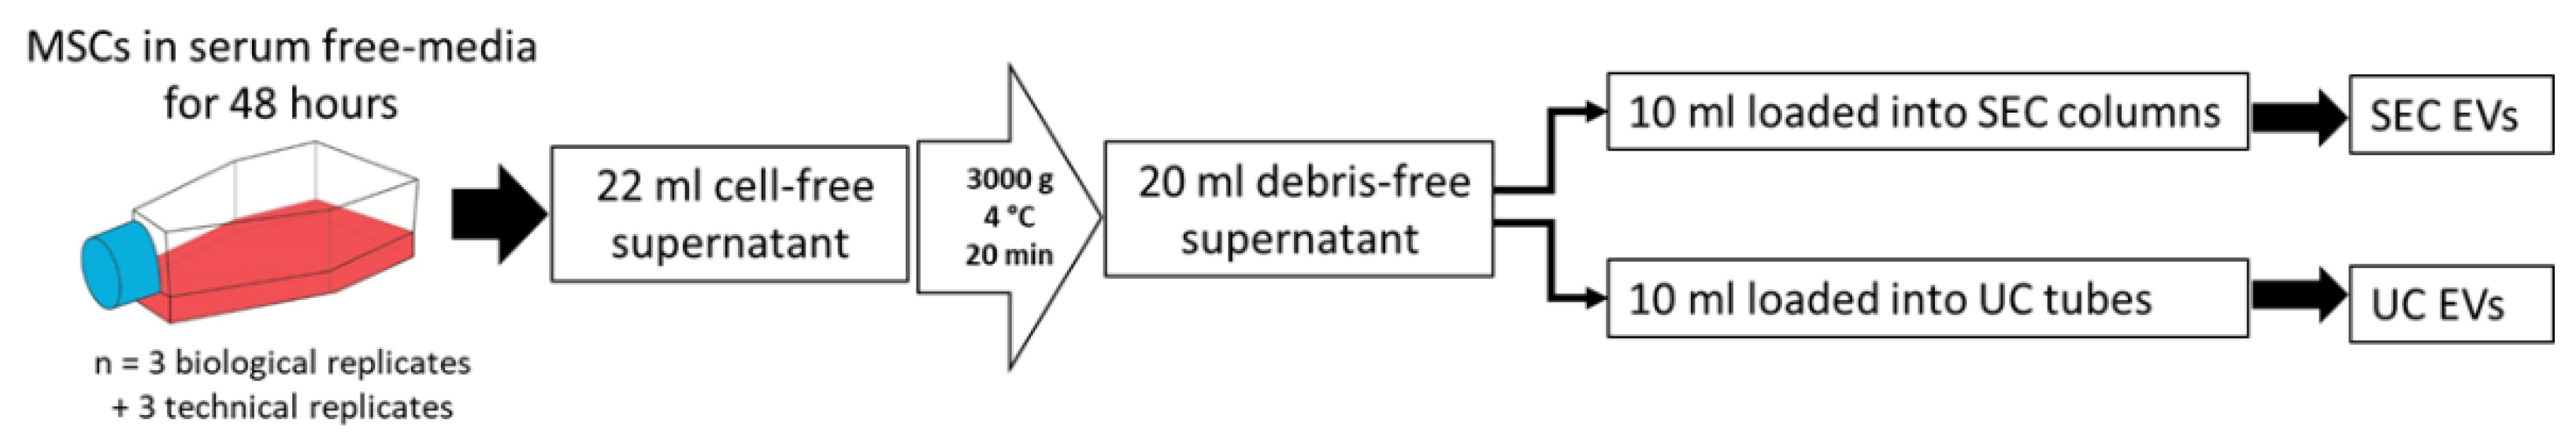
2.2. EV Isolation Strategy
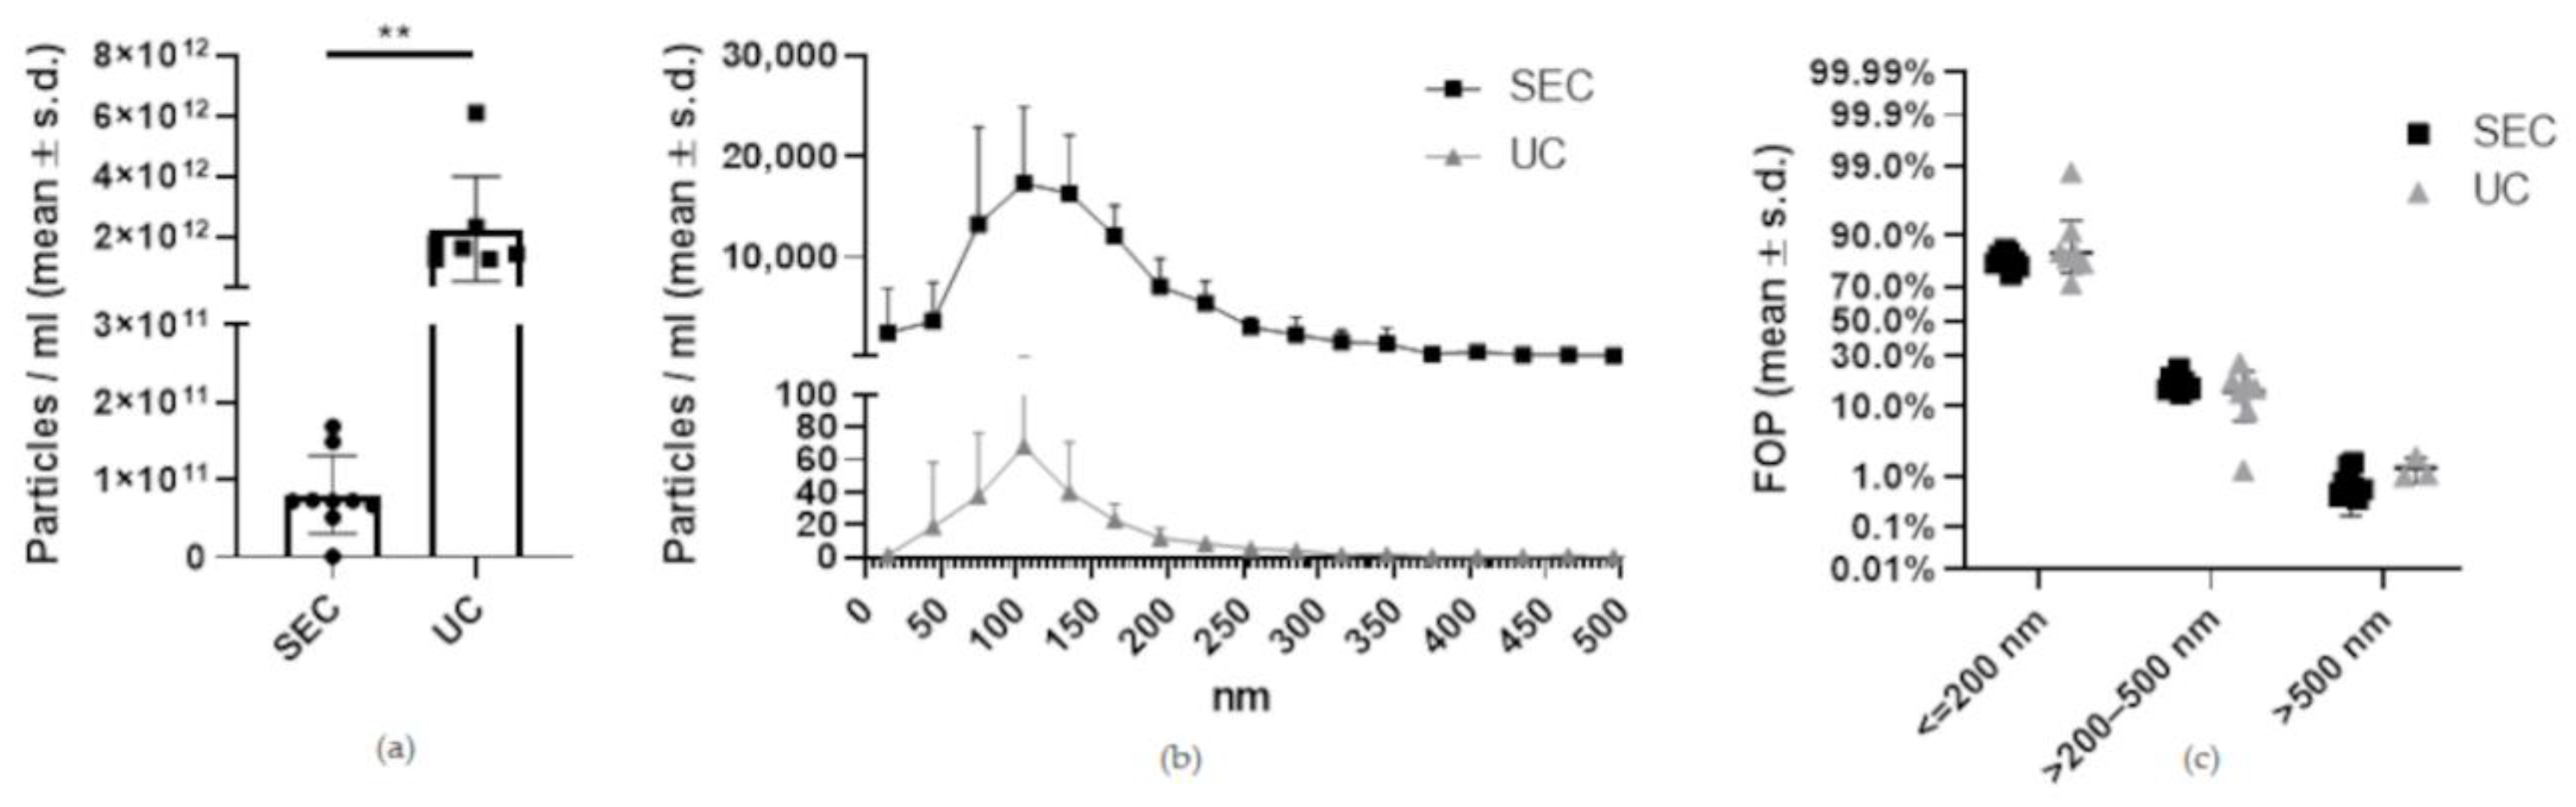
2.3. Nanotracking Analysis Shows Significantly Higher EV Yield by UC Compared to SEC
2.4. Fluorescence-Triggered Flow Cytometry Shows a Significantly Higher Yield of CMG and CD81-Positive Particles by UC Compared to SEC
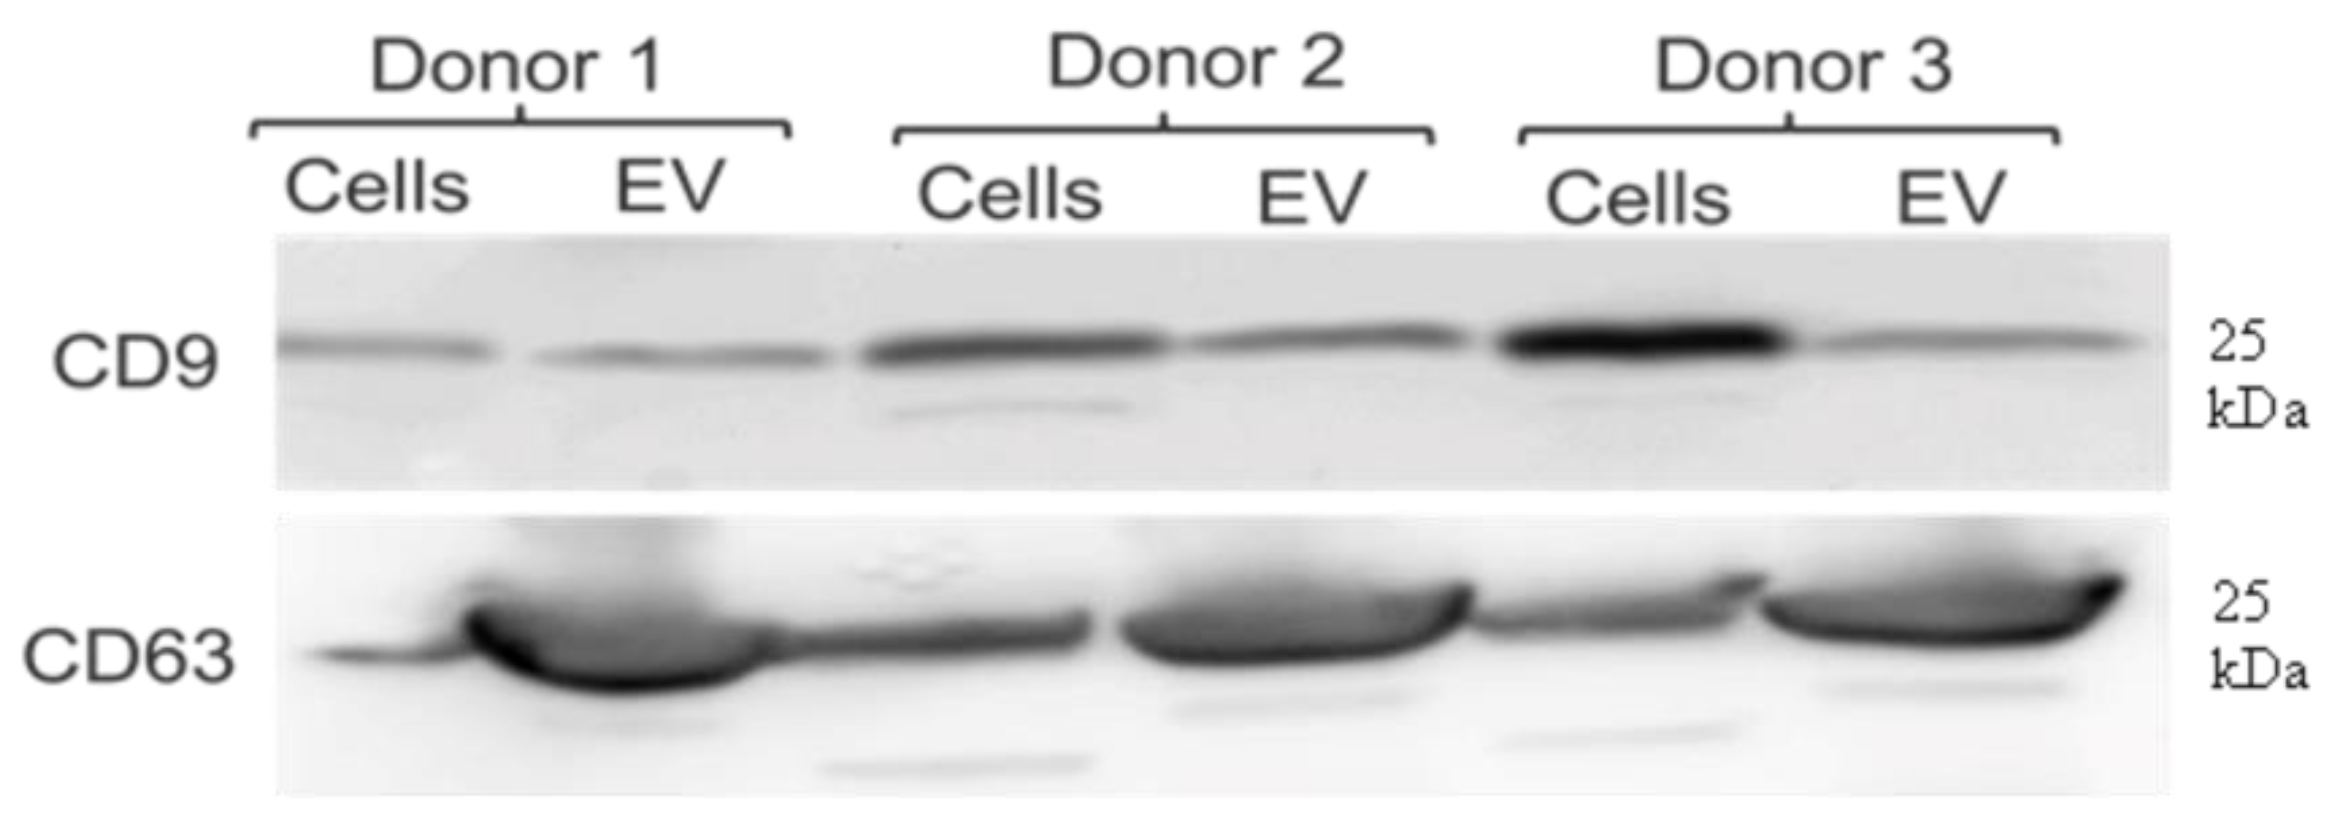
2.5. Western Blot Shows Positive Signals for Two Tetraspanins to Which Cross-Species Reactive Antibodies Are Available
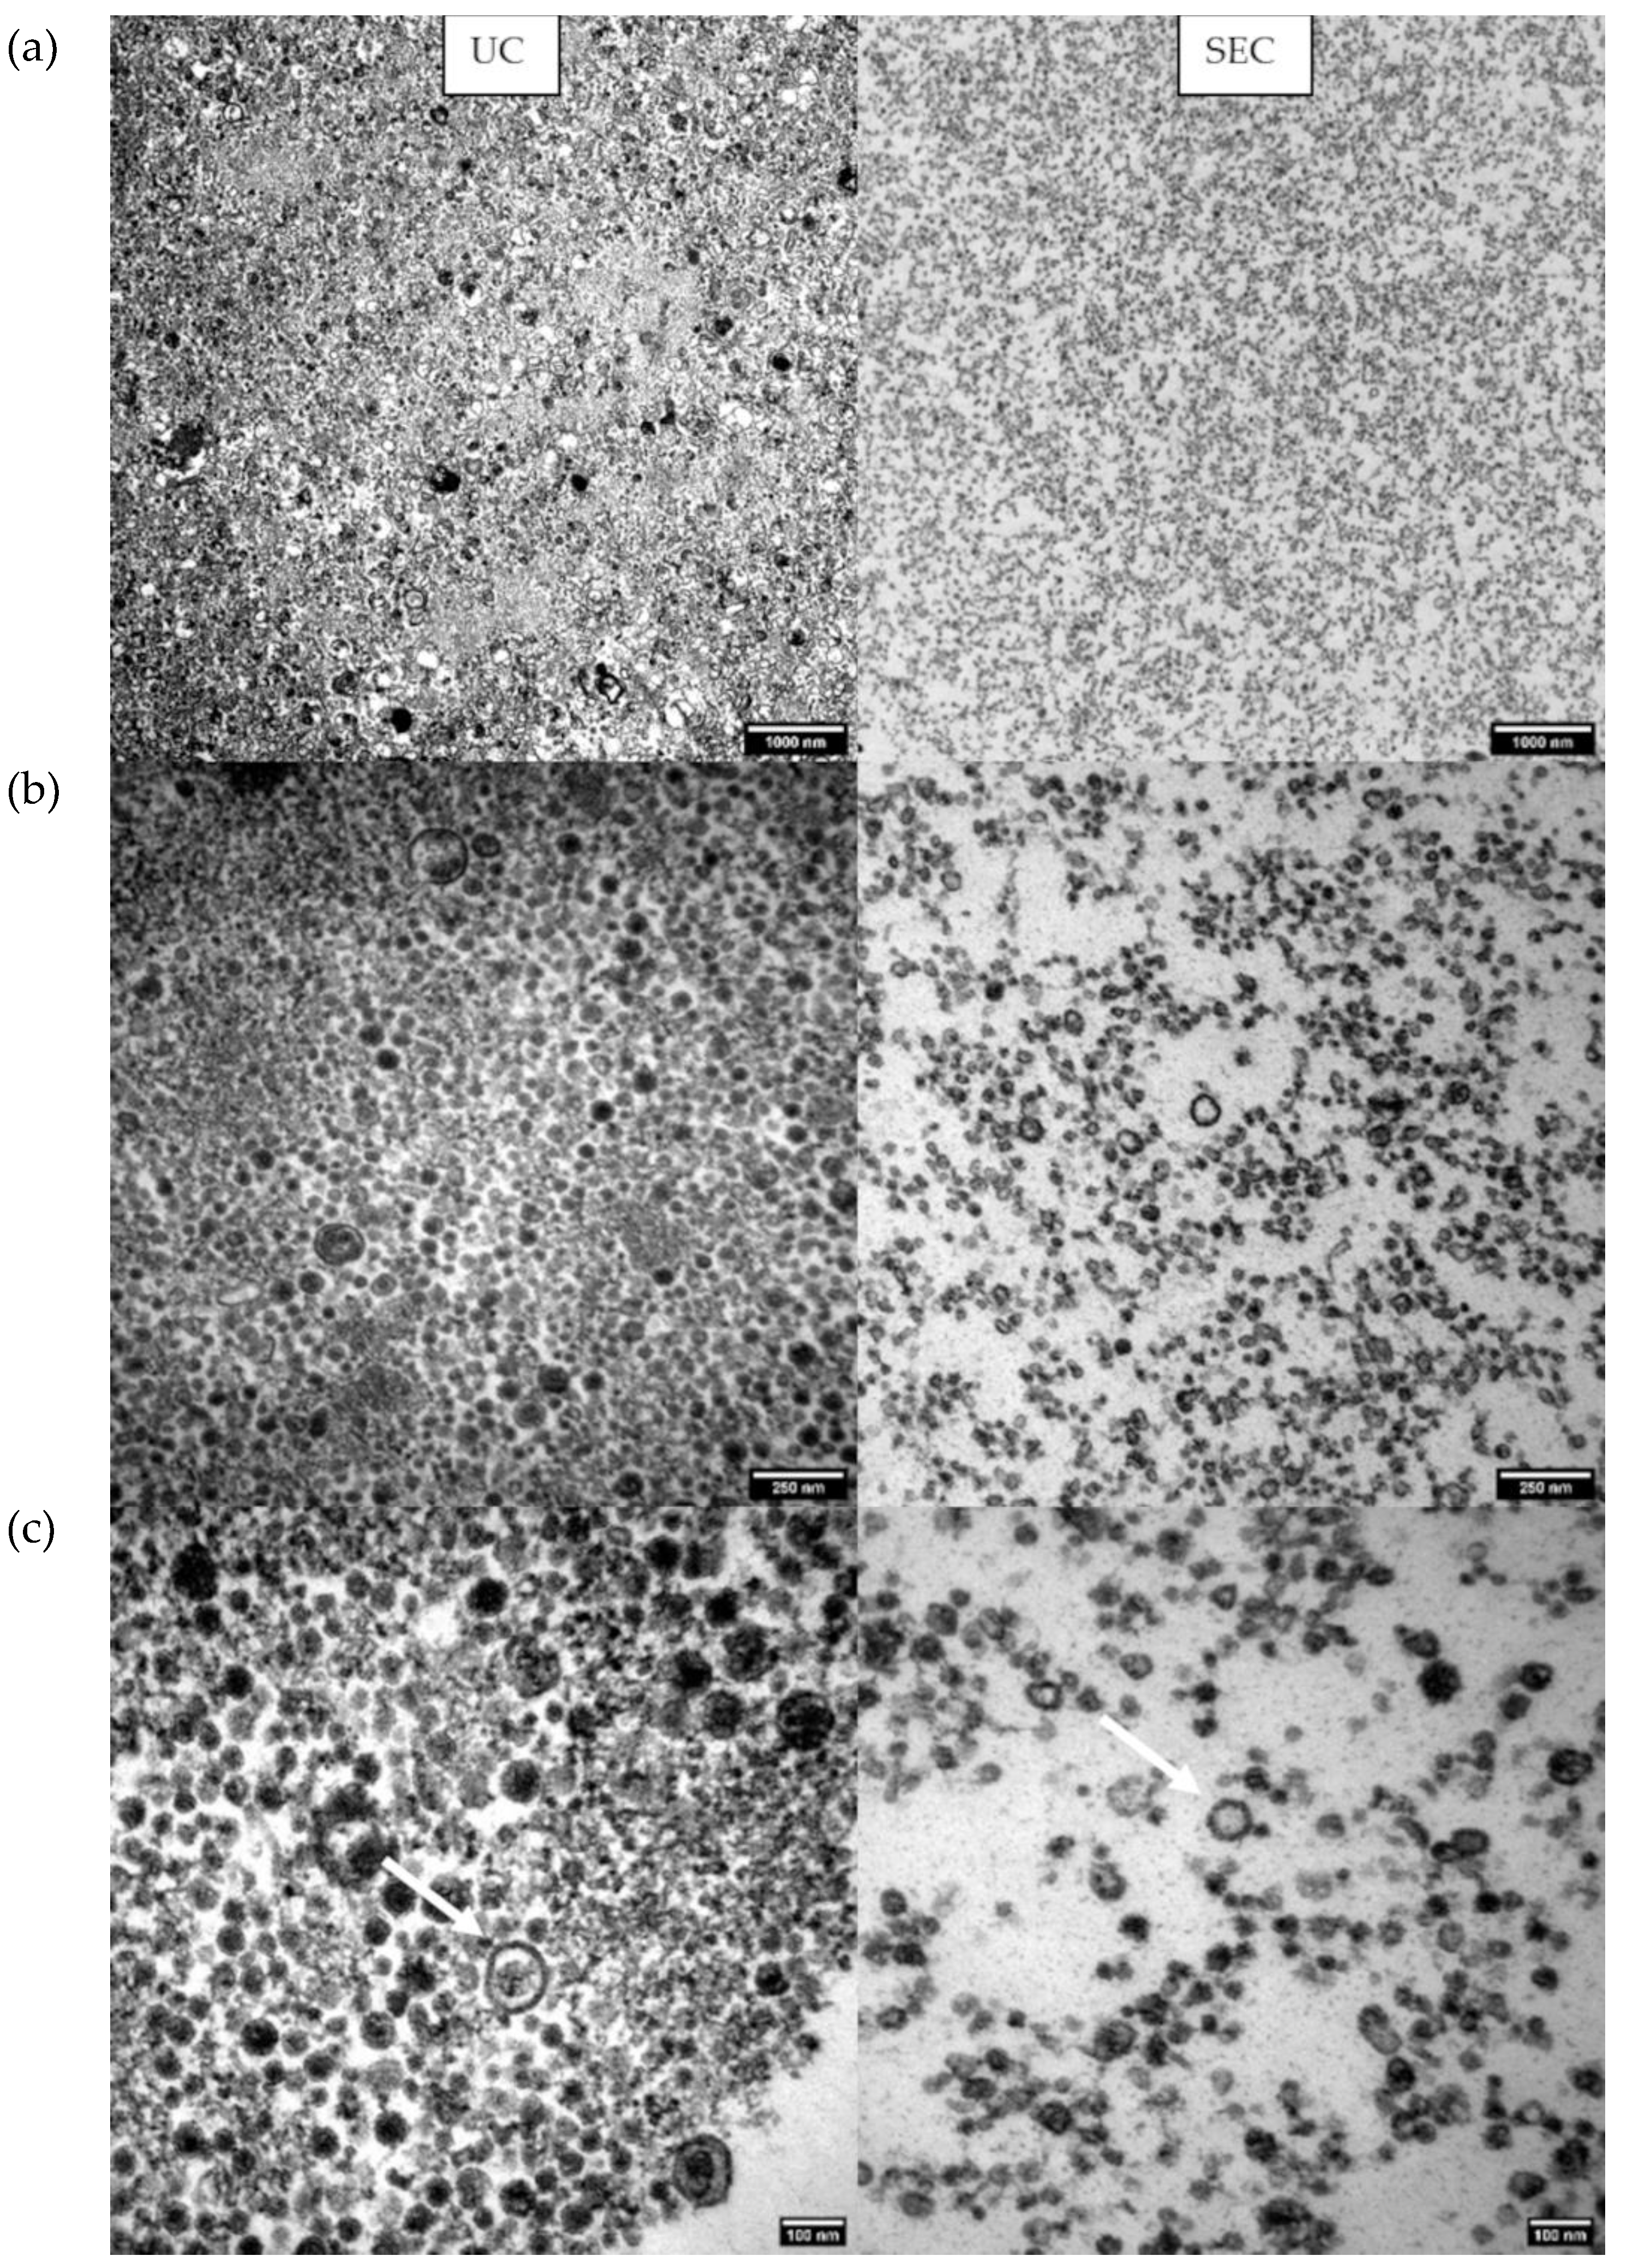
2.6. Transelectron Microscopy (TEM) Shows Particle Morphology
3. Discussion
4. Materials and Methods
4.1. Bone Marrow Collection and MSC Isolation
4.2. Trilineage Differentiation
4.3. Staining Protocols
4.3.1. Oil Red Staining
4.3.2. Alcian Blue Staining
4.3.3. Von Kossa Stain
4.4. EV Isolation
4.4.1. Sequential Ultracentrifugation
4.4.2. Size Exclusion Chromatography (SEC)
4.5. Nanotracking Analysis
4.6. Flow Cytometry
4.6.1. MSCs
4.6.2. EVs (Fluorescence-Triggered Flow Cytometry (FT-FC))
4.7. Western Blot
4.7.1. Protein Extraction
4.7.2. Western Blotting
4.7.3. Membrane Stripping
4.8. Transelectron Microscopy
4.9. Statistical Analysis
Author Contributions
Funding
Institutional Review Board Statement
Informed Consent Statement
Data Availability Statement
Acknowledgments
Conflicts of Interest
References
- Gugjoo, M.B.; Amarpal; Makhdoomi, D.M.; Sharma, G.T. Equine Mesenchymal Stem Cells: Properties, Sources, Characterization, and Potential Therapeutic Applications. J. Equine Veter- Sci. 2018, 72, 16–27. [Google Scholar] [CrossRef] [PubMed]
- Secunda, R.; Vennila, R.; Mohanashankar, A.M.; Rajasundari, M.; Jeswanth, S.; Surendran, R. Isolation, expansion and characterisation of mesenchymal stem cells from human bone marrow, adipose tissue, umbilical cord blood and matrix: A comparative study. Cytotechnology 2014, 67, 793–807. [Google Scholar] [CrossRef] [PubMed]
- Broeckx, S.Y.; Martens, A.M.; Bertone, A.L.; Van Brantegem, L.; Duchateau, L.; Van Hecke, L.; Dumoulin, M.; Oosterlinck, M.; Chiers, K.; Hussein, H.; et al. The use of equine chondrogenic-induced mesenchymal stem cells as a treatment for osteoarthritis: A randomised, double-blinded, placebo-controlled proof-of-concept study. Equine Vet. J. 2019, 51, 787–794. [Google Scholar] [CrossRef] [PubMed]
- Carrade, D.D.; Affolter, V.K.; Outerbridge, C.A.; Watson, J.L.; Galuppo, L.D.; Buerchler, S.; Kumar, V.; Walker, N.J.; Borjesson, D.L. Intradermal injections of equine allogeneic umbilical cord-derived mesenchymal stem cells are well tolerated and do not elicit immediate or delayed hypersensitivity reactions. Cytotherapy 2011, 13, 1180–1192. [Google Scholar] [CrossRef]
- Koch, T.G.; Heerkens, T.; Thomsen, P.D.; Betts, D.H. Isolation of mesenchymal stem cells from equine umbilical cord blood. BMC Biotechnol. 2007, 7, 26. [Google Scholar] [CrossRef] [Green Version]
- Murata, D.; Miyakoshi, D.; Hatazoe, T.; Miura, N.; Tokunaga, S.; Fujiki, M.; Nakayama, K.; Misumi, K. Multipotency of equine mesenchymal stem cells derived from synovial fluid. Veter- J. 2014, 202, 53–61. [Google Scholar] [CrossRef]
- Ishikawa, S.; Horinouchi, C.; Mizoguchi, R.; Senokuchi, A.; Kamikakimoto, R.; Murata, D.; Hatazoe, T.; Tozaki, T.; Misumi, K.; Hobo, S. Isolation of equine peripheral blood stem cells from a Japanese native horse. J. Equine Sci. 2017, 28, 153–158. [Google Scholar] [CrossRef] [Green Version]
- Platonova, S.; Korovina, D.; Viktorova, E.; Savchenkova, I. Equine Tendinopathy Therapy Using Mesenchymal Stem Cells. KnE Life Sci. 2021, 533–541. [Google Scholar] [CrossRef]
- Costa-Almeida, R.; Calejo, I.; Gomes, M.E. Mesenchymal Stem Cells Empowering Tendon Regenerative Therapies. Int. J. Mol. Sci. 2019, 20, 3002. [Google Scholar] [CrossRef] [Green Version]
- Mancuso, P.; Raman, S.; Glynn, A.; Barry, F.; Murphy, J.M. Mesenchymal Stem Cell Therapy for Osteoarthritis: The Critical Role of the Cell Secretome. Front. Bioeng. Biotechnol. 2019, 7, 9. [Google Scholar] [CrossRef] [Green Version]
- Song, Y.; Zhang, J.; Xu, H.; Lin, Z.; Chang, H.; Liu, W.; Kong, L. Mesenchymal stem cells in knee osteoarthritis treatment: A systematic review and meta-analysis. J. Orthop. Transl. 2020, 24, 121–130. [Google Scholar] [CrossRef] [PubMed]
- Van Loon, V.J.; Scheffer, C.J.; Genn, H.J.; Hoogendoorn, A.C.; Greve, J.W. Clinical follow-up of horses treated with allogeneic equine mesenchymal stem cells derived from umbilical cord blood for different tendon and ligament disorders. Veter- Q. 2014, 34, 92–97. [Google Scholar] [CrossRef] [PubMed] [Green Version]
- Beerts, C.; Suls, M.; Broeckx, S.Y.; Seys, B.; Vandenberghe, A.; Declercq, J.; Duchateau, L.; Vidal, M.A.; Spaas, J.H. Tenogenically Induced Allogeneic Peripheral Blood Mesenchymal Stem Cells in Allogeneic Platelet-Rich Plasma: 2-Year Follow-up after Tendon or Ligament Treatment in Horses. Front. Veter- Sci. 2017, 4, 158. [Google Scholar] [CrossRef] [PubMed]
- Vidal, M.A.; Robinson, S.O.; Lopez, M.J.; Paulsen, D.B.; Borkhsenious, O.; Johnson, J.R.; Moore, R.M.; Gimble, J.M. Comparison of Chondrogenic Potential in Equine Mesenchymal Stromal Cells Derived from Adipose Tissue and Bone Marrow. Vet. Surg. 2008, 37, 713–724. [Google Scholar] [CrossRef] [PubMed] [Green Version]
- Ferris, D.J.; Frisbie, D.D.; Kisiday, J.D.; McIlwraith, C.W.; Hague, B.A.; Major, M.D.; Schneider, R.K.; Zubrod, C.J.; Kawcak, C.E.; Goodrich, L.R. Clinical Outcome After Intra-Articular Administration of Bone Marrow Derived Mesenchymal Stem Cells in 33 Horses with Stifle Injury. Vet. Surg. 2014, 43, 255–265. [Google Scholar] [CrossRef] [Green Version]
- Timmers, L.; Lim, S.K.; Hoefer, I.E.; Arslan, F.; Lai, R.C.; van Oorschot, A.A.; Goumans, M.J.; Strijder, C.; Sze, S.K.; Choo, A.; et al. Human mesenchymal stem cell-conditioned medium improves cardiac function following myocardial infarction. Stem Cell Res. 2011, 6, 206–214. [Google Scholar] [CrossRef] [Green Version]
- Caplan, A.I.; Dennis, J.E. Mesenchymal stem cells as trophic mediators. J. Cell. Biochem. 2006, 98, 1076–1084. [Google Scholar] [CrossRef]
- Skalnikova, H.K. Proteomic techniques for characterisation of mesenchymal stem cell secretome. Biochimie 2013, 95, 2196–2211. [Google Scholar] [CrossRef]
- Lai, R.C.; Tan, S.S.; Teh, B.J.; Sze, S.K.; Arslan, F.; De Kleijn, D.P.; Choo, A.; Lim, S.K. Proteolytic Potential of the MSC Exosome Proteome: Implications for an Exosome-Mediated Delivery of Therapeutic Proteasome. Int. J. Proteom. 2012, 2012, 1–14. [Google Scholar] [CrossRef] [Green Version]
- Ribitsch, I.; Oreff, G.; Jenner, F. Regenerative Medicine for Equine Musculoskeletal Diseases. Animals 2021, 11, 234. [Google Scholar] [CrossRef]
- Ekoniusz, S.; Eandrzejewska, A.; Muraca, M.; Srivastava, A.; Ejanowski, M.; Elukomska, B. Extracellular Vesicles in Physiology, Pathology, and Therapy of the Immune and Central Nervous System, with Focus on Extracellular Vesicles Derived from Mesenchymal Stem Cells as Therapeutic Tools. Front. Cell. Neurosci. 2016, 10, 109. [Google Scholar] [CrossRef]
- Monleón, I.; Martínez-Lorenzo, M.J.; Monteagudo, L.; Lasierra, P.; Taulés, M.; Iturralde, M.; Piñeiro, A.; Larrad, L.; Alava, M.A.; Naval, J.; et al. Differential Secretion of Fas Ligand- or APO2 Ligand/TNF-Related Apoptosis-Inducing Ligand-Carrying Microvesicles During Activation-Induced Death of Human T Cells. J. Immunol. 2001, 167, 6736–6744. [Google Scholar] [CrossRef] [PubMed] [Green Version]
- Phinney, D.G.; Pittenger, M.F. Concise Review: MSC-Derived Exosomes for Cell-Free Therapy. Stem Cells 2017, 35, 851–858. [Google Scholar] [CrossRef] [PubMed] [Green Version]
- Yeo, R.W.Y.; Lai, R.C.; Zhang, B.; Tan, S.S.; Yin, Y.; Teh, B.J.; Lim, S.K. Mesenchymal stem cell: An efficient mass producer of exosomes for drug delivery. Adv. Drug Deliv. Rev. 2013, 65, 336–341. [Google Scholar] [CrossRef]
- Kordelas, L.; Rebmann, V.; Ludwig, A.-K.; Radtke, S.; Ruesing, J.; Doeppner, T.R.; Epple, M.; Horn, P.A.; Beelen, D.W.; Giebel, B. MSC-derived exosomes: A novel tool to treat therapy-refractory graft-versus-host disease. Leukemia 2014, 28, 970–973. [Google Scholar] [CrossRef]
- Möller, A.; Lobb, R.J. The evolving translational potential of small extracellular vesicles in cancer. Nat. Cancer 2020, 20, 697–709. [Google Scholar] [CrossRef]
- DesRochers, L.M.; Bordeleau, F.; Reinhart-King, C.A.; Cerione, R.A.; Antonyak, M.A. Microvesicles provide a mechanism for intercellular communication by embryonic stem cells during embryo implantation. Nat. Commun. 2016, 7, 11958. [Google Scholar] [CrossRef] [Green Version]
- Kamerkar, S.; LeBleu, V.S.; Sugimoto, H.; Yang, S.; Ruivo, C.; Melo, S.; Lee, J.J.; Kalluri, R. Exosomes facilitate therapeutic targeting of oncogenic KRAS in pancreatic cancer. Nat. 2017, 546, 498–503. [Google Scholar] [CrossRef]
- Agrahari, V.; Burnouf, P.-A.; Burnouf, T.; Agrahari, V. Nanoformulation properties, characterization, and behavior in complex biological matrices: Challenges and opportunities for brain-targeted drug delivery applications and enhanced translational potential. Adv. Drug Deliv. Rev. 2019, 148, 146–180. [Google Scholar] [CrossRef]
- Raposo, G.; Stahl, P.D. Extracellular vesicles: A new communication paradigm? Nat. Rev. Mol. Cell Biol. 2019, 20, 509–510. [Google Scholar] [CrossRef]
- MacDonald, E.S.; Barrett, J.G. The Potential of Mesenchymal Stem Cells to Treat Systemic Inflammation in Horses. Front. Veter- Sci. 2020, 6, 507. [Google Scholar] [CrossRef] [PubMed] [Green Version]
- Lin, K.-C.; Yip, H.-K.; Shao, P.-L.; Wu, S.-C.; Chen, K.-H.; Chen, Y.-T.; Yang, C.-C.; Sun, C.-K.; Kao, G.-S.; Chen, S.-Y.; et al. Combination of adipose-derived mesenchymal stem cells (ADMSC) and ADMSC-derived exosomes for protecting kidney from acute ischemia–reperfusion injury. Int. J. Cardiol. 2016, 216, 173–185. [Google Scholar] [CrossRef] [PubMed]
- Grillari, J.; Mäkitie, R.E.; Kocijan, R.; Haschka, J.; Vázquez, D.C.; Semmelrock, E.; Hackl, M. Circulating miRNAs in bone health and disease. Bone 2020, 145, 115787. [Google Scholar] [CrossRef] [PubMed]
- Xu, X.; Lai, Y.; Hua, Z.-C. Apoptosis and apoptotic body: Disease message and therapeutic target potentials. Biosci. Rep. 2019, 39. [Google Scholar] [CrossRef] [PubMed] [Green Version]
- Kalluri, R.; LeBleu, V.S. The biology, function, and biomedical applications of exosomes. Science 2020, 367, eaau6977. [Google Scholar] [CrossRef]
- Margolis, L.; Sadovsky, Y. The biology of extracellular vesicles: The known unknowns. PLoS Biol. 2019, 17, e3000363. [Google Scholar] [CrossRef]
- Iraci, N.; Leonardi, T.; Gessler, F.; Vega, B.; Pluchino, S. Focus on Extracellular Vesicles: Physiological Role and Signalling Properties of Extracellular Membrane Vesicles. Int. J. Mol. Sci. 2016, 17, 171. [Google Scholar] [CrossRef] [Green Version]
- Mol, E.A.; Goumans, M.-J.; Doevendans, P.A.; Sluijter, J.P.G.; Vader, P. Higher functionality of extracellular vesicles isolated using size-exclusion chromatography compared to ultracentrifugation. Nanomedicine 2017, 13, 2061–2065. [Google Scholar] [CrossRef]
- Lobb, R.j.; Becker, M.; Wen, S.W.; Wong, C.S.F.; Wiegmans, A.P.; Leimgruber, A.; Möller, A. Optimized exosome isolation protocol for cell culture supernatant and human plasma. J. Extracell. Vesicles 2015, 4, 27031. [Google Scholar] [CrossRef]
- Nieuwland, R.; Falcón-Pérez, J.M.; Théry, C.; Witwer, K.W. Rigor and standardization of extracellular vesicle research: Paving the road towards robustness. J. Extracell. Vesicles 2020, 10. [Google Scholar] [CrossRef]
- Kennedy, T.L.; Russell, A.J.; Riley, P. Experimental limitations of extracellular vesicle-based therapies for the treatment of myocardial infarction. Trends Cardiovasc. Med. 2020. [Google Scholar] [CrossRef] [PubMed]
- Voga, M.; Adamic, N.; Vengust, M.; Majdic, G. Stem Cells in Veterinary Medicine—Current State and Treatment Options. Front. Veter- Sci. 2020, 7, 278. [Google Scholar] [CrossRef] [PubMed]
- Kooijmans, S.A.; de Jong, O.G.; Schiffelers, R.M. Exploring interactions between extracellular vesicles and cells for innovative drug delivery system design. Adv. Drug Deliv. Rev. 2021, 173, 252–278. [Google Scholar] [CrossRef] [PubMed]
- Silva, A.K.; Morille, M.; Piffoux, M.; Arumugam, S.; Mauduit, P.; Larghero, J.; Bianchi, A.; Aubertin, K.; Blanc-Brude, O.; Noël, D.; et al. Development of extracellular vesicle-based medicinal products: A position paper of the group “Extracellular Vesicle translatiOn to clinicaL perspectiVEs—EVOLVE France”. Adv. Drug Deliv. Rev. 2021, 179, 114001. [Google Scholar] [CrossRef] [PubMed]
- Xu, R.; Greening, D.W.; Zhu, H.-J.; Takahashi, N.; Simpson, R.J. Extracellular vesicle isolation and characterization: Toward clinical application. J. Clin. Investig. 2016, 126, 1152–1162. [Google Scholar] [CrossRef] [PubMed] [Green Version]
- Klyachko, N.L.; Arzt, C.J.; Li, S.M.; Gololobova, O.A.; Batrakova, E.V. Extracellular Vesicle-based Therapeutics: Preclinical and Clinical Investigations. Pharmaceutics 2020, 12, 1171. [Google Scholar] [CrossRef] [PubMed]
- Gudbergsson, J.M.; Johnsen, K.B.; Skov, M.N.; Duroux, M. Systematic review of factors influencing extracellular vesicle yield from cell cultures. Cytotechnology 2015, 68, 579–592. [Google Scholar] [CrossRef] [Green Version]
- Gurunathan, S.; Kang, M.-H.; Jeyaraj, M.; Qasim, M.; Kim, J.-H. Review of the Isolation, Characterization, Biological Function, and Multifarious Therapeutic Approaches of Exosomes. Cells 2019, 8, 307. [Google Scholar] [CrossRef] [Green Version]
- Gupta, D.; Zickler, A.M.; El Andaloussi, S. Dosing extracellular vesicles. Adv. Drug Deliv. Rev. 2021, 178, 113961. [Google Scholar] [CrossRef]
- Salmond, N.; Williams, K.C. Isolation and characterization of extracellular vesicles for clinical applications in cancer—Time for standardization? Nanoscale Adv. 2021, 3, 1830–1852. [Google Scholar] [CrossRef]
- Théry, C.; Witwer, K.W.; Aikawa, E.; Alcaraz, M.J.; Anderson, J.D.; Andriantsitohaina, R.; Antoniou, A.; Arab, T.; Archer, F.; Atkin-Smith, G.K.; et al. Minimal information for studies of extracellular vesicles 2018 (MISEV2018): A position statement of the International Society for Extracellular Vesicles and update of the MISEV2014 guidelines. J. Extracell. Vesicles 2018, 7, 1535750. [Google Scholar] [CrossRef] [PubMed] [Green Version]
- Royo, F.; Théry, C.; Falcón-Pérez, J.M.; Nieuwland, R.; Witwer, K.W. Methods for Separation and Characterization of Extracellular Vesicles: Results of a Worldwide Survey Performed by the ISEV Rigor and Standardization Subcommittee. Cells 2020, 9, 1955. [Google Scholar] [CrossRef] [PubMed]
- Lötvall, J.; Hill, A.F.; Hochberg, F.; Buzás, E.I.; Di Vizio, D.; Gardiner, C.; Gho, Y.S.; Kurochkin, I.V.; Mathivanan, S.; Quesenberry, P.; et al. Minimal experimental requirements for definition of extracellular vesicles and their functions: A position statement from the International Society for Extracellular Vesicles. J. Extracell. Vesicles 2014, 3, 26913. [Google Scholar] [CrossRef] [PubMed]
- Pascucci, L.; Alessandri, G.; Dall’Aglio, C.; Mercati, F.; Coliolo, P.; Bazzucchi, C.; Dante, S.; Petrini, S.; Curina, G.; Ceccarelli, P. Membrane vesicles mediate pro-angiogenic activity of equine adipose-derived mesenchymal stromal cells. Veter- J. 2014, 202, 361–366. [Google Scholar] [CrossRef] [PubMed]
- Livshits, M.A.; Khomyakova, E.; Evtushenko, E.; Lazarev, V.N.; Kulemin, N.; Semina, S.E.; Generozov, E.; Govorun, V.M. Isolation of exosomes by differential centrifugation: Theoretical analysis of a commonly used protocol. Sci. Rep. 2015, 5, 17319. [Google Scholar] [CrossRef] [PubMed]
- Li, P.; Kaslan, M.; Lee, S.H.; Yao, J.; Gao, Z. Progress in Exosome Isolation Techniques. Theranostics 2017, 7, 789–804. [Google Scholar] [CrossRef]
- Busatto, S.; Zendrini, A.; Radeghieri, A.; Paolini, L.; Romano, M.; Presta, M.; Bergese, P. The nanostructured secretome. Biomater. Sci. 2019, 8, 39–63. [Google Scholar] [CrossRef]
- Lange-Consiglio, A.; Perrini, C.; Tasquier, R.; Deregibus, M.C.; Camussi, G.; Pascucci, L.; Marini, M.G.; Corradetti, B.; Bizzaro, D.; De Vita, B.; et al. Equine Amniotic Microvesicles and Their Anti-Inflammatory Potential in a Tenocyte Model In Vitro. Stem Cells Dev. 2016, 25, 610–621. [Google Scholar] [CrossRef] [Green Version]
- Khasawneh, R.R.; Al Sharie, A.H.; Rub, E.A.-E.; Serhan, A.O.; Obeidat, H.N. Addressing the impact of different fetal bovine serum percentages on mesenchymal stem cells biological performance. Mol. Biol. Rep. 2019, 46, 4437–4441. [Google Scholar] [CrossRef]
- Oesterreicher, J.; Pultar, M.; Schneider, J.; Mühleder, S.; Zipperle, J.; Grillari, J.; Holnthoner, W. Fluorescence-Based Nanoparticle Tracking Analysis and Flow Cytometry for Characterization of Endothelial Extracellular Vesicle Release. Int. J. Mol. Sci. 2020, 21, 9278. [Google Scholar] [CrossRef]
- Cvjetkovic, A.; Lötvall, J.; Lässer, C. The influence of rotor type and centrifugation time on the yield and purity of extracellular vesicles. J. Extracell. Vesicles 2014, 3. [Google Scholar] [CrossRef] [PubMed]
- Böing, A.N.; van der Pol, E.; Grootemaat, A.E.; Coumans, F.A.W.; Sturk, A.; Nieuwland, R. Single-step isolation of extracellular vesicles by size-exclusion chromatography. J. Extracell. Vesicles 2014, 3. [Google Scholar] [CrossRef] [PubMed]
- Monguió-Tortajada, M.; Gálvez-Montón, C.; Bayes-Genis, A.; Roura, S.; Borràs, F.E. Extracellular vesicle isolation methods: Rising impact of size-exclusion chromatography. Cell. Mol. Life Sci. 2019, 76, 2369–2382. [Google Scholar] [CrossRef] [PubMed]
- Lane, R.; Korbie, D.; Trau, M.; Hill, M.M. Optimizing Size Exclusion Chromatography for Extracellular Vesicle Enrichment and Proteomic Analysis from Clinically Relevant Samples. Proteomics 2019, 19, e1800156. [Google Scholar] [CrossRef] [PubMed] [Green Version]
- Sidhom, K.; Obi, P.; Saleem, A. A Review of Exosomal Isolation Methods: Is Size Exclusion Chromatography the Best Option? Int. J. Mol. Sci. 2020, 21, 6466. [Google Scholar] [CrossRef] [PubMed]
- An, M.; Wu, J.; Zhu, J.; Lubman, D.M. Comparison of an Optimized Ultracentrifugation Method versus Size-Exclusion Chromatography for Isolation of Exosomes from Human Serum. J. Proteome Res. 2018, 17, 3599–3605. [Google Scholar] [CrossRef]
- Brennan, K.; Martin, K.; Fitzgerald, S.P.; O’Sullivan, J.; Wu, Y.; Blanco, A.; Richardson, C.; Mc Gee, M.M. A comparison of methods for the isolation and separation of extracellular vesicles from protein and lipid particles in human serum. Sci. Rep. 2020, 10, 1039. [Google Scholar] [CrossRef] [Green Version]
- Kowal, J.; Arras, G.; Colombo, M.; Jouve, M.; Morath, J.P.; Primdal-Bengtson, B.; Dingli, F.; Loew, D.; Tkach, M.; Théry, C. Proteomic comparison defines novel markers to characterize heterogeneous populations of extracellular vesicle subtypes. Proc. Natl. Acad. Sci. USA 2016, 113, E968–E977. [Google Scholar] [CrossRef] [Green Version]
- Perrini, C.; Strillacci, M.G.; Bagnato, A.; Esposti, P.; Marini, M.G.; Corradetti, B.; Bizzaro, D.; Idda, A.; Ledda, S.; Capra, E.; et al. Microvesicles secreted from equine amniotic-derived cells and their potential role in reducing inflammation in endometrial cells in an in-vitro model. Stem Cell Res. Ther. 2016, 7, 1–15. [Google Scholar] [CrossRef] [Green Version]
- Coumans, F.A.W.; Brisson, A.R.; Buzas, E.I.; Dignat-George, F.; Drees, E.E.E.; El-Andaloussi, S.; Emanueli, C.; Gasecka, A.; Hendrix, A.; Hill, A.F.; et al. Methodological Guidelines to Study Extracellular Vesicles. Circ. Res. 2017, 120, 1632–1648. [Google Scholar] [CrossRef]
- Taylor, D.D.; Shah, S. Methods of isolating extracellular vesicles impact down-stream analyses of their cargoes. Methods 2015, 87, 3–10. [Google Scholar] [CrossRef] [PubMed]
- Stam, J.; Bartel, S.; Bischoff, R.; Wolters, J.C. Isolation of extracellular vesicles with combined enrichment methods. J. Chromatogr. B 2021, 1169, 122604. [Google Scholar] [CrossRef] [PubMed]
- Moghadasi, S.; Elveny, M.; Rahman, H.S.; Suksatan, W.; Jalil, A.T.; Abdelbasset, W.K.; Yumashev, A.V.; Shariatzadeh, S.; Motavalli, R.; Behzad, F.; et al. A paradigm shift in cell-free approach: The emerging role of MSCs-derived exosomes in regenerative medicine. J. Transl. Med. 2021, 19, 1–21. [Google Scholar] [CrossRef] [PubMed]
- Kalluri, R. The biology and function of exosomes in cancer. J. Clin. Investig. 2016, 126, 1208–1215. [Google Scholar] [CrossRef]
- Mizenko, R.R.; Brostoff, T.; Rojalin, T.; Koster, H.J.; Swindell, H.S.; Leiserowitz, G.S.; Wang, A.; Carney, R.P. Tetraspanins are unevenly distributed across single extracellular vesicles and bias sensitivity to multiplexed cancer biomarkers. J. Nanobiotechnol. 2021, 19, 1–17. [Google Scholar] [CrossRef]
- Jankovičová, J.; Sečová, P.; Michalková, K.; Antalíková, J. Tetraspanins, More than Markers of Extracellular Vesicles in Reproduction. Int. J. Mol. Sci. 2020, 21, 7568. [Google Scholar] [CrossRef]
- Linares, R.; Tan, S.; Gounou, C.; Arraud, N.; Brisson, A.R. High-speed centrifugation induces aggregation of extracellular vesicles. J. Extracell. Vesicles 2015, 4, 29509. [Google Scholar] [CrossRef]
- Szatanek, R.; Baran, J.; Siedlar, M.; Baj-Krzyworzeka, M. Isolation of extracellular vesicles: Determining the correct approach (Review). Int. J. Mol. Med. 2015, 36, 11–17. [Google Scholar] [CrossRef] [Green Version]
- Kretlow, J.D.; Jin, Y.-Q.; Liu, W.; Zhang, W.J.; Hong, T.-H.; Zhou, G.; Baggett, L.S.; Mikos, A.G.; Cao, Y. Donor age and cell passage affects differentiation potential of murine bone marrow-derived stem cells. BMC Cell Biol. 2008, 9, 60. [Google Scholar] [CrossRef] [Green Version]
- Boulestreau, J.; Maumus, M.; Rozier, P.; Jorgensen, C.; Noël, D. Mesenchymal Stem Cell Derived Extracellular Vesicles in Aging. Front. Cell Dev. Biol. 2020, 8, 107. [Google Scholar] [CrossRef] [Green Version]
- Zhang, Y.; Ravikumar, M.; Ling, L.; Nurcombe, V.; Cool, S.M. Age-Related Changes in the Inflammatory Status of Human Mesenchymal Stem Cells: Implications for Cell Therapy. Stem Cell Rep. 2021, 16, 694–707. [Google Scholar] [CrossRef] [PubMed]
- Siennicka, K.; Zołocińska, A.; Dębski, T.; Pojda, Z. Comparison of the Donor Age-Dependent and In Vitro Culture-Dependent Mesenchymal Stem Cell Aging in Rat Model. Stem Cells Int. 2021, 2021, 1–16. [Google Scholar] [CrossRef] [PubMed]
- Urbanelli, L.; Buratta, S.; Sagini, K.; Tancini, B.; Emiliani, C. Extracellular Vesicles as New Players in Cellular Senescence. Int. J. Mol. Sci. 2016, 17, 1408. [Google Scholar] [CrossRef] [PubMed]
- Lunyak, V.V.; Amaro-Ortiz, A.; Gaur, M. Mesenchymal Stem Cells Secretory Responses: Senescence Messaging Secretome and Immunomodulation Perspective. Front. Genet. 2017, 8, 220. [Google Scholar] [CrossRef] [PubMed]
- Cammack, R.; Atwood, T.; Campbell, P.; Parish, H.; Smith, A.; Vella, F.; Stirling, J. Oxford Dictionary of Biochemistry and Molecular Biology; Oxford University Press: Oxford, UK, 2008. [Google Scholar]
- Ribitsch, I.; Chang-Rodriguez, S.; Egerbacher, M.; Gabner, S.; Gueltekin, S.; Huber, J.; Schuster, T.; Jenner, F. Sheep Placenta Cotyledons: A Noninvasive Source of Ovine Mesenchymal Stem Cells. Tissue Eng. Part C Methods 2017, 23, 298–310. [Google Scholar] [CrossRef] [PubMed]


Publisher’s Note: MDPI stays neutral with regard to jurisdictional claims in published maps and institutional affiliations. |
© 2022 by the authors. Licensee MDPI, Basel, Switzerland. This article is an open access article distributed under the terms and conditions of the Creative Commons Attribution (CC BY) license (https://creativecommons.org/licenses/by/4.0/).
Share and Cite
Soukup, R.; Gerner, I.; Gültekin, S.; Baik, H.; Oesterreicher, J.; Grillari, J.; Jenner, F. Characterisation of Extracellular Vesicles from Equine Mesenchymal Stem Cells. Int. J. Mol. Sci. 2022, 23, 5858. https://doi.org/10.3390/ijms23105858
Soukup R, Gerner I, Gültekin S, Baik H, Oesterreicher J, Grillari J, Jenner F. Characterisation of Extracellular Vesicles from Equine Mesenchymal Stem Cells. International Journal of Molecular Sciences. 2022; 23(10):5858. https://doi.org/10.3390/ijms23105858
Chicago/Turabian StyleSoukup, Robert, Iris Gerner, Sinan Gültekin, Hayeon Baik, Johannes Oesterreicher, Johannes Grillari, and Florien Jenner. 2022. "Characterisation of Extracellular Vesicles from Equine Mesenchymal Stem Cells" International Journal of Molecular Sciences 23, no. 10: 5858. https://doi.org/10.3390/ijms23105858