
Systematic Review and Meta-Analysis on MS-Based Proteomics Applied to Human Peripheral Fluids to Assess Potential Biomarkers of Bipolar Disorder

 , , , , and
Abstract
:1. Introduction
2. Method
2.1. Search Strategy
2.2. Eligibility Criteria
2.3. Data Extraction
2.4. Quality of Evidence
2.5. Statistical and Gene Ontology Analysis
3. Results
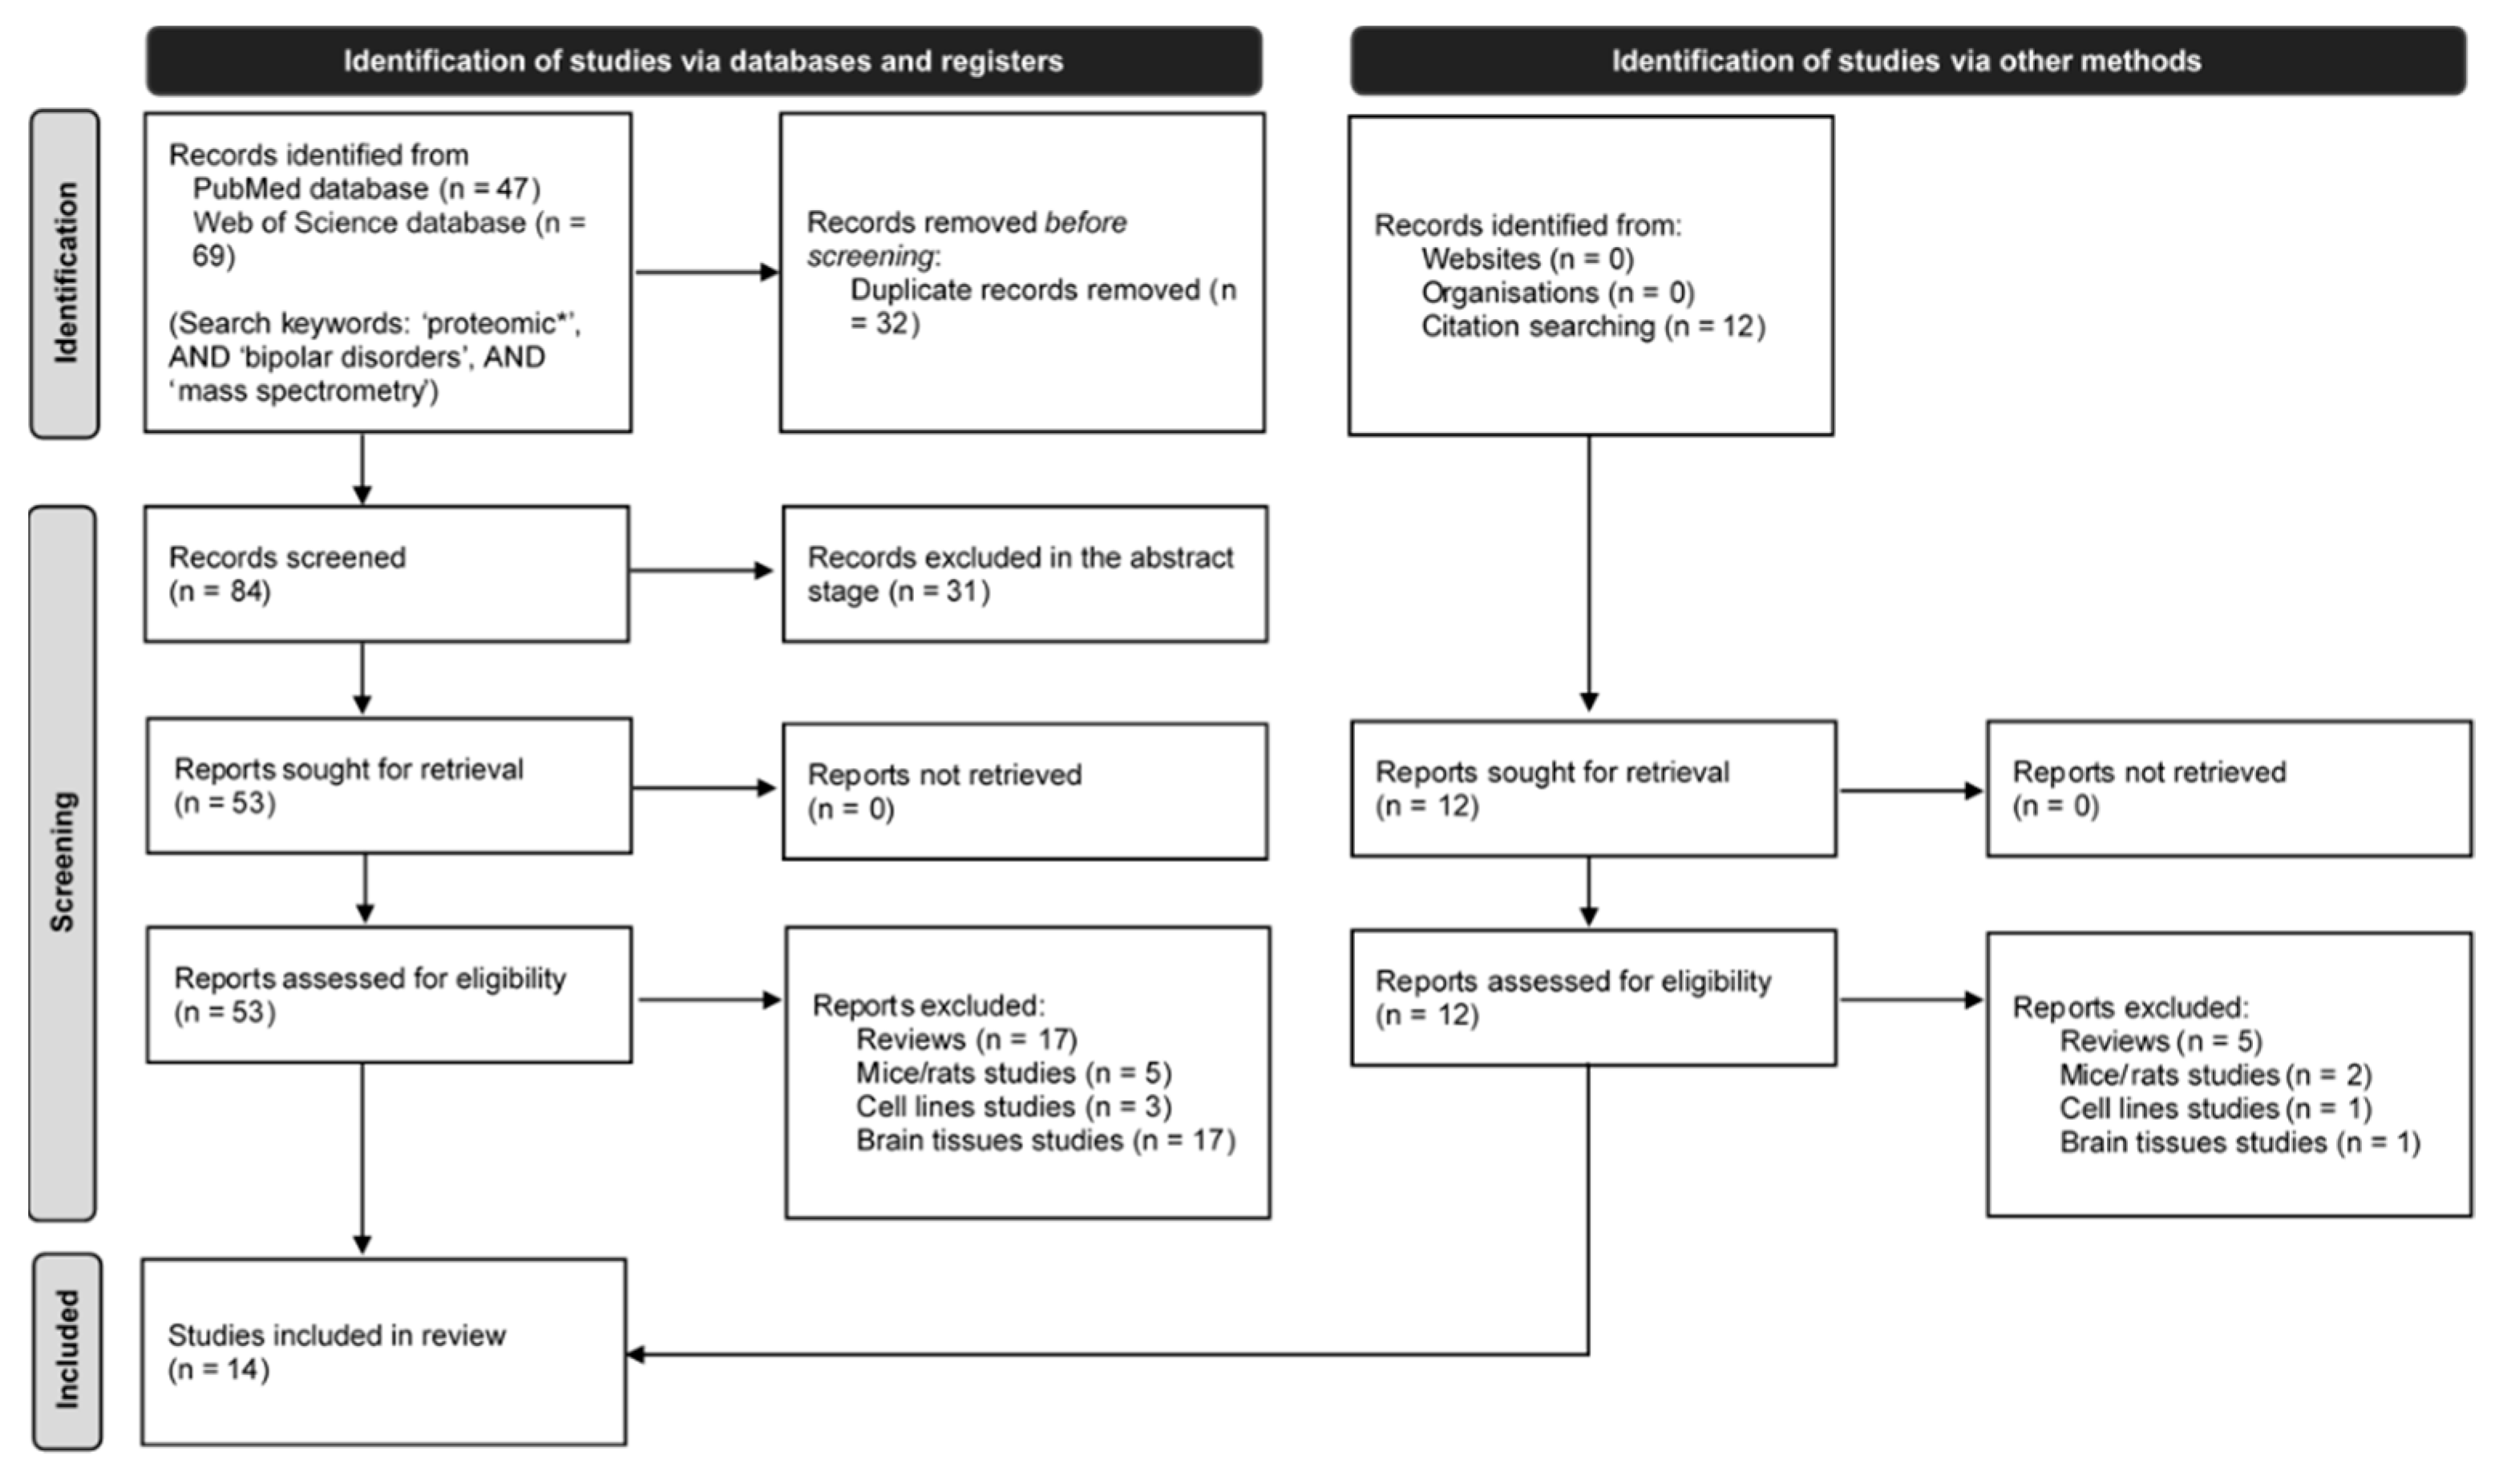
3.1. Study Selection and Characteristics of Included Articles

| First Author | Year | Bipolar Disorder (BD) | Controls | Other Disorders (OD) | Clinical Criteria | Ref. | ||||||||
|---|---|---|---|---|---|---|---|---|---|---|---|---|---|---|
| n | Age | Illness Duration | Gender (m/f) | n | Age | Gender (m/f) | n | Age | Illness Duration | Gender (m/f) | ||||
| L. Smirnova | 2019 | 23 | 32 (21–52) | 8 (5–11) | 14/9 | 24 | 28 (21–55) | 6/18 | 33 (SCZ) | 34 (28–40) | 7 (4–16) | 11/22 | ICD-10 | [64] |
| G.S. Pessoa | 2019 | 19 | 41 ± 17 | 6.4 ± 6.1 | 7/12 | 13 | 38 ± 16 | 3/10 | 19 (SCZ) | 37 ± 11 | 7.6 ± 5.4 | 13/6 | ICD-10 | [65] |
| Y.H. Cheng | 2018 | 57 | (18–50) | 2.2 (0.25–12) | 27/30 | 94 | (18–50) | --- | --- | --- | --- | ICD-10 | [66] | |
| B. Petrov | 2018 | 12 | 14 ± 2.0 | --- | --- | 13 | 14 ± 2.4 | 11 (MDD) | 14 ± 1.2 | --- | --- | K-SADS-PL-W | [67] | |
| C. Knochel | 2017 | 25 | 38 ± 10 | 8.9 ± 5.5 | 19/6 | 93 | 34 ± 11 | 44/39 | 29 (SCZ) | 37 ± 11 | 12 ± 7.8 | 21/8 | DSM-IV | [33] |
| J.R. De Jesus | 2017 | 14 | 36 ± 9.0 | 4.5 ± 4.3 | 5/9 | 12 (3 HCF; 9 HCNF) | 39 ± 9 (HCF); 35 ± 8 (HCNF) | 1/2 (HCF); 2/7 (HCNF) | 23 (SCZ); 4 (OD) | 34 ± 9 (SCZ); 31 ± 5 (OD) | 8.7 ± 7.5 (SCZ); 4.5 ± 2.9 (OD) | 17/6 (SCZ); 3/1 (OD) | ICD-10 | [32] |
| J.J. Ren | 2017 | 30 | 28 ± 7.0 | 15.1 ± 20.4 weeks (depressive episode) | [65] 17/13 | 30 | 28 ± 6.0 | 15/15 | 30 (MDD) | 30 ± 4.9 | 19.9 ± 25.7 weeks (depressive episode) | 16/14 | DSM-IV | [68] |
| Y.R. Song | 2015 | 45 BD I (10 euth; 20 dep.; 15 man) | 28 ± 9.5 (euth) 27 ± 9.1 (dep) 29 ± 8.0 (man) | --- | 4/6 (eut); 8/12 (dep); 6/9 (man) | 20 | 28 ± 5.0 | 8/12 | --- | --- | --- | --- | DSM-IV-Axis I | [49] |
| J. Chen | 2015 | 20 (BD II) | --- | --- | --- | 30 | --- | --- | 30 (MDD) | --- | --- | DSM-IV-Axis I | [69] | |
| L. Giusti | 2014 | 15 | 41 ± 9.3 | 13 ± 9.6 | 4/11 | 15 | 39 ± 12 | 10/5 | 11 (MDE) | 37 ± 9.4 | 9.5 ± 7.1 | 2/9 | DSM-IV | [70] |
| J. Iavarone | 2014 | 17 | --- | --- | --- | 31 | --- | 32 (SCZ) | --- | --- | --- | DSM-IV | [52] | |
| M. Herberth | 2011 | 32 (BD I/II: 16/16) 16 PBMCs (BD I/II: 8/8) | 34 ± 10 (serum) 36 ± 9.0 (PBMCs) | 9.9 ± 8.6 (serum); 12 ± 8.6 (PBMCs) | 13/19 (serum); 6/10 (PBMCs) | 32 serum; 15 PBMCs | 33 ± 6.6 (serum); 33 ± 7.3 (PBMCs) | 13/19 (serum); 6/9 (PBMCs) | --- | --- | --- | --- | DSM-IV | [50] |
| A. Sussulini | 2011 | 15 BD + Li; 10 BD − Li (euth) | 40 ± 13 (+Li); 42 ± 17 (-Li) | 1–28 (+Li); 1–20 (−Li) | 6/9 (+Li); 3/7 (−Li) | 15 | 31 ± 15 | 6/9 | --- | --- | --- | --- | --- | [63] |
| A. Sussulini | 2010 | BD + Li = 15; BD − Li = 10 (euth) | --- | --- | --- | 25 | --- | --- | --- | --- | --- | --- | --- | [62] |
3.2. Number of Patients
3.3. Diagnostic Criteria
3.4. Age
3.5. Illness Duration
3.6. Gender
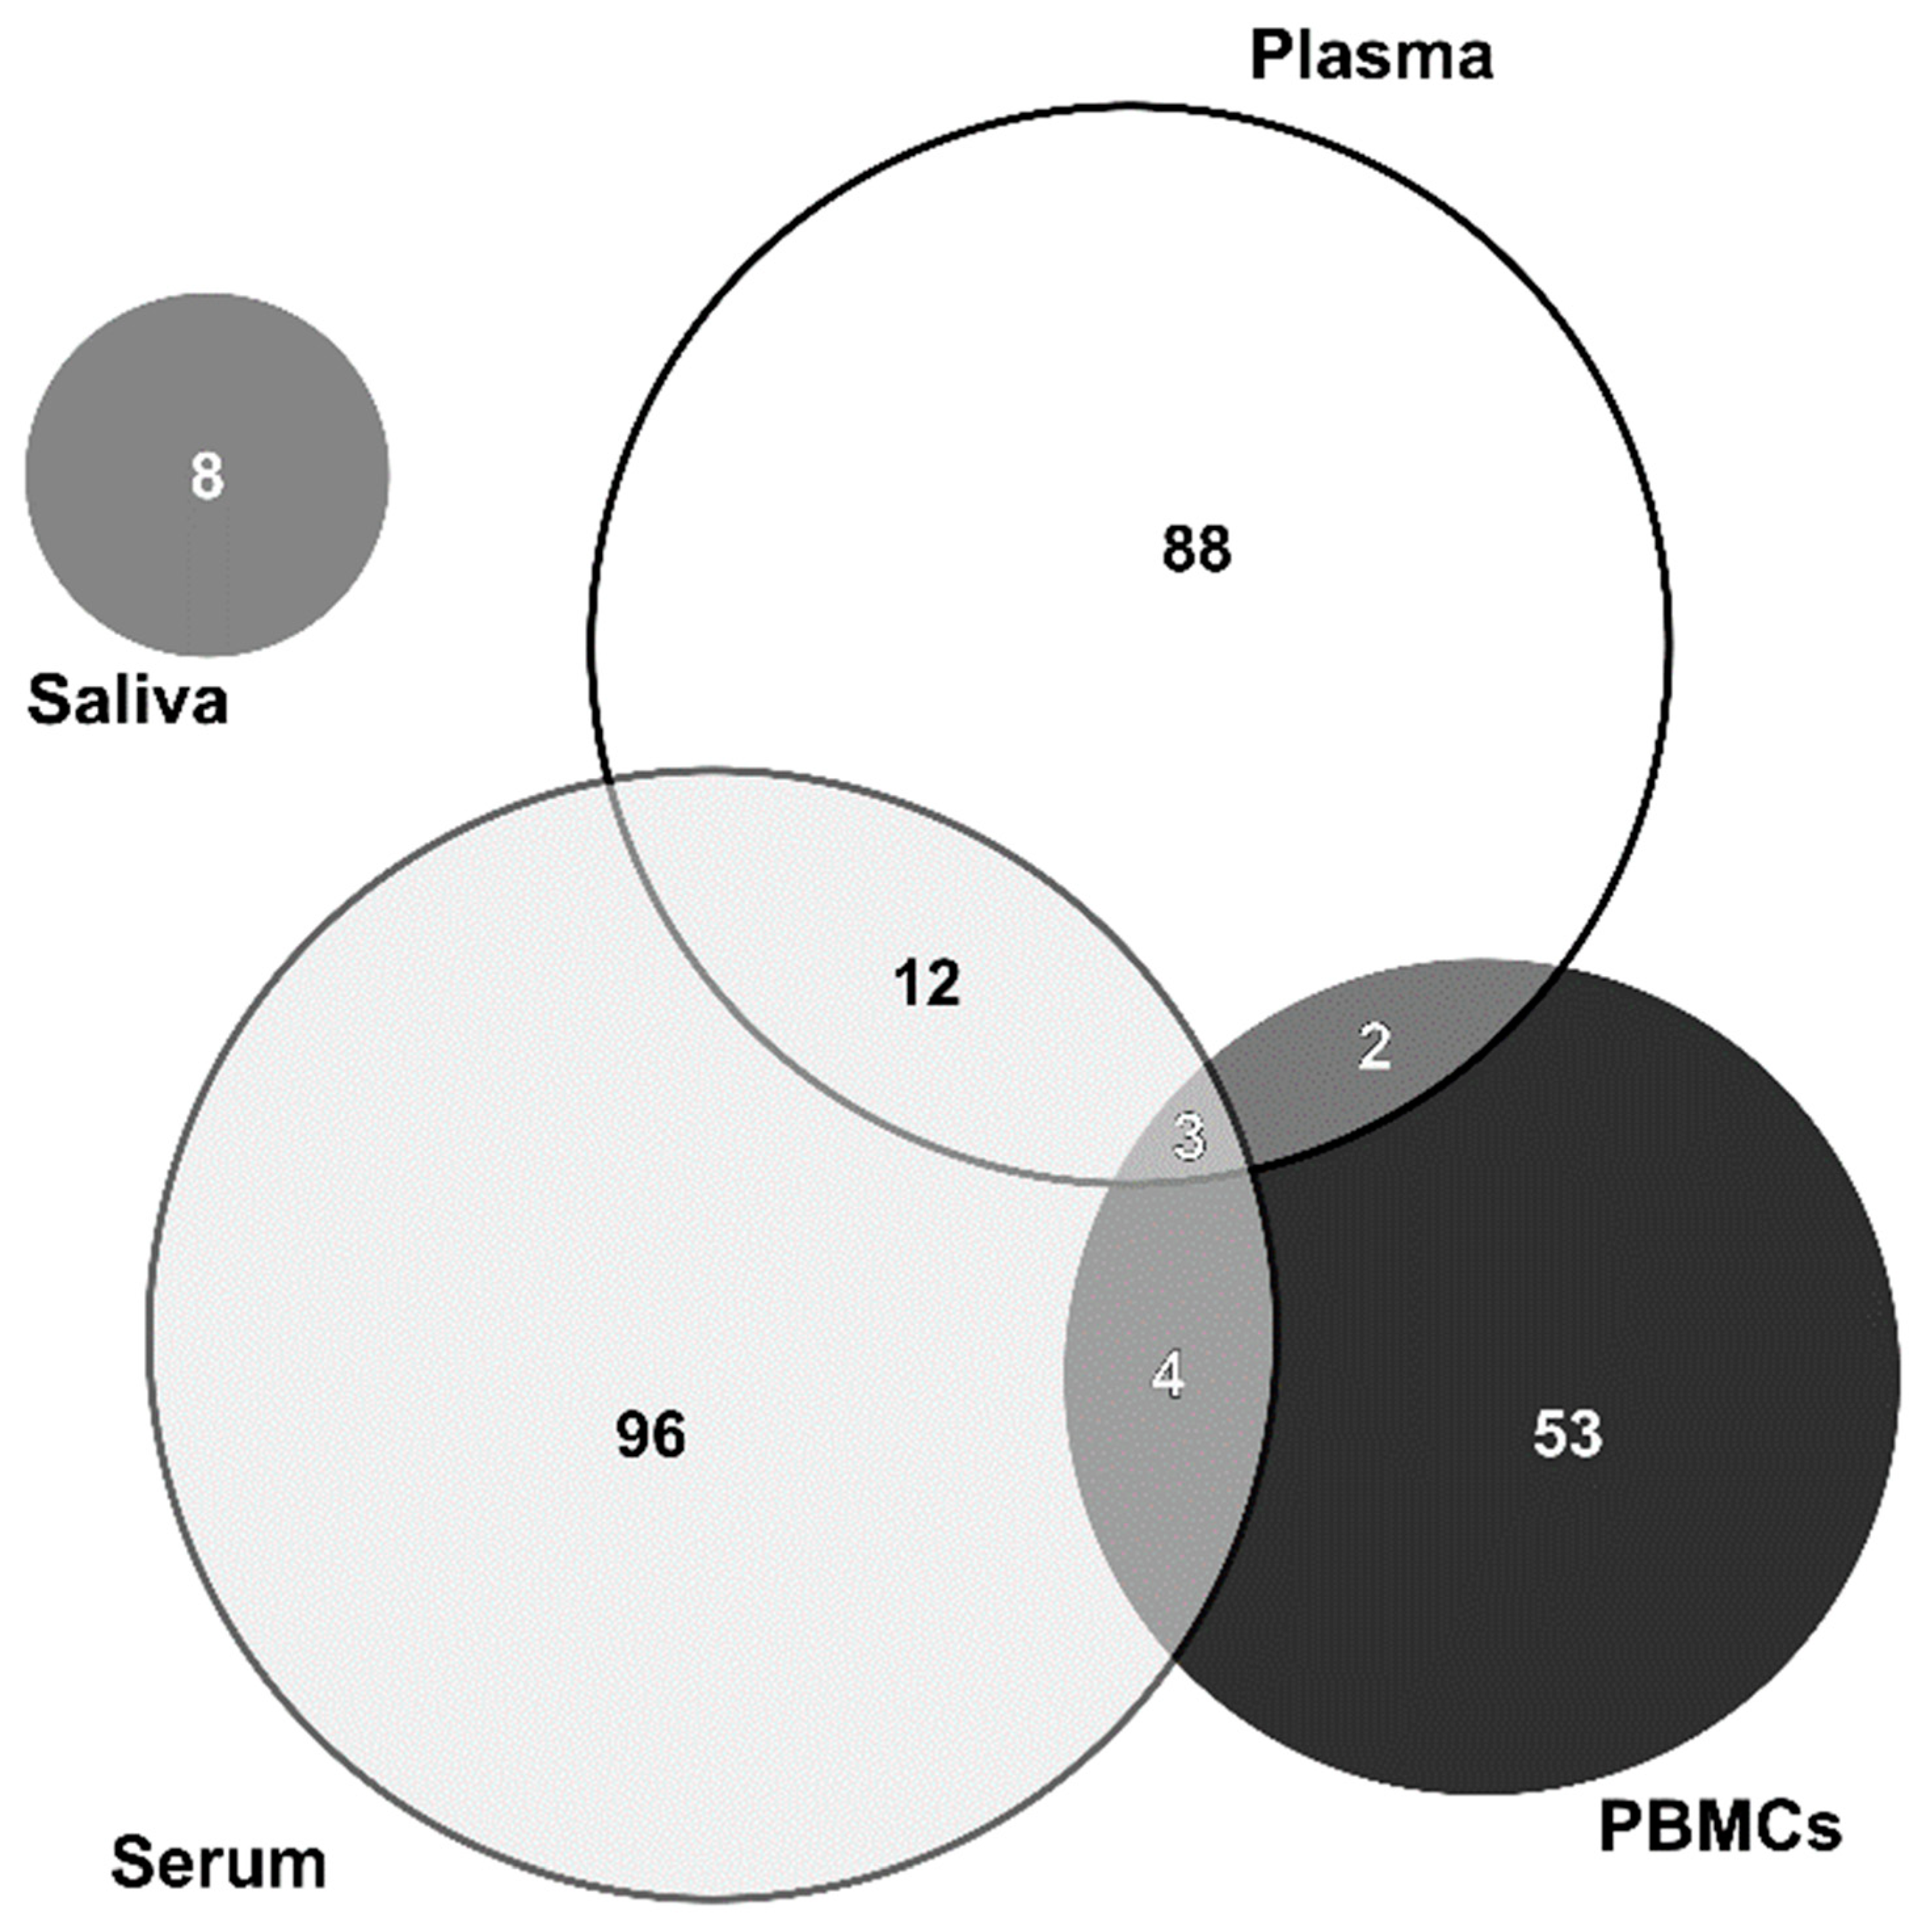
3.7. Type of Sample and Sampling
3.8. Drug Naïve or Minimally Medicated
3.9. MS-Based Methods
3.10. Other Techniques
| Author (year) | Cohort Information | Sample | Type of Sampling | DRUG NAIVE | MS-Based Method | Other Techniques | Quantification Method | Depletion/Enrichment | Altered Proteins | Altered Pathways | Ref. |
|---|---|---|---|---|---|---|---|---|---|---|---|
| L. Smirnova (2019) | 23 BD; 33 SCZ; 24 CTR | Serum | Individual | Yes | LC-MS/MS | ELISA (Q6UB98; P33151) | MS | Yes/No | BD vs. CT vs. SCZ:↑ (O15417; O95445; P02666; P02745; P02753; P05090; P05452; P07360; P13671; P15924; P17948; P23141; P33151; P46013; Q01538; Q86YZ3; Q9HCI5; Q9UBP9); ↓ (A8K2U0; O75820; O95347; P00748; P01011; P02649; P02750; P05154; P11532; P22792; P42684; P60709; P63261; P78527; P81605; P84098; P98164; Q08380; Q15811; Q16610; Q5H9R4; Q6UB98; Q7Z478; Q8TE73; Q96BK5; Q96KN2; Q9UGM5) | BD: immune response, regulating transport processes across the cell membrane and cell communication, development of neurons and oligodendrocytes, and cell growth. SCZ: immune response, cell communication, cell growth and maintenance, protein metabolism, and regulation of nucleic acid metabolism. | [64] |
| G.S. Pessoa (2019) | 19 BD; 19 SCZ; 13 CTR | Serum | Pooled | No | LC-MS/MS and LC/ICP-MS | MS | No/No | BD vs. CT:↑ (P01834; P0DOY2; J3QRN2; P01860; A0A0A0MTQ6; P01717; P01859) ↓ (P01857; P02787; P01620; S4R460) | Imbalance in the homeostasis of important micronutrients. | [65] | |
| Y.H. Cheng (2018) | 57 BD; 26 CTR | Serum; plasma: PBMCs | Individual | Yes | MALDI-TOF-MS | ELISA (P19882; Q95YL7) Flow cytometry (P38910) | MS | No/Yes | BD vs. CT:↑ (P19882; Q95YL7) ↓ (P38910) | Heat shock proteins (HSP) might be useful as a biomarker of BD and for distinguishing BD patients with abnormal HPA axis activity vs. normal HPA axis activity. | [66] |
| B. Petrov (2018) | 12 BD; 11 MDD; 13 CTR | Serum | Pooled | No | LC-MS/MS | ELISA and WB (P02774) | MS | No/Yes | BD:↑ (P02774; P07357; P02745; P02747; P02746; P09871; P13671; P02776; P07996; P04275; P12259; P03952; P01008; P00747; P04004; P68366; Q9BQE3; Q9H4B7; P06396; P12814; Q13201; P08514; P05106; P37802; Q86UX7; P08185; P02760; P02753; P25311; Q9UGM5; P01042; Q96IY4; P22352; P30041; Q01518; P80108; P02749; P02655; P02647; P02656; P06727; P02649) | Inflammatory response | [67] |
| C. Knochel (2017) | 25 BD; 29 SCZ; 93 CTR | Plasma | Individual | No | LC-MS/MS (MRM mode) | MRI | MS | No/No | BD vs. CT:↑ (P08697; P01008; P02647; P02652; P06727; P02654; P02655; P02656; P55056; P05090; P02649; Q13790; P00751; P01024; O75636; P05546; P14780; P36955; P02753) BD vs. SCZ: ↑ (P08697; P01008; P02647; P02652; P06727; P04114; P02654; P02656; P05090; Q13790; O14791; P00751; O75636; P05546; P04196; P36955; P02753); ↓ (P02655; P55056; P02747; P01024; P05160; P03952; P14780) | Altered APOC expression in BD and SCZ was linked to cognitive decline and underlying morphological changes in both disorders. | [33] |
| J.R. De Jesus (2017) | 14 BD; 23 SCZ; 4 OD; 12 CTR (3 HCF; 9 HCNF) | Serum | Pooled | No | LC-MS/MS | 2D DIGE | Yes/No | BD vs. HCNF:↑ (P02768; P02647); ↓ (P0C0L4; P01009; P02647; P02649) BD vs. HCF: ↑ (P02647); ↓ (P02786) BD vs. OD: ↓ (P02768; P0C0L4; P04004; P02656) BD vs. SCZ: ↓ (P0C0L4; P0C0L5; P02743) | An association between BD and altered immune and inflammatory functioning may be a probable mechanism that may explain the BD pathophysiology. | [32] | |
| J.J. Ren (2017) | 30 BD; 30 MDD; 30 CTR | Plasma | Pooled | Yes | LC-MS/MS | MS | Yes/No | BD vs. CT:↑ (Q0KKI6; Q86TT1; D6RD17; P20851; Q9UK54; Q9UL88; P04040; A0A0K2BMD8; P32119; P00915; P00441; B7Z2I6; P00738; Q6J1Z7; P01023; P30043; A0A068LKQ0; B3VL17; P01625; B3KRY3; Q9NP10; Q8N355; Q15430; Q6VFQ6; R4GN98; A0A0A0MSI0; P02763; P02647; A2KBC1; Q9NZD4; B7Z3I9; Q0ZCH9; F5H5I5; A0A0K0K1L1; Q13228); ↓ (B4E324; P80723; P31150; Q13103; H7C0V9; Q5T9B9; B2RAN2; U3KQE7; A0A0G2JS21; K7ESA0; A9X7H1; Q6UWP8; A0A075B6G4; A0A075B737; Q6ZRP7; J3KQ45; Q13201; P02775; Q8IUC0) BD vs. MDD: ↑ (P02763; Q9UBG0; P03973); ↓ (B4E1B2; B2RAN2; P02647; Q5T9B9; Q6UWP8; Q6ZRP7) | B2RAN2 and ENG with important roles in oxidative stress and the immune system may serve as candidate biomarkers for distinguishing MDD and BD. | [68] | |
| Y.R. Song (2015) | 45 BD (10 euth; 20 dep; 15 man); 20 CTR | Plasma | Pooled | No | MALDI-TOF/TOF MS | WB (P02647; O14791; P00915; P02743; P01023) | 2-DE | Yes/No | Eut. BD vs. CT:↑ (Q6PEJ8; O14791; P43652; P36955; Q6U2M2; V9H0D6; Q96IY4; P02787; P02675); ↓ (P02647; P02774; P15169; Q96PD5; P19827; P02743; Q14624) Dep. BD vs. CT: ↑ (Q6PEJ8; O14791; P43652; P36955; Q6U2M2; P02774; V9H0D6; Q96IY4; P02787; P02675; P02743; P02679; P01024; P02790; P04264); ↓ (P02647; P15169; Q96PD5; P19827; Q14624; O43866; P04003; P00915) Man. BD vs. CT: ↑ (Q6PEJ8; O14791; P43652; P36955; Q6U2M2; P02774; V9H0D6; Q96IY4; P02787; P02675; P35527; P02747); ↓ (P02647; P15169; Q96PD5; P19827; P02743; Q14624; P01023; Q03591; P00736; P02671) | BD pathophysiology may be associated with early perturbations in lipid metabolism that are independent of mood state. | [49] |
| J. Chen (2015) | 20 BD II; 30 MDD; 30 CTR | Plasma | Pooled | Yes | MALDI-TOF/TOF MS | ELISA (A8K2H7; P05156; P04003) | 2-DE | No/No | BD vs. MDD:↑ (P02765; P02765; P04004; P04217; Q9BYX7; A2AJT9; isoform KNG1#; isoform HPX#); ↓ (Q03933; P27169; P06727; O75116; P01024; P02743; P63261; Q8WXH0; D3DP16; P05156; P01871; P02790; Q96PD5; P04003; isoforms KNG1#) | Immune regulation, including defense response, acute inflammatory response, response to wounding and inflammatory response. | [69] |
| L. Giusti (2014) | 15 acute BD; 11 MDE; 15 CTR | PBMCs | Individual | No | LC-MS/MS | WB (P16219; Q14847; O43399; P31948) | 2-DE | No/No | BD vs. CT:↑ (P02787; P18206; P02768; P31948; P10809; P02675; P08670; P07437; P01871; P00738; P16219; P14618; P0C0L4; P27482; Q14847; O43399; P15259; P60174; P02647; P02766); ↓ (P60709; Q13347; P11177; O00299; P63104) BD vs. MDE: ↑ (P31948; P02675; P60709; P00738; P16219; P14618; Q13347; P11177; P27482; Q14847; O00299; O43399; P15259; P63104; P02647); ↓ (P02787; P18206; P02768; P10809; P08670; P07437; P01871; P0C0L4; P60174; P02766) | Differential expression of cytoskeletal and stress response proteins in PBMCs. | [70] |
| J. Iavarone (2014) | 17 BD; 32 SCZ; 31 CTR | Saliva | Individual | No | LC-MS/MS | MS | No/No | BD vs. CT:↑ (P59665; P59666; P12838; P80511; P01040; P04080; DEF2 *) | Dysregulation of the immune pathway of peripheral white blood cells | [52] | |
| M. Herberth (2011) | Serum: 32 euth BD (I/II: 16/16); 32 CTR. PBMCs: 16 BD (I/II: 8/8); 15 CTR | Serum; plasma | Individual | No | LC-MS/MS | Immunoblot analysis (P55072; Q99798) | MS | No/Yes | SerumBD vs. CT:↑ (O15467; P25942; P29965; P29279; P05305; P01133; Q0VHD7; P14174; P47992; P01229; P08263; P18065); ↓ (P02647; Q9Y258; P01876; P01871; P35225; P21583; P01375; P02656) PBMCs BD vs. CT: ↑ (O75083; Q00610; Q14008; Q14152; Q2M1P5; Q96Q89; P52179; Q9UKX3; Q9UKX2; P12883; Q71U36; Q99798; Q96KP4; Q59G92; P00338; P22314; P62937; P14625; P11142; P08238; P55072; Q14687; Q86V48; Q8IVG5; B7ZMG3); ↓ (P07355; O15061; P35580; P35749; Q9Y623; Q9Y4I1; Q14980; Q96PE2; O95347; Q99666; Q5T200) | Markers of euthymic BD patients pointing towards an increased inflammatory response and cell death in the immune system, along with increased activation of HPG axis hormones. | [50] |
| A. Sussulini (2011) | 25 euth BD (15 BD + Li; 10 BD − Li); 15 CTR | Serum | Pooled | No | SELDI-TOF MS | Immunoturbidimetric (P02647) | 2D DIGE | Yes/No | BD + Li vs. BD − Li:↑ (P02647); ↓ (P04004; P02766; P01009; P01857; P01009; P01008) | [63] | |
| A. Sussulini (2010) | 25 euth BD (15 BD + Li; 10 BD − Li); 15 CTR | Serum | Pooled | No | MALDI-TOF MS/MS and LA-ICP MS | 2D-PAGE | Yes/No | P23142; P09871; P04004; P10909; P02743; Q96LC7; P02647; P02766; P0C0L4 (qualitative analysis) | [62] |
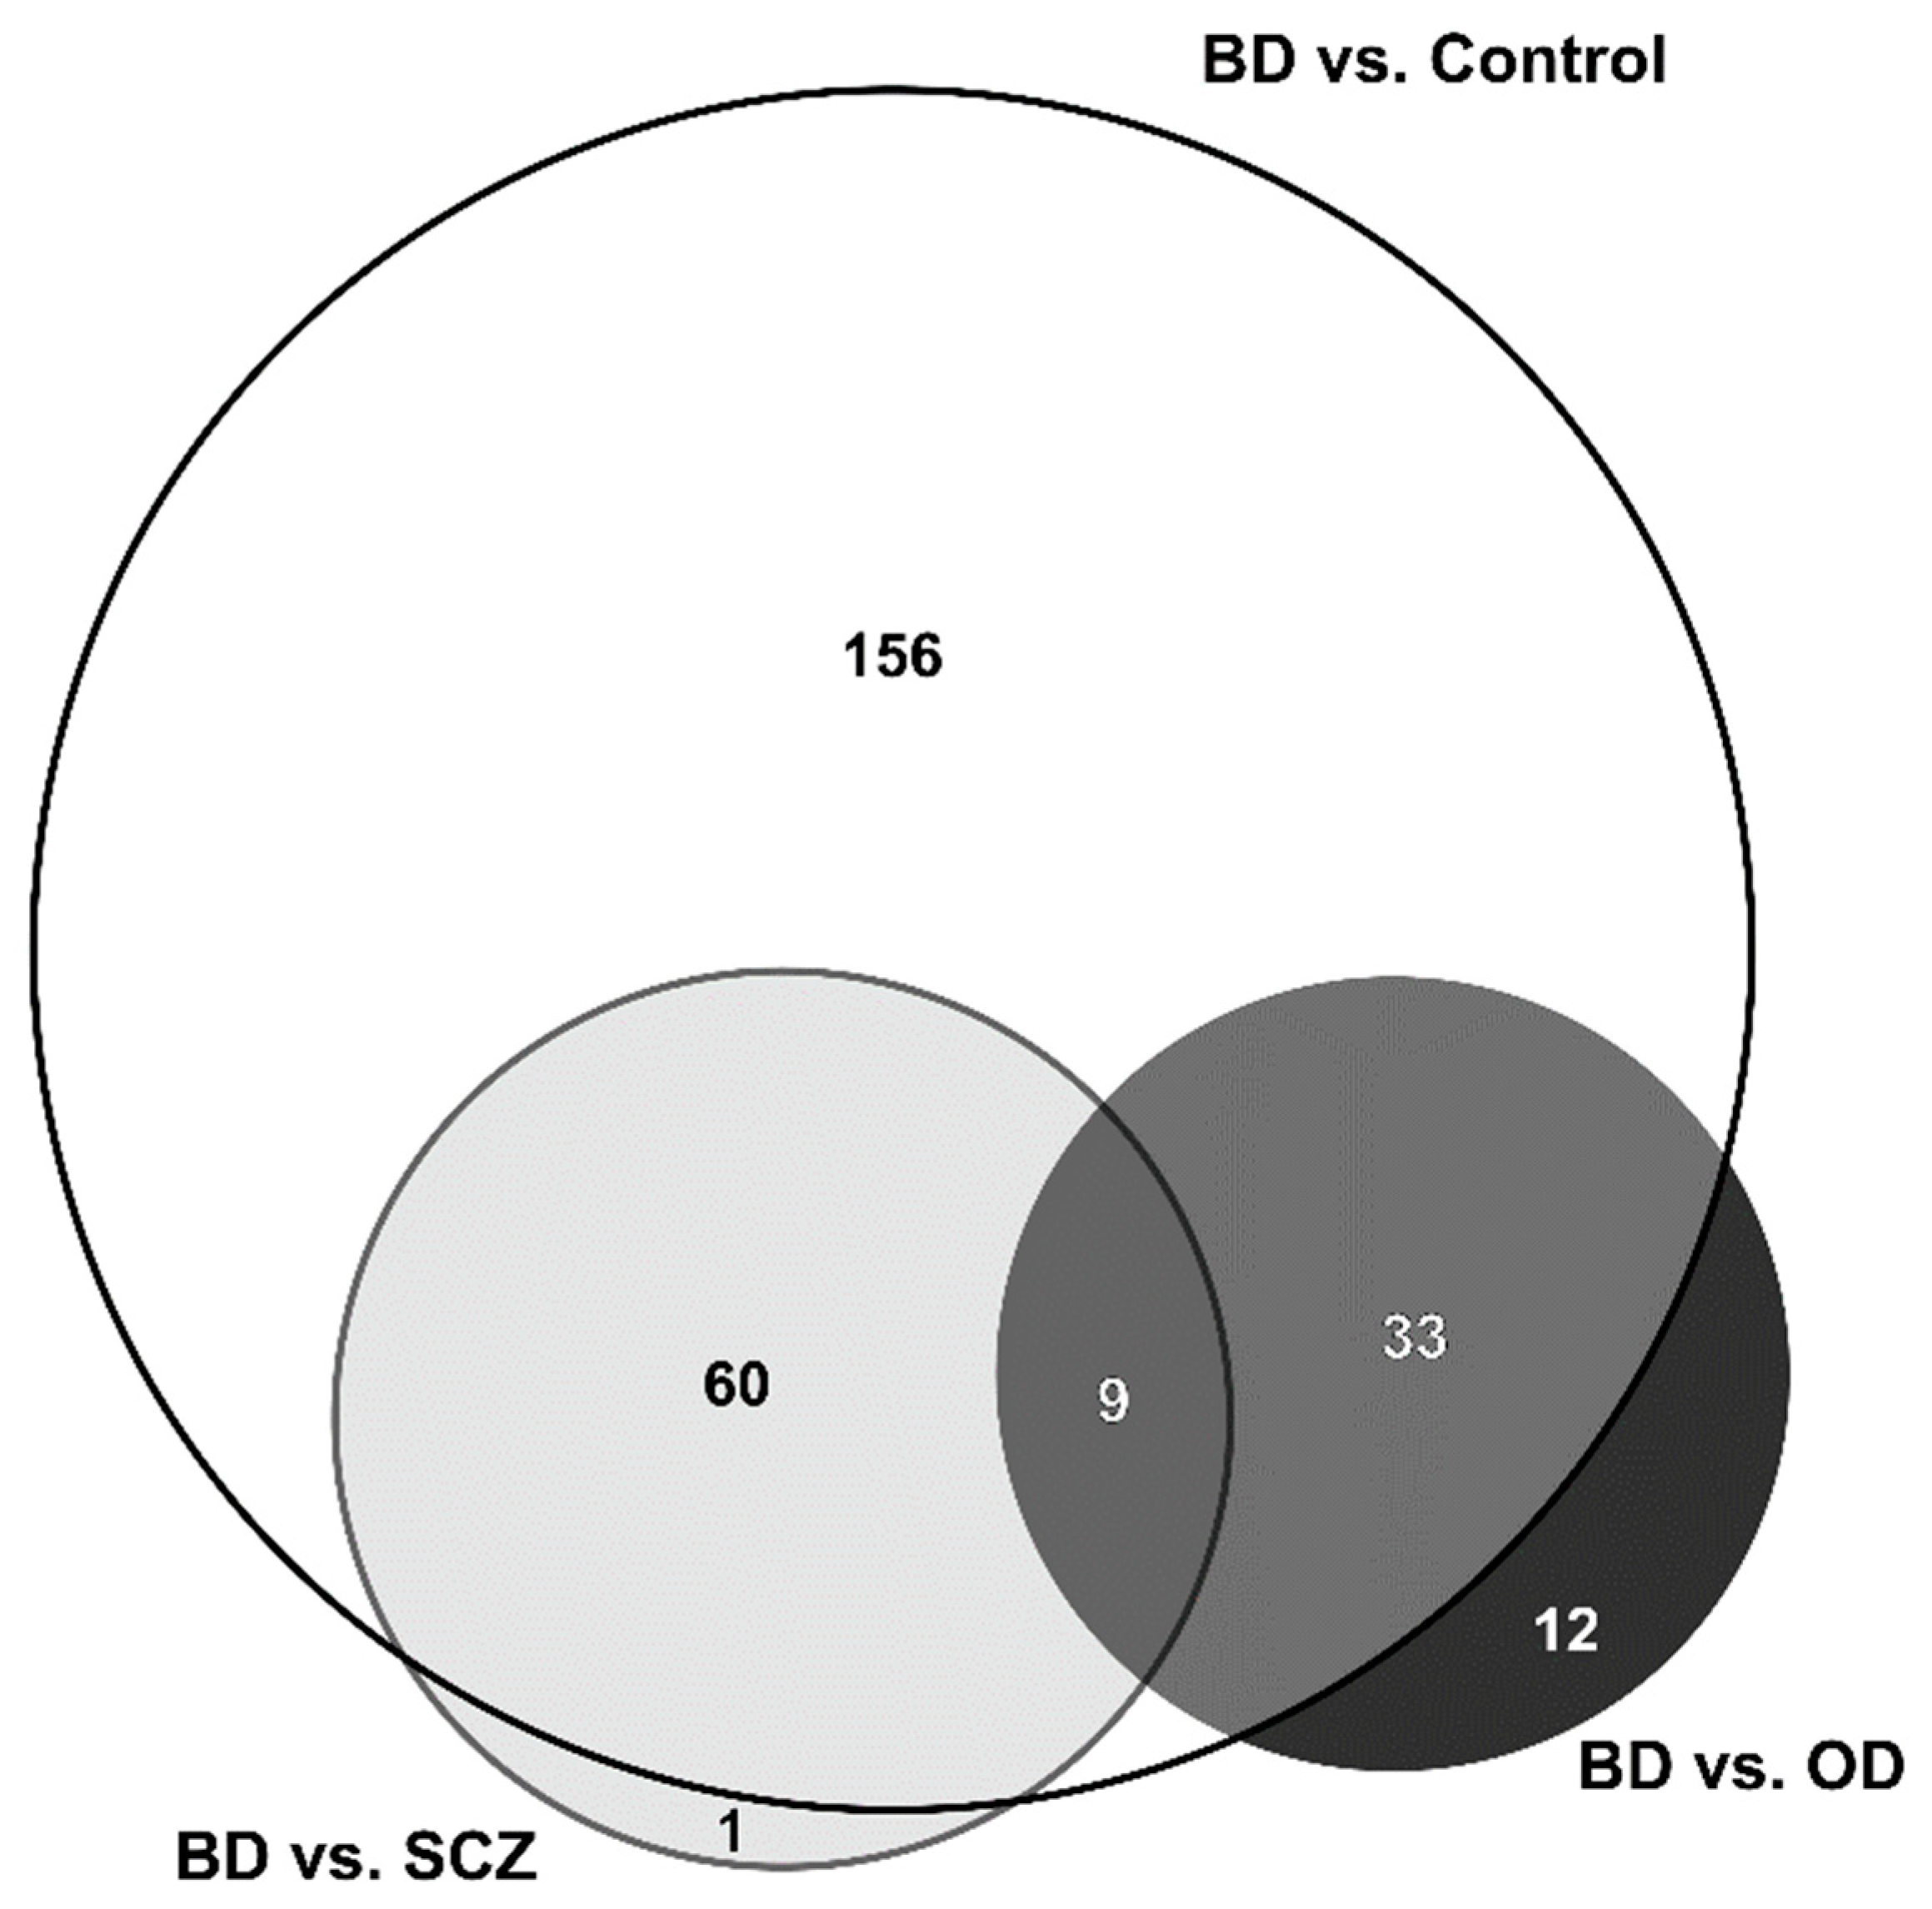
4. Main Studies Performed
4.1. Bipolar Disorder vs. Control
4.2. Bipolar Disorder vs. Schizophrenia
4.3. Bipolar Disorder vs. Other Disorders
4.4. Bipolar Disorder Patients Treated with Li-Drugs vs. Treated with Other Drugs
4.5. Bias Analysis
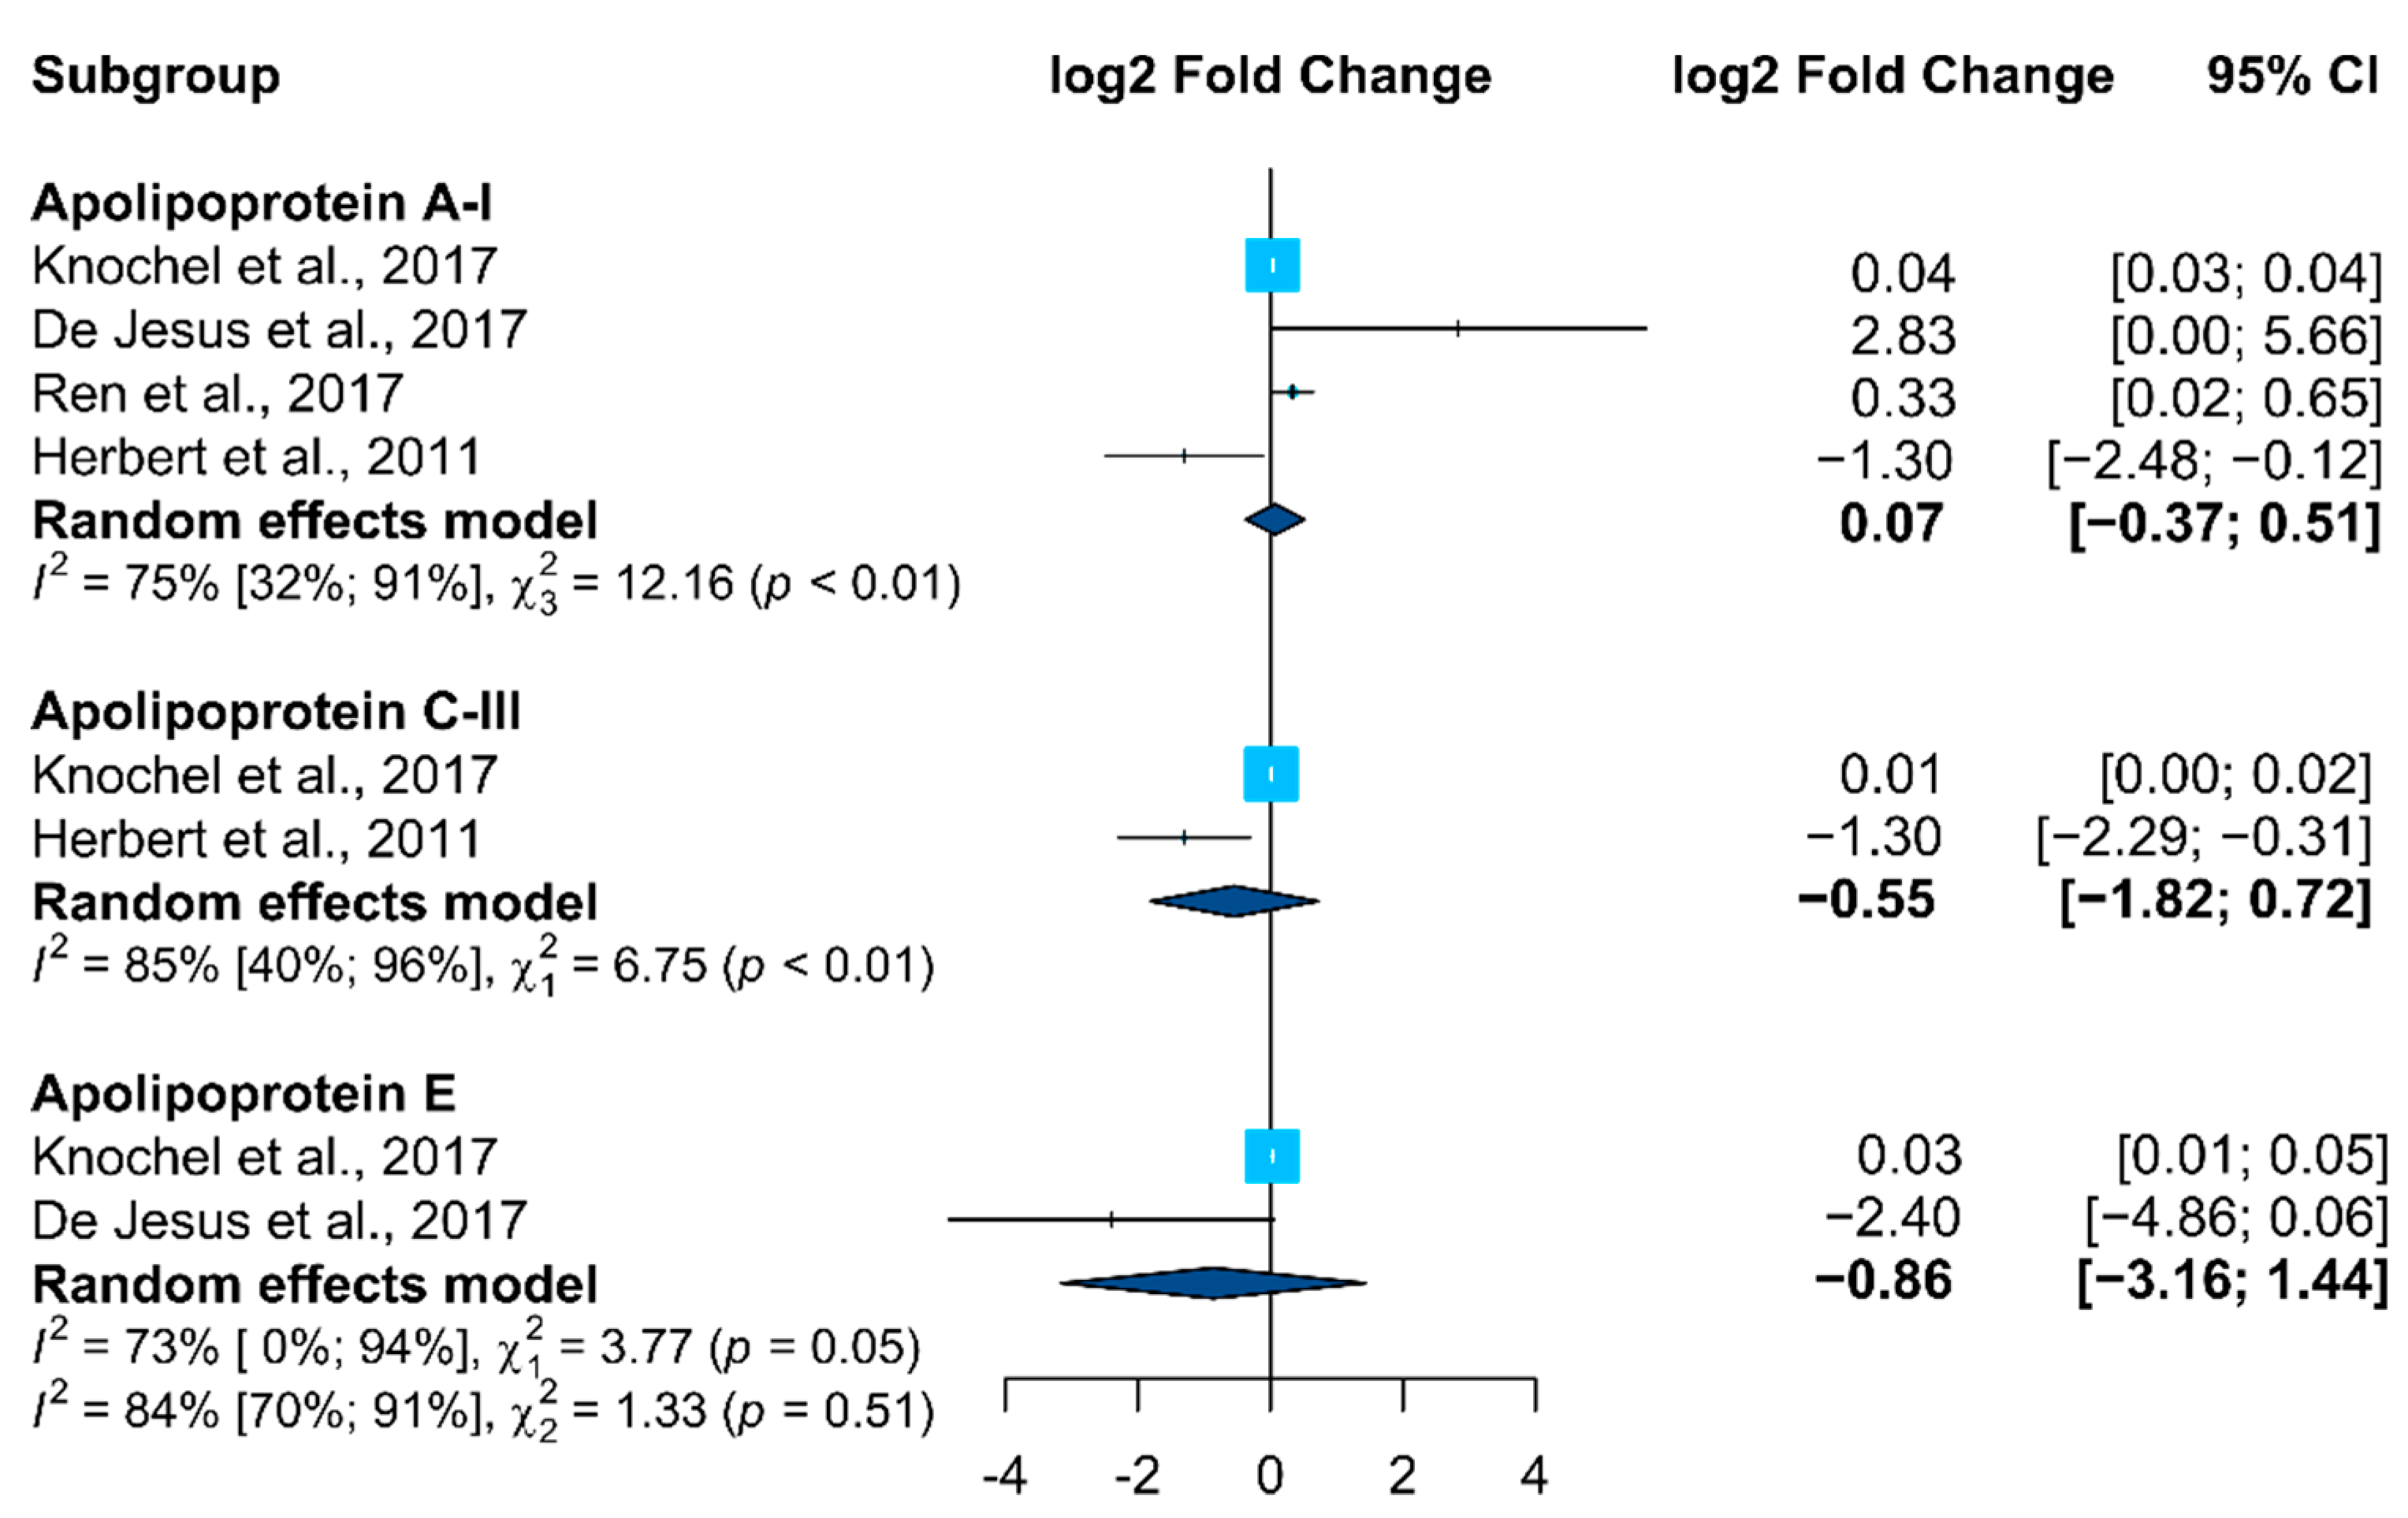
4.6. Meta-Analysis
5. Discussion
6. Strengths and Limitations
7. Directions for Future Research
8. Conclusions
Supplementary Materials
Author Contributions
Funding
Institutional Review Board Statement
Informed Consent Statement
Data Availability Statement
Conflicts of Interest
References
- Vieta, E.; Berk, M.; Schulze, T.G.; Carvalho, A.F.; Suppes, T.; Calabrese, J.R.; Gao, K.; Miskowiak, K.W.; Grande, I. Bipolar disorders. Nat. Rev. Dis. Primers 2018, 4, 18008. [Google Scholar] [CrossRef] [PubMed]
- Carvalho, A.F.; Firth, J.; Vieta, E. Bipolar Disorder. N. Engl. J. Med. 2020, 383, 58–66. [Google Scholar] [CrossRef]
- McIntyre, R.S.; Berk, M.; Brietzke, E.; Goldstein, B.I.; López-Jaramillo, C.; Kessing, L.V.; Malhi, G.S.; Nierenberg, A.A.; Rosenblat, J.D.; Majeed, A.; et al. Bipolar disorders. Lancet 2020, 396, 1841–1856. [Google Scholar] [CrossRef]
- Merikangas, K.R.; Jin, R.; He, J.P.; Kessler, R.C.; Lee, S.; Sampson, N.A.; Viana, M.C.; Andrade, L.H.; Hu, C.; Karam, E.G.; et al. Prevalence and correlates of bipolar spectrum disorder in the world mental health survey initiative. Arch. Gen. Psychiatry 2011, 68, 241–251. [Google Scholar] [CrossRef] [PubMed]
- Ferrari, A.J.; Stockings, E.; Khoo, J.P.; Erskine, H.E.; Degenhardt, L.; Vos, T.; Whiteford, H.A. The prevalence and burden of bipolar disorder: Findings from the Global Burden of Disease Study 2013. Bipolar Disord. 2016, 18, 440–450. [Google Scholar] [CrossRef]
- Geoffroy, P.A.; Leboyer, M.; Scott, J. Predicting bipolar disorder: What can we learn from prospective cohort studies? Encephale 2015, 41, 10–16. [Google Scholar] [CrossRef] [Green Version]
- Gore, F.M.; Bloem, P.J.; Patton, G.C.; Ferguson, J.; Joseph, V.; Coffey, C.; Sawyer, S.M.; Mathers, C.D. Global burden of disease in young people aged 10–24 years: A systematic analysis. Lancet 2011, 377, 2093–2102. [Google Scholar] [CrossRef]
- Teixeira, A.L.; Colpo, G.D.; Fries, G.R.; Bauer, I.E.; Selvaraj, S. Biomarkers for bipolar disorder: Current status and challenges ahead. Expert Rev. Neurother. 2019, 19, 67–81. [Google Scholar] [CrossRef]
- Weiner, M.; Warren, L.; Fiedorowicz, J.G. Cardiovascular morbidity and mortality in bipolar disorder. Ann. Clin. Psychiatry Off. J. Am. Acad. Clin. Psychiatr. 2011, 23, 40–47. [Google Scholar]
- Leboyer, M.; Kupfer, D.J. Bipolar disorder: New perspectives in health care and prevention. J. Clin. Psychiatry 2010, 71, 1689–1695. [Google Scholar] [CrossRef]
- Knežević, V.; Nedić, A. Influence of misdiagnosis on the course of bipolar disorder. Eur. Rev. Med. Pharmacol. Sci. 2013, 17, 1542–1545. [Google Scholar] [PubMed]
- Schaffer, A.; Isometsa, E.T.; Tondo, L.; Moreno, D.H.; Turecki, G.; Reis, C.; Cassidy, F.; Sinyor, M.; Azorin, J.M.; Kessing, L.V.; et al. International Society for Bipolar Disorders Task Force on Suicide: Meta-analyses and meta-regression of correlates of suicide attempts and suicide deaths in bipolar disorder. Bipolar Disord. 2015, 17, 1–16. [Google Scholar] [CrossRef] [PubMed]
- de Jesus, J.R.; de Campos, B.K.; Galazzi, R.M.; Martinez, J.L.; Arruda, M.A. Bipolar disorder: Recent advances and future trends in bioanalytical developments for biomarker discovery. Anal. Bioanal. Chem. 2015, 407, 661–667. [Google Scholar] [CrossRef] [PubMed]
- Bramley, M.; Peasley, K.; Langtree, L.; Innes, K. The ICD-10-AM Mental Health Manual: An Integrated Classification and Diagnostic Tool for Community-Based Mental Health Services. Health Inf. Manag. J. Health Inf. Manag. Assoc. Aust. 2002, 30, 1–4. [Google Scholar] [CrossRef]
- AP, A. Diagnostic and Statistical Manual of Mental Disorders: DSM-5™, 5th ed.; American Psychiatric Publishing, Inc.: Arlington, VA, USA, 2013; p. xliv947. [Google Scholar]
- Geoffroy, P.A.; Scott, J. Prodrome or risk syndrome: What’s in a name? Int. J. Bipolar Disord. 2017, 5, 7. [Google Scholar] [CrossRef] [Green Version]
- McIntyre, R.S.; Cha, D.S.; Jerrell, J.M.; Swardfager, W.; Kim, R.D.; Costa, L.G.; Baskaran, A.; Soczynska, J.K.; Woldeyohannes, H.O.; Mansur, R.B.; et al. Advancing biomarker research: Utilizing ‘Big Data’ approaches for the characterization and prevention of bipolar disorder. Bipolar Disord. 2014, 16, 531–547. [Google Scholar] [CrossRef]
- Scaini, G.; Valvassori, S.S.; Diaz, A.P.; Lima, C.N.; Benevenuto, D.; Fries, G.R.; Quevedo, J. Neurobiology of bipolar disorders: A review of genetic components, signaling pathways, biochemical changes, and neuroimaging findings. Braz. J. Psychiatry 2020, 42, 536–551. [Google Scholar] [CrossRef] [Green Version]
- Rowland, T.A.; Marwaha, S. Epidemiology and risk factors for bipolar disorder. Ther. Adv. Psychopharmacol. 2018, 8, 251–269. [Google Scholar] [CrossRef]
- Rosenblat, J.D.; Brietzke, E.; Mansur, R.B.; Maruschak, N.A.; Lee, Y.; McIntyre, R.S. Inflammation as a neurobiological substrate of cognitive impairment in bipolar disorder: Evidence, pathophysiology and treatment implications. J. Affect. Disord. 2015, 188, 149–159. [Google Scholar] [CrossRef]
- Rosenblat, J.D.; McIntyre, R.S. Bipolar Disorder and Immune Dysfunction: Epidemiological Findings, Proposed Pathophysiology and Clinical Implications. Brain Sci. 2017, 7, 144. [Google Scholar] [CrossRef] [Green Version]
- Clay, H.B.; Sillivan, S.; Konradi, C. Mitochondrial dysfunction and pathology in bipolar disorder and schizophrenia. Int. J. Dev. Neurosci. 2011, 29, 311–324. [Google Scholar] [CrossRef] [PubMed] [Green Version]
- Steckert, A.V.; Valvassori, S.S.; Moretti, M.; Dal-Pizzol, F.; Quevedo, J. Role of oxidative stress in the pathophysiology of bipolar disorder. Neurochem. Res. 2010, 35, 1295–1301. [Google Scholar] [CrossRef] [PubMed]
- Shi, J.; Badner, J.A.; Hattori, E.; Potash, J.B.; Willour, V.L.; McMahon, F.J.; Gershon, E.S.; Liu, C. Neurotransmission and bipolar disorder: A systematic family-based association study. Am. J. Med. Genet. Part B Neuropsychiatr. Genet. Off. Publ. Int. Soc. Psychiatr. Genet. 2008, 147B, 1270–1277. [Google Scholar] [CrossRef] [PubMed] [Green Version]
- Ashok, A.H.; Marques, T.R.; Jauhar, S.; Nour, M.M.; Goodwin, G.M.; Young, A.H.; Howes, O.D. The dopamine hypothesis of bipolar affective disorder: The state of the art and implications for treatment. Mol. Psychiatry 2017, 22, 666–679. [Google Scholar] [CrossRef]
- Machado-Vieira, R.; Soeiro-De-Souza, M.G.; Richards, E.M.; Teixeira, A.L.; Zarate, C.A. Multiple levels of impaired neural plasticity and cellular resilience in bipolar disorder: Developing treatments using an integrated translational approach. World J. Biol. Psychiatry 2014, 15, 84–95. [Google Scholar] [CrossRef] [Green Version]
- Battaglia, S.; Serio, G.; Scarpazza, C.; D’Ausilio, A.; Borgomaneri, S. Frozen in (e)motion: How reactive motor inhibition is influenced by the emotional content of stimuli in healthy and psychiatric populations. Behav. Res. Ther. 2021, 146, 103963. [Google Scholar] [CrossRef]
- Filiou, M.D.; Turck, C.W. General overview: Biomarkers in neuroscience research. Int. Rev. Neurobiol. 2011, 101, 1–17. [Google Scholar] [CrossRef]
- Sethi, S.; Brietzke, E. Omics-Based Biomarkers: Application of Metabolomics in Neuropsychiatric Disorders. Int. J. Neuropsychopharmacol. 2015, 19, pyv096. [Google Scholar] [CrossRef]
- Taurines, R.; Dudley, E.; Grassl, J.; Warnke, A.; Gerlach, M.; Coogan, A.N.; Thome, J. Proteomic research in psychiatry. J. Psychopharmacol. 2011, 25, 151–196. [Google Scholar] [CrossRef]
- Bayes, A.; Grant, S.G. Neuroproteomics: Understanding the molecular organization and complexity of the brain. Nat. Rev. Neurosci. 2009, 10, 635–646. [Google Scholar] [CrossRef]
- de Jesus, J.R.; Galazzi, R.M.; de Lima, T.B.; Banzato, C.E.M.; de Almeida Lima, E.S.L.F.; de Rosalmeida Dantas, C.; Gozzo, F.C.; Arruda, M.A.Z. Simplifying the human serum proteome for discriminating patients with bipolar disorder of other psychiatry conditions. Clin. Biochem. 2017, 50, 1118–1125. [Google Scholar] [CrossRef] [PubMed]
- Knochel, C.; Kniep, J.; Cooper, J.D.; Stablein, M.; Wenzler, S.; Sarlon, J.; Prvulovic, D.; Linden, D.E.; Bahn, S.; Stocki, P.; et al. Altered apolipoprotein C expression in association with cognition impairments and hippocampus volume in schizophrenia and bipolar disorder. Eur. Arch. Psychiatry Clin. Neurosci. 2017, 267, 199–212. [Google Scholar] [CrossRef] [PubMed] [Green Version]
- Silva-Costa, L.C.; Carlson, P.T.C.; Guest, P.C.; de Almeida, V.; Martins-de-Souza, D. Proteomic Markers for Depression. In Reviews on Biomarker Studies in Psychiatric and Neurodegenerative Disorders; Guest, P.C., Ed.; Springer International Publishing: Cham, Switzerland, 2019; pp. 191–206. [Google Scholar]
- Guest, P.C.; Guest, F.L.; Martins-de Souza, D. Making Sense of Blood-Based Proteomics and Metabolomics in Psychiatric Research. Int. J. Neuropsychopharmacol. 2016, 19, pyv138. [Google Scholar] [CrossRef] [PubMed] [Green Version]
- Santa, C.; Coelho, J.F.; Madeira, N.; Manadas, B. Circulating biomarkers in schizophrenia: A proteomics perspective. Int. J. Clin. Neurosci. Ment. Health 2017, 4 (Suppl. 3), S05. [Google Scholar] [CrossRef] [Green Version]
- Cox, J.; Mann, M. Quantitative, high-resolution proteomics for data-driven systems biology. Annu. Rev. Biochem. 2011, 80, 273–299. [Google Scholar] [CrossRef]
- Aebersold, R.; Mann, M. Mass-spectrometric exploration of proteome structure and function. Nature 2016, 537, 347–355. [Google Scholar] [CrossRef]
- Bantscheff, M.; Lemeer, S.; Savitski, M.M.; Kuster, B. Quantitative mass spectrometry in proteomics: Critical review update from 2007 to the present. Anal. Bioanal. Chem. 2012, 404, 939–965. [Google Scholar] [CrossRef]
- Tuli, L.; Ressom, H.W. LC-MS Based Detection of Differential Protein Expression. J. Proteom. Bioinform. 2009, 2, 416–438. [Google Scholar] [CrossRef] [Green Version]
- Xie, F.; Liu, T.; Qian, W.-J.; Petyuk, V.A.; Smith, R.D. Liquid chromatography-mass spectrometry-based quantitative proteomics. J. Biol. Chem. 2011, 286, 25443–25449. [Google Scholar] [CrossRef] [Green Version]
- Novikova, S.I.; He, F.; Cutrufello, N.J.; Lidow, M.S. Identification of protein biomarkers for schizophrenia and bipolar disorder in the postmortem prefrontal cortex using SELDI-TOF-MS ProteinChip profiling combined with MALDI-TOF-PSD-MS analysis. Neurobiol. Dis. 2006, 23, 61–76. [Google Scholar] [CrossRef]
- Beasley, C.L.; Pennington, K.; Behan, A.; Wait, R.; Dunn, M.J.; Cotter, D. Proteomic analysis of the anterior cingulate cortex in the major psychiatric disorders: Evidence for disease-associated changes. Proteomics 2006, 6, 3414–3425. [Google Scholar] [CrossRef] [PubMed]
- Behan, A.T.; Byrne, C.; Dunn, M.J.; Cagney, G.; Cotter, D.R. Proteomic analysis of membrane microdomain-associated proteins in the dorsolateral prefrontal cortex in schizophrenia and bipolar disorder reveals alterations in LAMP, STXBP1 and BASP1 protein expression. Mol. Psychiatry 2009, 14, 601–613. [Google Scholar] [CrossRef] [PubMed] [Green Version]
- Harrison, P.J. Using our brains: The findings, flaws, and future of postmortem studies of psychiatric disorders. Biol. Psychiatry 2011, 69, 102–103. [Google Scholar] [CrossRef] [PubMed]
- Saia-Cereda, V.M.; Cassoli, J.S.; Martins-de-Souza, D.; Nascimento, J.M. Psychiatric disorders biochemical pathways unraveled by human brain proteomics. Eur. Arch. Psychiatry Clin. Neurosci. 2017, 267, 3–17. [Google Scholar] [CrossRef] [PubMed]
- Guest, P.C.; Chan, M.K.; Gottschalk, M.G.; Bahn, S. The use of proteomic biomarkers for improved diagnosis and stratification of schizophrenia patients. Biomark. Med. 2014, 8, 15–27. [Google Scholar] [CrossRef]
- Comes, A.L.; Papiol, S.; Mueller, T.; Geyer, P.E.; Mann, M.; Schulze, T.G. Proteomics for blood biomarker exploration of severe mental illness: Pitfalls of the past and potential for the future. Transl. Psychiat. 2018, 8, 160. [Google Scholar] [CrossRef] [Green Version]
- Song, Y.R.; Wu, B.; Yang, Y.T.; Chen, J.; Zhang, L.J.; Zhang, Z.W.; Shi, H.Y.; Huang, C.L.; Pan, J.X.; Xie, P. Specific alterations in plasma proteins during depressed, manic, and euthymic states of bipolar disorder. Braz. J. Med. Biol. Res. 2015, 48, 973–982. [Google Scholar] [CrossRef]
- Herberth, M.; Koethe, D.; Levin, Y.; Schwarz, E.; Krzyszton, N.D.; Schoeffmann, S.; Ruh, H.; Rahmoune, H.; Kranaster, L.; Schoenborn, T.; et al. Peripheral profiling analysis for bipolar disorder reveals markers associated with reduced cell survival. Proteomics 2011, 11, 94–105. [Google Scholar] [CrossRef]
- Wang, S.; Kojima, K.; Mobley, J.A.; West, A.B. Proteomic analysis of urinary extracellular vesicles reveal biomarkers for neurologic disease. Ebiomedicine 2019, 45, 351–361. [Google Scholar] [CrossRef] [Green Version]
- Iavarone, F.; Melis, M.; Platania, G.; Cabras, T.; Manconi, B.; Petruzzelli, R.; Cordaro, M.; Siracusano, A.; Faa, G.; Messana, I.; et al. Characterization of salivary proteins of schizophrenic and bipolar disorder patients by top-down proteomics. J. Proteom. 2014, 103, 15–22. [Google Scholar] [CrossRef]
- Boerger, M.; Funke, S.; Leha, A.; Roser, A.-E.; Wuestemann, A.-K.; Maass, F.; Bähr, M.; Grus, F.; Lingor, P. Proteomic analysis of tear fluid reveals disease-specific patterns in patients with Parkinson’s disease–A pilot study. Parkinsonism Relat. Disord. 2019, 63, 3–9. [Google Scholar] [CrossRef] [PubMed]
- Lumbreras, B.; Porta, M.; Márquez, S.; Pollán, M.; Parker, L.A.; Hernández-Aguado, I. QUADOMICS: An adaptation of the Quality Assessment of Diagnostic Accuracy Assessment (QUADAS) for the evaluation of the methodological quality of studies on the diagnostic accuracy of ‘-omics’-based technologies. Clin. Biochem. 2008, 41, 1316–1325. [Google Scholar] [CrossRef]
- Parker, L.A.; Gómez Saez, N.; Lumbreras, B.; Porta, M.; Hernández-Aguado, I. Methodological deficits in diagnostic research using ‘-omics’ technologies: Evaluation of the QUADOMICS tool and quality of recently published studies. PLoS ONE 2010, 5, e11419. [Google Scholar] [CrossRef] [Green Version]
- Balduzzi, S.; Rücker, G.; Schwarzer, G. How to perform a meta-analysis with R: A practical tutorial. Evid.-Based Ment. Health 2019, 22, 153–160. [Google Scholar] [CrossRef] [PubMed] [Green Version]
- Viechtbauer, W. Conducting Meta-Analyses in R with the metafor Package. J. Hydrol. Stat. Softw. 2010, 36, 48. [Google Scholar] [CrossRef] [Green Version]
- Harrer, M.; Cuijpers, P.; Furukawa, T.A.; Ebert, D.D. Doing Meta-Analysis in R: A Hands-on Guide; PROTECT Lab Erlangen: Erlangen, Erlangen, 2019. [Google Scholar]
- Pang, Z.; Chong, J.; Zhou, G.; de Lima Morais, D.A.; Chang, L.; Barrette, M.; Gauthier, C.; Jacques, P.-É.; Li, S.; Xia, J. MetaboAnalyst 5.0: Narrowing the gap between raw spectra and functional insights. Nucleic Acids Res. 2021, 49, W388–W396. [Google Scholar] [CrossRef] [PubMed]
- Kanehisa, M.; Sato, Y. KEGG Mapper for inferring cellular functions from protein sequences. Protein Sci. 2020, 29, 28–35. [Google Scholar] [CrossRef] [Green Version]
- Page, M.J.; McKenzie, J.E.; Bossuyt, P.M.; Boutron, I.; Hoffmann, T.C.; Mulrow, C.D.; Shamseer, L.; Tetzlaff, J.M.; Akl, E.A.; Brennan, S.E.; et al. The PRISMA 2020 statement: An updated guideline for reporting systematic reviews. BMJ 2021, 372, n71. [Google Scholar] [CrossRef]
- Sussulini, A.; Kratzin, H.; Jahn, O.; Banzato, C.E.; Arruda, M.A.; Becker, J.S. Metallomics studies of human blood serum from treated bipolar disorder patients. Anal. Chem. 2010, 82, 5859–5864. [Google Scholar] [CrossRef]
- Sussulini, A.; Dihazi, H.; Banzato, C.E.; Arruda, M.A.; Stuhmer, W.; Ehrenreich, H.; Jahn, O.; Kratzin, H.D. Apolipoprotein A-I as a candidate serum marker for the response to lithium treatment in bipolar disorder. Proteomics 2011, 11, 261–269. [Google Scholar] [CrossRef]
- Smirnova, L.; Seregin, A.; Boksha, I.; Dmitrieva, E.; Simutkin, G.; Kornetova, E.; Savushkina, O.; Letova, A.; Bokhan, N.; Ivanova, S.; et al. The difference in serum proteomes in schizophrenia and bipolar disorder. BMC Genom. 2019, 20, 14. [Google Scholar] [CrossRef] [PubMed]
- de Souza Pessoa, G.; de Jesus, J.R.; Balbuena, T.S.; Arruda, M.A.Z. Metallomics-based platforms for comparing the human blood serum profiles between bipolar disorder and schizophrenia patients. Rapid Commun. Mass Spectrom. 2019, 34, e8698. [Google Scholar] [CrossRef] [PubMed]
- Cheng, Y.; Li, Z.; He, S.; Tian, Y.; He, F.; Li, W. Elevated heat shock proteins in bipolar disorder patients with hypothalamic pituitary adrenal axis dysfunction. Medicine 2018, 97, e11089. [Google Scholar] [CrossRef]
- Petrov, B.; Aldoori, A.; James, C.; Yang, K.; Algorta, G.P. Bipolar disorder in youth is associated with increased levels of vitamin D-binding protein. Transl. Psychiatry 2018, 8, 61. [Google Scholar] [CrossRef]
- Ren, J.; Zhao, G.; Sun, X.; Liu, H.; Jiang, P.; Chen, J.; Wu, Z.; Peng, D.; Fang, Y.; Zhang, C. Identification of plasma biomarkers for distinguishing bipolar depression from major depressive disorder by iTRAQ-coupled LC-MS/MS and bioinformatics analysis. Psychoneuroendocrinology 2017, 86, 17–24. [Google Scholar] [CrossRef] [PubMed]
- Chen, J.; Huang, C.; Song, Y.; Shi, H.; Wu, D.; Yang, Y.; Rao, C.; Liao, L.; Wu, Y.; Tang, J.; et al. Comparative proteomic analysis of plasma from bipolar depression and depressive disorder: Identification of proteins associated with immune regulatory. Protein Cell 2015, 6, 908–911. [Google Scholar] [CrossRef] [PubMed] [Green Version]
- Giusti, L.; Mantua, V.; Da Valle, Y.; Ciregia, F.; Ventroni, T.; Orsolini, G.; Donadio, E.; Giannaccini, G.; Mauri, M.; Cassano, G.B.; et al. Search for peripheral biomarkers in patients affected by acutely psychotic bipolar disorder: A proteomic approach. Mol. Biosyst. 2014, 10, 1246–1254. [Google Scholar] [CrossRef]
- Chevalier, F. Highlights on the capacities of “Gel-based” proteomics. Proteome Sci. 2010, 8, 23. [Google Scholar] [CrossRef] [Green Version]
- Rhee, S.J.; Han, D.; Lee, Y.; Kim, H.; Lee, J.; Lee, K.; Shin, H.; Kim, H.; Lee, T.Y.; Kim, M.; et al. Comparison of serum protein profiles between major depressive disorder and bipolar disorder. BMC Psychiatry 2020, 20, 145. [Google Scholar] [CrossRef] [Green Version]
- Georgila, K.; Vyrla, D.; Drakos, E. Apolipoprotein A-I (ApoA-I), Immunity, Inflammation and Cancer. Cancers 2019, 11, 1097. [Google Scholar] [CrossRef] [Green Version]
- Woods, A.G.; Sokolowska, I.; Taurines, R.; Gerlach, M.; Dudley, E.; Thome, J.; Darie, C.C. Potential biomarkers in psychiatry: Focus on the cholesterol system. J. Cell. Mol. Med. 2012, 16, 1184–1195. [Google Scholar] [CrossRef] [PubMed]
- Orsó, E.; Schmitz, G. Lipoprotein(a) and its role in inflammation, atherosclerosis and malignancies. Clin. Res. Cardiol. Suppl. 2017, 12, 31–37. [Google Scholar] [CrossRef] [PubMed] [Green Version]
- Huang, J.T.; Wang, L.; Prabakaran, S.; Wengenroth, M.; Lockstone, H.E.; Koethe, D.; Gerth, C.W.; Gross, S.; Schreiber, D.; Lilley, K.; et al. Independent protein-profiling studies show a decrease in apolipoprotein A1 levels in schizophrenia CSF, brain and peripheral tissues. Mol. Psychiatry 2008, 13, 1118–1128. [Google Scholar] [CrossRef] [PubMed]
- Gomme, P.T.; McCann, K.B.; Bertolini, J. Transferrin: Structure, function and potential therapeutic actions. Drug Discov. Today 2005, 10, 267–273. [Google Scholar] [CrossRef]
- Stelzhammer, V.; Haenisch, F.; Chan, M.K.; Cooper, J.D.; Steiner, J.; Steeb, H.; Martins-de-Souza, D.; Rahmoune, H.; Guest, P.C.; Bahn, S. Proteomic changes in serum of first onset, antidepressant drug-naive major depression patients. Int. J. Neuropsychoph. 2014, 17, 1599–1608. [Google Scholar] [CrossRef] [Green Version]
- Reginia, A.; Kucharska-Mazur, J.; Jabłoński, M.; Budkowska, M.; Dołȩgowska, B.; Sagan, L.; Misiak, B.; Ratajczak, M.Z.; Rybakowski, J.K.; Samochowiec, J. Assessment of Complement Cascade Components in Patients with Bipolar Disorder. Front. Psychiatry 2018, 9, 614. [Google Scholar] [CrossRef]
- Akcan, U.; Karabulut, S.; Küçükali, C.İ.; Çakır, S.; Tüzün, E. Bipolar disorder patients display reduced serum complement levels and elevated peripheral blood complement expression levels. Acta Neuropsychiatr. 2017, 30, 70–78. [Google Scholar] [CrossRef] [Green Version]
- Thielens, N.M.; Tedesco, F.; Bohlson, S.S.; Gaboriaud, C.; Tenner, A.J. C1q: A fresh look upon an old molecule. Mol. Immunol. 2017, 89, 73–83. [Google Scholar] [CrossRef] [Green Version]
- Frye, M.A.; Nassan, M.; Jenkins, G.D.; Kung, S.; Veldic, M.; Palmer, B.A.; Feeder, S.E.; Tye, S.J.; Choi, D.S.; Biernacka, J.M. Feasibility of investigating differential proteomic expression in depression: Implications for biomarker development in mood disorders. Transl. Psychiat. 2015, 5, e689. [Google Scholar] [CrossRef] [Green Version]
- Reay, W.R.; Cairns, M.J. The role of the retinoids in schizophrenia: Genomic and clinical perspectives. Mol. Psychiatry 2020, 25, 706–718. [Google Scholar] [CrossRef]
- Barichello, T.; Giridharan, V.V.; Bhatti, G.; Sayana, P.; Doifode, T.; Macedo, D.; Quevedo, J. Inflammation as a Mechanism of Bipolar Disorder Neuroprogression. Curr. Top. Behav. Neurosci. 2021, 48, 215–237. [Google Scholar] [CrossRef] [PubMed]
- Benedetti, F.; Aggio, V.; Pratesi, M.L.; Greco, G.; Furlan, R. Neuroinflammation in Bipolar Depression. Front. Psychiatry 2020, 11, 71. [Google Scholar] [CrossRef] [PubMed] [Green Version]
- Kim, Y.; Santos, R.; Gage, F.H.; Marchetto, M.C. Molecular Mechanisms of Bipolar Disorder: Progress Made and Future Challenges. Front. Cell. Neurosci. 2017, 11, 30. [Google Scholar] [CrossRef] [PubMed] [Green Version]
- Muneer, A. The Neurobiology of Bipolar Disorder: An Integrated Approach. Chonnam Med. J. 2016, 52, 18–37. [Google Scholar] [CrossRef]
- Bauer, I.E.; Pascoe, M.C.; Wollenhaupt-Aguiar, B.; Kapczinski, F.; Soares, J.C. Inflammatory mediators of cognitive impairment in bipolar disorder. J. Psychiatr. Res. 2014, 56, 18–27. [Google Scholar] [CrossRef] [PubMed] [Green Version]
- Zuccoli, G.S.; Saia-Cereda, V.M.; Nascimento, J.M.; Martins-de-Souza, D. The Energy Metabolism Dysfunction in Psychiatric Disorders Postmortem Brains: Focus on Proteomic Evidence. Front. Neurosci. 2017, 11, 493. [Google Scholar] [CrossRef]
- Iwata, K. Mitochondrial Involvement in Mental Disorders: Energy Metabolism and Genetic and Environmental Factors. Adv. Exp. Med. Biol. 2019, 1118, 63–70. [Google Scholar] [CrossRef]
- Mongan, D.; Föcking, M.; Healy, C.; Susai, S.R.; Heurich, M.; Wynne, K.; Nelson, B.; McGorry, P.D.; Amminger, G.P.; Nordentoft, M.; et al. Development of Proteomic Prediction Models for Transition to Psychotic Disorder in the Clinical High-Risk State and Psychotic Experiences in Adolescence. JAMA Psychiatry 2021, 78, 77–90. [Google Scholar] [CrossRef]
- Adibhatla, R.M.; Hatcher, J.F. Altered lipid metabolism in brain injury and disorders. Subcell. Biochem. 2008, 49, 241–268. [Google Scholar] [CrossRef] [Green Version]
- Xu, R.; Liang, J.; Luo, Y.; Wan, X.; Li, K.; Qi, L.; Yuan, W.; Chen, J.; Wu, Z.; Wang, M.; et al. Mass spectrometry identification of potential biomarker proteins in the 150-kD electrophoretic band in patients with schizophrenia. Medicine 2018, 97, e13553. [Google Scholar] [CrossRef]
- Huang, L.; Shao, D.; Wang, Y.; Cui, X.; Li, Y.; Chen, Q.; Cui, J. Human body-fluid proteome: Quantitative profiling and computational prediction. Brief. Bioinform. 2020, 22, 315–333. [Google Scholar] [CrossRef] [PubMed] [Green Version]
- Phillips, M.L.; Kupfer, D.J. Bipolar disorder diagnosis: Challenges and future directions. Lancet 2013, 381, 1663–1671. [Google Scholar] [CrossRef] [Green Version]
- Azorin, J.M.; Belzeaux, R.; Kaladjian, A.; Adida, M.; Hantouche, E.; Lancrenon, S.; Fakra, E. Risks associated with gender differences in bipolar I disorder. J. Affect. Disord. 2013, 151, 1033–1040. [Google Scholar] [CrossRef] [PubMed]
- Vega, P.; Barbeito, S.; Ruiz de Azúa, S.; Martínez-Cengotitabengoa, M.; González-Ortega, I.; Saenz, M.; González-Pinto, A. Bipolar disorder differences between genders: Special considerations for women. Women’s Health 2011, 7, 663–674, quiz 675–666. [Google Scholar] [CrossRef]
- López-Zurbano, S.; González-Pinto, A.; López, P. Gender Differences in Bipolar Disorder. In Psychopathology in Women: Incorporating Gender Perspective into Descriptive Psychopathology; Sáenz-Herrero, M., Ed.; Springer International Publishing: Cham, Switzerland, 2015; pp. 641–659. [Google Scholar]


Publisher’s Note: MDPI stays neutral with regard to jurisdictional claims in published maps and institutional affiliations. |
© 2022 by the authors. Licensee MDPI, Basel, Switzerland. This article is an open access article distributed under the terms and conditions of the Creative Commons Attribution (CC BY) license (https://creativecommons.org/licenses/by/4.0/).
Share and Cite
Rodrigues, J.E.; Martinho, A.; Santos, V.; Santa, C.; Madeira, N.; Martins, M.J.; Pato, C.N.; Macedo, A.; Manadas, B. Systematic Review and Meta-Analysis on MS-Based Proteomics Applied to Human Peripheral Fluids to Assess Potential Biomarkers of Bipolar Disorder. Int. J. Mol. Sci. 2022, 23, 5460. https://doi.org/10.3390/ijms23105460
Rodrigues JE, Martinho A, Santos V, Santa C, Madeira N, Martins MJ, Pato CN, Macedo A, Manadas B. Systematic Review and Meta-Analysis on MS-Based Proteomics Applied to Human Peripheral Fluids to Assess Potential Biomarkers of Bipolar Disorder. International Journal of Molecular Sciences. 2022; 23(10):5460. https://doi.org/10.3390/ijms23105460
Chicago/Turabian StyleRodrigues, Joao E., Ana Martinho, Vítor Santos, Catia Santa, Nuno Madeira, Maria J. Martins, Carlos N. Pato, Antonio Macedo, and Bruno Manadas. 2022. "Systematic Review and Meta-Analysis on MS-Based Proteomics Applied to Human Peripheral Fluids to Assess Potential Biomarkers of Bipolar Disorder" International Journal of Molecular Sciences 23, no. 10: 5460. https://doi.org/10.3390/ijms23105460