
Resveratrol Prevents Cytoarchitectural and Interneuronal Alterations in the Valproic Acid Rat Model of Autism

 ,
,  ,
,  , ,
, ,
Abstract
:
1. Introduction
2. Results
2.1. Big Data Evaluation: Early Metabolic Alterations, Cell Cycle Dysfunctions, and Progressive Impairments in Embryos or Progenitor Cells from ASD-Associated Animal Models
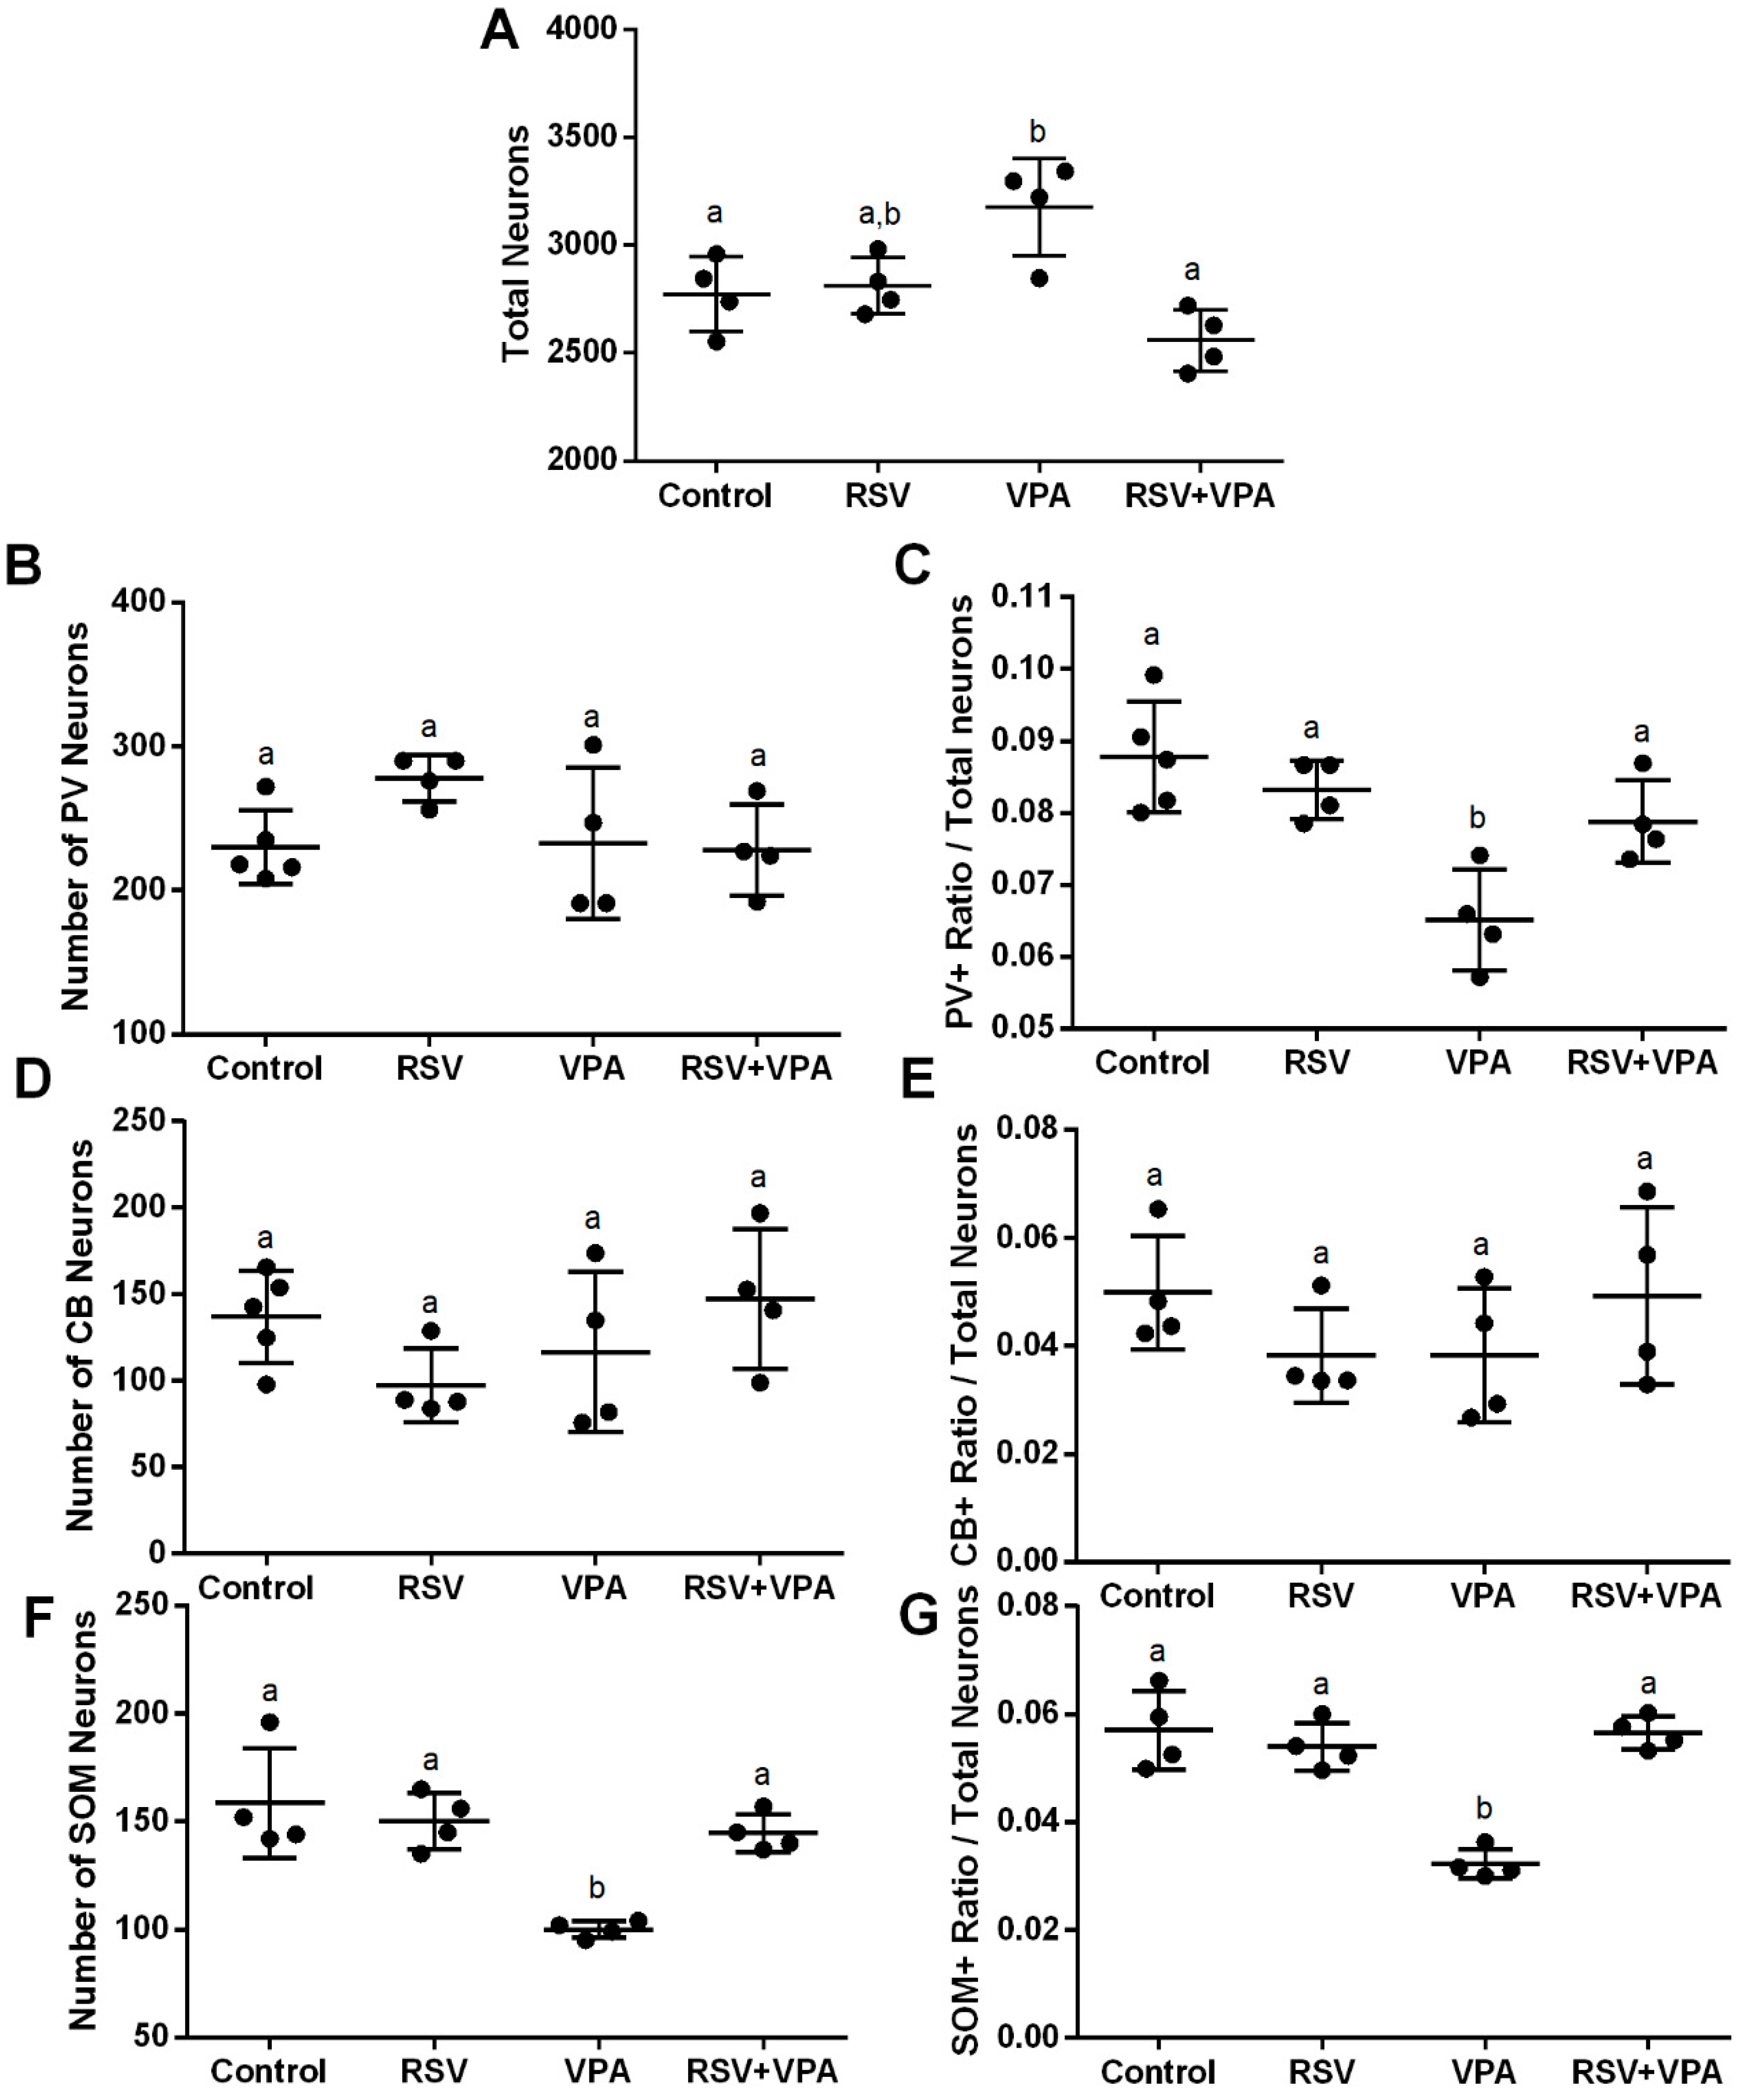
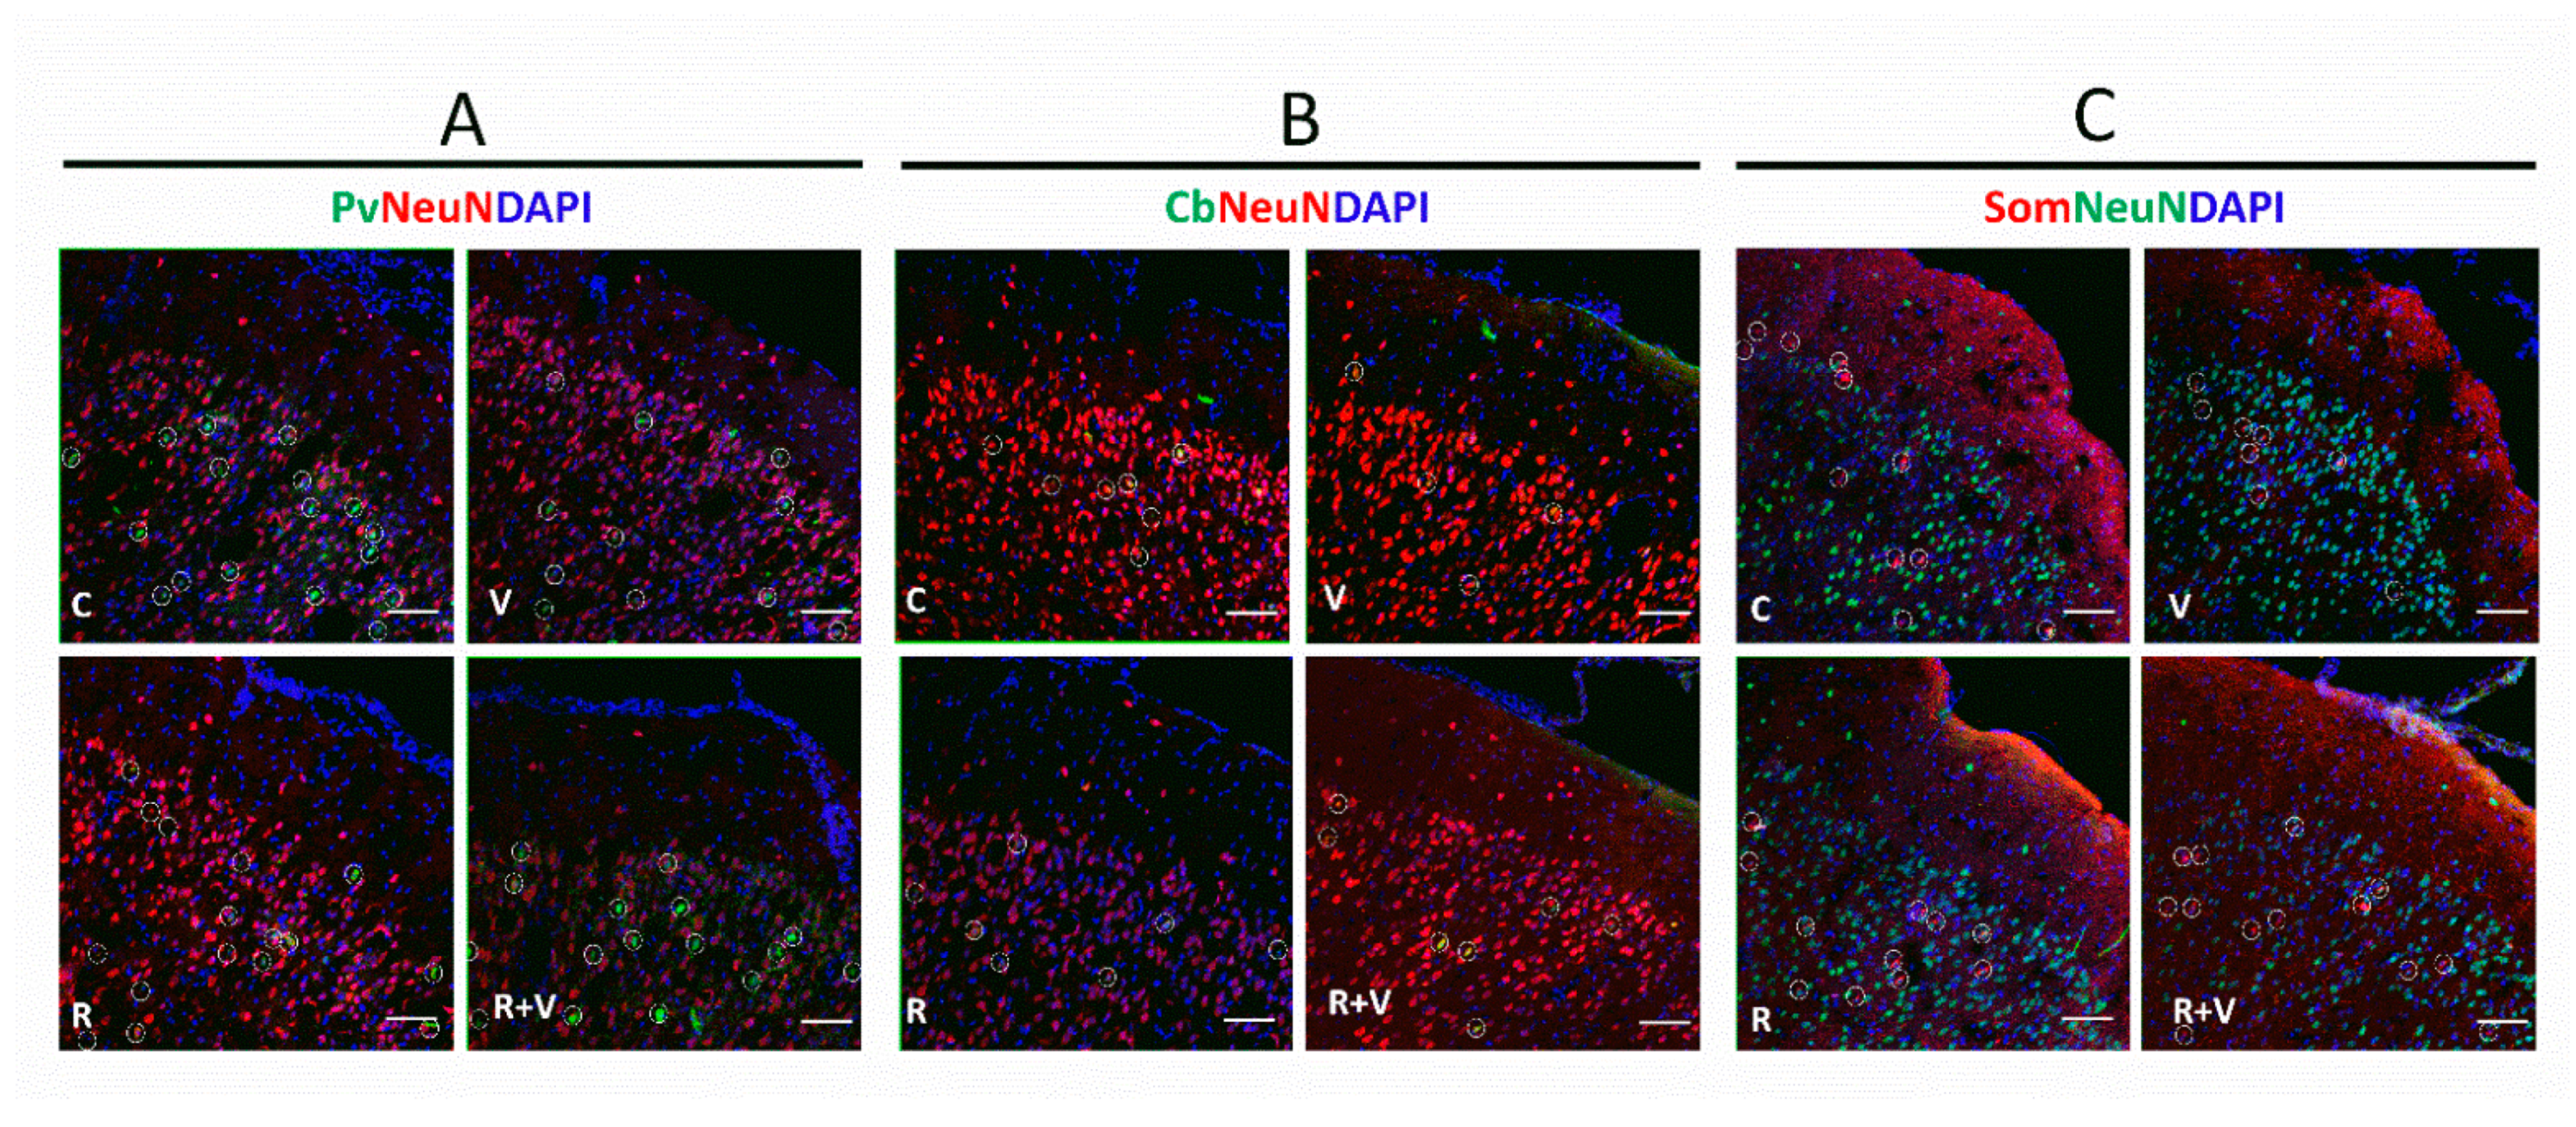
2.2. The RSV Treatment Prevented the Neuronal Number Alterations Induced by VPA in the mPFC
2.3. The RSV Treatment Prevented the Increased Total Number of Neurons in the Deeper Layers and Whole PrL and IL
2.4. The VPA Induced Alterations in PV+ Number and Ratio in Different Layers of the aCC and PrL
2.5. The VPA Induced Alterations in CB+ Ratio in the Upper Layers of aCC, PrL, and IL
2.6. The RSV Prevented the Widespread Impairments Induced by VPA in SOM+ Neurons
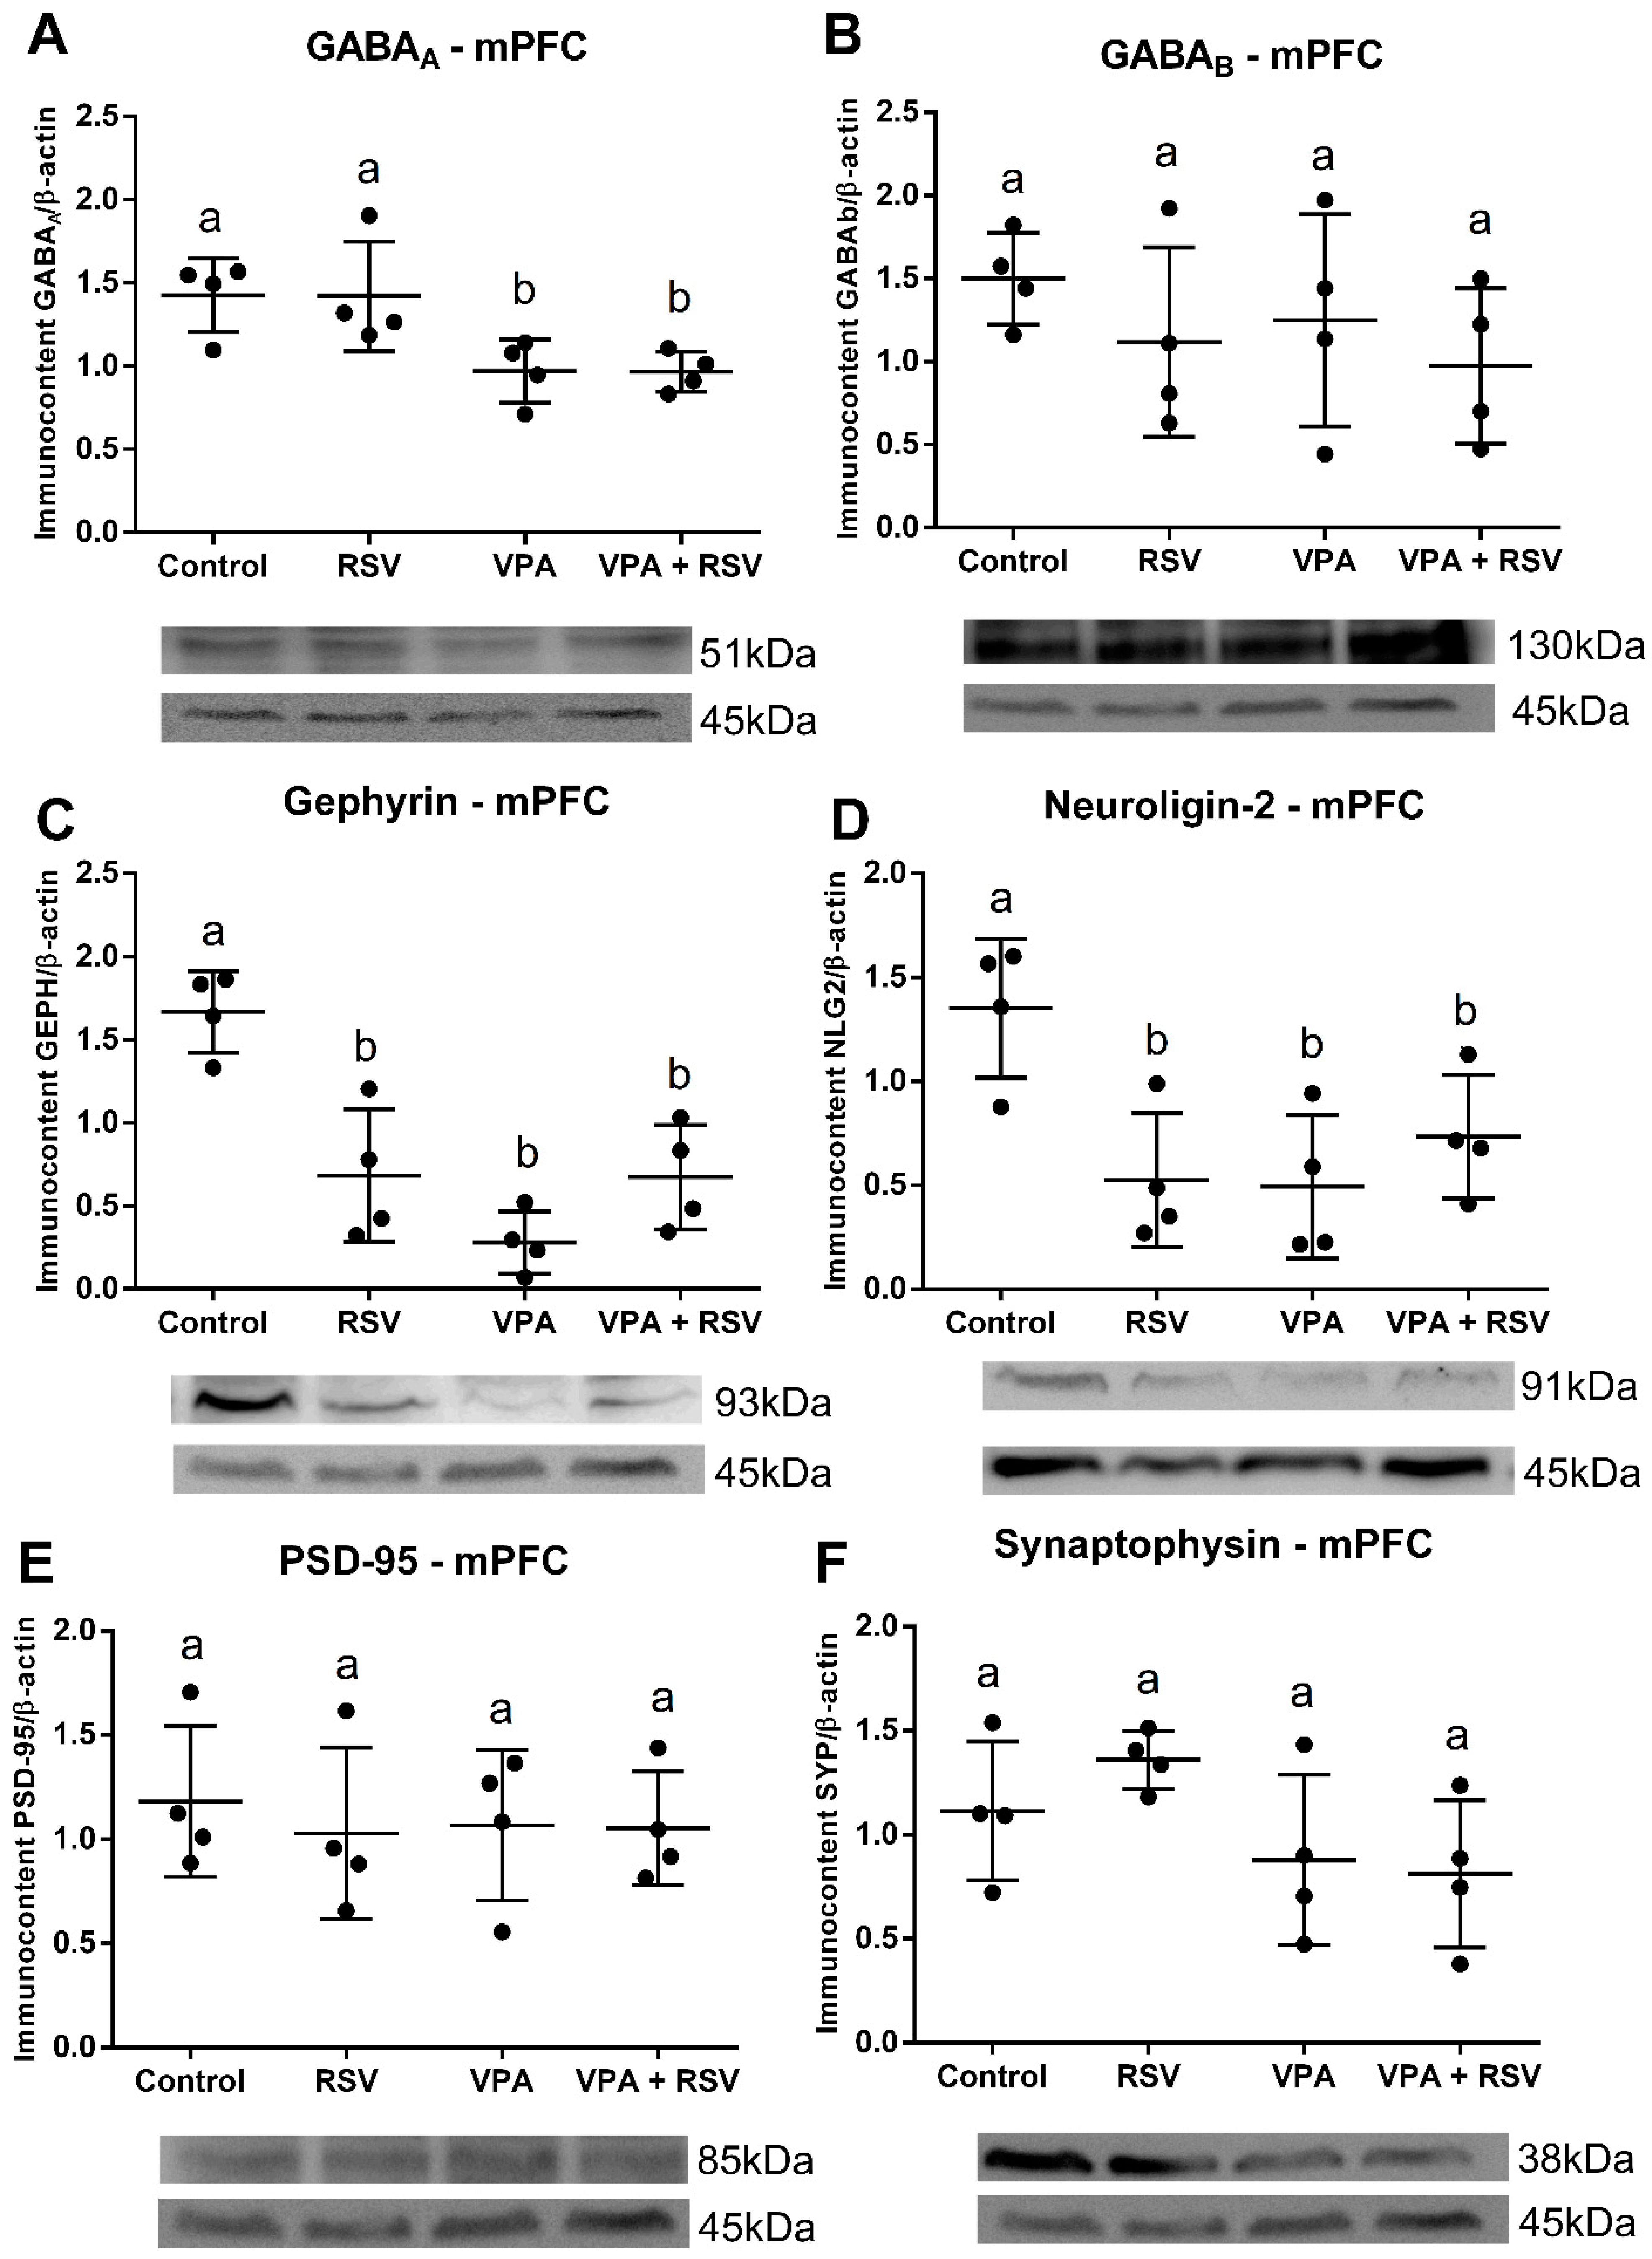
2.7. Both VPA and RSV Changed the Levels of Synaptic Proteins, whereas the Level of GABAA Was Affected Only by VPA
2.8. The VPA Decreased the Number of Total Neurons and Altered the Ratio of Interneurons in the DG, without Full Prevention by RSV
2.9. The VPA Altered the Interneuronal Composition in CA1, CA2, CA3, and RSV Presented a per se Effect in CA3
2.10. The Immunocontent of the Analyzed Proteins Did Not Differ among Groups in the Hippocampus
3. Discussion
4. Materials and Methods
4.1. Animals
4.2. Drugs and Prenatal Treatments
4.3. Immunofluorescence
4.4. Western Blotting
4.5. Transcriptomic Analysis
4.6. Statistical Analysis
5. Conclusions
Supplementary Materials
Author Contributions
Funding
Institutional Review Board Statement
Informed Consent Statement
Data Availability Statement
Acknowledgments
Conflicts of Interest
References
- American Psychiatric Association. Diagnostic and Statistical Manual of Mental Disorders (DSM-5); American Psychiatric DSM 5; American Psychiatric Association: Virginia, VA, USA, 2013; ISBN 9780890425541. [Google Scholar]
- Maenner, M.J.; Shaw, K.A.; Baio, J.; Washington, A.; Patrick, M.; DiRienzo, M.; Christensen, D.L.; Wiggins, L.D.; Pettygrove, S.; Andrews, J.G.; et al. Prevalence of autism spectrum disorder among children aged 8 Years-Autism and developmental disabilities monitoring network, 11 Sites, United States, 2016. MMWR Surveill. Summ. 2020, 69, 1–12. [Google Scholar] [CrossRef]
- Masi, A.; DeMayo, M.M.; Glozier, N.; Guastella, A.J. An Overview of Autism Spectrum Disorder, Heterogeneity and Treatment Options. Neurosci. Bull. 2017, 33, 183–193. [Google Scholar] [CrossRef] [Green Version]
- Zwaigenbaum, L.; Penner, M. Autism spectrum disorder: Advances in diagnosis and evaluation. BMJ 2018, 361, k1674. [Google Scholar] [CrossRef]
- Shulman, C.; Esler, A.; Morrier, M.J.; Rice, C.E. Diagnosis of Autism Spectrum Disorder Across the Lifespan. Child Adolesc. Psychiatr. Clin. N. Am. 2020, 29, 253–273. [Google Scholar] [CrossRef]
- Baxter, A.J.; Brugha, T.S.; Erskine, H.E.; Scheurer, R.W.; Vos, T.; Scott, J.G. The epidemiology and global burden of autism spectrum disorders. Psychol. Med. 2015, 45, 601–613. [Google Scholar] [CrossRef]
- Spence, S.J.; Schneider, M.T. The Role of Epilepsy and Epileptiform EEGs in Autism Spectrum Disorders. Pediatr. Res. 2009, 65, 599. [Google Scholar] [CrossRef] [PubMed]
- Bolton, P.F.; Carcani-Rathwell, I.; Hutton, J.; Goode, S.; Howlin, P.; Rutter, M. Epilepsy in autism: Features and correlates. Br. J. Psychiatry 2011, 198, 289–294. [Google Scholar] [CrossRef] [PubMed]
- Lukmanji, S.; Manji, S.A.; Kadhim, S.; Sauro, K.M.; Wirrell, E.C.; Kwon, C.S.; Jetté, N. The co-occurrence of epilepsy and autism: A systematic review. Epilepsy Behav. 2019, 98, 238–248. [Google Scholar] [CrossRef] [PubMed]
- Nelson, S.B.; Valakh, V. Excitatory/Inhibitory Balance and Circuit Homeostasis in Autism Spectrum Disorders. Neuron 2015, 87, 684–698. [Google Scholar] [CrossRef] [PubMed] [Green Version]
- Bozzi, Y.; Provenzano, G.; Casarosa, S. Neurobiological bases of autism-epilepsy comorbidity: A focus on excitation/inhibition imbalance. Eur. J. Neurosci. 2018, 47, 534–548. [Google Scholar] [CrossRef] [PubMed] [Green Version]
- Selten, M.; Bokhoven, H.; van Kasri, N.N. Inhibitory control of the excitatory/inhibitory balance in psychiatric disorders. F1000Research 2018, 7, 23. [Google Scholar] [CrossRef] [PubMed] [Green Version]
- Roux, L.; Buzsáki, G. Tasks for inhibitory interneurons in intact brain circuits. Neuropharmacology 2015, 88, 10–23. [Google Scholar] [CrossRef] [PubMed] [Green Version]
- Pelkey, K.A.; Chittajallu, R.; Craig, M.T.; Tricoire, L.; Wester, J.C.; McBain, C.J. Hippocampal GABAergic Inhibitory Interneurons. Physiol. Rev. 2017, 97, 1619–1647. [Google Scholar] [CrossRef] [PubMed]
- Markram, H.; Toledo-Rodriguez, M.; Wang, Y.; Gupta, A.; Silberberg, G.; Wu, C. Interneurons of the neocortical inhibitory system. Nat. Rev. Neurosci. 2004, 5, 793–807. [Google Scholar] [CrossRef] [PubMed]
- Tremblay, R.; Lee, S.; Rudy, B. GABAergic Interneurons in the Neocortex: From Cellular Properties to Circuits. Neuron 2016, 91, 260–292. [Google Scholar] [CrossRef] [Green Version]
- Defelipe, J.; López-Cruz, P.L.; Benavides-Piccione, R.; Bielza, C.; Larrañaga, P.; Anderson, S.; Burkhalter, A.; Cauli, B.; Fairén, A.; Feldmeyer, D.; et al. New insights into the classification and nomenclature of cortical GABAergic interneurons. Nat. Rev. Neurosci. 2013, 14, 202. [Google Scholar] [CrossRef] [PubMed] [Green Version]
- Kelsom, C.; Lu, W. Development and specification of GABAergic cortical interneurons. Cell Biosci. 2013, 3, 19. [Google Scholar] [CrossRef] [Green Version]
- Gentet, L.J.; Kremer, Y.; Taniguchi, H.; Huang, Z.J.; Staiger, J.F.; Petersen, C.C.H. Unique functional properties of somatostatin-expressing GABAergic neurons in mouse barrel cortex. Nat. Neurosci. 2012, 15, 607–612. [Google Scholar] [CrossRef]
- Xia, F.; Richards, B.A.; Tran, M.M.; Josselyn, S.A.; Takehara-Nishiuchi, K.; Frankland, P.W. Parvalbumin-positive interneurons mediate neocortical-hippocampal interactions that are necessary for memory consolidation. eLife 2017, 6, e27868. [Google Scholar] [CrossRef] [Green Version]
- Cho, K.K.A.; Davidson, T.J.; Bouvier, G.; Marshall, J.D.; Schnitzer, M.J.; Sohal, V.S. Cross-hemispheric gamma synchrony between prefrontal parvalbumin interneurons supports behavioral adaptation during rule shift learning. Nat. Neurosci. 2020, 23, 892–902. [Google Scholar] [CrossRef]
- Gibson, J.R.; Bartley, A.F.; Hays, S.A.; Huber, K.M. Imbalance of Neocortical Excitation and Inhibition and Altered UP States Reflect Network Hyperexcitability in the Mouse Model of Fragile X Syndrome. J. Neurophysiol. 2008, 100, 2615. [Google Scholar] [CrossRef] [PubMed]
- Polepalli, J.S.; Wu, H.; Goswami, D.; Halpern, C.H.; Südhof, T.C.; Malenka, R.C. Modulation of excitation on parvalbumin interneurons by neuroligin-3 regulates the hippocampal network. Nat. Neurosci. 2017, 20, 219–229. [Google Scholar] [CrossRef]
- He, L.J.; Liu, N.; Cheng, T.L.; Chen, X.J.; Li, Y.D.; Shu, Y.S.; Qiu, Z.L.; Zhang, X.H. Conditional deletion of Mecp2 in parvalbumin-expressing GABAergic cells results in the absence of critical period plasticity. Nat. Commun. 2014, 5, 5036. [Google Scholar] [CrossRef] [PubMed] [Green Version]
- Yu, F.H.; Mantegazza, M.; Westenbroek, R.E.; Robbins, C.A.; Kalume, F.; Burton, K.A.; Spain, W.J.; McKnight, G.S.; Scheuer, T.; Catterall, W.A. Reduced sodium current in GABAergic interneurons in a mouse model of severe myoclonic epilepsy in infancy. Nat. Neurosci. 2006, 9, 1142–1149. [Google Scholar] [CrossRef] [PubMed]
- Fatemi, S.H.; Reutiman, T.J.; Folsom, T.D.; Thuras, P.D. GABAAreceptor downregulation in brains of subjects with autism. J. Autism Dev. Disord. 2009, 39, 223–230. [Google Scholar] [CrossRef] [PubMed] [Green Version]
- Tang, G.; Gudsnuk, K.; Kuo, S.H.; Cotrina, M.L.; Rosoklija, G.; Sosunov, A.; Sonders, M.S.; Kanter, E.; Castagna, C.; Yamamoto, A.; et al. Loss of mTOR-Dependent Macroautophagy Causes Autistic-like Synaptic Pruning Deficits. Neuron 2014, 83, 1131–1143. [Google Scholar] [CrossRef] [Green Version]
- Parente, D.J.; Garriga, C.; Baskin, B.; Douglas, G.; Cho, M.T.; Araujo, G.C.; Shinawi, M. Neuroligin 2 nonsense variant associated with anxiety, autism, intellectual disability, hyperphagia, and obesity. Am. J. Med. Genet. A 2017, 173, 213–216. [Google Scholar] [CrossRef]
- Guang, S.; Pang, N.; Deng, X.; Yang, L.; He, F.; Wu, L.; Chen, C.; Yin, F.; Peng, J. Synaptopathology involved in autism spectrum disorder. Front. Cell. Neurosci. 2018, 12, 471. [Google Scholar] [CrossRef] [PubMed] [Green Version]
- Glass, R.; Norton, S.; Fox, N.; Kusnecov, A.W. Maternal immune activation with staphylococcal enterotoxin A produces unique behavioral changes in C57BL/6 mouse offspring. Brain. Behav. Immun. 2019, 75, 12–25. [Google Scholar] [CrossRef] [PubMed]
- Boulanger-Bertolus, J.; Pancaro, C.; Mashour, G.A. Increasing role of maternal immune activation in neurodevelopmental disorders. Front. Behav. Neurosci. 2018, 12, 230. [Google Scholar] [CrossRef] [PubMed] [Green Version]
- Oskvig, D.B.; Elkahloun, A.G.; Johnson, K.R.; Phillips, T.M.; Herkenham, M. Maternal immune activation by LPS selectively alters specific gene expression profiles of interneuron migration and oxidative stress in the fetus without triggering a fetal immune response. Brain. Behav. Immun. 2012, 26, 623–634. [Google Scholar] [CrossRef] [PubMed] [Green Version]
- Bergdolt, L.; Dunaevsky, A. Brain changes in a maternal immune activation model of neurodevelopmental brain disorders. Prog. Neurobiol. 2019, 175, 1–19. [Google Scholar] [CrossRef]
- Fontes-Dutra, M.; Rabelo, B.; Santos-Terra, J.; Deckmann, I.; Schwingel, G.B.; Gottfried, C. Maternal Immune Activation and Neuropsychiatric Disorders: The Intricate Puzzle of Autism Spectrum Disorder. In Perinatal Inflammation and Adult Psychopathology; Springer: Cham, Switzerland, 2020. [Google Scholar]
- Bambini-Junior, V.; Zanatta, G.; Della Flora Nunes, G.; Mueller de Melo, G.; Michels, M.; Fontes-Dutra, M.; Nogueira Freire, V.; Riesgo, R.; Gottfried, C. Resveratrol prevents social deficts in animal model of autism induced by valproic acid. Neurosci. Lett. 2014, 583, 176–181. [Google Scholar] [CrossRef]
- Fontes-Dutra, M.; Santos-Terra, J.; Deckmann, I.; Brum Schwingel, G.; Della-Flora Nunes, G.; Hirsch, M.M.; Bauer-Negrini, G.; Hedin-Pereira, C.; Bambini-Junior, V.; Riesgo, R.S.; et al. Resveratrol prevents cellular and behavioral sensory alterations in the animal model of autism induced by valproic acid. Front. Synaptic Neurosci. 2018, 10, 9. [Google Scholar] [CrossRef] [Green Version]
- Fontes-Dutra, M.; Della-Flora Nunes, G.; Santos-Terra, J.; Souza-Nunes, W.; Bauer-Negrini, G.; Hirsch, M.M.; Green, L.; Riesgo, R.; Gottfried, C.; Bambini-Junior, V. Abnormal empathy-like pro-social behaviour in the valproic acid model of autism spectrum disorder. Behav. Brain Res. 2019, 364, 11–18. [Google Scholar] [CrossRef] [PubMed]
- Hirsch, M.M.; Deckmann, I.; Fontes-Dutra, M.; Bauer-Negrini, G.; Della-Flora Nunes, G.; Nunes, W.; Rabelo, B.; Riesgo, R.; Margis, R.; Bambini-Junior, V.; et al. Behavioral alterations in autism model induced by valproic acid and translational analysis of circulating microRNA. Food Chem. Toxicol. 2018, 115, 336–343. [Google Scholar] [CrossRef]
- Gottfried, C.; Bambini-Junior, V.; Baronio, D.; Zanatta, G.; Bristot, R.; Vaccaro, T.; Riesgo, R. Valproic Acid in Autism Spectrum Disorder: From an Environmental Risk Factor to a Reliable Animal Model. In Recent Advances in Autism Spectrum Disorders; IntechOpen: London, UK, 2013; Volume I. [Google Scholar]
- Watanabe, Y.; Murakami, T.; Kawashima, M.; Hasegawa-Baba, Y.; Mizukami, S.; Imatanaka, N.; Akahori, Y.; Yoshida, T.; Shibutani, M. Maternal Exposure to Valproic Acid Primarily Targets Interneurons Followed by Late Effects on Neurogenesis in the Hippocampal Dentate Gyrus in Rat Offspring. Neurotox. Res. 2017, 31, 46–62. [Google Scholar] [CrossRef]
- Santos-Terra, J.; Deckmann, I.; Schwingel, G.B.; Paz, A.V.C.; Gama, C.S.; Bambini-Junior, V.; Fontes-Dutra, M.; Gottfried, C. Resveratrol prevents long-term structural hippocampal alterations and modulates interneuron organization in an animal model of ASD. Brain Res. 2021, 1768, 147593. [Google Scholar] [CrossRef] [PubMed]
- Deckmann, I.; Schwingel, G.B.; Fontes-Dutra, M.; Bambini-Junior, V.; Gottfried, C. Neuroimmune Alterations in Autism: A Translational Analysis Focusing on the Animal Model of Autism Induced by Prenatal Exposure to Valproic Acid. Neuroimmunomodulation 2018, 25, 285–299. [Google Scholar] [CrossRef] [PubMed]
- Baronio, D.; Bauer-Negrini, G.; Castro, K.; Della-Flora Nunes, G.; Riesgo, R.; Mendes-Da-Cruz, D.A.; Savino, W.; Gottfried, C.; Bambini-Junior, V. Reduced CD4 T Lymphocytes in Lymph Nodes of the Mouse Model of Autism Induced by Valproic Acid. Neuroimmunomodulation 2018, 25, 280–284. [Google Scholar] [CrossRef] [PubMed]
- Cristiano, C.; Volpicelli, F.; Crispino, M.; Lacivita, E.; Russo, R.; Leopoldo, M.; Calignano, A.; Perrone-Capano, C. Behavioral, Anti-Inflammatory, and Neuroprotective Effects of a Novel FPR2 Agonist in Two Mouse Models of Autism. Pharmaceuticals 2022, 15, 161. [Google Scholar] [CrossRef]
- Magaji, M.G.; Iniaghe, L.O.; Abolarin, M.; Abdullahi, O.I.; Magaji, R.A. Neurobehavioural evaluation of resveratrol in murine models of anxiety and schizophrenia. Metab. Brain Dis. 2017, 32, 437–442. [Google Scholar] [CrossRef] [PubMed]
- Rafeiy-Torghabeh, M.; Ashraf-Ganjouei, A.; Moradi, K.; Bagheri, S.; Mohammadi, M.R.; Akhondzadeh, S. Resveratrol adjunct to methylphenidate improves symptoms of attention-deficit/hyperactivity disorder: A randomized, double-blinded, placebo-controlled clinical trial. Eur. Child Adolesc. Psychiatry 2020, 30, 799–807. [Google Scholar] [CrossRef] [PubMed]
- Quincozes-Santos, A.; Gottfried, C. Resveratrol modulates astroglial functions: Neuroprotective hypothesis. Ann. N. Y. Acad. Sci. 2011, 1215, 72–78. [Google Scholar] [CrossRef]
- Caruso, G.; Torrisi, S.A.; Mogavero, M.P.; Currenti, W.; Castellano, S.; Godos, J.; Ferri, R.; Galvano, F.; Leggio, G.M.; Grosso, G.; et al. Polyphenols and neuroprotection: Therapeutic implications for cognitive decline. Pharmacol. Ther. 2022, 232, 108013. [Google Scholar] [CrossRef]
- Casanova, M.F.; van Kooten, I.A.J.; Switala, A.E.; van Engeland, H.; Heinsen, H.; Steinbusch, H.W.M.; Hof, P.R.; Trippe, J.; Stone, J.; Schmitz, C. Minicolumnar abnormalities in autism. Acta Neuropathol. 2006, 112, 287–303. [Google Scholar] [CrossRef] [PubMed]
- Stoner, R.; Chow, M.L.; Boyle, M.P.; Sunkin, S.M.; Mouton, P.R.; Roy, S.; Wynshaw-Boris, A.; Colamarino, S.A.; Lein, E.S.; Courchesne, E. Patches of Disorganization in the Neocortex of Children with Autism. N. Engl. J. Med. 2014, 370, 1209–1219. [Google Scholar] [CrossRef] [PubMed] [Green Version]
- Belmonte, M.K.; Allen, G.; Beckel-Mitchener, A.; Boulanger, L.M.; Carper, R.A.; Webb, S.J. Autism and abnormal development of brain connectivity. J. Neurosci. 2004, 24, 9228–9231. [Google Scholar] [CrossRef] [PubMed]
- Zheng, X.; Boyer, L.; Jin, M.; Mertens, J.; Kim, Y.; Ma, L.; Ma, L.; Hamm, M.; Gage, F.H.; Hunter, T. Metabolic reprogramming during neuronal differentiation from aerobic glycolysis to neuronal oxidative phosphorylation. eLife 2016, 5, e13374. [Google Scholar] [CrossRef] [PubMed]
- Salsaa, M.; Pereira, B.; Liu, J.; Yu, W.; Jadhav, S.; Hüttemann, M.; Greenberg, M.L. Valproate inhibits mitochondrial bioenergetics and increases glycolysis in Saccharomyces cerevisiae. Sci. Rep. 2020, 10, 11785. [Google Scholar] [CrossRef] [PubMed]
- Tung, E.W.Y.; Winn, L.M. Valproic Acid Increases Formation of Reactive Oxygen Species and Induces Apoptosis in Postimplantation Embryos: A Role for Oxidative Stress in Valproic Acid-Induced Neural Tube Defects. Mol. Pharmacol. 2011, 80, 979–987. [Google Scholar] [CrossRef] [PubMed]
- Göttlicher, M.; Minucci, S.; Zhu, P.; Krämer, O.H.; Schimpf, A.; Giavara, S.; Sleeman, J.P.; Lo Coco, F.; Nervi, C.; Pelicci, P.G.; et al. Valproic acid defines a novel class of HDAC inhibitors inducing differentiation of transformed cells. EMBO J. 2001, 20, 6969–6978. [Google Scholar] [CrossRef] [Green Version]
- Phiel, C.J.; Zhang, F.; Huang, E.Y.; Guenther, M.G.; Lazar, M.A.; Klein, P.S. Histone deacetylase is a direct target of valproic acid, a potent anticonvulsant, mood stabilizer, and teratogen. J. Biol. Chem. 2001, 276, 36734–36741. [Google Scholar] [CrossRef] [PubMed] [Green Version]
- Borra, M.T.; Smith, B.C.; Denu, J.M. Mechanism of human SIRT1 activation by resveratrol. J. Biol. Chem. 2005, 280, 17187–17195. [Google Scholar] [CrossRef] [PubMed] [Green Version]
- Courchesne, E.; Mouton, P.R.; Calhoun, M.E.; Semendeferi, K.; Ahrens-Barbeau, C.; Hallet, M.J.; Barnes, C.C.; Pierce, K. Neuron Number and Size in Prefrontal Cortex of Children With Autism. JAMA 2011, 306, 2001. [Google Scholar] [CrossRef]
- Kanari, L.; Ramaswamy, S.; Shi, Y.; Morand, S.; Meystre, J.; Perin, R.; Abdellah, M.; Wang, Y.; Hess, K.; Markram, H. Objective Morphological Classification of Neocortical Pyramidal Cells. Cereb. Cortex 2019, 29, 1719–1735. [Google Scholar] [CrossRef] [PubMed]
- Wu, Y.K.; Fujishima, K.; Kengaku, M. Differentiation of Apical and Basal Dendrites in Pyramidal Cells and Granule Cells in Dissociated Hippocampal Cultures. PLoS ONE 2015, 10, e0118482. [Google Scholar] [CrossRef] [PubMed] [Green Version]
- Fujimura, K.; Mitsuhashi, T.; Shibata, S.; Shimozato, S.; Takahashi, T. In Utero Exposure to Valproic Acid Induces Neocortical Dysgenesis via Dysregulation of Neural Progenitor Cell Proliferation/Differentiation. J. Neurosci. 2016, 36, 10908–10919. [Google Scholar] [CrossRef] [PubMed] [Green Version]
- Butt, S.J.B.; Fuccillo, M.; Nery, S.; Noctor, S.; Kriegstein, A.; Corbin, J.G.; Fishell, G. The temporal and spatial origins of cortical interneurons predict their physiological subtype. Neuron 2005, 48, 591–604. [Google Scholar] [CrossRef] [PubMed] [Green Version]
- Oyabu, A.; Narita, M.; Tashiro, Y. The effects of prenatal exposure to valproic acid on the initial development of serotonergic neurons. Int. J. Dev. Neurosci. 2013, 31, 202–208. [Google Scholar] [CrossRef] [PubMed]
- Lauber, E.; Filice, F.; Schwaller, B. Prenatal Valproate Exposure Differentially Affects Parvalbumin-Expressing Neurons and Related Circuits in the Cortex and Striatum of Mice. Front. Mol. Neurosci. 2016, 9, 150. [Google Scholar] [CrossRef] [PubMed] [Green Version]
- Oblak, A.; Gibbs, T.T.; Blatt, G.J. Decreased GABA A receptors and benzodiazepine binding sites in the anterior cingulate cortex in autism. Autism Res. 2009, 2, 205–219. [Google Scholar] [CrossRef] [PubMed] [Green Version]
- Bortone, D.; Polleux, F. KCC2 Expression Promotes the Termination of Cortical Interneuron Migration in a Voltage-Sensitive Calcium-Dependent Manner. Neuron 2009, 62, 53–71. [Google Scholar] [CrossRef] [Green Version]
- Giniger, E. Notch signaling and neural connectivity. Curr. Opin. Genet. Dev. 2012, 22, 339–346. [Google Scholar] [CrossRef] [PubMed] [Green Version]
- Salama-Cohen, P.; Arevalo, M.-A.; Grantyn, R.; Rodriguez-Tebar, A. Notch and NGF/p75NTR control dendrite morphology and the balance of excitatory/inhibitory synaptic input to hippocampal neurones through Neurogenin 3. J. Neurochem. 2006, 97, 1269–1278. [Google Scholar] [CrossRef]
- Ji, Y.; Ke, Y.; Gao, S. Intermittent activation of notch signaling promotes bone formation. Am. J. Transl. Res. 2017, 9, 2933–2944. [Google Scholar]
- Abbas, A.I.; Sundiang, M.J.M.; Henoch, B.; Morton, M.P.; Bolkan, S.S.; Park, A.J.; Harris, A.Z.; Kellendonk, C.; Gordon, J.A. Somatostatin Interneurons Facilitate Hippocampal-Prefrontal Synchrony and Prefrontal Spatial Encoding. Neuron 2018, 100, 926–939.e3. [Google Scholar] [CrossRef] [PubMed] [Green Version]
- Juliandi, B.; Tanemura, K.; Igarashi, K.; Tominaga, T.; Furukawa, Y.; Otsuka, M.; Moriyama, N.; Ikegami, D.; Abematsu, M.; Sanosaka, T.; et al. Reduced Adult Hippocampal Neurogenesis and Cognitive Impairments following Prenatal Treatment of the Antiepileptic Drug Valproic Acid. Stem Cell Rep. 2015, 5, 996–1009. [Google Scholar] [CrossRef] [Green Version]
- Danzer, S.C. Valproic Acid Leads New Neurons Down the Wrong Path. Epilepsy Curr. 2019, 19, 132–133. [Google Scholar] [CrossRef]
- Mishra, V.; Shuai, B.; Kodali, M.; Shetty, G.A.; Hattiangady, B.; Rao, X.; Shetty, A.K. Resveratrol Treatment after Status Epilepticus Restrains Neurodegeneration and Abnormal Neurogenesis with Suppression of Oxidative Stress and Inflammation. Sci. Rep. 2015, 5, 17807. [Google Scholar] [CrossRef] [Green Version]
- Paxinos, G.; Watson, C. The Rat Brain in Stereotaxic Coordinates—The New Coronal Set, 5th ed.; Academic Press: Cambridge, MA, USA, 2004; Volume 1, ISBN 9780080474120. [Google Scholar]
- Schneider, C.A.; Rasband, W.S.; Eliceiri, K.W. NIH Image to ImageJ: 25 years of image analysis. Nat. Methods 2012, 9, 671–675. [Google Scholar] [CrossRef]
- Lowry, O.H.; Rosebrough, N.J.; Farr, A.L.; Randall, R.J. Protein measurement with the Folin phenol reagent. J. Biol. Chem. 1951, 193, 265–275. [Google Scholar] [CrossRef]
- Deckmann, I.; Santos-Terra, J.; Fontes-Dutra, M.; Körbes-Rockenbach, M.; Bauer-Negrini, G.; Schwingel, G.B.; Riesgo, R.; Bambini-Junior, V.; Gottfried, C. Resveratrol prevents brain edema, blood–brain barrier permeability, and altered aquaporin profile in autism animal model. Int. J. Dev. Neurosci. 2021, 81, 579–604. [Google Scholar] [CrossRef] [PubMed]
- Balmer, N.V.; Klima, S.; Rempel, E.; Ivanova, V.N.; Kolde, R.; Weng, M.K.; Meganathan, K.; Henry, M.; Sachinidis, A.; Berthold, M.R.; et al. From transient transcriptome responses to disturbed neurodevelopment: Role of histone acetylation and methylation as epigenetic switch between reversible and irreversible drug effects. Arch. Toxicol. 2014, 88, 1451–1468. [Google Scholar] [CrossRef] [PubMed]
- Cui, K.; Wang, Y.; Zhu, Y.; Tao, T.; Yin, F.; Guo, Y.; Liu, H.; Li, F.; Wang, P.; Chen, Y.; et al. Neurodevelopmental impairment induced by prenatal valproic acid exposure shown with the human cortical organoid-on-a-chip model. Microsyst. Nanoeng. 2020, 6, 49. [Google Scholar] [CrossRef] [PubMed]
- Kalish, B.T.; Kim, E.; Finander, B.; Duffy, E.E.; Kim, H.; Gilman, C.K.; Yim, Y.S.; Tong, L.; Kaufman, R.J.; Griffith, E.C.; et al. Maternal immune activation in mice disrupts proteostasis in the fetal brain. Nat. Neurosci. 2020, 24, 204–213. [Google Scholar] [CrossRef] [PubMed]
- Canales, C.P.; Estes, M.L.; Cichewicz, K.; Angara, K.; Aboubechara, J.P.; Cameron, S.; Prendergast, K.; Su-Feher, L.; Zdilar, I.; Kreun, E.J.; et al. Sequential perturbations to mouse corticogenesis following in utero maternal immune activation. eLife 2021, 10, e60100. [Google Scholar] [CrossRef] [PubMed]
- Shannon, P.; Markiel, A.; Ozier, O.; Baliga, N.S.; Wang, J.T.; Ramage, D.; Amin, N.; Schwikowski, B.; Ideker, T. Cytoscape: A software environment for integrated models of biomolecular interaction networks. Genome Res. 2003, 13, 2498–2504. [Google Scholar] [CrossRef] [PubMed]
- Maere, S.; Heymans, K.; Kuiper, M. BiNGO: A Cytoscape plugin to assess overrepresentation of gene ontology categories in biological networks. Bioinformatics 2005, 21, 3448–3449. [Google Scholar] [CrossRef] [Green Version]
- Banerjee-Basu, S.; Packer, A. SFARI Gene: An evolving database for the autism research community. Dis. Model. Mech. 2010, 3, 133–135. [Google Scholar] [CrossRef] [Green Version]


| Reference | Animal Model/Sample | Embryonic Day | Method |
|---|---|---|---|
| Balmer et al., 2014 (DS1) | Neural differentiated hESC exposed to VPA | 6 h and 4 days after VPA exposure | Microarray |
| Canales et al., 2021 (DS2) | MIA Poly(I:C), mouse cortex | E12.5, E14.5, and E17.5 | RNA-Seq |
| Cui et al., 2020 (DS3) | Cortical organoids exposed to VPA | 5 days after exposure | RNA-Seq |
| Kalish et al., 2021 (DS4) | MIA Poly(I:C), mouse brain | E14 and E18 | RNA-Seq (single-cell) |
| Oskvig et al., 2012 (DS5) | MIA Poly(I:C), rat cortex | E15 | Microarray |
| Mean ± SD | F (DFn. DFd); p-Value | Pairwise Comparisons | ||
|---|---|---|---|---|
| Total Neurons aCC (II/III) | CON: 336.00 ± 39.75 RSV: 321.00 ± 42.35 VPA: 371.25 ± 59.35 RSV + VPA: 318.75 ± 41.60 | Interaction: F (1, 12) = 0.6523 p = 0.4350 VPA: F (1, 12) = 0.5052 p = 0.4908 RSV: F (1, 12) = 2.113 p = 0.1717 | CON vs. RSV: | >0.9999 |
| CON vs. VPA: | >0.9999 | |||
| CON vs. RSV + VPA: | >0.9999 | |||
| RSV vs. VPA: | 0.9108 | |||
| RSV vs. RSV + VPA: | >0.9999 | |||
| VPA vs. RSV + VPA: | 0.8147 | |||
| Total Neurons aCC (IV/V) | CON: 555.25 ± 76.01 RSV: 513.00 ± 13.71 VPA: 650.25 ± 49.85 RSV + VPA: 506.75 ± 39.78 | Interaction: F (1, 12) = 4.086 p = 0.0661 # VPA: F (1, 12) = 3.140 p = 0.1018 RSV: F (1, 12) = 13.75 p = 0.0030 ** | CON vs. RSV: | >0.9999 |
| CON vs. VPA: | 0.1197 | |||
| CON vs. RSV + VPA: | >0.9999 | |||
| RSV vs. VPA: | 0.0132 * | |||
| RSV vs. RSV + VPA: | >0.9999 | |||
| VPA vs. RSV + VPA: | 0.0096 ** | |||
| Total Neurons Whole aCC | CON: 891.25 ± 104.45 RSV: 834.00 ± 51,153 VPA: 1021.00 ± 107.97 RSV + VPA: 825.50 ± 71.11 | Interaction: F (1, 12) = 2.546 p = 0.1365 VPA: F (1, 12) = 1.960 p = 0.1868 RSV: F (1, 12) = 8.482 p = 0.0130 * | CON vs. RSV: | >0.9999 |
| CON vs. VPA: | 0.3342 | |||
| CON vs. RSV + VPA: | >0.9999 | |||
| RSV vs. VPA: | 0.0606 # | |||
| RSV vs. RSV + VPA: | >0.9999 | |||
| VPA vs. RSV + VPA: | 0.0469 * | |||
| Total Neurons PrL (II/III) | CON: 368.25 ± 55.12 RSV: 363.50 ± 14.91 VPA: 404.75 ± 28.15 RSV + VPA: 325.75 ± 13.25 | Interaction: F (1, 12) = 5.214 p = 0.0414 * VPA: F (1, 12) = 0.001478 p = 0.9700 RSV: F (1, 12) = 6.633 p = 0.0243 * | CON vs. RSV: | >0.9999 |
| CON vs. VPA: | 0.8305 | |||
| CON vs. RSV + VPA: | 0.5360 | |||
| RSV vs. VPA: | 0.5882 | |||
| RSV vs. RSV + VPA: | 0.7594 | |||
| VPA vs. RSV + VPA: | 0.0296 * | |||
| Total Neurons PrL (IV/V) | CON: 572.50 ± 22.10 RSV: 611.25 ± 62.50 VPA: 693.00 ± 49.22 RSV + VPA: 536.00 ± 49.43 | Interaction: F (1, 12) = 16.54 p = 0.0016 ** VPA: F (1, 12) = 0.8838 p = 0.3657 RSV: F (1, 12) = 6.036 p = 0.0302 * | CON vs. RSV: | >0.9999 |
| CON vs. VPA: | 0.0244 * | |||
| CON vs. RSV + VPA: | >0.9999 | |||
| RSV vs. VPA: | 0.2004 | |||
| RSV vs. RSV + VPA: | 0.2832 | |||
| VPA vs. RSV + VPA: | 0.0036 ** | |||
| Total Neurons Whole PrL | CON: 940.75 ± 63.10 RSV: 974.75 ± 76.61 VPA: 1097.75 ± 61.32 RSV + VPA: 861.75 ± 60.10 | Interaction: F (1, 12) = 16.93 p = 0.0014 ** F (1, 12) = 0.4497 p = 0.5152 F (1, 12) = 9.478 p = 0.0096 ** | CON vs. RSV: | >0.9999 |
| CON vs. VPA: | 0.0326 * | |||
| CON vs. RSV + VPA: | 0.6861 | |||
| RSV vs. VPA: | >0.1268 | |||
| RSV vs. RSV + VPA: | 0.1884 | |||
| VPA vs. RSV + VPA: | 0.0016 ** | |||
| Total Neurons IL (II/III) | CON: 348.75 ± 47.98 RSV: 355.75 ± 26.98 VPA: 363.25 ± 20.85 RSV + VPA: 315.25 ± 17.41 | Interaction: F (1, 12) =3.49 p = 0.0880 # VPA: F (1, 12) = 0.7707 p = 0.3972 RSV: F (1, 12) = 1.917 p =0.1914 | CON vs. RSV: | >0.9999 |
| CON vs. VPA: | >0.9999 | |||
| CON vs. RSV + VPA: | 0.8139 | |||
| RSV vs. VPA: | >0.9999 | |||
| RSV vs. RSV + VPA: | 0.4623 | |||
| VPA vs. RSV + VPA: | 0.2447 | |||
| Total Neurons IL (IV/V) | CON: 593.75 ± 39.22 RSV: 646.00 ± 26.24 VPA: 696.50 ± 51.39 RSV + VPA: 557.00 ± 54.16 | Interaction: F (1, 12) = 18.75 p = 0.0010 ** VPA: F (1, 12) = 0.1041 p = 0.7525 RSV: F (1, 12) = 3.858 p = 0.0731 # | CON vs. RSV: | 0.7209 |
| CON vs. VPA: | 0.0387 * | |||
| CON vs. RSV + VPA: | >0.9999 | |||
| RSV vs. VPA: | 0.7910 | |||
| RSV vs. RSV + VPA: | 0.0904 # | |||
| VPA vs. RSV + VPA: | 0.0047 ** | |||
| Total Neurons Whole IL | CON: 942.50 ± 27.47 RSV: 1001.75 ± 35.08 VPA: 1059.75 ± 66.74 RSV + VPA: 872.75 ± 53.72 | Interaction: F (1, 12) = 26.01 p = 0.0003 *** VPA: F (1, 12) = 0.05921 p = 0.8119 RSV: F (1, 12) = 7.000 p = 0.0213 | CON vs. RSV: | 0.6496 |
| CON vs. VPA: | 0.0297 * | |||
| CON vs. RSV + VPA: | 0.3820 | |||
| RSV vs. VPA: | 0.6908 | |||
| RSV vs. RSV + VPA: | 0.0158 * | |||
| VPA vs. RSV + VPA: | 0.0008 *** | |||
| Mean ± SD | F (DFn. DFd); p-Value | Pairwise Comparisons | ||
|---|---|---|---|---|
| PV Total aCC (II/III) | CON: 30.200 ± 2.863564 RSV: 28.750 ± 5.560276 VPA: 21.250 ± 7.274384 RSV + VPA: 25.000 ± 0.816 | Interaction: F (1, 13) = 1.292 p = 0.2761 VPA: F (1, 13) = 7.709 p = 0.0157 * RSV: F (1, 13) = 0.2528 p = 0.6235 | CON vs. RSV: | >0.9999 |
| CON vs. VPA: | 0.0830 | |||
| CON vs. RSV + VPA: | 0.7351 | |||
| RSV vs. VPA: | 0.2497 | |||
| RSV vs. RSV + VPA: | >0.9999 | |||
| VPA vs. RSV + VPA: | >0.9999 | |||
| PV Ratio aCC (II/III) | CON: 0.0804 ± 0.005 RSV: 0.0812 ± 0.017 VPA: 0.0506 ± 0.009 RSV + VPA: 0.0777 ± 0.005 | Interaction: F (1, 13) = 6.862 p = 0.0212 * VPA: F (1, 13) = 11.06 p = 0.0055 ** RSV: F (1, 13) = 7.772 p = 0.0154 * | CON vs. RSV: | 0.9999 |
| CON vs. VPA: | 0.0050 ** | |||
| CON vs. RSV + VPA: | 0.9999 | |||
| RSV vs. VPA: | 0.0061 ** | |||
| RSV vs. RSV + VPA: | 0.9999 | |||
| VPA vs. RSV + VPA: | 0.0152 * | |||
| PV Total aCC (IV/V) | CON: 51.800 ± 8.55 RSV: 50.500 ± 13.89 VPA: 36.750 ± 15.37 RSV + VPA: 49.500 ± 10.96 | Interaction: F (1, 13) = 1.391 p = 0.2593 VPA: F (1, 13) = 1.816 p = 0.2009 RSV: F (1, 13) = 0.9240 p = 0.3540 | CON vs. RSV: | 0.9999 |
| CON vs. VPA: | 0.5361 | |||
| CON vs. RSV + VPA: | 0.9999 | |||
| RSV vs. VPA: | 0.8135 | |||
| RSV vs. RSV + VPA: | 0.9999 | |||
| VPA vs. RSV + VPA: | 0.9834 | |||
| PV Ratio aCC (IV/V) | CON: 0.107 ± 0.0145 RSV: 0.0856 ± 0.01586 VPA: 0.0548 ± 0.0168 RSV + VPA: 0.0840 ± 0.019 | Interaction: F (1, 13) = 9.992 p = 0.0075 ** VPA: F (1, 13) = 11.16 p = 0.0053 ** RSV: F (1, 13) = 0.2128 p = 0.6522 | CON vs. RSV: | 0.4297 |
| CON vs. VPA: | 0.0024 | |||
| CON vs. RSV + VPA: | 0.3398 | |||
| RSV vs. VPA: | 0.1270 | |||
| RSV vs. RSV + VPA: | >0.9999 | |||
| VPA vs. RSV + VPA: | 0.1606 | |||
| PV Total Whole aCC | CON: 82.000 ± 11.25 RSV: 78.500 ± 16.60 VPA: 59.750 ± 23.60 RSV + VPA:74.500 ± 10.87 | Interaction: F (1, 13) = 1.354 p = 0.2655 VPA: F (1, 13) = 2.801 p = 0.1181 RSV: F (1, 13) = 0.5144 p = 0.4859 | CON vs. RSV: | 0.9999 |
| CON vs. VPA: | 0.3593 | |||
| CON vs. RSV + VPA: | 0.9999 | |||
| RSV vs. VPA: | 0.7401 | |||
| RSV vs. RSV + VPA: | 0.9999 | |||
| VPA vs. RSV + VPA: | 0.9999 | |||
| PV Ratio Whole aCC | CON: 0.094 ± 0.009 RSV: 0.084 ± 0.014 VPA: 0.053 ± 0.012 RSV + VPA 0.081 ± 0.011 | Interaction: F (1, 13) = 11.45 p = 0.0049 ** VPA: F (1, 13) = 14.87 p = 0.0020 ** RSV: F (1, 13) = 2.065 p = 0.1744 | CON vs. RSV: | 0.9999 |
| CON vs. VPA: | 0.0009 *** | |||
| CON vs. RSV + VPA: | 0.6141 | |||
| RSV vs. VPA: | 0.0177 * | |||
| RSV vs. RSV + VPA: | 0.9999 | |||
| VPA vs. RSV + VPA: | 0.0330 * | |||
| PV Total PrL (II/III) | CON: 28.400 ± 2.88 RSV:24.500 ± 7.04 VPA: 38.750 ± 3.77 RSV + VPA:26.250 ± 6.94 | Interaction: F (1, 13) = 4.159 p = 0.0483 * VPA: F (1, 13) = 7.359 p = 0.0178 * RSV: F (1, 13) = 7.675 p = 0.0159 * | CON vs. RSV: | 0.9999 |
| CON vs. VPA: | 0.0257 * | |||
| CON vs. RSV + VPA: | 0.9999 | |||
| RSV vs. VPA: | 0.0138 * | |||
| RSV vs. RSV + VPA: | 0.9999 | |||
| VPA vs. RSV + VPA: | 0.0335 * | |||
| PV Ratio PrL (II/III) | CON: 0.072 ± 0.004 RSV: 0.066 ± 0.009 VPA: 0.087 ± 0.003 RSV + VPA 0.070 ± 0.007 | Interaction: F (1, 13) = 2.679 p = 0.0930 # VPA: F (1, 13) = 7.172 p = 0.0190 * RSV: F (1, 13) = 15.25 p = 0.0018 ** | CON vs. RSV: | 0.7397 |
| CON vs. VPA: | 0.0474 * | |||
| CON vs. RSV + VPA: | 0.9999 | |||
| RSV vs. VPA: | 0.0033 ** | |||
| RSV vs. RSV + VPA: | 0.9999 | |||
| VPA vs. RSV + VPA: | 0.0128 * | |||
| PV Total PrL (IV/V) | CON: 49.200 ± 7.82 RSV: 56.000 ± 6.83 VPA: 50.750 ± 5.12 RSV + VPA: 48.750 ± 12.57 | Interaction: F (1, 13) = 1.129 p = 0.3072 VPA: F (1, 13) = 0.4738 p = 0.5033 RSV: F (1, 13) = 0.3360 p = 0.5720 | CON vs. RSV: | >0.9999 |
| CON vs. VPA: | >0.9999 | |||
| CON vs. RSV + VPA: | >0.9999 | |||
| RSV vs. VPA: | >0.9999 | |||
| RSV vs. RSV + VPA: | >0.9999 | |||
| VPA vs. RSV + VPA: | >0.9999 | |||
| PV Ratio PrL (IV/V) | CON: 0.096 ± 0.020 RSV:0.084 ± 0.009 VPA: 0.068 ± 0.010 RSV + VPA:0.082 ± 0.020 | Interaction: F (1, 13) = 2.460 p = 0.1408 VPA: F (1, 13) = 3.640 p = 0.0787 # RSV: F (1, 13) = 0.001322 p = 0.9715 | CON vs. RSV: | 0.9999 |
| CON vs. VPA: | 0.1520 | |||
| CON vs. RSV + VPA: | 0.9999 | |||
| RSV vs. VPA: | 0.9999 | |||
| RSV vs. RSV + VPA: | 0.9999 | |||
| VPA vs. RSV + VPA: | 0.9999 | |||
| PV Total Whole PrL | CON: 74.400 ± 8.82 RSV: 80.500 ± 13.52 VPA: 86.500 ± 9.000 RSV + VPA: 75.000 ± 17.92 | Interaction: F (1, 13) = 2.051 p = 0.1758 VPA: F (1, 13) = 0.2884 p = 0.6003 RSV: F (1, 13) = 0.1930 p = 0.6676 | CON vs. RSV: | >0.9999 |
| CON vs. VPA: | >0.9999 | |||
| CON vs. RSV + VPA: | >0.9999 | |||
| RSV vs. VPA: | >0.9999 | |||
| RSV vs. RSV + VPA: | >0.9999 | |||
| VPA vs. RSV + VPA: | >0.9999 | |||
| PV Ratio Whole PrL | CON: 0.088 ± 0.013 RSV:0.078 ± 0.006 VPA: 0.072 ± 0.001 RSV + VPA:0.077 ± 0.014 | Interaction: F (1, 13) = 2.101 p = 0.1709 VPA: F (1, 13) = 2.834 p = 0.1161 RSV: F (1, 13) = 0.3874 p = 0.5444 | CON vs. RSV: | 0.9372 |
| CON vs. VPA: | 0.2425 | |||
| CON vs. RSV + VPA: | 0.7067 | |||
| RSV vs. VPA: | 0.9999 | |||
| RSV vs. RSV + VPA: | 0.9999 | |||
| VPA vs. RSV + VPA: | 0.9999 | |||
| PV Total IL (II/III) | CON: 28.800 ± 5.90 RSV: 29.250 ± 10.25 VPA: 33.750 ± 5.12 RSV + VPA: 25.000 ± 4.69 | Interaction: F (1, 13) = 1.936 p = 0.1875 VPA: F (1, 13) = 0.01121 p = 0.9173 RSV: F (1, 13) = 1.576 p = 0.2315 | CON vs. RSV: | >0.9999 |
| CON vs. VPA: | >0.9999 | |||
| CON vs. RSV + VPA: | >0.9999 | |||
| RSV vs. VPA: | >0.9999 | |||
| RSV vs. RSV + VPA: | >0.9999 | |||
| VPA vs. RSV + VPA: | 0.5473 | |||
| PV Ratio IL (II/III) | CON: 0.082 ± 0.010 RSV: 0.070 ± 0.015 VPA: 0.070 ± 0.010 RSV + VPA: 0.075 ± 0.008 | Interaction: F (1, 13) = 2.644 p = 0.1279 VPA: F (1, 13) = 0.4062 p = 0.5350 RSV: F (1, 13) = 0.3412 p = 0.5691 | CON vs. RSV: | 0.7940 |
| CON vs. VPA: | 0.7443 | |||
| CON vs. RSV + VPA: | >0.9999 | |||
| RSV vs. VPA: | >0.9999 | |||
| RSV vs. RSV + VPA: | >0.9999 | |||
| VPA vs. RSV + VPA: | >0.9999 | |||
| PV Total IL (IV/V) | CON: 45.40 ± 9.50 RSV: 56.00 ± 28.25 VPA: 48.00 ± 12.355 RSV + VPA: 53.50 ± 11.80 | Interaction: F (1, 13) = 0.1646 p = 0.6915 VPA: F (1, 13) = 0.001360 p = 0.9711 RSV: F (1, 13) = 1.171 p = 0.2989 | CON vs. RSV: | >0.9999 |
| CON vs. VPA: | >0.9999 | |||
| CON vs. RSV + VPA: | >0.9999 | |||
| RSV vs. VPA: | >0.9999 | |||
| RSV vs. RSV + VPA: | >0.9999 | |||
| VPA vs. RSV + VPA: | >0.9999 | |||
| PV Ratio IL (IV/V) | CON:0.080 ± 0.020 RSV: 0.073 ± 0.031 VPA: 0.067 ± 0.016 RSV + VPA: 0.081 ± 0.020 | Interaction: F (1, 13) = 1.046 p = 0.3251 VPA: F (1, 13) = 0.04663 p = 0.8324 RSV: F (1, 13) = 0.1055 p = 0.7504 | CON vs. RSV: | >0.9999 |
| CON vs. VPA: | >0.9999 | |||
| CON vs. RSV + VPA: | >0.9999 | |||
| RSV vs. VPA: | >0.9999 | |||
| RSV vs. RSV + VPA: | >0.9999 | |||
| VPA vs. RSV + VPA: | >0.9999 | |||
| PV Total Whole IL | CON: 74.60 ± 8.50 RSV: 80.50 ± 13.52 VPA: 81.75 ± 15.25 RSV + VPA: 77.50 ± 15.25 | Interaction: F (1, 13) = 0.6249 p = 0.4434 VPA: F (1, 13) = 0.1045 p = 0.7517 RSV: F (1, 13) = 0.01651 p = 0.8997 | CON vs. RSV: | >0.9999 |
| CON vs. VPA: | >0.9999 | |||
| CON vs. RSV + VPA: | >0.9999 | |||
| RSV vs. VPA: | >0.9999 | |||
| RSV vs. RSV + VPA: | >0.9999 | |||
| VPA vs. RSV + VPA: | >0.9999 | |||
| PV Ratio Whole IL | CON: 0.082 ± 0.015 RSV: 0.072 ± 0.024 VPA: 0.068 ± 0.013 RSV + VPA: 0.079 ± 0.013 | Interaction: F (1, 13) = 1.533 p = 0.2376 VPA: F (1, 13) = 0.1634 p = 0.6926 RSV: F (1, 13) = 0.006546 p = 0.9367 | CON vs. RSV: | >0.9999 |
| CON vs. VPA: | >0.9999 | |||
| CON vs. RSV + VPA: | >0.9999 | |||
| RSV vs. VPA: | >0.9999 | |||
| RSV vs. RSV + VPA: | >0.9999 | |||
| VPA vs. RSV + VPA: | >0.9999 | |||
| Mean ± SD | F (DFn. DFd); p-Value | Pairwise Comparisons | ||
|---|---|---|---|---|
| CB Total aCC (II/III) | CON: 19.20 ± 6.87 RSV: 16.75 ± 2.50 VPA: 13.25 ± 6.70 RSV + VPA: 21.75 ± 3.59 | Interaction: F (1, 13) = 6.023 p = 0.0290 * VPA: F (1, 13) = 0.03959 p = 0.8454 RSV: F (1, 13) = 2.327 p = 0.1511 | CON vs. RSV: | 0.9999 |
| CON vs. VPA: | 0.7519 | |||
| CON vs. RSV + VPA: | 0.9999 | |||
| RSV vs. VPA: | 0.9999 | |||
| RSV vs. RSV + VPA: | 0.5430 | |||
| VPA vs. RSV + VPA: | 0.1006 | |||
| CB Ratio aCC (II/III) | CON: 0.057 ± 0.005 RSV: 0.050 ± 0.006 VPA: 0.034 ± 0.010 RSV + VPA: 0.064 ± 0.014 | Interaction: F (1, 13) = 18.31 p = 0.0009 *** VPA: F (1, 13) = 1.081 p = 0.3175 RSV: F (1, 13) = 6.006 p = 0.0292 | CON vs. RSV: | 0.9999 |
| CON vs. VPA: | 0.0117 * | |||
| CON vs. RSV + VPA: | 0.9999 | |||
| RSV vs. VPA: | 0.1905 | |||
| RSV vs. RSV + VPA: | 0.2626 | |||
| VPA vs. RSV + VPA: | 0.0028 ** | |||
| CB Total aCC (IV/V) | CON: 22.00 ± 7.25 RSV: 17.00 ± 4.45 VPA: 22.75 ± 10.00 RSV + VPA: 22.5 ± 9.95 | Interaction: F (1, 13) = 0.4352 p = 0.5210 VPA: F (1, 13) = 0.7193 p = 0.4117 RSV: F (1, 13) = 0.5220 p = 0.4828 | CON vs. RSV: | 0.9999 |
| CON vs. VPA: | 0.9999 | |||
| CON vs. RSV + VPA: | 0.9999 | |||
| RSV vs. VPA: | 0.9999 | |||
| RSV vs. RSV + VPA: | 0.9999 | |||
| VPA vs. RSV + VPA: | 0.9999 | |||
| CB Ratio aCC (IV/V) | CON: 0.059 ± 0.024 RSV: 0.037 ± 0.012 VPA: 0.039 ± 0.011 RSV + VPA: 0.042 ± 0.020 | Interaction: F (1, 13) = 2.304 p = 0.1530 VPA:F (1, 13) = 0.7381 p = 0.4058 RSV:F (1, 13) = 1.381 p = 0.2610 | CON vs. RSV: | 0.4334 |
| CON vs. VPA: | 0.6472 | |||
| CON vs. RSV + VPA: | 0.9794 | |||
| RSV vs. VPA: | 0.9999 | |||
| RSV vs. RSV + VPA: | 0.9999 | |||
| VPA vs. RSV + VPA: | 0.9999 | |||
| CB Total Whole aCC | CON: 37.2 ± 13.92 RSV: 28.25 ± 8.15 VPA: 38.75 ± 19.77 RSV + VPA: 39.25 ± 17.40 | Interaction: F (1, 13) = 0.4000 p = 0.5381 VPA: F (1, 13) = 0.7055 p = 0.4161 RSV: (1, 13) = 0.3198 p = 0.5813 | CON vs. RSV: | 0.9999 |
| CON vs. VPA: | 0.9999 | |||
| CON vs. RSV + VPA: | 0.9999 | |||
| RSV vs. VPA: | 0.9999 | |||
| RSV vs. RSV + VPA: | 0.9999 | |||
| VPA vs. RSV + VPA: | 0.9999 | |||
| CB Ratio Whole aCC | CON: 0.058 ± 0.014 RSV: 0.042 ± 0.009 VPA: 0.038 ± 0.010 RSV + VPA 0.051 ± 0.017 | Interaction: F (1, 13) = 5.701 p = 0.0328 * VPA: F (1, 13) = 0.9515 p = 0.3471 RSV: F (1, 13) = 0.03555 p = 0.8534 | CON vs. RSV: | 0.5037 |
| CON vs. VPA: | 0.1775 | |||
| CON vs. RSV + VPA: | 0.9999 | |||
| RSV vs. VPA: | 0.9999 | |||
| RSV vs. RSV + VPA: | 0.9999 | |||
| VPA vs. RSV + VPA: | 0.9213 | |||
| CB Total PrL (II/III) | CON: 26.20 ± 7.35 RSV: 18.25 ± 1.70 VPA: 16.00 ± 9.75 RSV + VPA:19.25 ± 5.45 | Interaction: F (1, 13) = 2.859 p = 0.1147 VPA: F (1, 13) = 1.929 p = 0.1882 RSV: F (1, 13) = 0.5036 p = 0.4905 | CON vs. RSV: | 0.6284 |
| CON vs. VPA: | 0.2603 | |||
| CON vs. RSV + VPA: | 0.9078 | |||
| RSV vs. VPA: | 0.9999 | |||
| RSV vs. RSV + VPA: | 0.9999 | |||
| VPA vs. RSV + VPA: | 0.9999 | |||
| CB Ratio PrL (II/III) | CON: 0.079 ± 0.025 RSV: 0.059 ± 0.009 VPA: 0.034 ± 0.015 RSV + VPA: 0.057 ± 0.016 | Interaction: F (1, 13) = 6.149 p = 0.0276 VPA: F (1, 13) = 7.593 p = 0.0164 RSV: F (1, 13) = 0.01238 p = 0.9131 | CON vs. RSV: | 0.6541 |
| CON vs. VPA: | 0.0132 | |||
| CON vs. RSV + VPA: | 0.4615 | |||
| RSV vs. VPA: | 0.4187 | |||
| RSV vs. RSV + VPA: | 0.9999 | |||
| VPA vs. RSV + VPA: | 0.5849 | |||
| CB Total PrL (IV/V) | CON: 23.20 ± 4.35 RSV: 19.00 ± 4.95 VPA: 26.75 ± 14.05 RSV + VPA: 33.2 ± 7.65 | Interaction: F (1, 13) = 1,748 p = 0.2089 VPA: F (1, 13) = 4.837 p = 0.0709 # RSV: F (1, 13) = 0.04947 p = 0.8275 | CON vs. RSV: | 0.9999 |
| CON vs. VPA: | 0.9999 | |||
| CON vs. RSV + VPA: | 0.6120 | |||
| RSV vs. VPA: | 0.9999 | |||
| RSV vs. RSV + VPA: | 0.1830 | |||
| VPA vs. RSV + VPA: | 0.9999 | |||
| CB Ratio PrL (IV/V) | CON: 0.054 ± 0.018 RSV: 0.034 ± 0.009 VPA: 0.041 ± 0.017 RSV + VPA: 0.050 ± 0.014 | Interaction: F (1, 13) = 3.755 p = 0.0747 VPA F (1, 13) = 0.04387 p = 0.8373 RSV: F (1, 13) = 0.6898 p = 0.4212 | CON vs. RSV: | 0.3931 |
| CON vs. VPA: | 0.9999 | |||
| CON vs. RSV + VPA: | 0.9999 | |||
| RSV vs. VPA: | 0.9999 | |||
| RSV vs. RSV + VPA: | 0.9763 | |||
| VPA vs. RSV + VPA: | 0.9999 | |||
| CB Total Whole PrL | CON: 51.00 ± 7.87 RSV: 36.25 ± 6.95 VPA: 42.75 ± 19.25 RSV + VPA:52.25 ± 7.90 | interaction: F (1, 12) = 3.243 p = 0.0969 VPA: F (1, 12) = 0.3312 p = 0.5756 RSV: F (1, 12) = 0.1520 p = 0.7035 | CON vs. RSV: | 0.8841 |
| CON vs. VPA: | 0.9999 | |||
| CON vs. RSV + VPA: | 0.9999 | |||
| RSV vs. VPA: | 0.9999 | |||
| RSV vs. RSV + VPA: | 0.7124 | |||
| VPA vs. RSV + VPA: | 0.9999 | |||
| CB Ratio Whole PrL | CON: 0.062 ± 0.016 RSV: 0.043 ± 0.08 VPA: 0.038 ± 0.016 RSV + VPA: 0.052 ± 0.014 | Interaction: F (1, 13) = 5.736 p = 0.0324 * VPA: F (1, 13) = 0.4439 p = 0.5169 RSV: F (1, 13) = 0.2759 p = 0.6082 | CON vs. RSV: | 0.3221 |
| CON vs. VPA: | 0.2670 | |||
| CON vs. RSV + VPA: | 0.9999 | |||
| RSV vs. VPA: | 0.9999 | |||
| RSV vs. RSV + VPA: | 0.9999 | |||
| VPA vs. RSV + VPA: | 0.9999 | |||
| CB Total IL (II/III) | CON: 18.75 ± 5.50 RSV: 14.25 ± 4.70 VPA: 14.25 ± 7.00 RSV + VPA: 26.00 ± 11.5 | Interaction: F (1, 11) = 3.947 p = 0.0662 # VPA: F (1, 11) = 7.953 p = 0.4461 RSV: F (1, 11) = 12.79 p = 0.4471 | CON vs. RSV: | 0.9999 |
| CON vs. VPA: | 0.9999 | |||
| CON vs. RSV + VPA: | 0.9999 | |||
| RSV vs. VPA: | 0.9999 | |||
| RSV vs. RSV + VPA: | 0.4421 | |||
| VPA vs. RSV + VPA: | 0.4421 | |||
| CB Ratio IL (II/III) | CON: 0.069 ± 0.018 RSV: 0.043 ± 0.013 VPA: 0.031 ± 0.007 RSV + VPA: 0.060 ± 0.023 | Interaction: F (1, 13) = 13.42 p = 0.0029 ** VPA: F (1, 13) = 1.476 p = 0.2460 RSV: F (1, 13) = 0.01159 p = 0.9159 | CON vs. RSV: | 0.1364 |
| CON vs. VPA: | 0.0216 * | |||
| CON vs. RSV + VPA: | 0.9999 | |||
| RSV vs. VPA: | 0.9999 | |||
| RSV vs. RSV + VPA: | 0.6924 | |||
| VPA vs. RSV + VPA: | 0.1324 | |||
| CB Total IL (IV/V) | CON: 29.00 ± 10.90 RSV: 19.00 ± 6.13 VPA: 26.25.00 ± 6.18 RSV + VPA: 30.00 ± 8.25 | Interaction: F (1, 13) = 3.990 p = 0.0672 # VPA: F (1, 13) = 1,271 p = 0.2800 RSV: F (1, 13) = 0.5051 p = 0.4898 | CON vs. RSV: | 0.4251 |
| CON vs. VPA: | 0.9999 | |||
| CON vs. RSV + VPA: | 0.9999 | |||
| RSV vs. VPA: | 0.9999 | |||
| RSV vs. RSV + VPA: | 0.3037 | |||
| VPA vs. RSV + VPA: | 0.9999 | |||
| CB Ratio IL (IV/V) | CON: 0.045 ± 0.010 RSV: 0.035 ± 0.013 VPA: 0.040 ± 0.010 RSV + VPA: 0.048 ± 0.014 | Interaction: F (1, 12) = 2.805 p = 0.1198 VPA: F (1, 12) = 0.3000 p = 0.5939 RSV: F (1, 12) = 0.07687 p = 0.7863 | CON vs. RSV: | 0.9999 |
| CON vs. VPA: | 0.9999 | |||
| CON vs. RSV + VPA: | 0.9999 | |||
| RSV vs. VPA: | 0.9999 | |||
| RSV vs. RSV + VPA: | 0.8522 | |||
| VPA vs. RSV + VPA: | 0.9999 | |||
| CB Total Whole IL | CON: 44.25 ± 9.45 RSV: 33.00 ± 9.70 VPA: 40.25 ± 12.00 RSV + VPA: 55.00 ± 18.65 | Interaction: F (1, 13) = 5.378 p = 0.0597 # VPA: F (1, 13) = 0.7738 p = 0.3950 RSV: F (1, 13) = 0.01655 p = 0.8996 | CON vs. RSV: | 0.5925 |
| CON vs. VPA: | 0.9999 | |||
| CON vs. RSV + VPA: | 0.9999 | |||
| RSV vs. VPA: | 0.9999 | |||
| RSV vs. RSV + VPA: | 0.2766 | |||
| VPA vs. RSV + VPA: | 0.9303 | |||
| CB Ratio Whole IL | CON: 0.64 ± 0.027 RSV: 0.39 ± 0.011 VPA: 0.36 ± 0.008 RSV + VPA: 0.53 ± 0.018 | Interaction: F (1, 13) = 5.736 p = 0.0324 * VPA: F (1, 13) = 0.4439 p = 0.5169 RSV: F (1, 13) = 0.2759 p = 0.6082 | CON vs. RSV: | 0.3221 |
| CON vs. VPA: | 0.2670 | |||
| CON vs. RSV + VPA: | 0.9999 | |||
| RSV vs. VPA: | 0.9999 | |||
| RSV vs. RSV + VPA: | 0.9999 | |||
| VPA vs. RSV + VPA: | 0.9999 | |||
| Mean ± SD | F (DFn. DFd); p-Value | Pairwise Comparisons | ||
|---|---|---|---|---|
| SOM Total aCC (II/III) | CON: 18.5 ± 2.65 RSV: 17.5 ± 0.5 VPA: 12 ± 2.50 RSV + VPA: 18.75 ± 2.00 | Interaction: F (1, 12) = 13.66 p = 0.0031 ** VPA: F (1, 12) = 6.270 p = 0.0277 * RSV: F (1, 12) = 7.521 p = 0.0178 * | CON vs. RSV: | >0.9999 |
| CON vs. VPA: | 0.0053 ** | |||
| CON vs. RSV + VPA: | >0.9999 | |||
| RSV vs. VPA: | 0.0179 * | |||
| RSV vs. RSV + VPA: | >0.9999 | |||
| VPA vs. RSV + VPA: | 0.0040 ** | |||
| SOM Ratio aCC (II/III) | CON: 0.060 ± 0.009 RSV: 0.059 ± 0.008 VPA: 0.034 ± 0.007 RSV + VPA: 0.068 ± 0.002 | Interaction: F (1, 12) = 25.14 p = 0.0003 *** VPA: F (1, 12) = 6.460 p = 0.0259 * RSV: F (1, 12) = 22.93 p = 0.0004 *** | CON vs. RSV: | >0.9999 |
| CON vs. VPA: | 0.0011 ** | |||
| CON vs. RSV + VPA: | 0.8282 | |||
| RSV vs. VPA: | 0.0014 ** | |||
| RSV vs. RSV + VPA: | 0.6359 | |||
| VPA vs. RSV + VPA: | <0.0001 **** | |||
| SOM Total aCC (IV/V) | CON: 33.25 ± 5.56 RSV: 30.50 ± 3.70 VPA: 21.00 ± 1.15 RSV + VPA: 31.25 ± 2.63 | Interaction: F (1, 12) = 12.64 p = 0.0040 ** VPA: F (1, 12) = 9.888 p = 0.0085 ** RSV: F (1, 12) = 4.206 p = 0.0628 * | CON vs. RSV: | >0.9999 |
| CON vs. VPA: | 0.0029 ** | |||
| CON vs. RSV + VPA: | >0.9999 | |||
| RSV vs. VPA: | 0.0191 * | |||
| RSV vs. RSV + VPA: | >0.9999 | |||
| VPA vs. RSV + VPA: | 0.0113 * | |||
| SOM Ratio aCC (IV/V) | CON: 0.060 ± 0.010 RSV: 0.060 ± 0.008 VPA: 0.036 ± 0.007 RSV + VPA: 0.062 ± 0.005 | Interaction: F (1, 12) = 15.49 p = 0.0020 ** VPA: F (1, 12) = 11.03 p = 0.0061 ** RSV: F (1, 12) = 13.84 p = 0.0029 ** | CON vs. RSV: | 0.9999 |
| CON vs. VPA: | 0.0015 ** | |||
| CON vs. RSV + VPA: | 0.9999 | |||
| RSV vs. VPA: | 0.0019 ** | |||
| RSV vs. RSV + VPA: | 0.9999 | |||
| VPA vs. RSV + VPA: | 0.0009 *** | |||
| SOM Total Whole aCC | CON: 51.75 ± 4.20 RSV: 48.00 ± 4.00 VPA: 33.00 ± 1.15 RSV + VPA: 50.00 ± 4.32 | Interaction: F (1, 12) = 31.75 p = 0.0001 *** VPA: F (1, 12) = 20.69 p = 0.0007 *** RSV: F (1, 12) = 12.94 p = 0.0037 ** | CON vs. RSV: | >0.9999 |
| CON vs. VPA: | <0.0001 **** | |||
| CON vs. RSV + VPA: | >0.9999 | |||
| RSV vs. VPA: | 0.0005 *** | |||
| RSV vs. RSV + VPA: | >0.9999 | |||
| VPA vs. RSV + VPA: | 0.0002 *** | |||
| SOM Ratio Whole aCC | CON: 0.058 ± 0.006 RSV: 0.056 ± 0.007 VPA: 0.033 ± 0.005 RSV + VPA: 0.061 ± 0.005 | Interaction: F (1, 12) = 23.64 p = 0.0004 *** VPA: F (1, 12) = 14.87 p = 0.0023 ** RSV: F (1, 12) = 21.35 p = 0.0006 *** | CON vs. RSV: | >0.9999 |
| CON vs. VPA: | 0.0003 *** | |||
| CON vs. RSV + VPA: | >0.9999 | |||
| RSV vs. VPA: | 0.0004 *** | |||
| RSV vs. RSV + VPA: | >0.9999 | |||
| VPA vs. RSV + VPA: | 0.0001 *** | |||
| SOM Total PrL (II/III) | CON: 19.75 ± 8.25 RSV: 18.25 ± 1.55 VPA: 12.50 ± 0.70 RSV + VPA: 17.25 ± 1.90 | Interaction: F (1, 12) = 2.825 p = 0.1186 VPA: F (1, 12) = 2.825 p = 0.1186 RSV: F (1, 12) = 0.2721 p = 0.6114 | CON vs. RSV: | >0.9999 |
| CON vs. VPA: | 0.2097 | |||
| CON vs. RSV + VPA: | >0.9999 | |||
| RSV vs. VPA: | 0.8721 | |||
| RSV vs. RSV + VPA: | >0.9999 | |||
| VPA vs. RSV + VPA: | 0.8721 | |||
| SOM Ratio PrL (II/III) | CON: 0.053 ± 0.016 RSV: 0.047 ± 0.003 VPA: 0.032 ± 0.004 RSV + VPA: 0.049 ± 0.007 | Interaction: F (1, 12) = 8.612 p = 0.0125 * VPA: F (1, 12) = 2.893 p = 0.1147 RSV: F (1, 12) = 3.103 p = 0.1036 | CON vs. RSV: | >0.9999 |
| CON vs. VPA: | 0.0396 * | |||
| CON vs. RSV + VPA: | >0.9999 | |||
| RSV vs. VPA: | 0.1841 | |||
| RSV vs. RSV + VPA: | >0.9999 | |||
| VPA vs. RSV + VPA: | 0.0366 * | |||
| SOM Total PrL (IV/V) | CON: 37.00 ± 5.90 RSV: 34.25 ± 5.75 VPA: 21.25 ± 3.86 RSV + VPA: 29.25 ± 2.63 | Interaction: F (1, 12) = 5.170 p = 0.0422 ** VPA: F (1, 12) = 19.26 p = 0.0009 *** RSV: F (1, 12) = 1.233 p = 0.2886 | CON vs. RSV: | >0.9999 |
| CON vs. VPA: | 0.0030 ** | |||
| CON vs. RSV + VPA: | 0.2334 | |||
| RSV vs. VPA: | 0.0129 * | |||
| RSV vs. RSV + VPA: | 0.9636 | |||
| VPA vs. RSV + VPA: | 0.2037 | |||
| SOM Ratio PrL (IV/V) | CON: 0.064 ± 0.008 RSV: 0.056 ± 0.008 VPA: 0.032 ± 0.007 RSV + VPA: 0.055 ± 0.005 | Interaction: F (1, 12) = 18.82 p = 0.0010 VPA: F (1, 12) = 22.16 p = 0.0005 *** RSV: F (1, 12) = 4.211 p = 0.0626 # | CON vs. RSV: | 0.7919 |
| CON vs. VPA: | 0.0002 *** | |||
| CON vs. RSV + VPA: | 0.5095 | |||
| RSV vs. VPA: | 0.0027** | |||
| RSV vs. RSV + VPA: | >0.9999 | |||
| VPA vs. RSV + VPA: | 0.0042 ** | |||
| SOM Total Whole PrL | CON: 56.75 ± 12.55 RSV: 51.50 ± 7.25 VPA: 33.75 ± 3.40 RSV + VPA: 46.50 ± 2.00 | Interaction: F (1, 12) = 5.739 p = 0.0338 * VPA: F (1, 12) = 13.89 p = 0.0029 ** RSV: F (1, 12) = 0.9963 p = 0.3379 | CON vs. RSV: | >0.9999 |
| CON vs. VPA: | 0.0059 ** | |||
| CON vs. RSV + VPA: | 0.4661 | |||
| RSV vs. VPA: | 0.0353 * | |||
| RSV vs. RSV + VPA: | >0.9999 | |||
| VPA vs. RSV + VPA: | 0.2012 | |||
| SOM Ratio Whole PrL | CON: 0.060 ± 0.011 RSV: 0.053 ± 0.006 VPA: 0.031 ± 0.004 RSV + VPA: 0.054 ± 0.005 | Interaction: F (1, 12) = 18.37 p = 0.0011 ** VPA: F (1, 12) = 15.21 p = 0.0021 ** RSV: F (1, 12) = 4.905 p = 0.0469 * | CON vs. RSV: | >0.9999 |
| CON vs. VPA: | 0.0005 *** | |||
| CON vs. RSV + VPA: | >0.9999 | |||
| RSV vs. VPA: | 0.0059 ** | |||
| RSV vs. RSV + VPA: | >0.9999 | |||
| VPA vs. RSV + VPA: | 0.0037 ** | |||
| SOM Total IL (II/III) | CON: 15.50 ± 1.75 RSV: 17.00 ± 2.45 VPA: 11.50 ± 2.50 RSV + VPA: 15.25 ± 1.50 | Interaction: F (1, 12) = 1,152 p = 0.3043 VPA: F (1, 12) = 7.521 p = 0.0178 * RSV: F (1, 12) = 6.270 p = 0.0277 * | CON vs. RSV: | >0.9999 |
| CON vs. VPA: | 0.1163 | |||
| CON vs. RSV + VPA: | >0.9999 | |||
| RSV vs. VPA: | 0.0179 * | |||
| RSV vs. RSV + VPA: | >0.9999 | |||
| VPA vs. RSV + VPA: | 0.1587 | |||
| SOM Ratio IL (II/III) | CON: 0.045 ± 0.007 RSV: 0.048 ± 0.008 VPA: 0.032 ± 0.006 RSV + VPA: 0.048 ± 0.004 | Interaction: F (1, 12) = 4.503 p = 0.0553 # VPA: F (1, 12) = 3.938 p = 0.0706 # RSV: F (1, 12) = 9.410 p = 0.0098 ** | CON vs. RSV: | >0.9999 |
| CON vs. VPA: | 0.0794 # | |||
| CON vs. RSV + VPA: | >0.9999 | |||
| RSV vs. VPA: | 0.0230 * | |||
| RSV vs. RSV + VPA: | >0.9999 | |||
| VPA vs. RSV + VPA: | 0.0193 * | |||
| SOM Total IL (IV/V) | CON: 34.50 ± 7.15 RSV: 33.75 ± 1.00 VPA: 21.75 ± 3.00 RSV + VPA: 33.00 ± 1.45 | Interaction: F (1, 12) = 9.167 p = 0.0105 * VPA: F (1, 12) = 11,60 p = 0.0052 ** RSV: F (1, 12) = 7.019 p = 0.0212 * | CON vs. RSV: | >0.9999 |
| CON vs. VPA: | 0.0040 ** | |||
| CON vs. RSV + VPA: | >0.9999 | |||
| RSV vs. VPA: | 0.0064 ** | |||
| RSV vs. RSV + VPA: | >0.9999 | |||
| VPA vs. RSV + VPA: | 0.0103* | |||
| SOM Ratio IL (IV/V) | CON: 0.058 ± 0.011 RSV: 0.052 ± 0.002 VPA: 0.032 ± 0.003 RSV + VPA: 0.059 ± 0.005 | Interaction: F (1, 12) = 29.00 p = 0.0002 *** VPA: F (1, 12) = 9.617 p = 0.0092 ** RSV: F (1, 12) = 12.21 p = 0.0044 ** | CON vs. RSV: | >0.9999 |
| CON vs. VPA: | 0.0004 *** | |||
| CON vs. RSV + VPA: | >0.9999 | |||
| RSV vs. VPA: | 0.0033 ** | |||
| RSV vs. RSV + VPA: | 0.7939 | |||
| VPA vs. RSV + VPA: | 0.0002 *** | |||
| SOM Total Whole IL | CON: 50.00 ± 8.70 RSV: 50.75 ± 3.30 VPA: 33.25 ± 4.71 RSV + VPA: 48.25 ± 2.63 | Interaction: F (1, 12) = 6.840 p = 0.0226 * VPA: F (1, 12) = 12.48 p = 0.0041 ** RSV: F (1, 12) = 8.356 p = 0.0136 * | CON vs. RSV: | >0.9999 |
| CON vs. VPA: | 0.0057 ** | |||
| CON vs. RSV + VPA: | >0.9999 | |||
| RSV vs. VPA: | 0.0041 ** | |||
| RSV vs. RSV + VPA: | >0.9999 | |||
| VPA vs. RSV + VPA: | 0.0128 * | |||
| SOM Ratio Whole IL | CON: 0.053 ± 0.008 RSV: 0.051 ± 0.003 VPA: 0.032 ± 0.003 RSV + VPA: 0.055 ± 0.001 | Interaction: F (1, 12) = 31.96 p = 0.0001 *** VPA: F (1, 12) = 12.93 p = 0.0037 ** RSV: F (1, 12) = 21.75 p = 0.0005 *** | CON vs. RSV: | >0.9999 |
| CON vs. VPA: | 0.0002 *** | |||
| CON vs. RSV + VPA: | >0.9999 | |||
| RSV vs. VPA: | 0.0005 *** | |||
| RSV vs. RSV + VPA: | >0.9999 | |||
| VPA vs. RSV + VPA: | <0.0001 **** | |||
Publisher’s Note: MDPI stays neutral with regard to jurisdictional claims in published maps and institutional affiliations. |
© 2022 by the authors. Licensee MDPI, Basel, Switzerland. This article is an open access article distributed under the terms and conditions of the Creative Commons Attribution (CC BY) license (https://creativecommons.org/licenses/by/4.0/).
Share and Cite
Santos-Terra, J.; Deckmann, I.; Carello-Collar, G.; Nunes, G.D.-F.; Bauer-Negrini, G.; Schwingel, G.B.; Fontes-Dutra, M.; Riesgo, R.; Gottfried, C. Resveratrol Prevents Cytoarchitectural and Interneuronal Alterations in the Valproic Acid Rat Model of Autism. Int. J. Mol. Sci. 2022, 23, 4075. https://doi.org/10.3390/ijms23084075
Santos-Terra J, Deckmann I, Carello-Collar G, Nunes GD-F, Bauer-Negrini G, Schwingel GB, Fontes-Dutra M, Riesgo R, Gottfried C. Resveratrol Prevents Cytoarchitectural and Interneuronal Alterations in the Valproic Acid Rat Model of Autism. International Journal of Molecular Sciences. 2022; 23(8):4075. https://doi.org/10.3390/ijms23084075
Chicago/Turabian StyleSantos-Terra, Júlio, Iohanna Deckmann, Giovanna Carello-Collar, Gustavo Della-Flora Nunes, Guilherme Bauer-Negrini, Gustavo Brum Schwingel, Mellanie Fontes-Dutra, Rudimar Riesgo, and Carmem Gottfried. 2022. "Resveratrol Prevents Cytoarchitectural and Interneuronal Alterations in the Valproic Acid Rat Model of Autism" International Journal of Molecular Sciences 23, no. 8: 4075. https://doi.org/10.3390/ijms23084075