
Effects of Ultra-Short Pulsed Electric Field Exposure on Glioblastoma Cells

 , , ,
, , ,  , , and
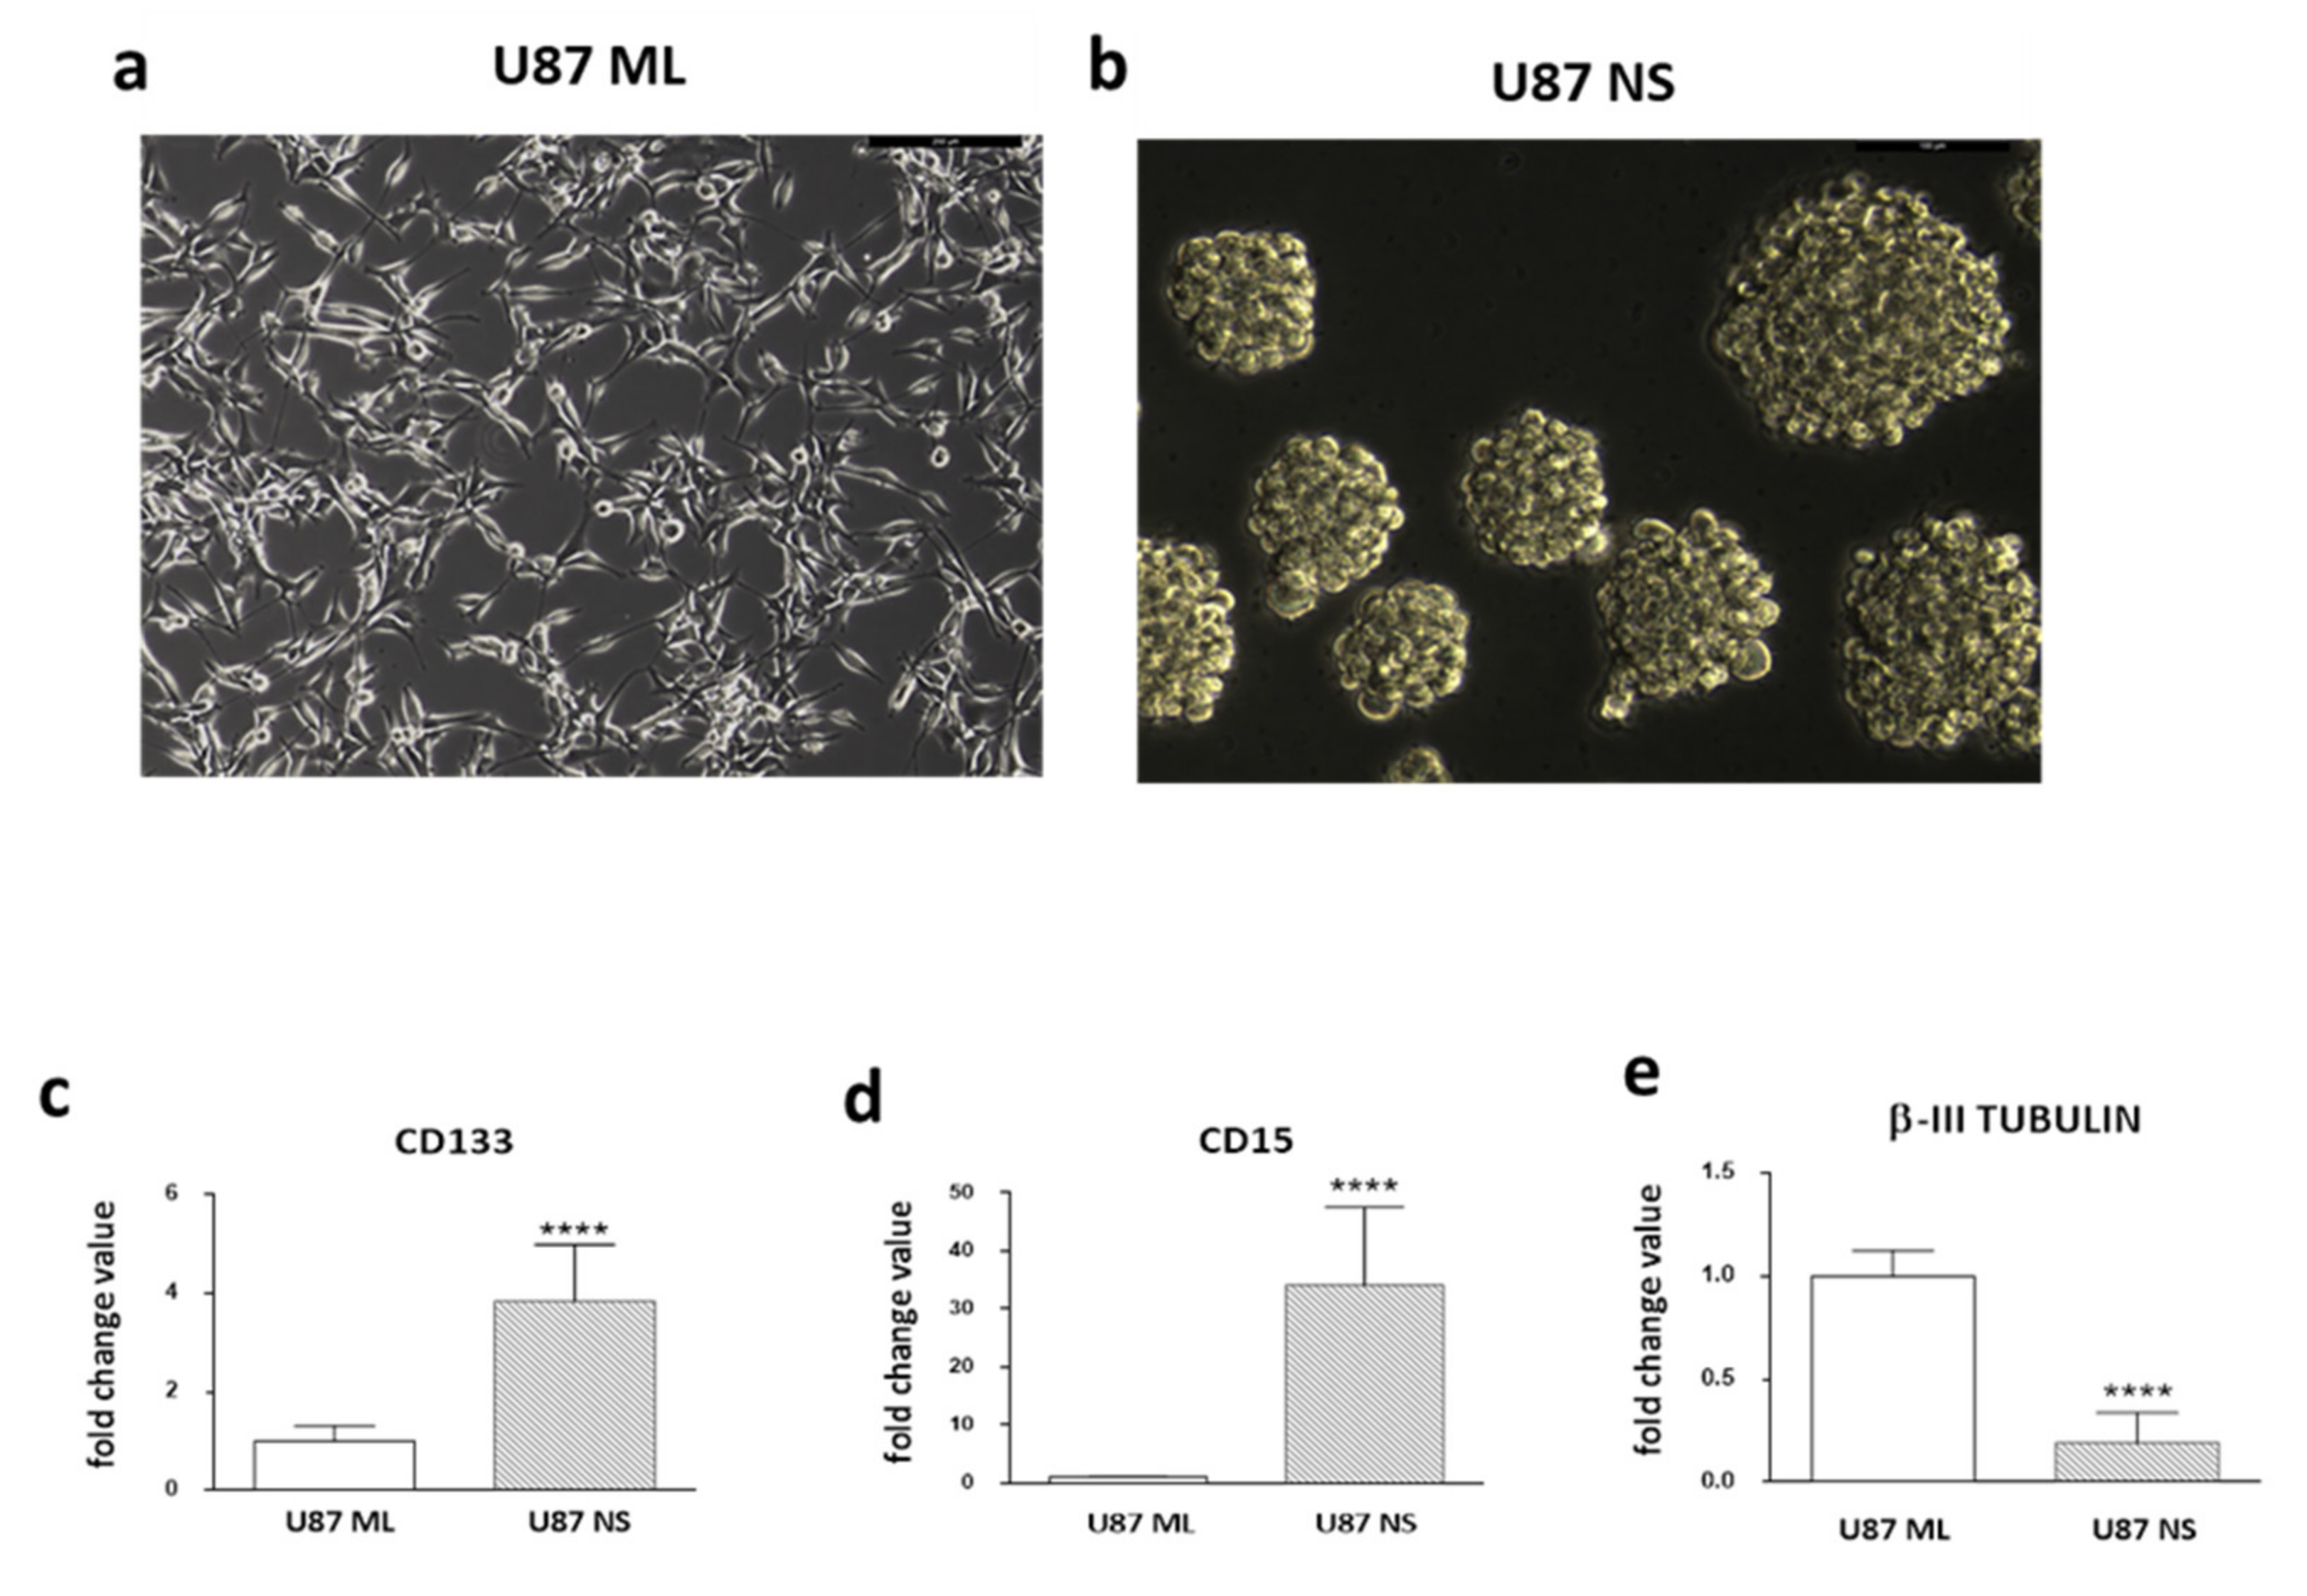
Abstract
:1. Introduction
2. Results
2.1. Expression Pattern of Stemness/Differentiation Genes in U87 ML and U87 NS Cells
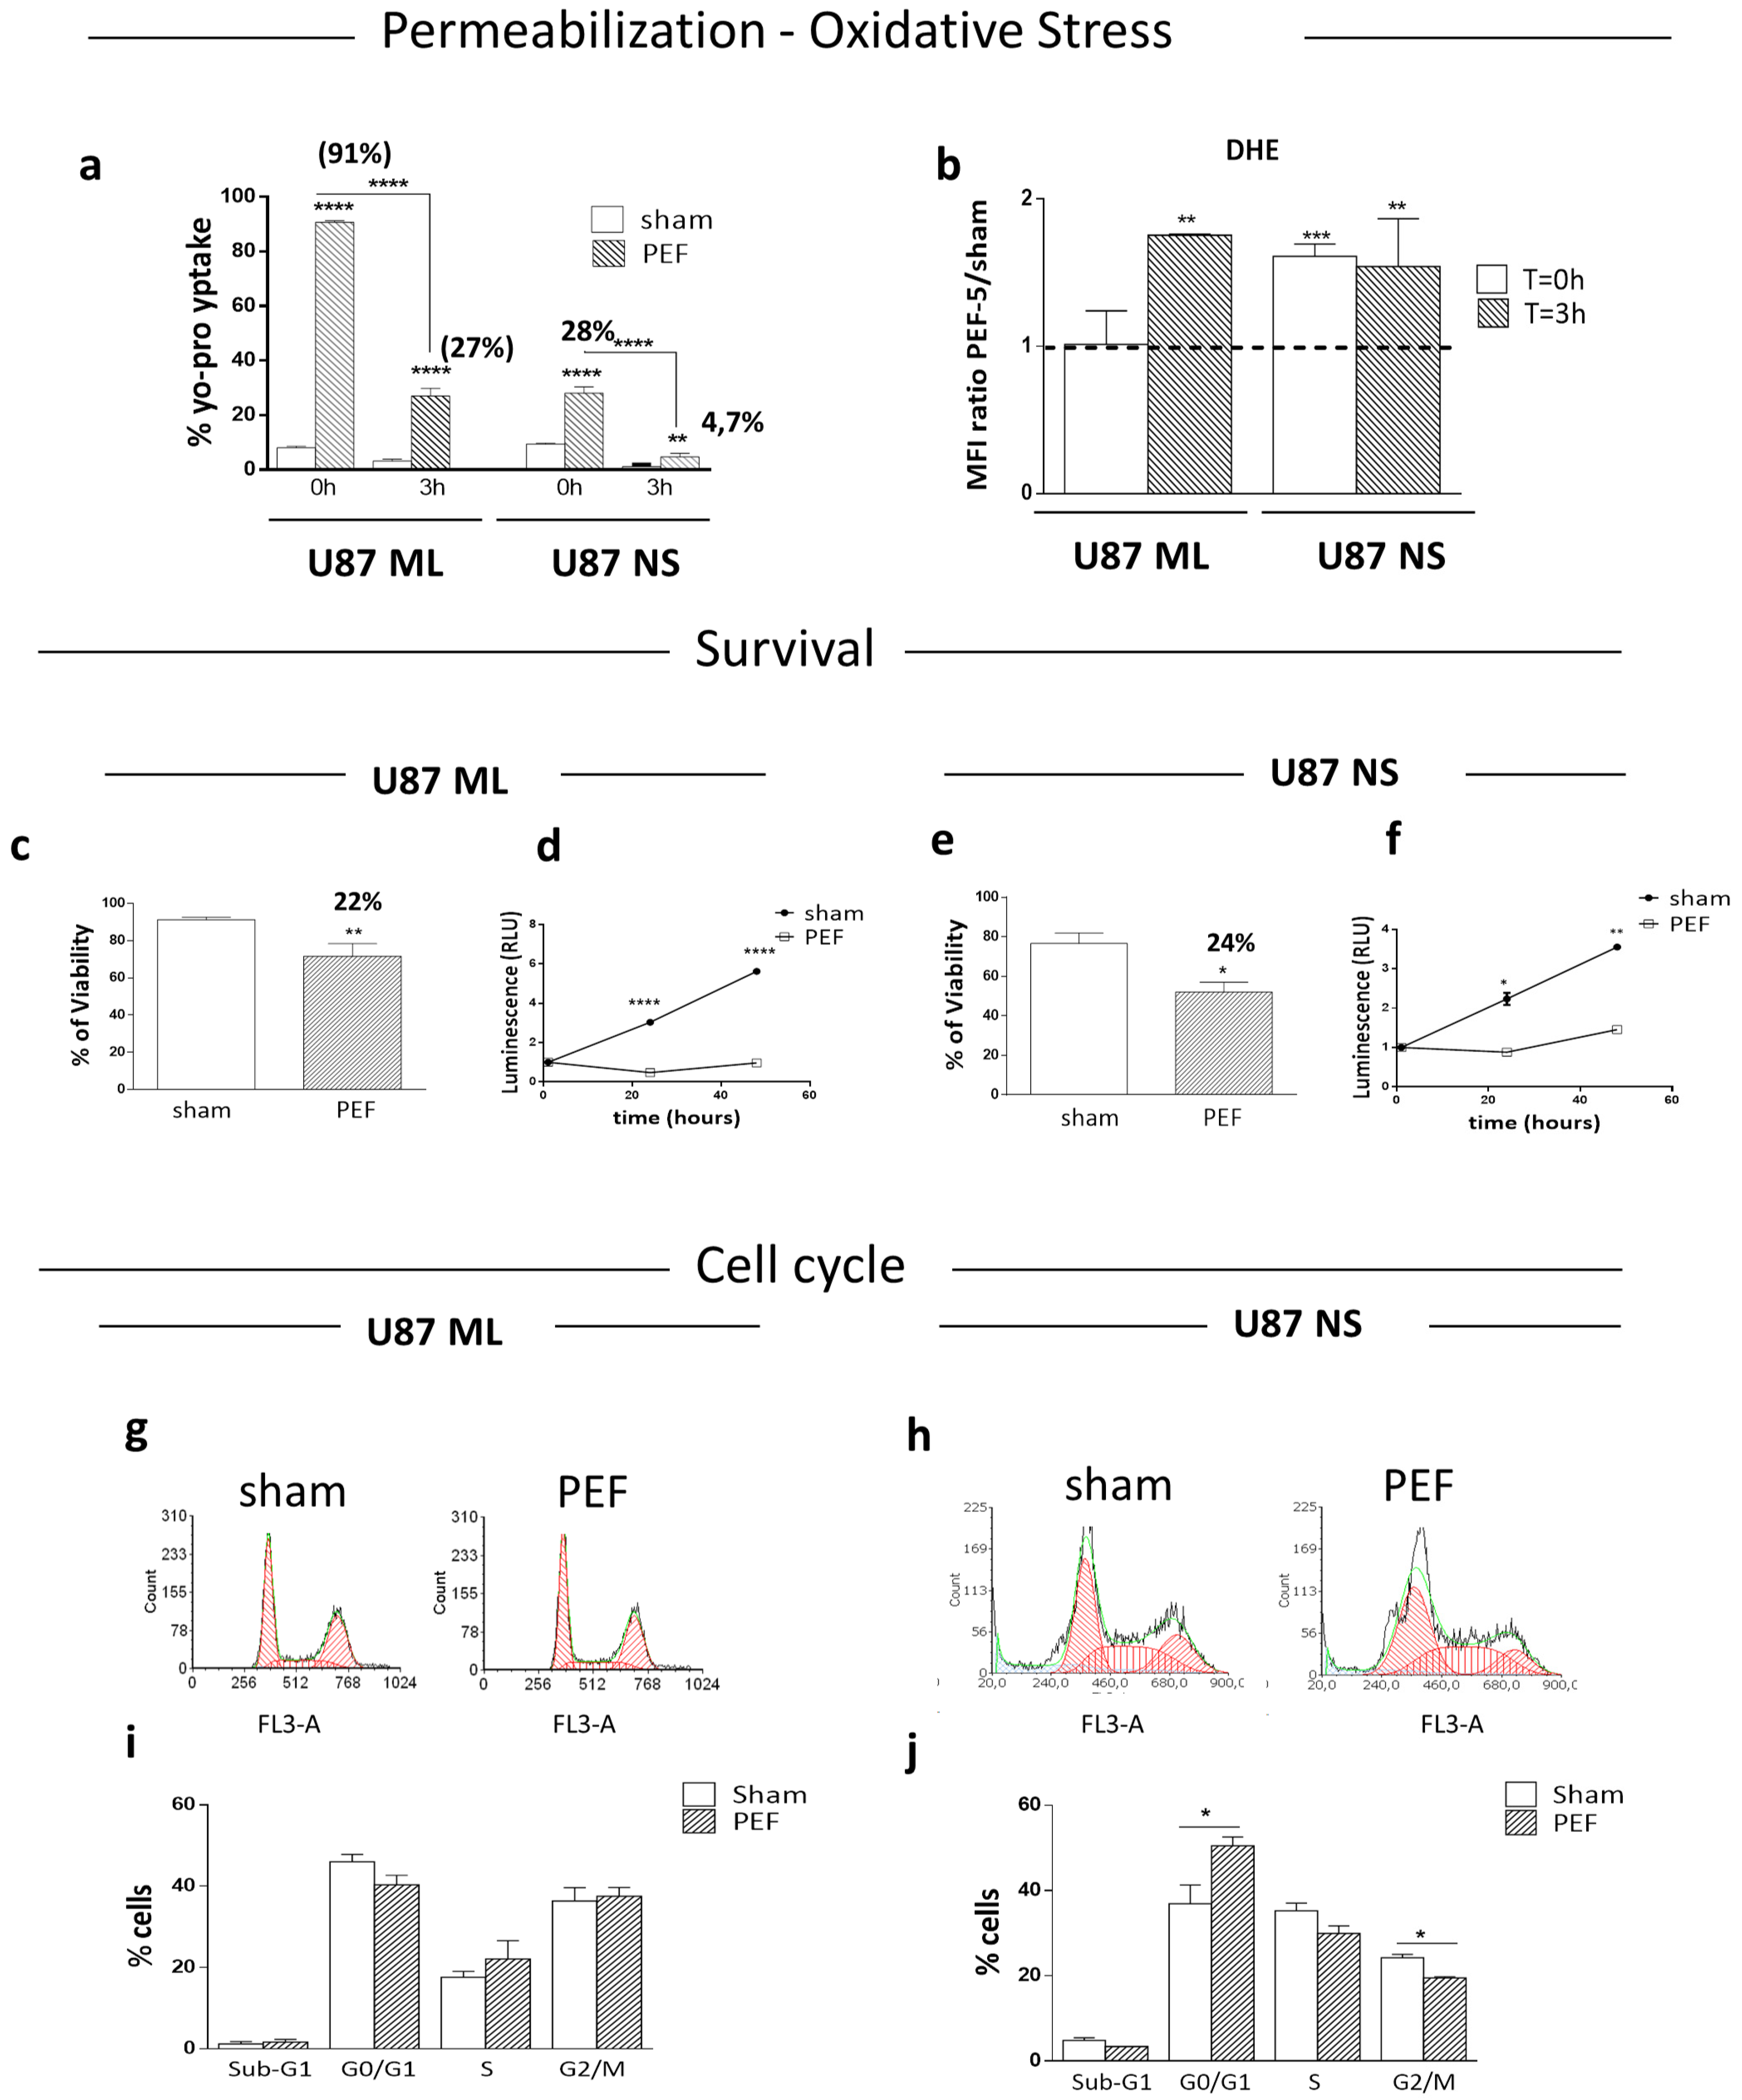
2.2. Membrane Permeabilization and ROS Production after PEF-5 Exposure
2.3. Survival, Proliferation and Cell Cycle Perturbation
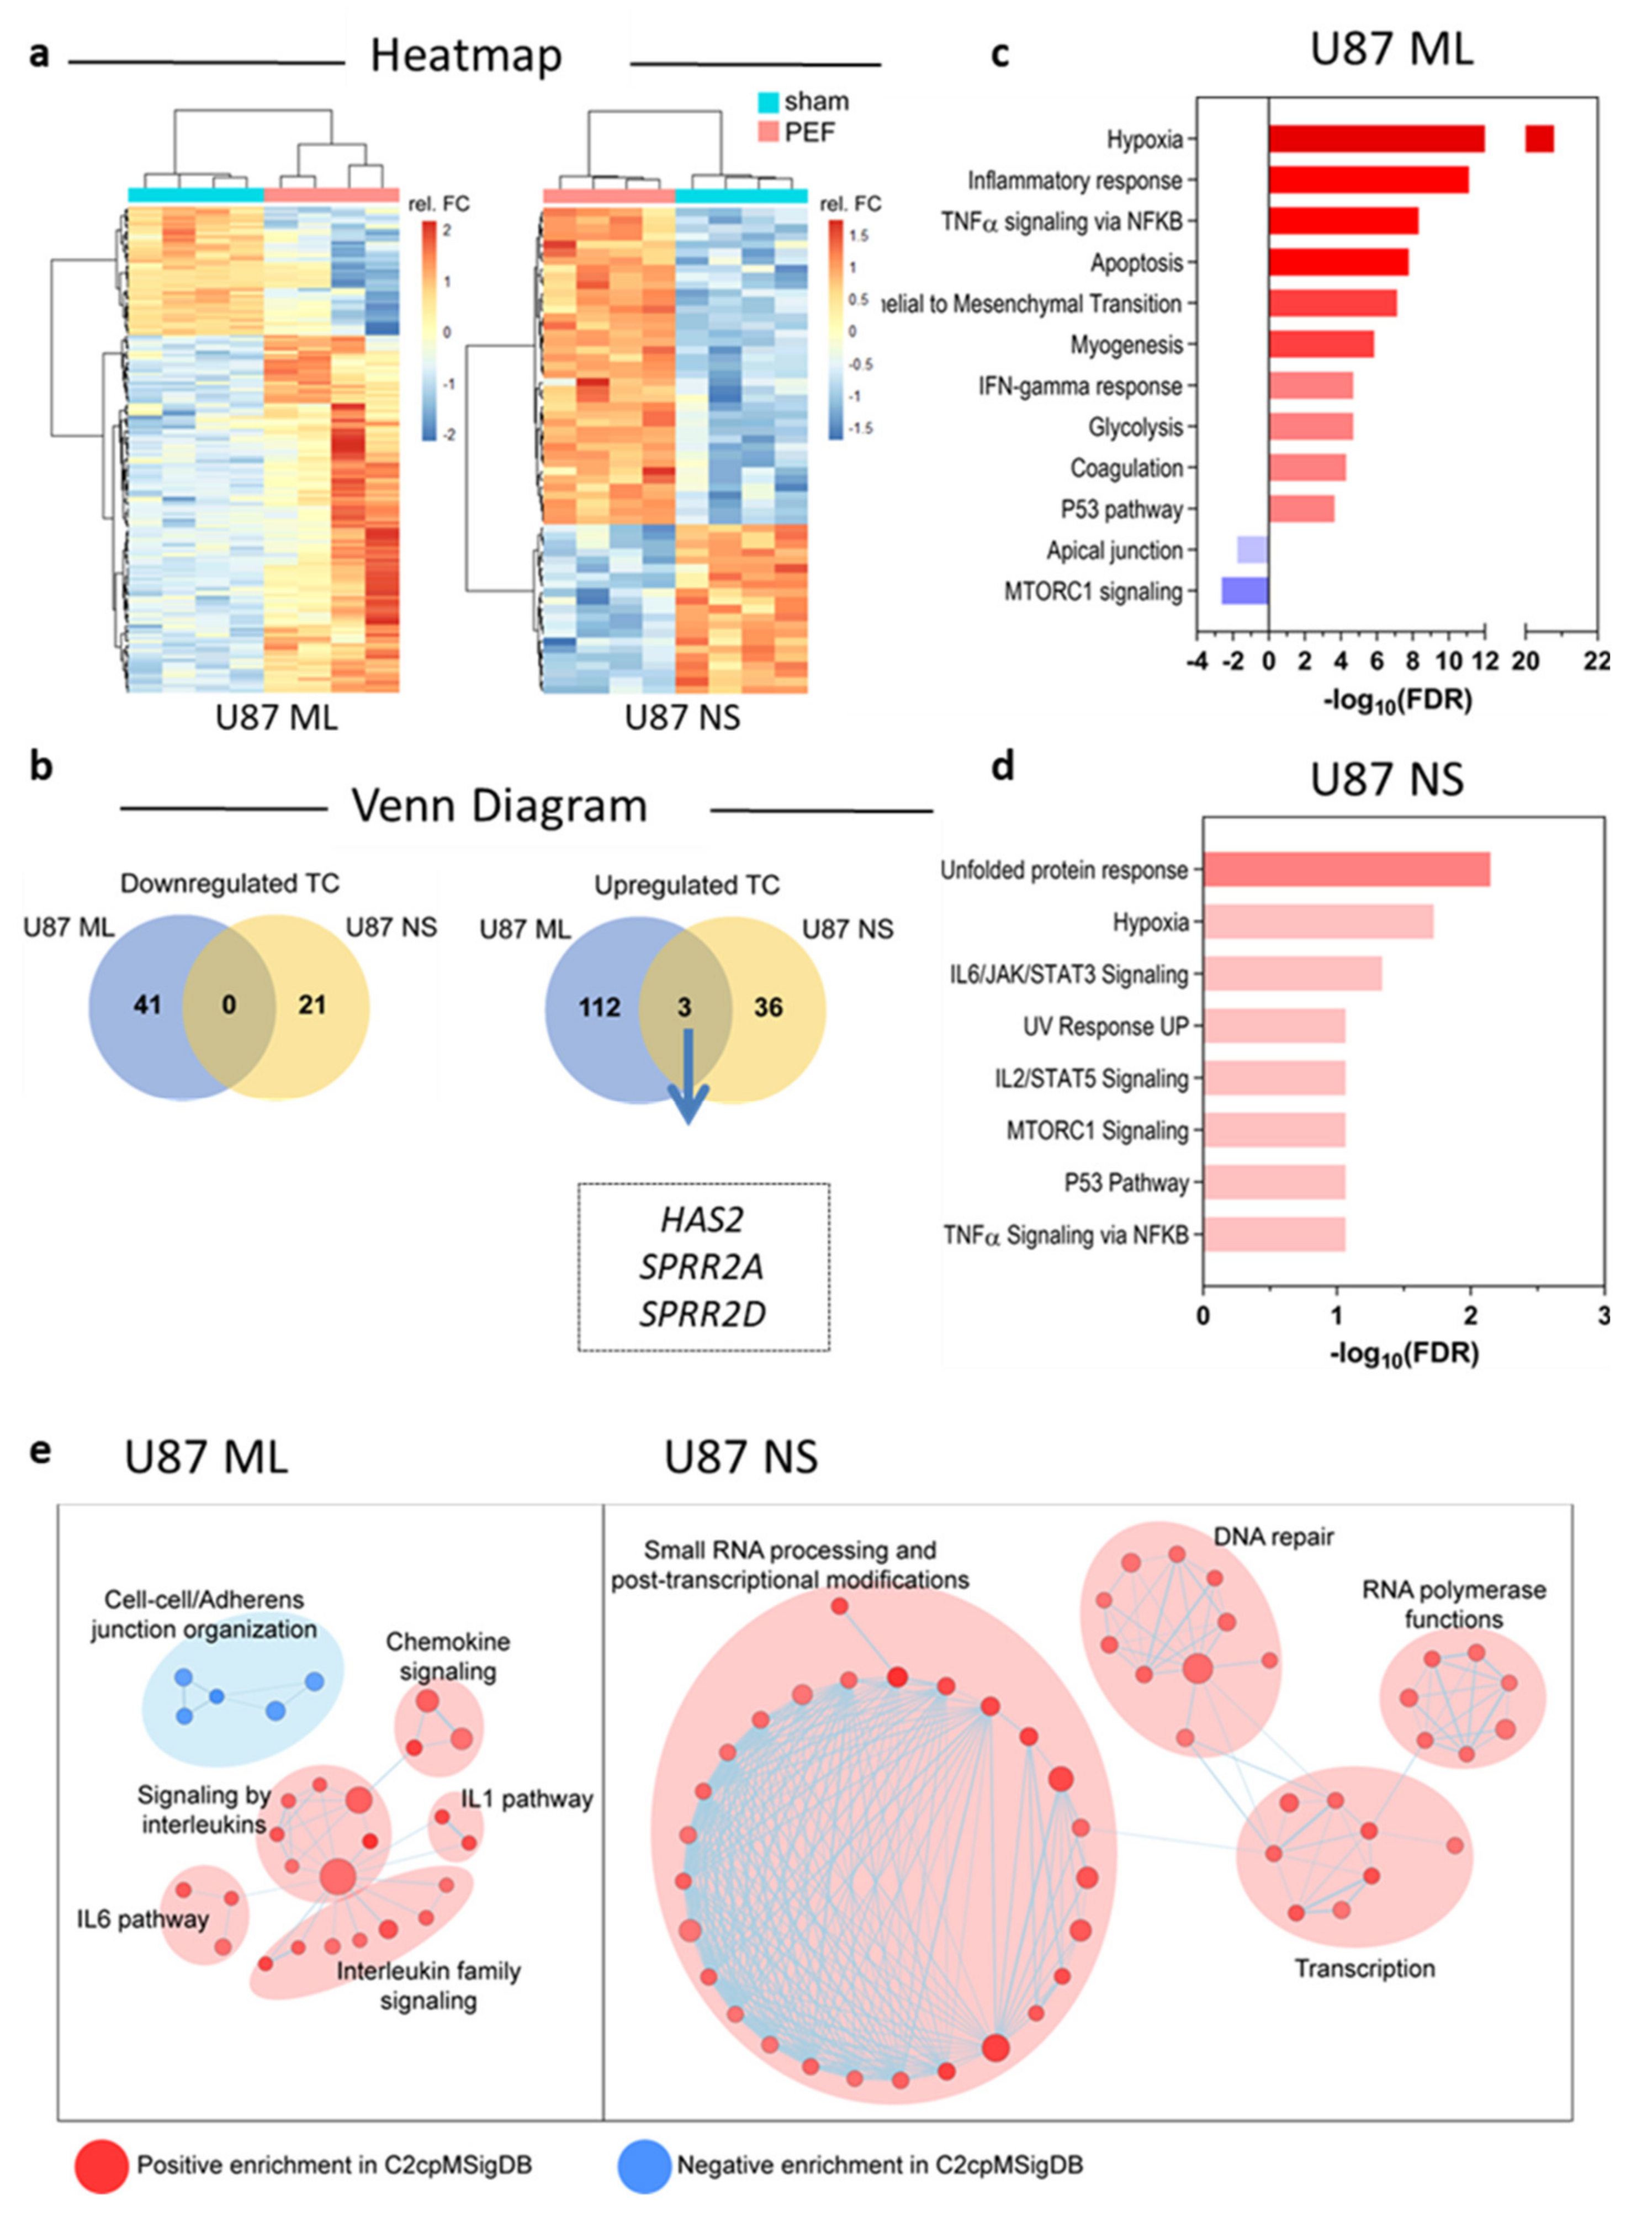
2.4. Transcriptomic Profiles of U87 ML and NS Cells and Validation of mRNA Expression
2.4.1. Affymetrix Gene Chip Analyses
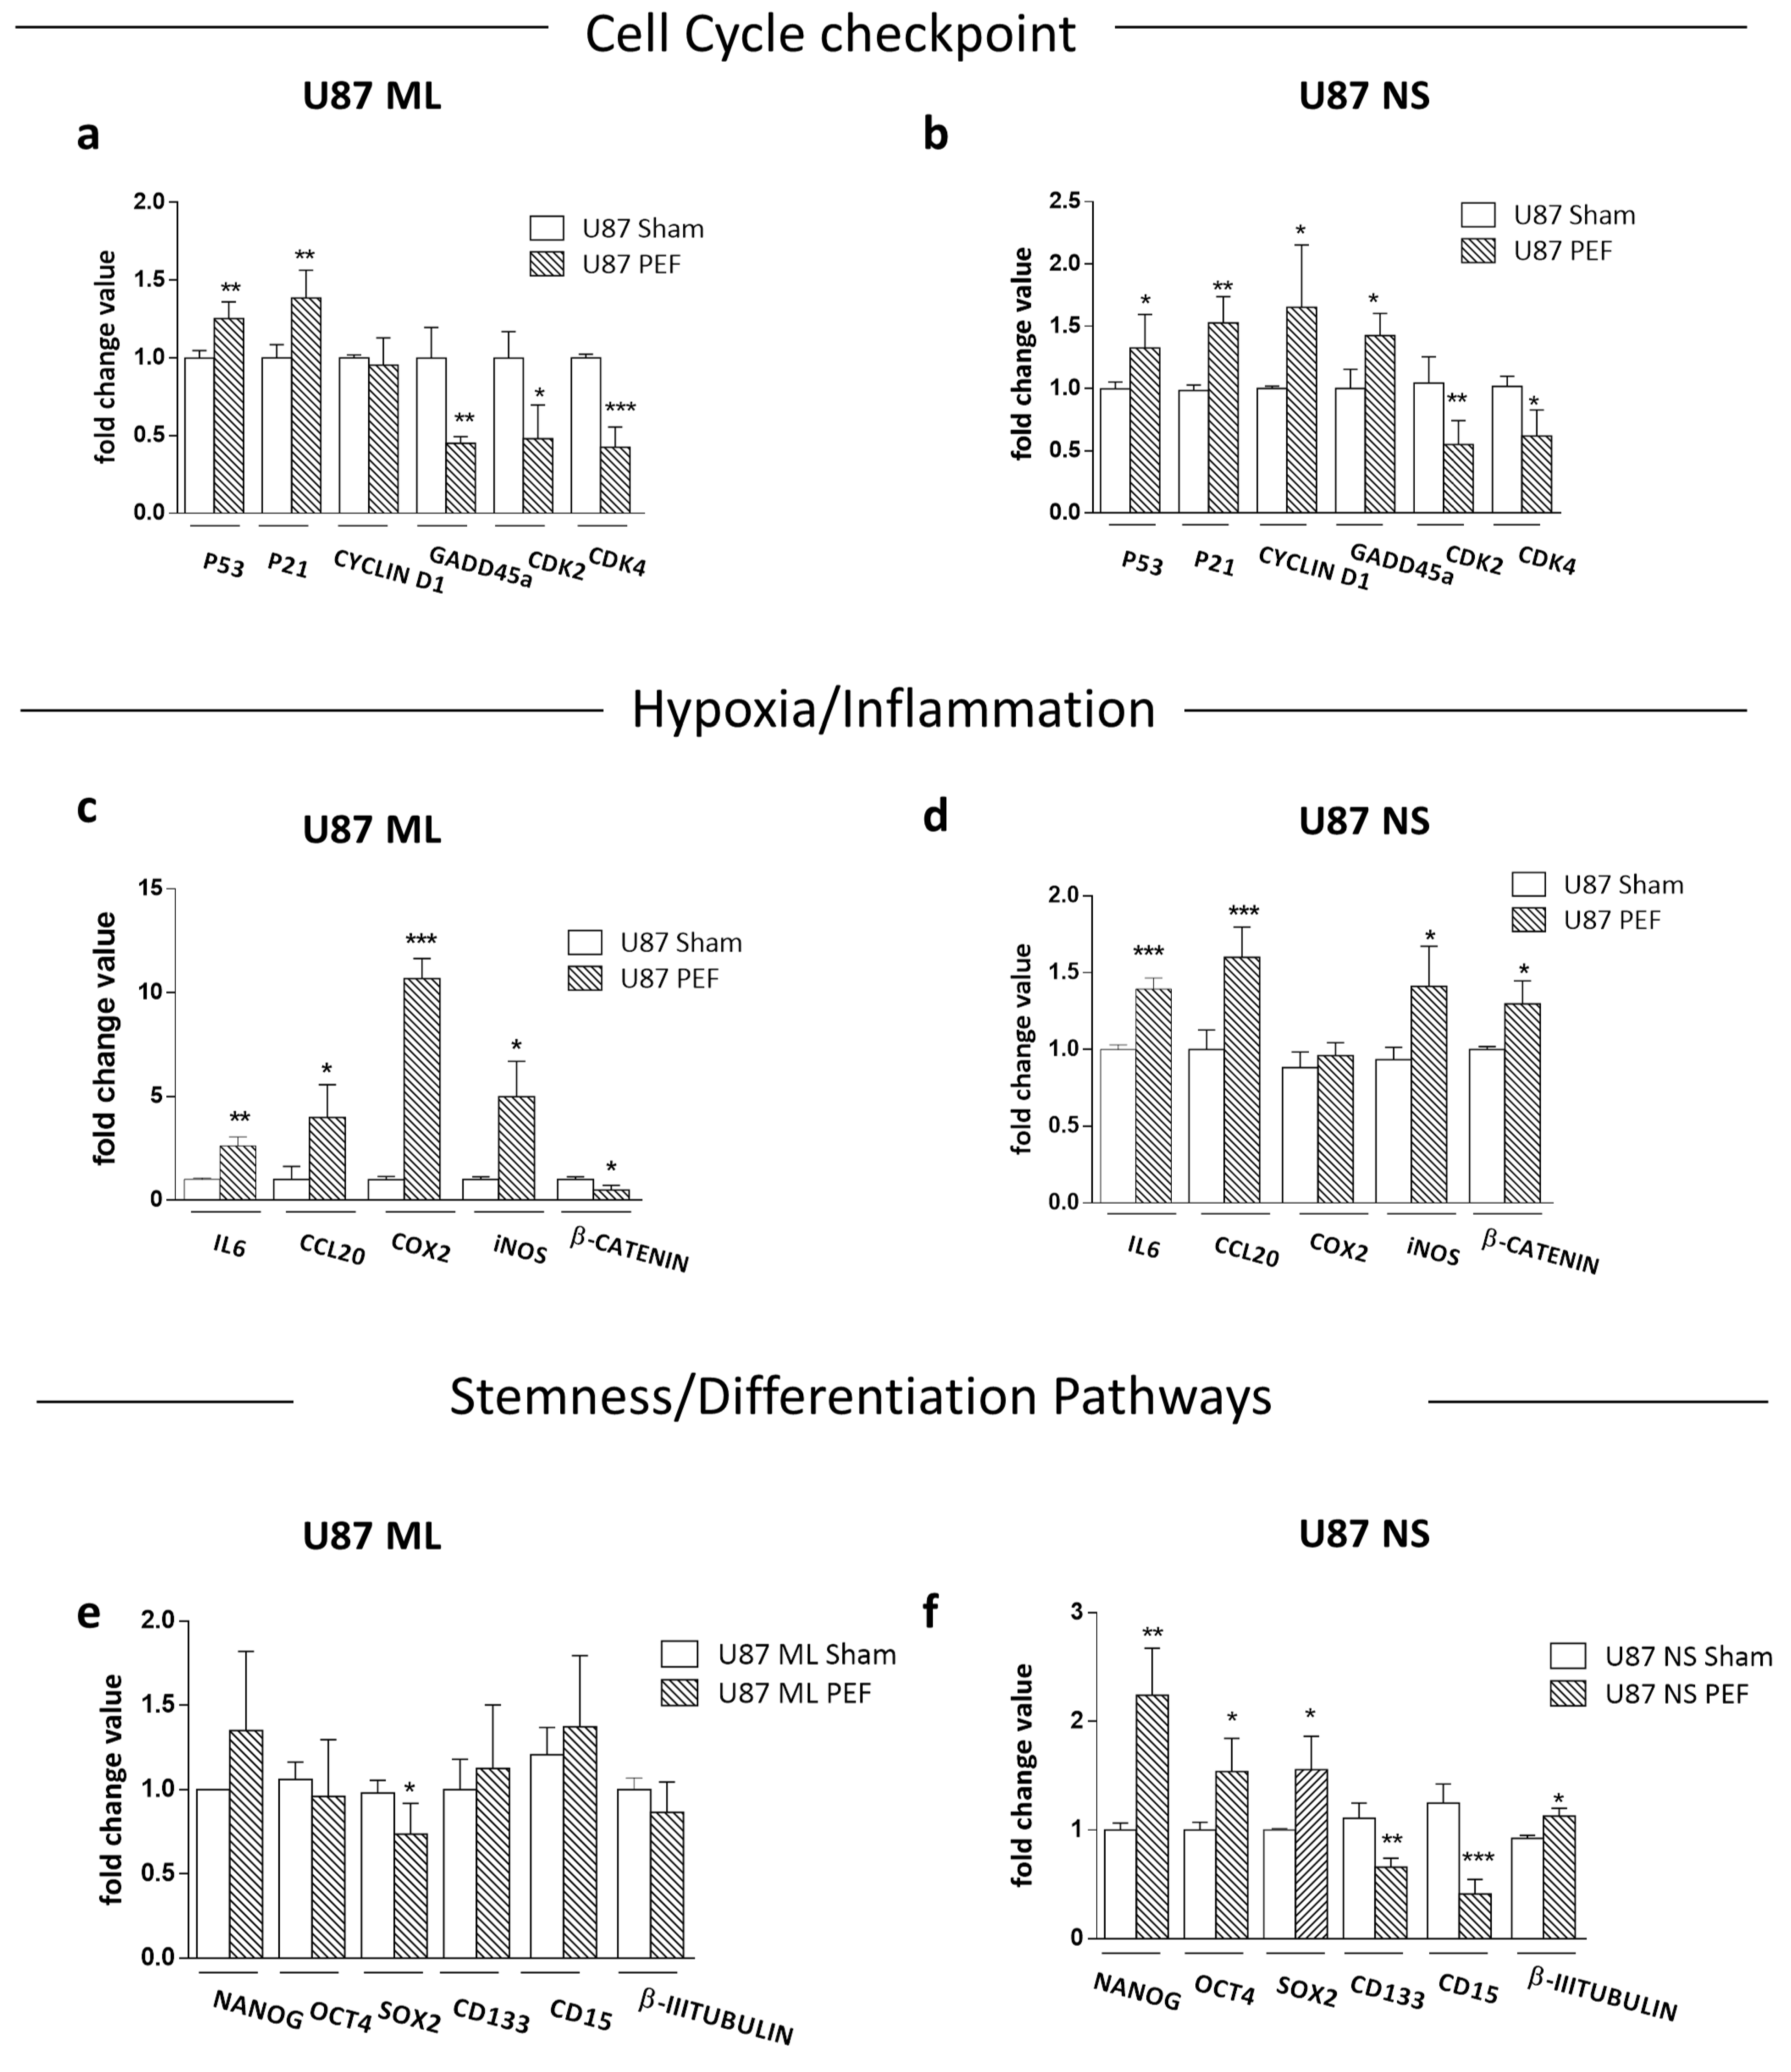
2.4.2. qPCR Validation of Transcriptome Data for Selected Genes
2.4.3. Effects of PEF Exposure on the Stemness/Differentiation Status of GBM Cells
2.5. Functional Testing after PEF-5 Exposure
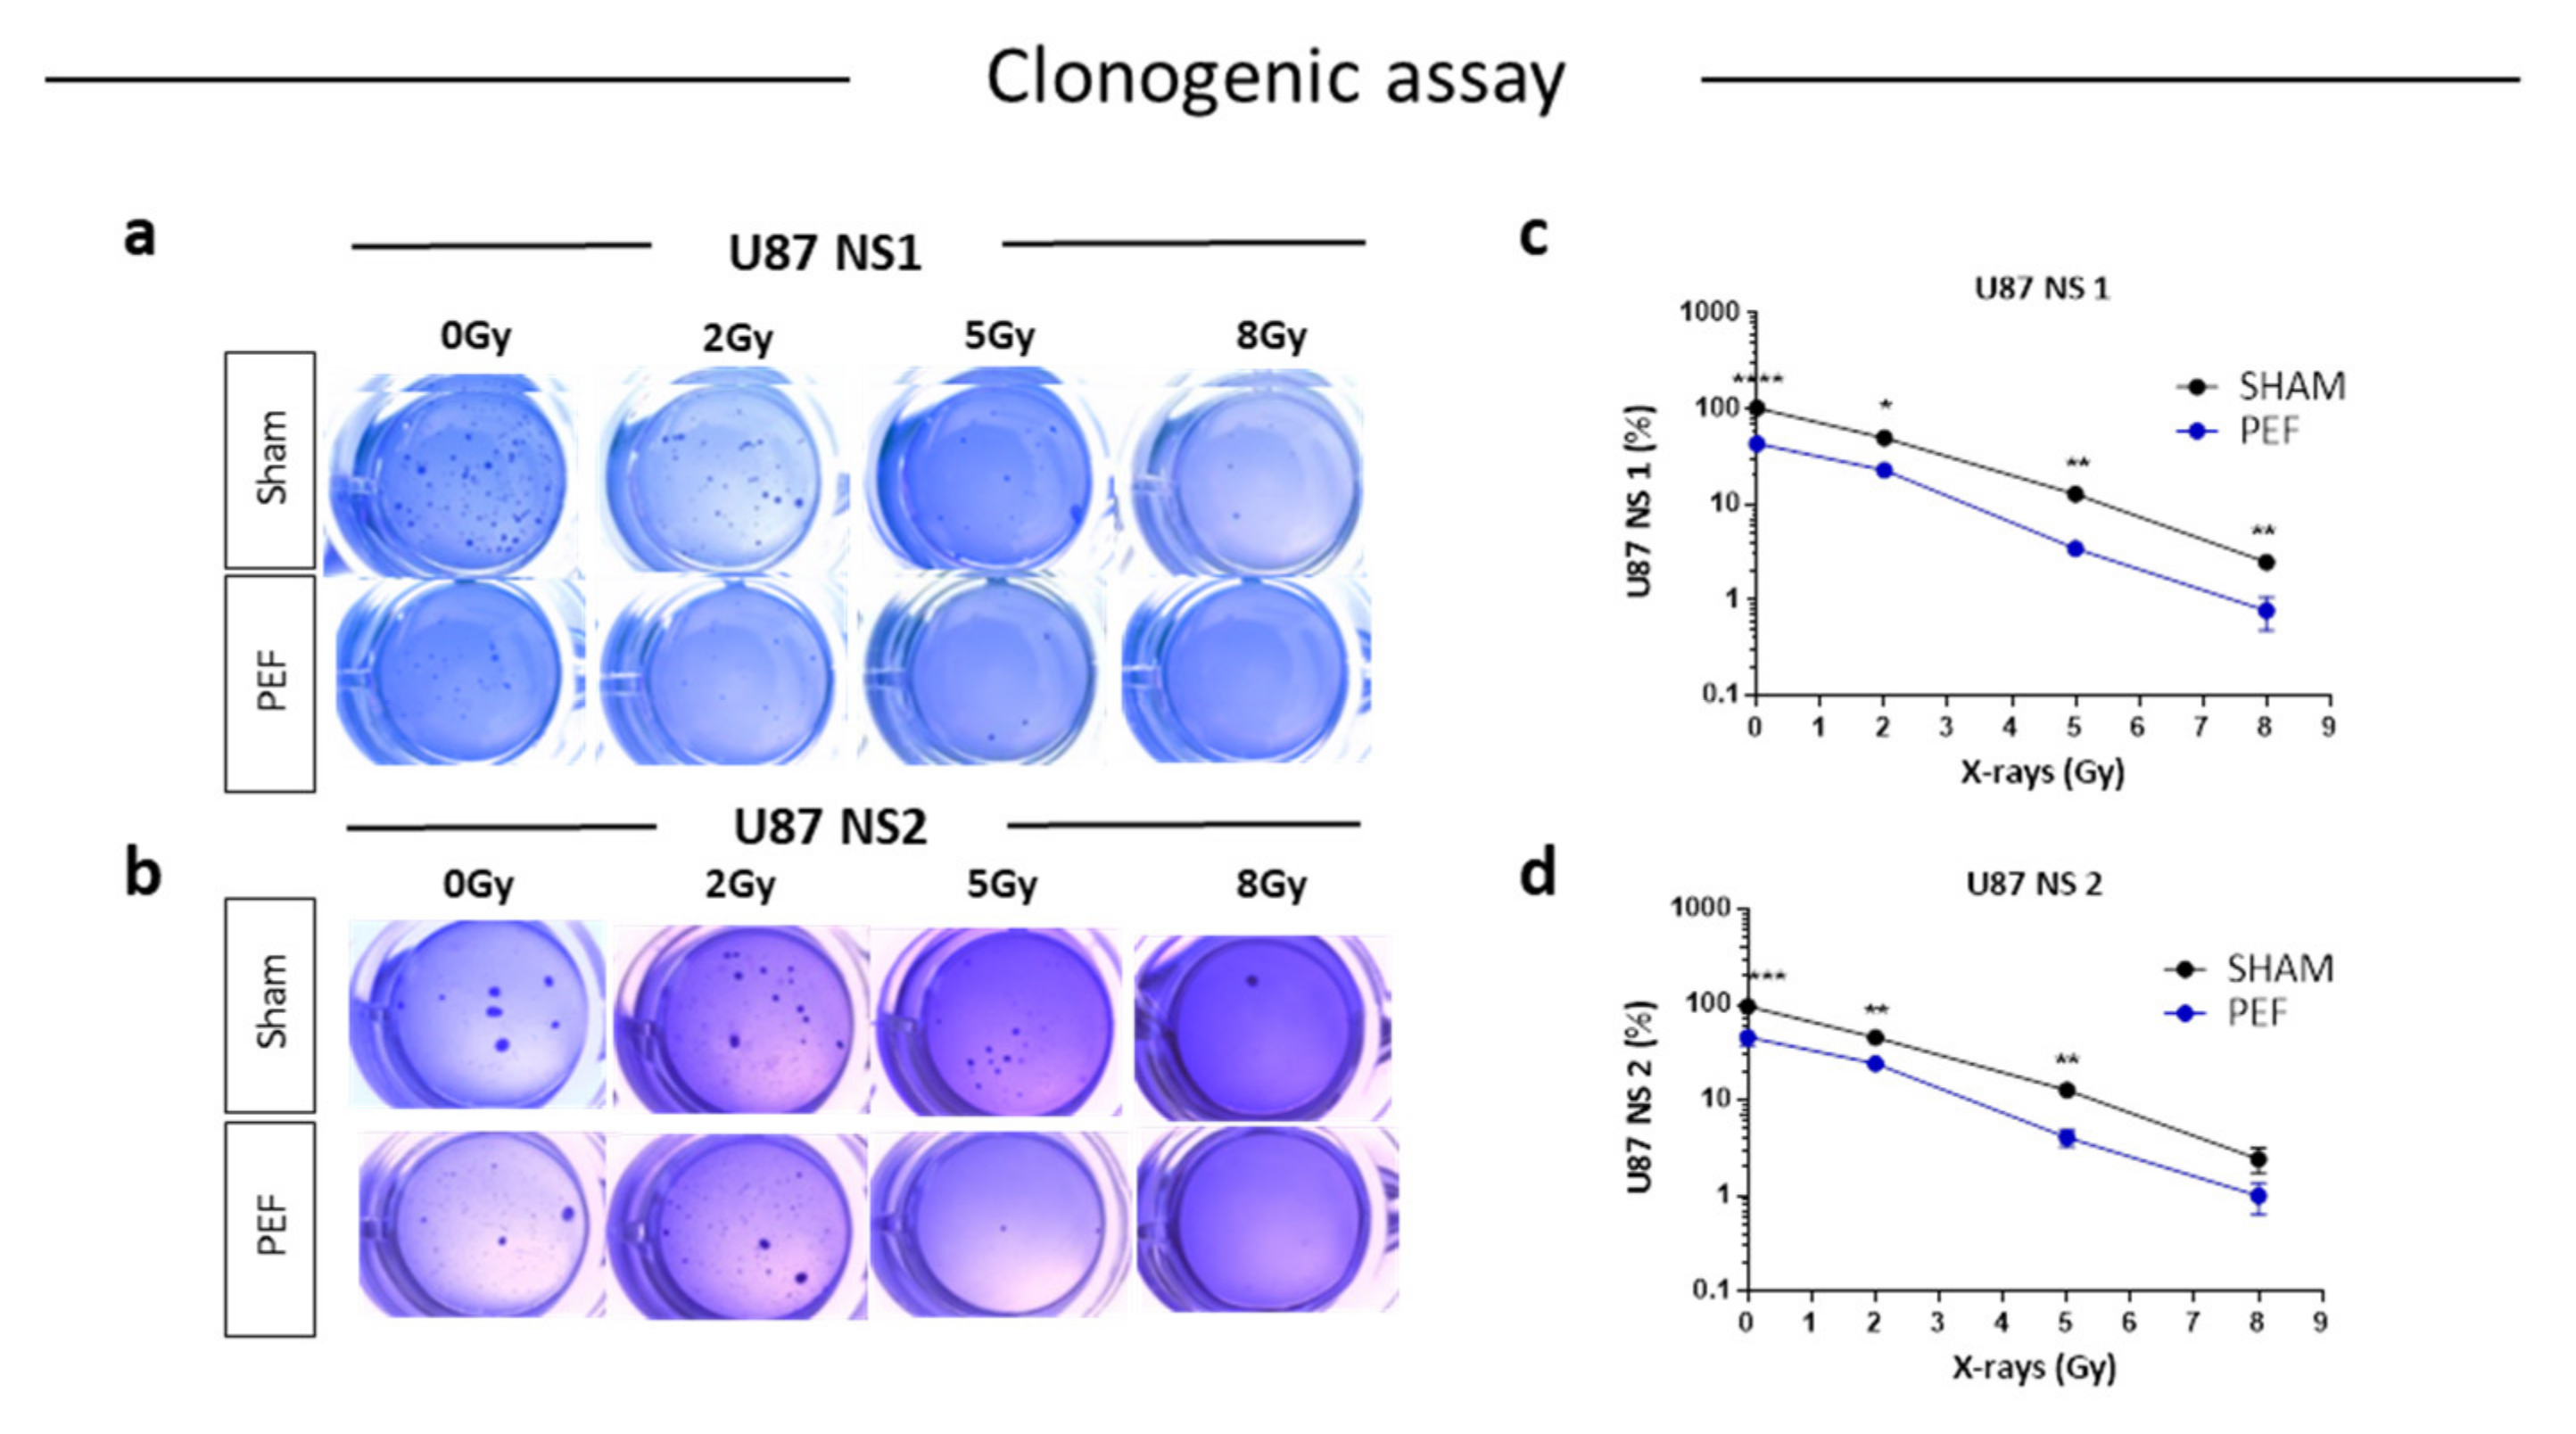
2.5.1. Clonogenic Survival Assay and IR Combined Treatment
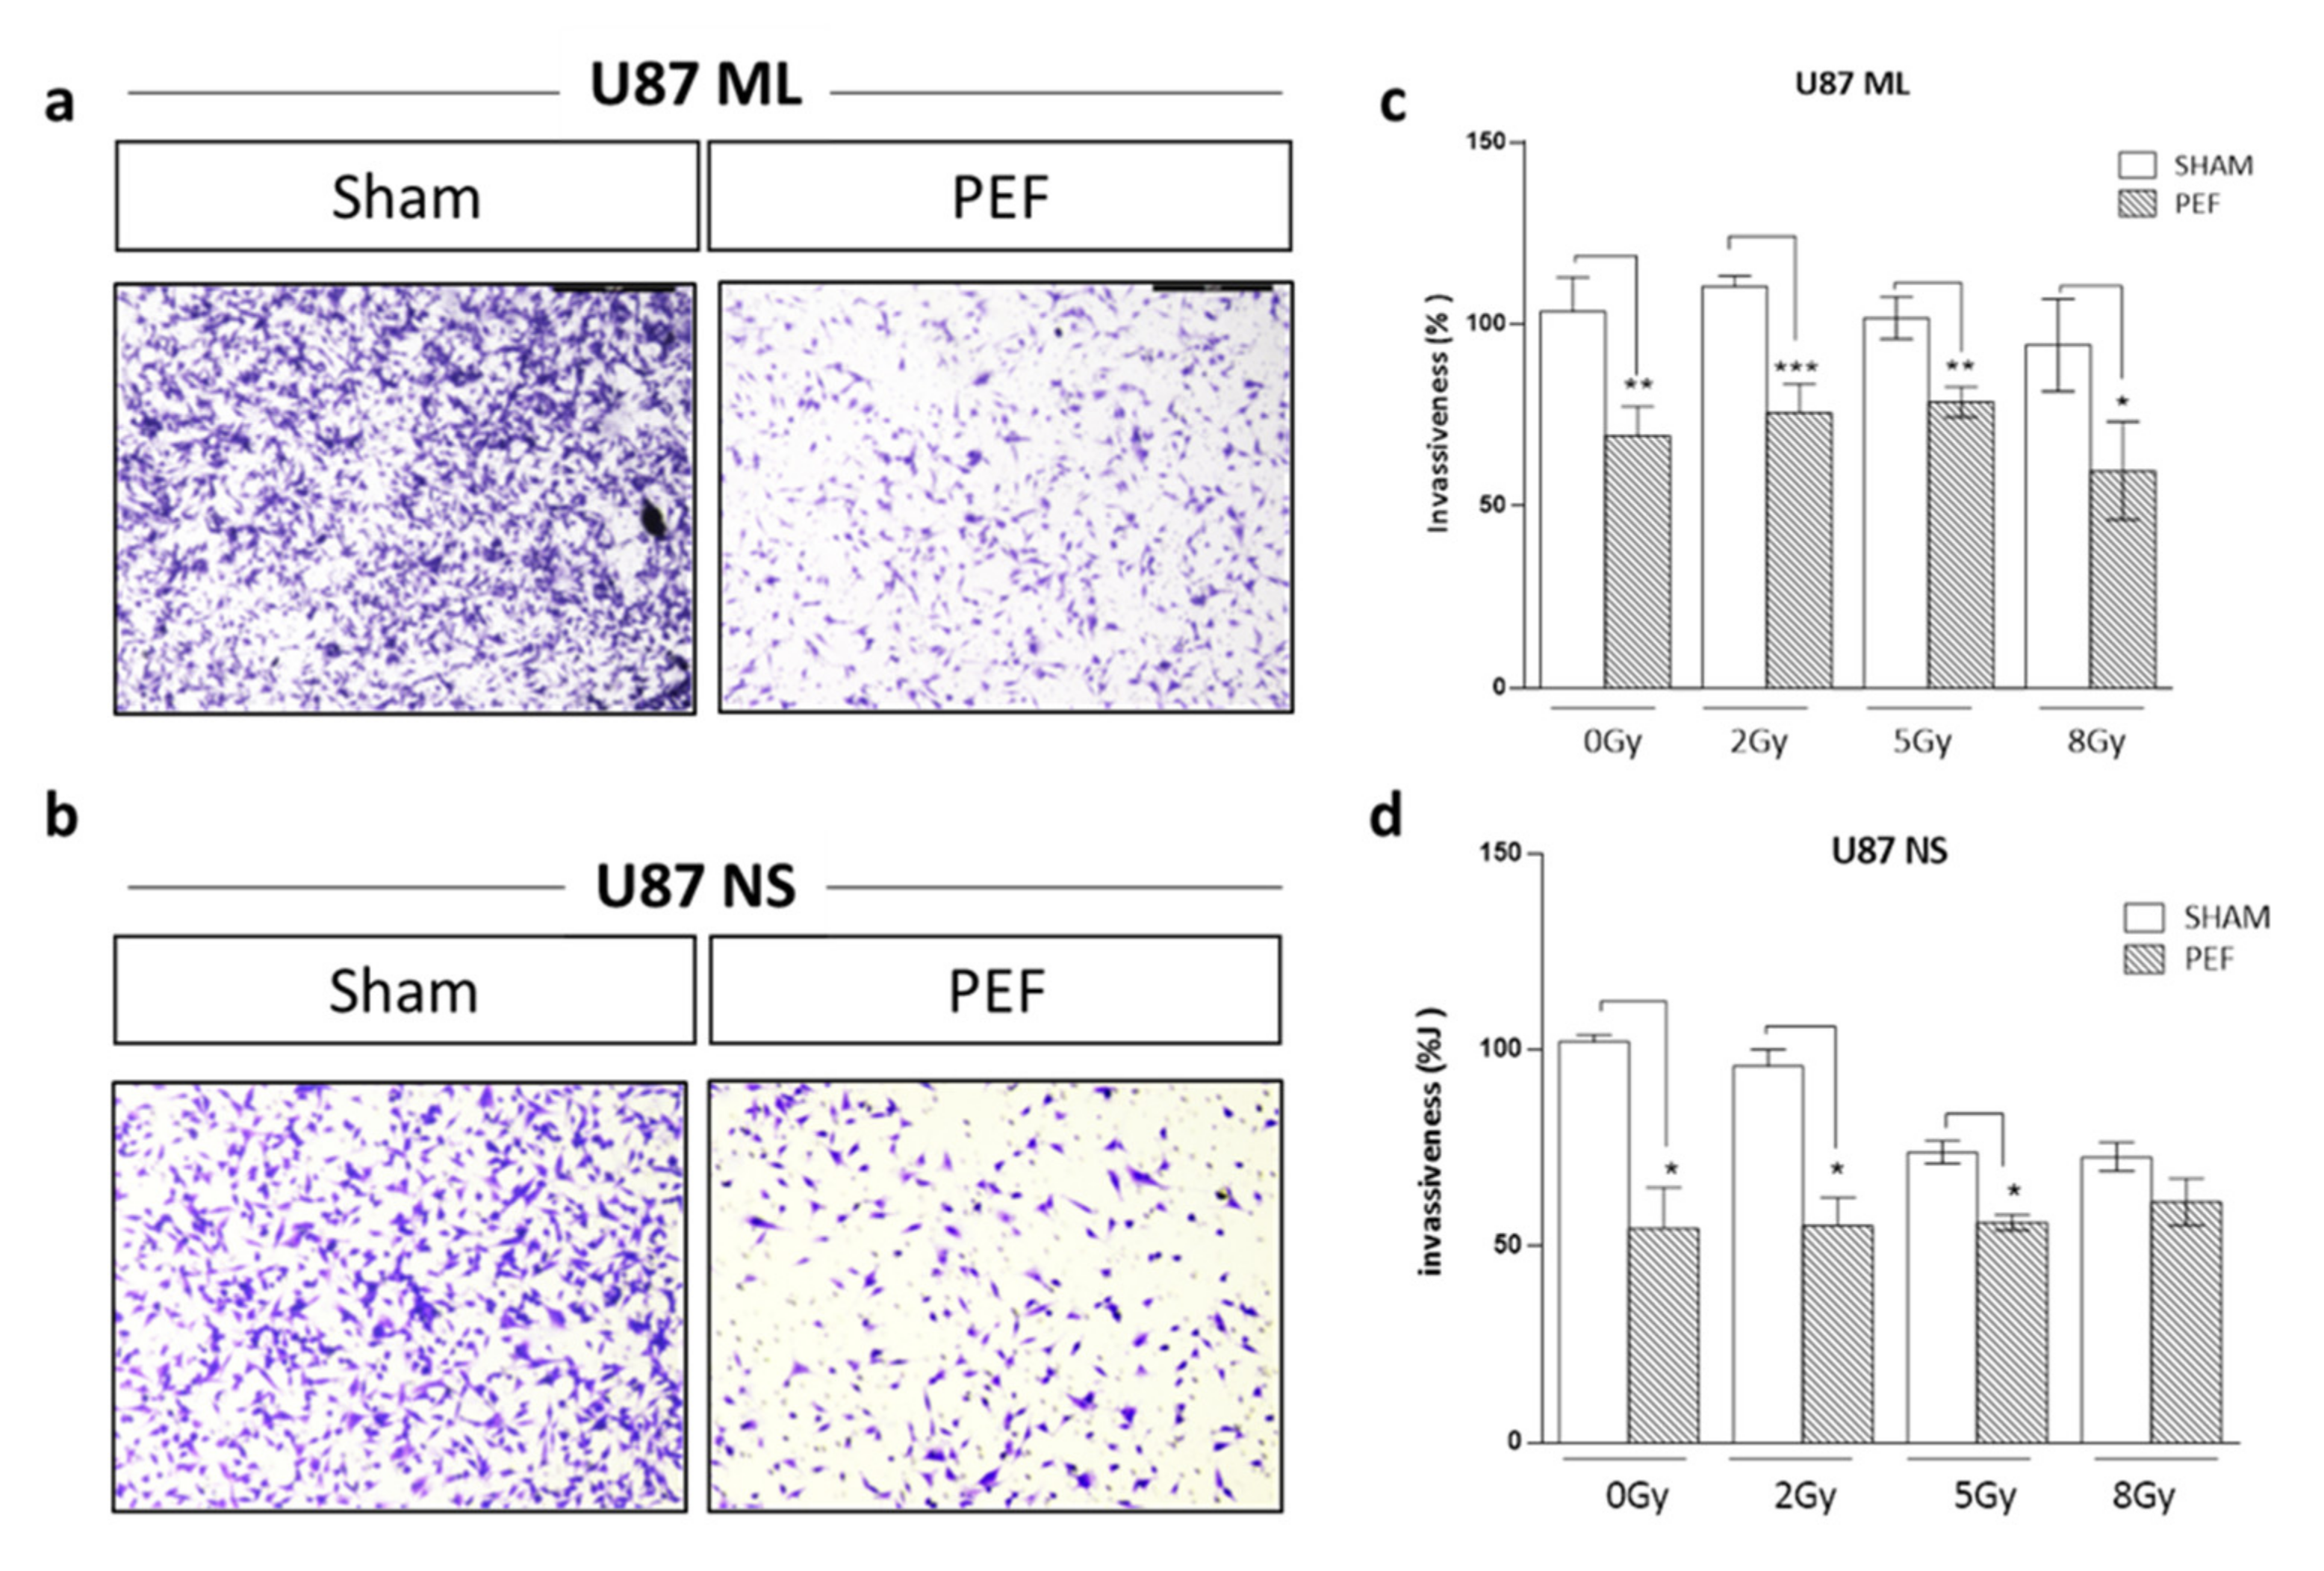
2.5.2. Invasion Assay after PEF-5 Exposure
3. Discussion
4. Materials and Methods
4.1. Cell Culture
4.2. Cell Exposure to PEF-5 and Ionizing Radiation IR
4.3. Viability Assays
4.4. Flow Cytometric Analyses
4.4.1. Cell Permeabilization
4.4.2. Evaluation of ROS
4.4.3. Cell Cycle
4.5. Transcriptomic Profiles of GBM Cells after PEF-5 Exposure
4.6. RNA Isolation and RT-PCR
4.7. In Vitro Functional Testing
4.7.1. Clonogenic Survival
4.7.2. Matrigel Invasion Assay
4.8. Statistical Analysis
5. Conclusions
Supplementary Materials
Author Contributions
Funding
Institutional Review Board Statement
Informed Consent Statement
Data Availability Statement
Acknowledgments
Conflicts of Interest
References
- Thakkar, J.P.; Dolecek, T.A.; Horbinski, C.; Ostrom, Q.; Lightner, D.D.; Barnholtz-Sloan, J.; Villano, J.L. Epidemiologic and Molecular Prognostic Review of Glioblastoma. Cancer Epidemiol. Biomarkers Prev. 2014, 23, 1985–1996. [Google Scholar] [CrossRef] [PubMed] [Green Version]
- Bonavia, R.; Inda, M.-d.-M.; Cavenee, W.K.; Furnari, F.B. Heterogeneity Maintenance in Glioblastoma: A Social Network. Cancer Res. 2011, 71, 4055–4060. [Google Scholar] [CrossRef] [PubMed] [Green Version]
- Marusyk, A.; Polyak, K. Tumor heterogeneity: Causes and consequences. Biochim. Biophys. Acta 2010, 1805, 105–117. [Google Scholar] [CrossRef] [PubMed] [Green Version]
- Meyer, M.; Reimand, J.; Lan, X.; Head, R.; Zhu, X.; Kushida, M.; Bayani, J.; Pressey, J.C.; Lionel, A.C.; Clarke, I.D.; et al. Single cell-derived clonal analysis of human glioblastoma links functional and genomic heterogeneity. Proc. Natl. Acad. Sci. USA 2015, 112, 851–856. [Google Scholar] [CrossRef] [Green Version]
- Patel, A.P.; Tirosh, I.; Trombetta, J.J.; Shalek, A.K.; Gillespie, S.M.; Wakimoto, H.; Cahill, D.P.; Nahed, B.V.; Curry, W.T.; Martuza, R.L.; et al. Single-cell RNA-seq highlights intratumoral heterogeneity in primary glioblastoma. Science 2014, 344, 1396–1401. [Google Scholar] [CrossRef] [PubMed] [Green Version]
- Snuderl, M.; Fazlollahi, L.; Le, L.P.; Nitta, M.; Zhelyazkova, B.H.; Davidson, C.J.; Akhavanfard, S.; Cahill, D.; Aldape, K.D.; Betensky, R.A.; et al. Mosaic Amplification of Multiple Receptor Tyrosine Kinase Genes in Glioblastoma. Cancer Cell 2011, 20, 810–817. [Google Scholar] [CrossRef] [PubMed] [Green Version]
- Sottoriva, A.; Spiteri, I.; Piccirillo, S.G.M.; Touloumis, A.; Collins, V.P.; Marioni, J.C.; Curtis, C.; Watts, C.; Tavaré, S. Intratumor heterogeneity in human glioblastoma reflects cancer evolutionary dynamics. Proc. Natl. Acad. Sci. USA 2013, 110, 4009–4014. [Google Scholar] [CrossRef] [Green Version]
- Szerlip, N.J.; Pedraza, A.; Chakravarty, D.; Azim, M.; McGuire, J.; Fang, Y.; Ozawa, T.; Holland, E.C.; Huse, J.T.; Jhanwar, S.; et al. Intratumoral heterogeneity of receptor tyrosine kinases EGFR and PDGFRA amplification in glioblastoma defines subpopulations with distinct growth factor response. Proc. Natl. Acad. Sci. USA 2012, 109, 3041–3046. [Google Scholar] [CrossRef] [Green Version]
- Galli, R.; Binda, E.; Orfanelli, U.; Cipelletti, B.; Gritti, A.; De Vitis, S.; Fiocco, R.; Foroni, C.; DiMeco, F.; Vescovi, A. Isolation and Characterization of Tumorigenic, Stem-like Neural Precursors from Human Glioblastoma. Cancer Res. 2004, 64, 7011–7021. [Google Scholar] [CrossRef] [Green Version]
- Singh, S.K.; Clarke, I.D.; Terasaki, M.; Bonn, V.E.; Hawkins, C.; Squire, J.; Dirks, P.B. Identification of a cancer stem cell in human brain tumors. Cancer Res. 2003, 63, 5821–5828. [Google Scholar]
- Singh, S.K.; Hawkins, C.; Clarke, I.D.; Squire, J.A.; Bayani, J.; Hide, T.; Henkelman, R.M.; Cusimano, M.D.; Dirks, P.B. Identification of human brain tumour initiating cells. Nature 2004, 432, 396–401. [Google Scholar] [CrossRef] [PubMed]
- Ivey, J.W.; Wasson, E.M.; Alinezhadbalalami, N.; Kanitkar, A.; Debinski, W.; Sheng, Z.; Davalos, R.V.; Verbridge, S.S. Characterization of Ablation Thresholds for 3D-Cultured Patient-Derived Glioma Stem Cells in Response to High-Frequency Irreversible Electroporation. Research 2019, 2019, 8081315. [Google Scholar] [CrossRef] [PubMed] [Green Version]
- Jordan, C.T.; Guzman, M.L.; Noble, M. Cancer Stem Cells. N. Engl. J. Med. 2006, 355, 1253–1261. [Google Scholar] [CrossRef] [PubMed]
- Auffinger, B.; Tobias, A.L.; Han, Y.; Lee, G.; Guo, D.; Dey, M.; Lesniak, M.S.; Ahmed, A.U. Conversion of differentiated cancer cells into cancer stem-like cells in a glioblastoma model after primary chemotherapy. Cell Death Differ. 2014, 21, 1119–1131. [Google Scholar] [CrossRef] [PubMed]
- Ayob, A.Z.; Ramasamy, T.S. Cancer stem cells as key drivers of tumour progression. J. Biomed. Sci. 2018, 25, 20. [Google Scholar] [CrossRef]
- Flemming, A. Targeting the root of cancer relapse. Nat. Rev. Drug Discov. 2015, 14, 165. [Google Scholar] [CrossRef]
- Ostrom, Q.T.; Bauchet, L.; Davis, F.G.; Deltour, I.; Fisher, J.L.; Langer, C.E.; Pekmezci, M.; Schwartzbaum, J.A.; Turner, M.C.; Walsh, K.M.; et al. The epidemiology of glioma in adults: A "state of the science" review. Neuro Oncol. 2014, 16, 896–913. [Google Scholar] [CrossRef] [Green Version]
- Reya, T.; Morrison, S.J.; Clarke, M.F.; Weissman, I.L. Stem cells, cancer, and cancer stem cells. Nature 2001, 414, 105–111. [Google Scholar] [CrossRef] [Green Version]
- Jolly, M.K.; Celià-Terrassa, T. Dynamics of Phenotypic Heterogeneity Associated with EMT and Stemness during Cancer Progression. J. Clin. Med. 2019, 8, 1542. [Google Scholar] [CrossRef] [Green Version]
- Chaffer, C.L.; Brueckmann, I.; Scheel, C.; Kaestli, A.J.; Wiggins, P.A.; Rodrigues, L.O.; Brooks, M.; Reinhardt, F.; Su, Y.; Polyak, K.; et al. Normal and neoplastic nonstem cells can spontaneously convert to a stem-like state. Proc. Natl. Acad. Sci. USA 2011, 108, 7950–7955. [Google Scholar] [CrossRef] [Green Version]
- Gupta, P.B.; Fillmore, C.M.; Jiang, G.; Shapira, S.D.; Tao, K.; Kuperwasser, C.; Lander, E.S. Stochastic State Transitions Give Rise to Phenotypic Equilibrium in Populations of Cancer Cells. Cell 2011, 146, 633–644. [Google Scholar] [CrossRef] [PubMed] [Green Version]
- Mani, S.A.; Guo, W.; Liao, M.-J.; Eaton, E.N.; Ayyanan, A.; Zhou, A.Y.; Brooks, M.; Reinhard, F.; Zhang, C.C.; Shipitsin, M.; et al. The Epithelial-Mesenchymal Transition Generates Cells with Properties of Stem Cells. Cell 2008, 133, 704–715. [Google Scholar] [CrossRef] [PubMed] [Green Version]
- Nieto, M.A.; Huang, R.Y.-J.; Jackson, R.A.; Thiery, J.P. EMT: 2016. Cell 2016, 166, 21–45. [Google Scholar] [CrossRef] [PubMed] [Green Version]
- Cornelis, F.H.; Ben Ammar, M.; Nouri-Neuville, M.; Matton, L.; Benderra, M.A.; Gligorov, J.; Fallet, V.; Mir, L.M. Percutaneous Image-Guided Electrochemotherapy of Spine Metastases: Initial Experience. Cardiovasc. Interv. Radiol. 2019, 42, 1806–1809. [Google Scholar] [CrossRef] [PubMed]
- Davalos, R.V.; Mir, L.M.; Rubinsky, B. Tissue Ablation with Irreversible Electroporation. Ann. Biomed. Eng. 2005, 33, 223–231. [Google Scholar] [CrossRef] [PubMed]
- Gehl, J.; Sersa, G.; Matthiessen, L.W.; Muir, T.; Soden, D.; Occhini, A.; Quaglino, P.; Curatolo, P.; Campana, L.G.; Kunte, C.; et al. Updated standard operating procedures for electrochemotherapy of cutaneous tumours and skin metastases. Acta Oncol. 2018, 57, 874–882. [Google Scholar] [CrossRef] [PubMed]
- Sano, M.; Arena, C.B.; Bittleman, K.R.; DeWitt, M.R.; Cho, H.J.; Szot, C.S.; Saur, D.; Cissell, J.M.; Robertson, J.; Lee, Y.W.; et al. Bursts of Bipolar Microsecond Pulses Inhibit Tumor Growth. Sci. Rep. 2015, 5, 14999. [Google Scholar] [CrossRef] [Green Version]
- Al-Sakere, B.; André, F.; Bernat, C.; Connault, E.; Opolon, P.; Davalos, R.V.; Rubinsky, B.; Mir, L.M. Tumor Ablation with Irreversible Electroporation. PLoS ONE 2007, 2, e1135. [Google Scholar] [CrossRef] [Green Version]
- Kotnik, T.; Rems, L.; Tarek, M.; Miklavčič, D. Membrane Electroporation and Electropermeabilization: Mechanisms and Models. Annu. Rev. Biophys. 2019, 48, 63–91. [Google Scholar] [CrossRef]
- Yarmush, M.L.; Golberg, A.; Serša, G.; Kotnik, T.; Miklavčič, D. Electroporation-Based Technologies for Medicine: Principles, Applications, and Challenges. Annu. Rev. Biomed. Eng. 2014, 16, 295–320. [Google Scholar] [CrossRef] [Green Version]
- Arena, C.B.; Garcia, P.A.; Sano, M.B.; Olson, J.D.; Rogers-Cotrone, T.; Rossmeisl, J.H.; Davalos, R.V. Focal blood-brain-barrier disruption with high-frequency pulsed electric fields. Technology 2014, 2, 206–213. [Google Scholar] [CrossRef] [Green Version]
- Garcia, P.A.; Rossmeisl, J.H.; Robertson, J.L.; Olson, J.D.; Johnson, A.J.; Ellis, T.L.; Davalos, R.V. 7.0-T Magnetic Resonance Imaging Characterization of Acute Blood-Brain-Barrier Disruption Achieved with Intracranial Irreversible Electroporation. PLoS ONE 2012, 7, e50482. [Google Scholar] [CrossRef] [PubMed]
- Ringel-Scaia, V.M.; Beitel-White, N.; Lorenzo, M.F.; Brock, R.; Huie, K.E.; Coutermarsh-Ott, S.; Eden, K.; McDaniel, D.; Verbridge, S.S.; Rossmeisl, J.H.; et al. High-frequency irreversible electroporation is an effective tumor ablation strategy that induces immunologic cell death and promotes systemic anti-tumor immunity. EBioMedicine 2019, 44, 112–125. [Google Scholar] [CrossRef] [PubMed] [Green Version]
- Tanori, M.; Casciati, A.; Zambotti, A.; Pinto, R.; Gianlorenzi, I.; Pannicelli, A.; Giardullo, P.; Benassi, B.; Marino, C.; Mancuso, M.; et al. Microsecond Pulsed Electric Fields: An Effective Way to Selectively Target and Radiosensitize Medulloblastoma Cancer Stem Cells. Int. J. Radiat. Oncol. 2021, 109, 1495–1507. [Google Scholar] [CrossRef] [PubMed]
- Mizuguchi, Y.; Specht, S.; Lunz, J.G.; Isse, K.; Corbitt, N.; Takizawa, T.; Demetris, A.J. SPRR2A enhances p53 deacetylation through HDAC1 and down regulates p21 promoter activity. BMC Mol. Biol. 2012, 13, 20. [Google Scholar] [CrossRef] [Green Version]
- Parnigoni, A.; Caon, I.; Moretto, P.; Viola, M.; Karousou, E.; Passi, A.; Vigetti, D. The role of the multifaceted long non-coding RNAs: A nuclear-cytosolic interplay to regulate hyaluronan metabolism. Matrix Biol. Plus 2021, 11, 100060. [Google Scholar] [CrossRef]
- Yoo, K.-C.; Suh, Y.; An, Y.; Lee, H.-J.; Jeong, Y.J.; Uddin, N.; Cui, Y.-H.; Roh, T.H.; Shim, J.-K.; Chang, J.H.; et al. Proinvasive extracellular matrix remodeling in tumor microenvironment in response to radiation. Oncogene 2018, 37, 3317–3328. [Google Scholar] [CrossRef]
- Zou, M.; Zhu, W.; Wang, L.; Shi, L.; Gao, R.; Ou, Y.; Chen, X.; Wang, Z.; Jiang, A.; Liu, K.; et al. AEG-1/MTDH-activated autophagy enhances human malignant glioma susceptibility to TGF-β1-triggered epithelial-mesenchymal transition. Oncotarget 2016, 7, 13122–13138. [Google Scholar] [CrossRef] [Green Version]
- Orjalo, A.V.; Bhaumik, D.; Gengler, B.K.; Scott, G.K.; Campisi, J. Cell surface-bound IL-1α is an upstream regulator of the senescence-associated IL-6/IL-8 cytokine network. Proc. Natl. Acad. Sci. USA 2009, 106, 17031–17036. [Google Scholar] [CrossRef] [Green Version]
- Boso, D.; Rampazzo, E.; Zanon, C.; Bresolin, S.; Maule, F.; Porcù, E.; Cani, A.; Della Puppa, A.; Trentin, L.; Basso, G.; et al. HIF-1α/Wnt signaling-dependent control of gene transcription regulates neuronal differentiation of glioblastoma stem cells. Theranostics 2019, 9, 4860–4877. [Google Scholar] [CrossRef]
- Fitzpatrick, S.F.; Tambuwala, M.M.; Bruning, U.; Schaible, B.; Scholz, C.C.; Byrne, A.; O’Connor, A.; Gallagher, W.M.; Lenihan, C.R.; Garvey, J.F.; et al. An Intact Canonical NF-κB Pathway Is Required for Inflammatory Gene Expression in Response to Hypoxia. J. Immunol. 2010, 186, 1091–1096. [Google Scholar] [CrossRef] [PubMed] [Green Version]
- Kahlert, U.D.; Bender, N.; Maciaczyk, D.; Bogiel, T.; Bar, E.E.; Eberhart, C.G.; Nikkhah, G.; Maciaczyk, J. Original article CD133/CD15 defines distinct cell subpopulations with differential in vitro clonogenic activity and stem cell-related gene expression profile in in vitro propagated glioblastoma multiforme-derived cell line with a PNET-like component. Folia Neuropathol. 2012, 4, 357–368. [Google Scholar] [CrossRef] [PubMed]
- Elowitz, M.B.; Levine, A.J.; Siggia, E.D.; Swain, P.S. Stochastic Gene Expression in a Single Cell. Science 2002, 297, 1183–1186. [Google Scholar] [CrossRef] [PubMed] [Green Version]
- Thankamony, A.P.; Saxena, K.; Murali, R.; Jolly, M.K.; Nair, R. Cancer Stem Cell Plasticity—A Deadly Deal. Front. Mol. Biosci. 2020, 7, 79. [Google Scholar] [CrossRef]
- Hanna, H.; Denzi, A.; Liberti, M.; Andrã©, F.M.; Mir, L.M. Electropermeabilization of Inner and Outer Cell Membranes with Microsecond Pulsed Electric Fields: Quantitative Study with Calcium Ions. Sci. Rep. 2017, 7, 13079. [Google Scholar] [CrossRef]
- Kotnik, T.; Miklavčič, D. Analytical Description of Transmembrane Voltage Induced by Electric Fields on Spheroidal Cells. Biophys. J. 2000, 79, 670–679. [Google Scholar] [CrossRef] [Green Version]
- Lambert, E.; Manczak, R.; Barthout, E.; Saada, S.; Porcù, E.; Maule, F.; Bessette, B.; Viola, G.; Persano, L.; Dalmay, C.; et al. Microfluidic Lab-on-a-Chip Based on UHF-Dielectrophoresis for Stemness Phenotype Characterization and Discrimination among Glioblastoma Cells. Biosensors 2021, 11, 388. [Google Scholar] [CrossRef]
- Manczak, R.; Saada, S.; Provent, T.; Dalmay, C.; Bessette, B.; Begaud, G.; Battu, S.; Blondy, P.; Jauberteau, M.O.; Baristiran Kaynak, C.; et al. UHF-dielectrophoresis crossover frequency as a new marker for discrimination of glioblastoma undifferentiated cells. IEEE J. Electromagn. RF Microw. Med. Biol. 2019, 3, 191–198. [Google Scholar] [CrossRef]
- Casciati, A.; Tanori, M.; Manczak, R.; Saada, S.; Tanno, B.; Giardullo, P.; Porcù, E.; Rampazzo, E.; Persano, L.; Viola, G.; et al. Human Medulloblastoma Cell Lines: Investigating on Cancer Stem Cell-Like Phenotype. Cancers 2020, 12, 226. [Google Scholar] [CrossRef] [Green Version]
- Bonnafous, P.; Vernhes, M.-C.; Teissie, J.; Gabriel, B. The generation of reactive-oxygen species associated with long-lasting pulse-induced electropermeabilisation of mammalian cells is based on a non-destructive alteration of the plasma membrane. Biochim. Biophys. Acta (BBA) Biomembr. 1999, 1461, 123–134. [Google Scholar] [CrossRef] [Green Version]
- Ryu, J.M.; Lee, H.J.; Jung, Y.H.; Lee, K.H.; Kim, D.I.; Kim, J.Y.; Ko, S.H.; Choi, G.E.; Chai, I.I.; Song, E.J.; et al. Regulation of Stem Cell Fate by ROS-mediated Alteration of Metabolism. Int. J. Stem Cells 2015, 8, 24–35. [Google Scholar] [CrossRef] [PubMed] [Green Version]
- Sena, L.A.; Chandel, N.S. Physiological Roles of Mitochondrial Reactive Oxygen Species. Mol. Cell 2012, 48, 158–167. [Google Scholar] [CrossRef] [PubMed] [Green Version]
- Zhang, H.; Gomez, A.M.; Wang, X.; Yan, Y.; Zheng, M.; Cheng, H. ROS regulation of microdomain Ca2+ signalling at the dyads. Cardiovasc. Res. 2013, 98, 248–258. [Google Scholar] [CrossRef] [PubMed] [Green Version]
- Bigarella, C.L.; Liang, R.; Ghaffari, S. Stem cells and the impact of ROS signaling. Development 2014, 141, 4206–4218. [Google Scholar] [CrossRef] [Green Version]
- Rems, L.; Kasimova, M.A.; Testa, I.; Delemotte, L. Pulsed Electric Fields Can Create Pores in the Voltage Sensors of Voltage-Gated Ion Channels. Biophys. J. 2020, 119, 190–205. [Google Scholar] [CrossRef]
- Goswami, I.; Perry, J.B.; Allen, M.E.; Brown, D.A.; von Spakovsky, M.R.; Verbridge, S.S. Influence of Pulsed Electric Fields and Mitochondria-Cytoskeleton Interactions on Cell Respiration. Biophys. J. 2018, 114, 2951–2964. [Google Scholar] [CrossRef] [Green Version]
- Graybill, P.M.; Davalos, R.V. Cytoskeletal Disruption after Electroporation and Its Significance to Pulsed Electric Field Therapies. Cancers 2020, 12, 1132. [Google Scholar] [CrossRef]
- Shi, X.; Zhang, Y.; Zheng, J.; Pan, J. Reactive Oxygen Species in Cancer Stem Cells. Antioxid. Redox Signal. 2012, 16, 1215–1228. [Google Scholar] [CrossRef] [Green Version]
- Jiang, H.; Wang, H.; De Ridder, M. Targeting antioxidant enzymes as a radiosensitizing strategy. Cancer Lett. 2018, 438, 154–164. [Google Scholar] [CrossRef]
- Bartek, J.; Lukas, J. Mammalian G1- and S-phase checkpoints in response to DNA damage. Curr. Opin. Cell Biol. 2001, 13, 738–747. [Google Scholar] [CrossRef]
- Moulder, D.E.; Hatoum, D.; Tay, E.; Lin, Y.; McGowan, E.M. The Roles of p53 in Mitochondrial Dynamics and Cancer Metabolism: The Pendulum between Survival and Death in Breast Cancer? Cancers 2018, 10, 189. [Google Scholar] [CrossRef] [PubMed] [Green Version]
- Montalto, F.I.; De Amicis, F. Cyclin D1 in Cancer: A Molecular Connection for Cell Cycle Control, Adhesion and Invasion in Tumor and Stroma. Cells 2020, 9, 2648. [Google Scholar] [CrossRef] [PubMed]
- Ding, L.; Cao, J.; Lin, W.; Chen, H.; Xiong, X.; Ao, H.; Yu, M.; Lin, J.; Cui, Q. The Roles of Cyclin-Dependent Kinases in Cell-Cycle Progression and Therapeutic Strategies in Human Breast Cancer. Int. J. Mol. Sci. 2020, 21, 1960. [Google Scholar] [CrossRef] [Green Version]
- Moradimotlagh, A.; Moradimotlagh, A.; Arefian, E.; Arefian, E.; Valojerdi, R.R.; Valojerdi, R.R.; Ghaemi, S.; Ghaemi, S.; Adegani, F.J.; Adegani, F.J.; et al. MicroRNA-129 Inhibits Glioma Cell Growth by Targeting CDK4, CDK6, and MDM2. Mol. Ther. Nucleic Acids 2019, 19, 759–764. [Google Scholar] [CrossRef] [PubMed]
- Pandey, K.; Park, N.; Park, K.-S.; Hur, J.; Bin Cho, Y.; Kang, M.; An, H.-J.; Kim, S.; Hwang, S.; Moon, Y.W. Combined CDK2 and CDK4/6 Inhibition Overcomes Palbociclib Resistance in Breast Cancer by Enhancing Senescence. Cancers 2020, 12, 3566. [Google Scholar] [CrossRef]
- Xia, W.; Lo, C.M.; Poon, R.Y.C.; Cheung, T.T.; Chan, A.C.Y.; Chen, L.; Yang, S.; Tsao, G.S.W.; Wang, X.Q. Smad inhibitor induces CSC differentiation for effective chemosensitization in cyclin D1- and TGF-β/Smad-regulated liver cancer stem cell-like cells. Oncotarget 2017, 8, 38811–38824. [Google Scholar] [CrossRef] [PubMed]
- Tamura, R.E.; De Vasconcellos, J.F.; Sarkar, D.; Libermann, T.A.; Fisher, P.B.; Zerbini, L.F. GADD45 Proteins: Central Players in Tumorigenesis. Curr. Mol. Med. 2012, 12, 634–651. [Google Scholar] [CrossRef]
- Wingert, S.; Rieger, M.A. Terminal differentiation induction as DNA damage response in hematopoietic stem cells by GADD45A. Exp. Hematol. 2016, 44, 561–566. [Google Scholar] [CrossRef] [Green Version]
- Beerman, I.; Seita, J.; Inlay, M.A.; Weissman, I.L.; Rossi, D.J. Quiescent Hematopoietic Stem Cells Accumulate DNA Damage during Aging that Is Repaired upon Entry into Cell Cycle. Cell Stem Cell 2014, 15, 37–50. [Google Scholar] [CrossRef] [Green Version]
- Rübe, C.E.; Fricke, A.; Widmann, T.A.; Fürst, T.; Madry, H.; Pfreundschuh, M.; Rübe, C. Accumulation of DNA Damage in Hematopoietic Stem and Progenitor Cells during Human Aging. PLoS ONE 2011, 6, e17487. [Google Scholar] [CrossRef]
- Gupte, A.; Mumper, R.J. Elevated copper and oxidative stress in cancer cells as a target for cancer treatment. Cancer Treat. Rev. 2009, 35, 32–46. [Google Scholar] [CrossRef] [PubMed]
- Santos, M.A.; Faryabi, R.; Ergen, A.V.; Day, A.M.; Malhowski, A.; Canela, A.; Onozawa, M.; Lee, J.-E.; Callen, E.; Gutierrez-Martinez, P.; et al. DNA-damage-induced differentiation of leukaemic cells as an anti-cancer barrier. Nature 2014, 514, 107–111. [Google Scholar] [CrossRef] [PubMed] [Green Version]
- Wang, J.; Sun, Q.; Morita, Y.; Jiang, H.; Groß, A.; Lechel, A.; Hildner, K.; Guachalla, L.M.; Gompf, A.; Hartmann, D.; et al. A Differentiation Checkpoint Limits Hematopoietic Stem Cell Self-Renewal in Response to DNA Damage. Cell 2012, 148, 1001–1014. [Google Scholar] [CrossRef] [Green Version]
- Lin, T.; Chao, C.; Saito, S.; Mazur, S.J.; Murphy, M.; Appella, E.; Xu, Y. p53 induces differentiation of mouse embryonic stem cells by suppressing Nanog expression. Nat. Cell Biol. 2004, 7, 165–171. [Google Scholar] [CrossRef]
- Marqués-Torrejón, M.; Porlan, E.; Banito, A.; Gómez-Ibarlucea, E.; Lopez-Contreras, A.J.; Fernandez-Capetillo, O.; Vidal, A.; Gil, J.; Torres, J.; Fariñas, I. Cyclin-Dependent Kinase Inhibitor p21 Controls Adult Neural Stem Cell Expansion by Regulating Sox2 Gene Expression. Cell Stem Cell 2012, 12, 88–100. [Google Scholar] [CrossRef] [PubMed] [Green Version]
- Covello, K.L.; Kehler, J.; Yu, H.; Gordan, J.D.; Arsham, A.M.; Hu, C.-J.; Labosky, P.A.; Simon, M.C.; Keith, B. HIF-2α regulates Oct-4: Effects of hypoxia on stem cell function, embryonic development, and tumor growth. Genes Dev. 2006, 20, 557–570. [Google Scholar] [CrossRef] [Green Version]
- Das, B.; Pal, B.; Bhuyan, R.; Li, H.; Sarma, A.; Gayan, S.; Talukdar, J.; Sandhya, S.; Bhuyan, S.; Gogoi, G.; et al. MYC Regulates the HIF2α Stemness Pathway via Nanog and Sox2 to Maintain Self-Renewal in Cancer Stem Cells versus Non-Stem Cancer Cells. Cancer Res. 2019, 79, 4015–4025. [Google Scholar] [CrossRef]
- Dang, C.V.; Kim, J.-W.; Gao, P.; Yustein, J. The interplay between MYC and HIF in cancer. Nat. Cancer 2008, 8, 51–56. [Google Scholar] [CrossRef]
- Jain, A.K.; Barton, M.C. p53: Emerging roles in stem cells, development and beyond. Development 2018, 145, dev158360. [Google Scholar] [CrossRef] [Green Version]
- Zhao, T.; Xu, Y. p53 and stem cells: New developments and new concerns. Trends Cell Biol. 2010, 20, 170–175. [Google Scholar] [CrossRef]
- Ferrucci, M.; Biagioni, F.; Lenzi, P.; Gambardella, S.; Ferese, R.; Calierno, M.T.; Falleni, A.; Grimaldi, A.; Frati, A.; Esposito, V.; et al. Rapamycin promotes differentiation increasing βIII-tubulin, NeuN, and NeuroD while suppressing nestin expression in glioblastoma cells. Oncotarget 2017, 8, 29574–29599. [Google Scholar] [CrossRef] [PubMed] [Green Version]
- Ebradshaw, A.; Ewickremesekera, A.; Tan, S.T.; Epeng, L.; Davis, P.F.; Itinteang, T. Cancer Stem Cell Hierarchy in Glioblastoma Multiforme. Front. Surg. 2016, 3, 21. [Google Scholar] [CrossRef] [Green Version]
- Mao, X.-G.; Zhang, X.; Xue, X.-Y.; Guo, G.; Wang, P.; Zhang, W.; Fei, Z.; Zhen, H.-N.; You, S.-W.; Yang, H. Brain Tumor Stem-Like Cells Identified by Neural Stem Cell Marker CD15. Transl. Oncol. 2009, 2, 247–257. [Google Scholar] [CrossRef] [PubMed] [Green Version]
- Han, S.; Huang, T.; Wu, X.; Wang, X.; Liu, S.; Yang, W.; Shi, Q.; Li, H.; Hou, F. Prognostic Value of CD133 and SOX2 in Advanced Cancer. J. Oncol. 2019, 2019, 3905817. [Google Scholar] [CrossRef] [PubMed] [Green Version]
- Sun, Y.; Kong, W.; Falk, A.; Hu, J.; Zhou, L.; Pollard, S.; Smith, A. CD133 (Prominin) Negative Human Neural Stem Cells Are Clonogenic and Tripotent. PLoS ONE 2009, 4, e5498. [Google Scholar] [CrossRef] [Green Version]
- Soltanian, S.; Matin, M.M. Cancer stem cells and cancer therapy. Tumor Biol. 2011, 32, 425–440. [Google Scholar] [CrossRef]
- Leone, D.P.; Relvas, J.; Campos, L.S.; Hemmi, S.; Brakebusch, C.; Fässler, R.; Ffrench-Constant, C.; Suter, U. Regulation of neural progenitor proliferation and survival by β1 integrins. J. Cell Sci. 2005, 118, 2589–2599. [Google Scholar] [CrossRef] [Green Version]
- Tang, Z.; Dokic, I.; Knoll, M.; Ciamarone, F.; Schwager, C.; Klein, C.; Cebulla, G.; Hoffmann, D.C.; Schlegel, J.; Seidel, P.; et al. Radioresistance and Transcriptional Reprograming of Invasive Glioblastoma Cells. Int. J. Radiat. Oncol. 2021, 112, 499–513. [Google Scholar] [CrossRef]
- Frandsen, S.; Gibot, L.; Madi, M.; Gehl, J.; Rols, M.-P. Calcium Electroporation: Evidence for Differential Effects in Normal and Malignant Cell Lines, Evaluated in a 3D Spheroid Model. PLoS ONE 2015, 10, e0144028. [Google Scholar] [CrossRef] [Green Version]
- Davies, I.W.; Merla, C.; Casciati, A.; Tanori, M.; Zambotti, A.; Mancuso, M.; Bishop, J.; White, M.; Palego, C.; Hancock, C.P. Push–pull configuration of high-power MOSFETs for generation of nanosecond pulses for electropermeabilization of cells. Int. J. Microw. Wirel. Technol. 2019, 11, 645–657. [Google Scholar] [CrossRef] [Green Version]
- Tusher, V.G.; Tibshirani, R.; Chu, G. Significance analysis of microarrays applied to the ionizing radiation response. Proc. Natl. Acad. Sci. USA 2001, 98, 5116–5121. [Google Scholar] [CrossRef] [PubMed] [Green Version]
- Gallo-Oller, G.; Rey, J.A.; Dotor, J.; Castresana, J.S. Quantitative method for in vitro matrigel invasiveness measurement through image analysis software. Mol. Biol. Rep. 2014, 41, 6335–6341. [Google Scholar] [CrossRef] [PubMed]


Publisher’s Note: MDPI stays neutral with regard to jurisdictional claims in published maps and institutional affiliations. |
© 2022 by the authors. Licensee MDPI, Basel, Switzerland. This article is an open access article distributed under the terms and conditions of the Creative Commons Attribution (CC BY) license (https://creativecommons.org/licenses/by/4.0/).
Share and Cite
Casciati, A.; Tanori, M.; Gianlorenzi, I.; Rampazzo, E.; Persano, L.; Viola, G.; Cani, A.; Bresolin, S.; Marino, C.; Mancuso, M.; et al. Effects of Ultra-Short Pulsed Electric Field Exposure on Glioblastoma Cells. Int. J. Mol. Sci. 2022, 23, 3001. https://doi.org/10.3390/ijms23063001
Casciati A, Tanori M, Gianlorenzi I, Rampazzo E, Persano L, Viola G, Cani A, Bresolin S, Marino C, Mancuso M, et al. Effects of Ultra-Short Pulsed Electric Field Exposure on Glioblastoma Cells. International Journal of Molecular Sciences. 2022; 23(6):3001. https://doi.org/10.3390/ijms23063001
Chicago/Turabian StyleCasciati, Arianna, Mirella Tanori, Isabella Gianlorenzi, Elena Rampazzo, Luca Persano, Giampietro Viola, Alice Cani, Silvia Bresolin, Carmela Marino, Mariateresa Mancuso, and et al. 2022. "Effects of Ultra-Short Pulsed Electric Field Exposure on Glioblastoma Cells" International Journal of Molecular Sciences 23, no. 6: 3001. https://doi.org/10.3390/ijms23063001