
Stress Reactivity, Susceptibility to Hypertension, and Differential Expression of Genes in Hypertensive Compared to Normotensive Patients

 , , , , and
Abstract
:1. Introduction
2. Results
2.1. RNA-Seq and Mapping to the Reference Rat Genome
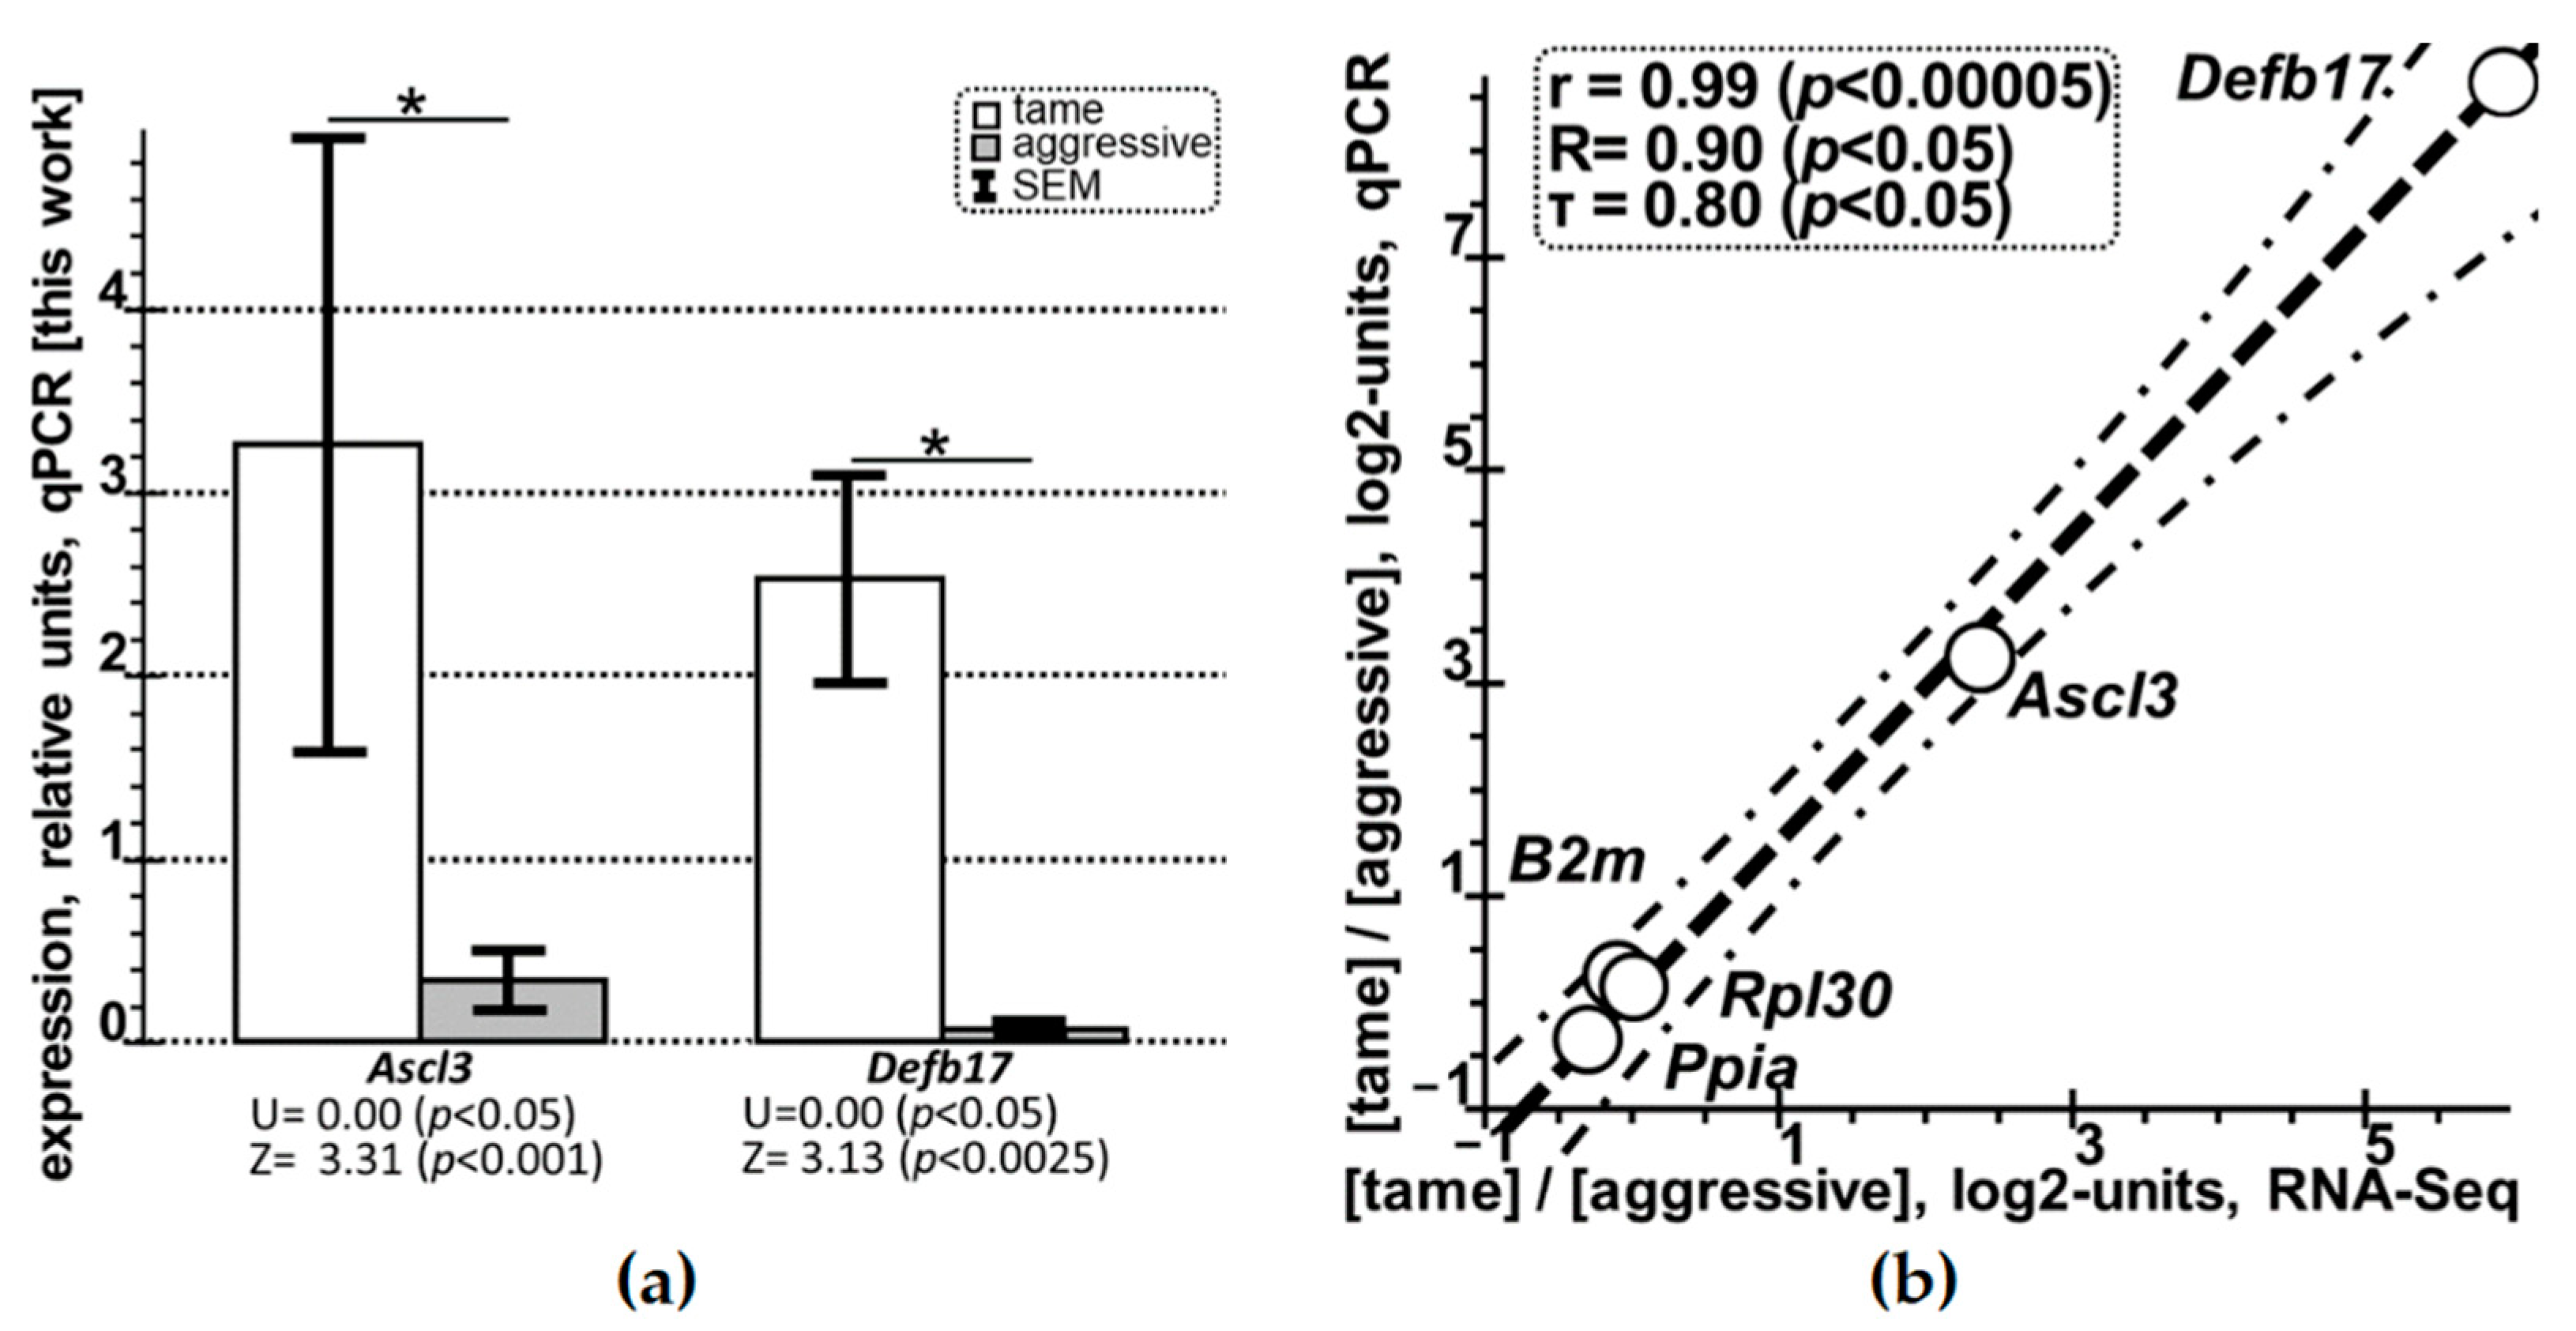
2.2. Quantitative PCR (qPCR)-Based Selective Verification of the DEGs Identified in this Work in the Hippocampus of Tame versus Aggressive Rats
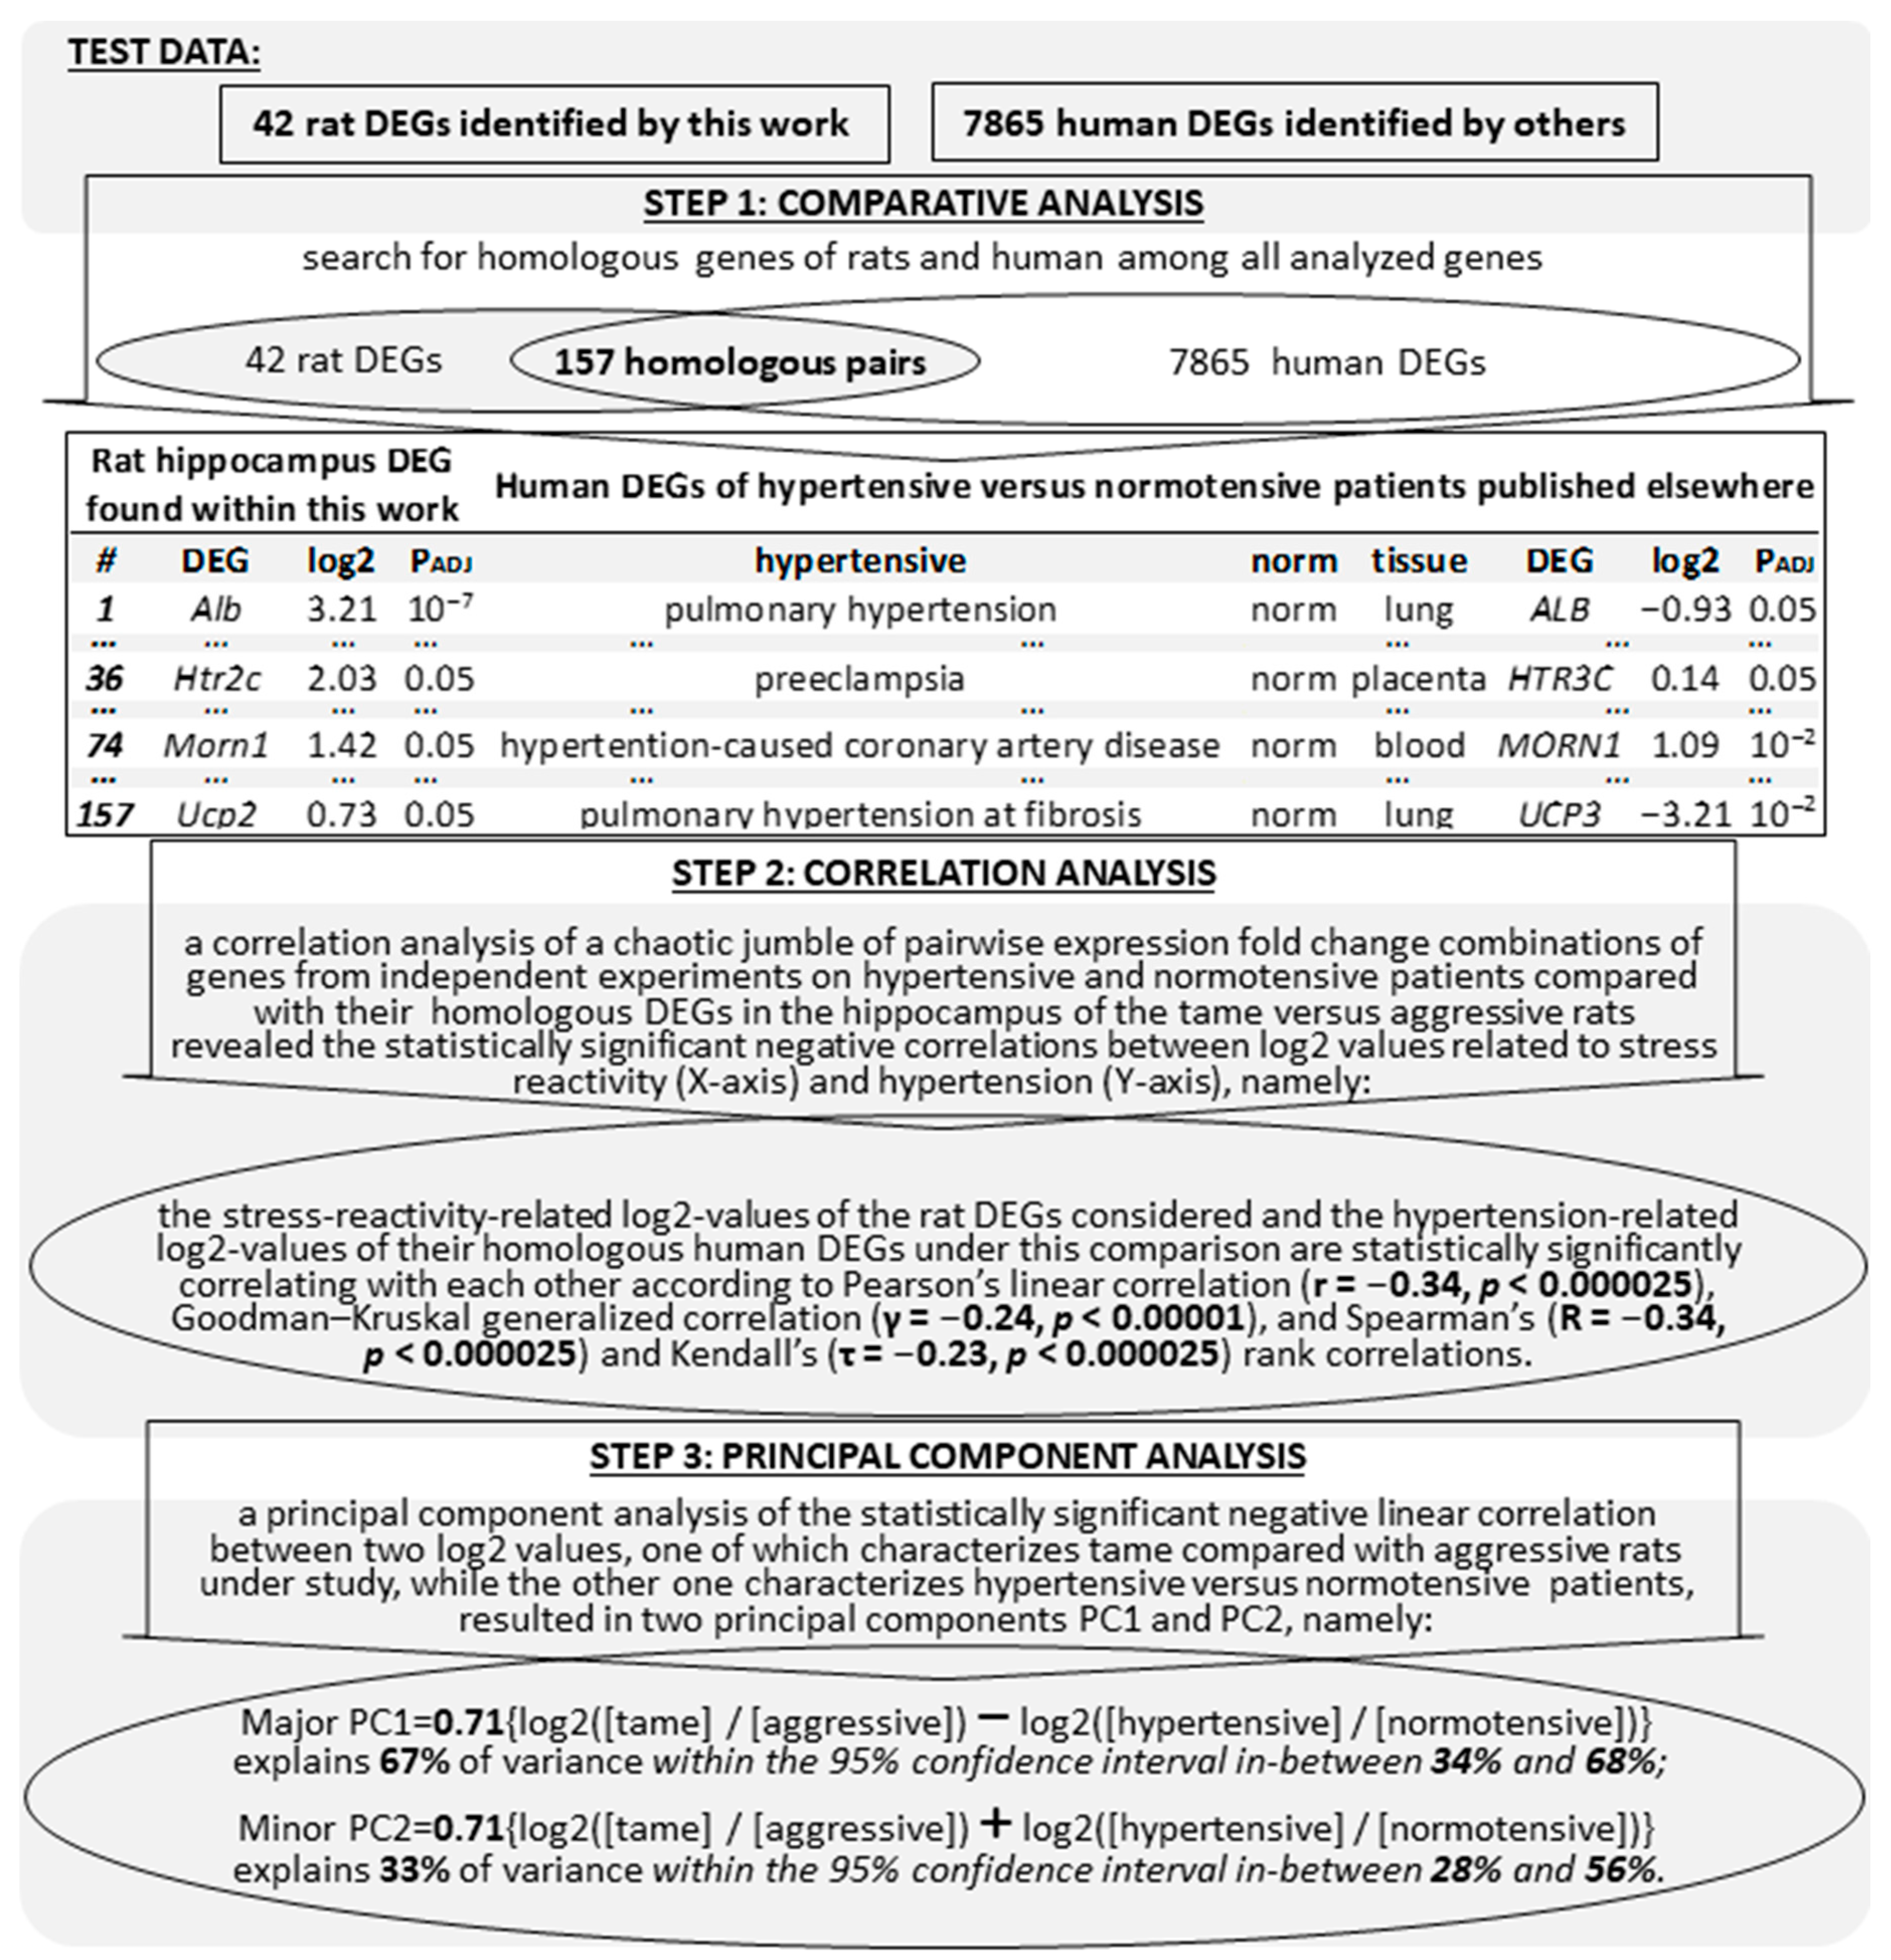
2.3. Comparison of the Known DEGs (of Hypertensive versus Normotensive Animals) with Their Homologous Genes among the 42 Hippocampal DEGs (of Tame versus Aggressive Rats) Identified Here
2.4. Verification of the Results Obtained on the Hypertensive versus Normotensive Animals Examined in this Work with respect to the DEGs—Of Hypertensive versus Normotensive Patients—That We Could Find
2.5. Searching for the Hypertension-Related Molecular Markers among the Human Genes Orthologous to the 42 Hippocampal DEGs (of Tame versus Aggressive Rats) Identified in this Work
2.6. Verification of Downregulation of Human β-Hemoglobin and β-Protocadherins as HypertensionTtheranostic Molecular Markers using the DEGs (That We Could Find) of Domestic versus Wild Animals
3. Discussion
4. Materials and Methods
4.1. Animals
4.2. RNA-Seq
4.3. Mapping of RNA Sequences to the R. norvegicus Reference Genome
4.4. qPCR
4.5. DEGs under Study
4.6. Human Genes under Study
4.7. DNA Sequences under Study
4.8. In Silico Analysis of DNA Sequences
4.9. In Vitro Measurements
4.10. Knowledge Base on Domestic Animals’ DEGs with Orthologous Human Genes that Can Affect Hypertension
4.11. Statistical Analysis
5. Conclusions
Supplementary Materials
Author Contributions
Funding
Institutional Review Board Statement
Informed Consent Statement
Data Availability Statement
Acknowledgments
Conflicts of Interest
Abbreviations
| DEG | differentially expressed gene |
| EMSA | electrophoretic mobility shift assay |
| HT | hypertension |
| log2 value | log2-transformed gene expression fold change |
| PC1 (PC2) | major (minor) principal component |
| qPCR | quantitative polymerase chain reaction |
| RNA-Seq | RNA sequencing |
| SNP | single-nucleotide polymorphism |
| TBP | TATA-binding protein |
References
- Alpsoy, S. Exercise and hypertension. Adv. Exp. Med. Biol. 2020, 1228, 153–167. [Google Scholar] [PubMed]
- Barquera, S.; Pedroza-Tobias, A.; Medina, C.; Hernandez-Barrera, L.; Bibbins-Domingo, K.; Lozano, R.; Moran, A.E. Global overview of the epidemiology of atherosclerotic cardiovascular disease. Arch. Med. Res. 2015, 46, 328–338. [Google Scholar] [CrossRef] [PubMed]
- Meade, R.D.; Akerman, A.P.; Notley, S.R.; McGinn, R.; Poirier, P.; Gosselin, P.; Kenny, G.P. Physiological factors characterizing heat-vulnerable older adults: A narrative review. Environ. Int. 2020, 144, 105909. [Google Scholar] [CrossRef]
- Samanic, C.M.; Barbour, K.E.; Liu, Y.; Wang, Y.; Fang, J.; Lu, H.; Schieb, L.; Greenlund, K.J. Prevalence of self-reported hypertension and antihypertensive medication use by county and rural-urban classification-United States, 2017. MMWR-Morb. Mortal. Wkly. Rep. 2020, 69, 533–539. [Google Scholar] [CrossRef]
- Karaduman, M.; Aparci, M.; Unlu, M.; Ozturk, C.; Balta, S.; Celik, T. Role of screening tests in the detection and management of blood pressure abnormalities among young population. Angiology 2017, 68, 441–446. [Google Scholar] [CrossRef]
- Huang, Q.T.; Chen, J.H.; Hang, L.L.; Liu, S.S.; Zhong, M. Activation of PAR-1/NADPH oxidase/ROS signaling pathways is crucial for the thrombin-induced sFlt-1 production in extravillous trophoblasts: Possible involvement in the pathogenesis of preeclampsia. Cell. Physiol. Biochem. 2015, 35, 1654–1662. [Google Scholar] [CrossRef]
- Tharmalingam, S.; Khurana, S.; Murray, A.; Lamothe, J.; Tai, T.C. Whole transcriptome analysis of adrenal glands from prenatal glucocorticoid programmed hypertensive rodents. Sci. Rep. 2020, 10, 18755. [Google Scholar] [CrossRef] [PubMed]
- Mardenkyzy, D.; Rakhimzhanova, R.; Dautov, T.; Jongmin, L.; Saduakasova, A.; Kozhakhmetova, Z.; Yelshibaeyva, E. Possibilities of computer tomography in the diagnosis of pulmonary hypertension and influence of various factors (gender, age, body weight, reception of medicines) on the severity of the pulmonary hypertension syndrome. Georgian Med. News 2020, 303, 67–72. [Google Scholar]
- Khan, A.W.; Olds, G.; Malik, F.; Teran, P.; Hall, N.; Ali, M. Acute myeloid leukemia masquerading as idiopathic intracranial hypertension: A rare initial presentation. Kans. J. Med. 2021, 14, 133–135. [Google Scholar] [CrossRef]
- Adams-Campbell, L.L.; Taylor, T.; Hicks, J.; Lu, J.; Dash, C. The effect of a 6-month exercise intervention trial on allostatic load in black women at increased risk for breast cancer: The FIERCE study. J. Racial Ethn. Health Disparities 2021. [Google Scholar] [CrossRef] [PubMed]
- Gilard, V.; Ferey, J.; Marguet, F.; Fontanilles, M.; Ducatez, F.; Pilon, C.; Lesueur, C.; Pereira, T.; Basset, C.; Schmitz-Afonso, I.; et al. Integrative metabolomics reveals deep tissue and systemic metabolic remodeling in glioblastoma. Cancers 2021, 13, 5157. [Google Scholar] [CrossRef] [PubMed]
- Cheng, Y.X.; Peng, D.; Tao, W.; Zhang, W. Effect of oncometabolic surgery on gastric cancer: The remission of hypertension, type 2 diabetes mellitus, and beyond. World J. Gastrointest. Oncol. 2021, 13, 1157–1163. [Google Scholar] [CrossRef]
- Palacios, D.A.; Zabor, E.C.; Munoz-Lopez, C.; Roversi, G.; Mahmood, F.; Abramczyk, E.; Kelly, M.; Wilson, B.; Abouassaly, R.; Campbell, S.C. Does reduced renal function predispose to cancer-specific mortality from renal cell carcinoma? Eur. Urol. 2021, 79, 774–780. [Google Scholar] [CrossRef] [PubMed]
- Qi, X.L. Current status and prospects of clinical research on portal hypertension in China. Zhonghua Gan Zang Bing Za Zhi (Chin. J. Hepatol.) 2021, 29, 817–819. [Google Scholar]
- Saltalamacchia, G.; Frascaroli, M.; Bernardo, A.; Quaquarini, E. Renal and cardiovascular toxicities by new systemic treatments for prostate cancer. Cancers 2020, 12, 1750. [Google Scholar] [CrossRef] [PubMed]
- Gu, D.; Fang, D.; Zhang, M.; Guo, J.; Ren, H.; Li, X.; Zhang, Z.; Yang, D.; Zou, X.; Liu, Y.; et al. Gastrin, via activation of PPARα, protects the kidney against hypertensive injury. Clin. Sci. 2021, 135, 409–427. [Google Scholar] [CrossRef]
- Chou, L.M.; Beyer, M.M.; Butt, K.M.; Manis, T.; Friedman, E.A. Hypertension jeopardizes diabetic patients following renal transplant. Trans. Am. Soc. Artif. Intern. Organs 1984, 30, 473–478. [Google Scholar] [PubMed]
- Yousaf, M.; Ayasse, M.; Ahmed, A.; Gwillim, E.C.; Janmohamed, S.R.; Yousaf, A.; Patel, K.R.; Thyssen, J.P.; Silverberg, J.I. Association between atopic dermatitis and hypertension: A systematic review and meta-analysis. Br. J. Dermatol. 2021. [Google Scholar] [CrossRef]
- Lukawski, K.; Czuczwar, S.J. Assessment of drug-drug interactions between moxonidine and antiepileptic drugs in the maximal electroshock seizure test in mice. Basic Clin. Pharmacol. Toxicol. 2021, 130, 28–34. [Google Scholar] [CrossRef] [PubMed]
- Dinc, H.O.; Saltoglu, N.; Can, G.; Balkan, I.I.; Budak, B.; Ozbey, D.; Caglar, B.; Karaali, R.; Mete, B.; Tuyji Tok, Y.; et al. Inactive SARS-CoV-2 vaccine generates high antibody responses in healthcare workers with and without prior infection. Vaccine 2022, 40, 52–58. [Google Scholar] [CrossRef] [PubMed]
- Page, I.H. The Mosaic Theory of arterial hypertension-: Its interpretation. Perspect. Biol. Med. 1967, 10, 325–333. [Google Scholar] [CrossRef] [PubMed]
- Arishe, O.O.; Priviero, F.; Wilczynski, S.A.; Webb, R.C. Exosomes as intercellular messengers in hypertension. Int. J. Mol. Sci. 2021, 22, 11685. [Google Scholar] [CrossRef]
- Turner, A.I.; Smyth, N.; Hall, S.J.; Torres, S.J.; Hussein, M.; Jayasinghe, S.U.; Ball, K.; Clow, A.J. Psychological stress reactivity and future health and disease outcomes: A systematic review of prospective evidence. Psychoneuroendocrinology 2020, 114, 104599. [Google Scholar] [CrossRef] [PubMed]
- Cannon, W.B. The emergency function of the adrenal medulla in pain and the major emotions. Am. J. Physiol. 1914, 33, 356–372. [Google Scholar] [CrossRef]
- Poulter, N.R.; Prabhakaran, D.; Caulfield, M. Hypertension. Lancet 2015, 386, 801–812. [Google Scholar] [CrossRef]
- Wu, Y.B.; Zang, W.D.; Yao, W.Z.; Luo, Y.; Hu, B.; Wang, L.; Liang, Y.L. Analysis of FOS, BTG2, and NR4A in the function of renal medullary hypertension. Genet. Mol. Res. 2013, 12, 3735–3741. [Google Scholar] [CrossRef] [PubMed]
- Qiu, X.; Lin, J.; Liang, B.; Chen, Y.; Liu, G.; Zheng, J. Identification of hub genes and microRNAs associated with idiopathic pulmonary arterial hypertension by integrated bioinformatics analyses. Front. Genet. 2021, 12, 667406. [Google Scholar] [CrossRef] [PubMed]
- Stearman, R.S.; Bui, Q.M.; Speyer, G.; Handen, A.; Cornelius, A.R.; Graham, B.B.; Kim, S.; Mickler, E.A.; Tuder, R.M.; Chan, S.Y.; et al. Systems analysis of the human pulmonary arterial hypertension lung transcriptome. Am. J. Respir. Cell Mol. Biol. 2019, 60, 637–649. [Google Scholar] [CrossRef] [PubMed]
- Li, C.; Zhang, Z.; Xu, Q.; Wu, T.; Shi, R. Potential mechanisms and serum biomarkers involved in sex differences in pulmonary arterial hypertension. Medicine 2020, 99, e19612. [Google Scholar] [CrossRef] [PubMed]
- Yao, X.; Jing, T.; Wang, T.; Gu, C.; Chen, X.; Chen, F.; Feng, H.; Zhao, H.; Chen, D.; Ma, W. Molecular characterization and elucidation of pathways to identify novel therapeutic targets in pulmonary arterial hypertension. Front. Physiol. 2021, 12, 694702. [Google Scholar] [CrossRef]
- Awad, K.S.; Elinoff, J.M.; Wang, S.; Gairhe, S.; Ferreyra, G.A.; Cai, R.; Sun, J.; Solomon, M.A.; Danner, R.L. Raf/ERK drives the proliferative and invasive phenotype of BMPR2-silenced pulmonary artery endothelial cells. Am. J. Physiol. Lung Cell. Mol. Physiol. 2016, 310, L187–L201. [Google Scholar] [CrossRef] [Green Version]
- Saei, H.; Govahi, A.; Abiri, A.; Eghbali, M.; Abiri, M. Comprehensive transcriptome mining identified the gene expression signature and differentially regulated pathways of the late-onset preeclampsia. Pregnancy Hypertens. 2021, 25, 91–102. [Google Scholar] [CrossRef] [PubMed]
- Jung, Y.W.; Shim, J.I.; Shim, S.H.; Shin, Y.J.; Shim, S.H.; Chang, S.W.; Cha, D.H. Global gene expression analysis of cell-free RNA in amniotic fluid from women destined to develop preeclampsia. Medicine 2019, 98, e13971. [Google Scholar] [CrossRef] [PubMed]
- Textoris, J.; Ivorra, D.; Ben Amara, A.; Sabatier, F.; Menard, J.P.; Heckenroth, H.; Bretelle, F.; Mege, J.L. Evaluation of current and new biomarkers in severe preeclampsia: A microarray approach reveals the VSIG4 gene as a potential blood biomarker. PLoS ONE 2013, 8, e82638. [Google Scholar] [CrossRef]
- Yong, H.E.; Melton, P.E.; Johnson, M.P.; Freed, K.A.; Kalionis, B.; Murthi, P.; Brennecke, S.P.; Keogh, R.J.; Moses, E.K. Genome-wide transcriptome directed pathway analysis of maternal pre-eclampsia susceptibility genes. PLoS ONE 2015, 10, e0128230. [Google Scholar] [CrossRef] [PubMed] [Green Version]
- Ahn, S.; Jeong, E.; Min, J.W.; Kim, E.; Choi, S.S.; Kim, C.J.; Lee, D.C. Identification of genes dysregulated by elevation of microRNA-210 levels in human trophoblasts cell line, Swan 71. Am. J. Reprod. Immunol. 2017, 78, e12722. [Google Scholar] [CrossRef]
- Neusser, M.A.; Lindenmeyer, M.T.; Moll, A.G.; Segerer, S.; Edenhofer, I.; Sen, K.; Stiehl, D.P.; Kretzler, M.; Grone, H.J.; Schlondorff, D.; et al. Human nephrosclerosis triggers a hypoxia-related glomerulopathy. Am. J. Pathol. 2010, 176, 594–607. [Google Scholar] [CrossRef] [PubMed] [Green Version]
- Koper, A.; Zeef, L.A.; Joseph, L.; Kerr, K.; Gosney, J.; Lindsay, M.A.; Booton, R. Whole transcriptome analysis of pre-invasive and invasive early squamous lung carcinoma in archival laser microdissected samples. Respir. Res. 2017, 18, 12. [Google Scholar] [CrossRef] [PubMed] [Green Version]
- Zheng, Y.; He, J.Q. Common differentially expressed genes and pathways correlating both coronary artery disease and atrial fibrillation. EXCLI J. 2021, 20, 126–141. [Google Scholar]
- Stefanova, N.A.; Maksimova, K.Y.; Rudnitskaya, E.A.; Muraleva, N.A.; Kolosova, N.G. Association of cerebrovascular dysfunction with the development of Alzheimer’s disease-like pathology in OXYS rats. BMC Genom. 2018, 19, 75. [Google Scholar] [CrossRef] [PubMed]
- Stefanova, N.A.; Ershov, N.I.; Maksimova, K.Y.; Muraleva, N.A.; Tyumentsev, M.A.; Kolosova, N.G. The rat prefrontal-cortex transcriptome: Effects of aging and sporadic Alzheimer’s disease-like pathology. J. Gerontol. A Biol. Sci. Med. Sci. 2019, 74, 33–43. [Google Scholar] [CrossRef]
- Kozhevnikova, O.S.; Korbolina, E.E.; Ershov, N.I.; Kolosova, N.G. Rat retinal transcriptome: Effects of aging and AMD-like retinopathy. Cell Cycle 2013, 12, 1745–1761. [Google Scholar] [CrossRef] [Green Version]
- Fedoseeva, L.A.; Klimov, L.O.; Ershov, N.I.; Efimov, V.M.; Markel, A.L.; Orlov, Y.L.; Redina, O.E. The differences in brain stem transcriptional profiling in hypertensive ISIAH and normotensive WAG rats. BMC Genom. 2019, 20, 297. [Google Scholar] [CrossRef]
- Klimov, L.O.; Ershov, N.I.; Efimov, V.M.; Markel, A.L.; Redina, O.E. Genome-wide transcriptome analysis of hypothalamus in rats with inherited stress-induced arterial hypertension. BMC Genet. 2016, 17, 13. [Google Scholar] [CrossRef] [Green Version]
- Ryazanova, M.A.; Fedoseeva, L.A.; Ershov, N.I.; Efimov, V.M.; Markel, A.L.; Redina, O.E. The gene-expression profile of renal medulla in ISIAH rats with inherited stress-induced arterial hypertension. BMC Genet. 2016, 17 (Suppl. S3), 151. [Google Scholar] [CrossRef] [Green Version]
- Fedoseeva, L.A.; Ryazanova, M.A.; Ershov, N.I.; Markel, A.L.; Redina, O.E. Comparative transcriptional profiling of renal cortex in rats with inherited stress-induced arterial hypertension and normotensive Wistar Albino Glaxo rats. BMC Genet. 2016, 17 (Suppl. S1), 12. [Google Scholar] [CrossRef] [PubMed] [Green Version]
- Fedoseeva, L.A.; Klimov, L.O.; Ershov, N.I.; Alexandrovich, Y.V.; Efimov, V.M.; Markel, A.L.; Redina, O.E. Molecular determinants of the adrenal gland functioning related to stress-sensitive hypertension in ISIAH rats. BMC Genom. 2016, 17, 989. [Google Scholar] [CrossRef] [PubMed] [Green Version]
- Yuan, X.; Wu, Q.; Liu, X.; Zhang, H.; Xiu, R. Transcriptomic profile analysis of brain microvascular pericytes in spontaneously hypertensive rats by RNA-Seq. Am. J. Transl. Res. 2018, 10, 2372–2386. [Google Scholar] [PubMed]
- Watanabe, Y.; Yoshida, M.; Yamanishi, K.; Yamamoto, H.; Okuzaki, D.; Nojima, H.; Yasunaga, T.; Okamura, H.; Matsunaga, H.; Yamanishi, H. Genetic analysis of genes causing hypertension and stroke in spontaneously hypertensive rats: Gene expression profiles in the kidneys. Int. J. Mol. Med. 2015, 36, 712–724. [Google Scholar] [CrossRef] [PubMed] [Green Version]
- Xiao, G.; Wang, T.; Zhuang, W.; Ye, C.; Luo, L.; Wang, H.; Lian, G.; Xie, L. RNA sequencing analysis of monocrotaline-induced PAH reveals dysregulated chemokine and neuroactive ligand receptor pathways. Aging 2020, 12, 4953–4969. [Google Scholar] [CrossRef] [PubMed]
- Du, H.; Xiao, G.; Xue, Z.; Li, Z.; He, S.; Du, X.; Zhou, Z.; Cao, L.; Wang, Y.; Yang, J.; et al. QiShenYiQi ameliorates salt-induced hypertensive nephropathy by balancing ADRA1D and SIK1 expression in Dahl salt-sensitive rats. Biomed. Pharmacother. 2021, 141, 111941. [Google Scholar] [CrossRef] [PubMed]
- Ashraf, U.M.; Mell, B.; Jose, P.A.; Kumarasamy, S. Deep transcriptomic profiling of Dahl salt-sensitive rat kidneys with mutant form of Resp18. Biochem. Biophys. Res. Commun. 2021, 572, 35–40. [Google Scholar] [CrossRef] [PubMed]
- Zhou, X.; Zhang, X.X.; Mahmmod, Y.S.; Hernandez, J.A.; Li, G.F.; Huang, W.Y.; Wang, Y.P.; Zheng, Y.X.; Li, X.M.; Yuan, Z.G. A Transcriptome analysis: Various reasons of adverse pregnancy outcomes caused by acute toxoplasma gondii infection. Front. Physiol. 2020, 11, 115. [Google Scholar] [CrossRef] [Green Version]
- Puig, O.; Wang, I.M.; Cheng, P.; Zhou, P.; Roy, S.; Cully, D.; Peters, M.; Benita, Y.; Thompson, J.; Cai, T.Q. Transcriptome profiling and network analysis of genetically hypertensive mice identifies potential pharmacological targets of hypertension. Physiol. Genom. 2010, 42A, 24–32. [Google Scholar] [CrossRef] [PubMed] [Green Version]
- Loke, S.Y.; Wong, P.T.; Ong, W.Y. Global gene expression changes in the prefrontal cortex of rabbits with hypercholesterolemia and/or hypertension. Neurochem. Int. 2017, 102, 33–56. [Google Scholar] [CrossRef] [PubMed]
- Park, W.; Rengaraj, D.; Kil, D.Y.; Kim, H.; Lee, H.K.; Song, K.D. RNA-seq analysis of the kidneys of broiler chickens fed diets containing different concentrations of calcium. Sci. Rep. 2017, 7, 11740. [Google Scholar] [CrossRef]
- Yang, F.; Cao, H.; Xiao, Q.; Guo, X.; Zhuang, Y.; Zhang, C.; Wang, T.; Lin, H.; Song, Y.; Hu, G.; et al. Transcriptome analysis and gene identification in the pulmonary artery of broilers with ascites syndrome. PLoS ONE 2016, 11, e0156045. [Google Scholar] [CrossRef] [PubMed]
- Trovato, G.M. Sustainable medical research by effective and comprehensive medical skills: Overcoming the frontiers by predictive, preventive and personalized medicine. EPMA J. 2014, 5, 14. [Google Scholar] [CrossRef] [PubMed] [Green Version]
- Osadchuk, A.V.; Markel, A.L.; Khusainov, R.A.; Naumenko, E.V.; Beliaev, D.K. Problems in the genetics of stress. IV. A genetic analysis of the level of autonomic reactivity in emotional stress in rats. Sov. Genet. 1979, 15, 1847–1857. [Google Scholar]
- Markel, A.L. Features of the behavior of the rat with hereditarily determined arterial hypertension. Zhurnal Vyss. Nervn. Deiatelnosti Im. IP Pavlov. 1986, 36, 956–962. [Google Scholar]
- Herbek, Y.E.; Zakharov, I.K.; Trapezov, O.V.; Shumny, V.K. Evolution compressed in time. Philos. Sci. 2013, 1, 115–139. [Google Scholar]
- Oskina, I.N.; Herbeck, Y.E.; Shikhevich, S.G.; Plyusnina, I.Z.; Gulevich, R.G. Alterations in the hypothalamus-pituitary-adrenal and immune systems during selection of animals for tame behavior. Inf. Bull. VOGiS 2008, 12, 39–49. [Google Scholar]
- Prasolova, L.A.; Gerbek, Y.E.; Gulevich, R.G.; Shikhevich, S.G.; Konoshenko, M.Y.; Kozhemyakina, R.V.; Oskina, I.N.; Plyusnina, I.Z. The effects of prolonged selection for behavior on the stress response and activity of the reproductive system of male grey mice (Rattus norvegicus). Russ. J. Genet. 2014, 50, 846–852. [Google Scholar] [CrossRef]
- Belyaev, D.K.; Borodin, P.M. The influence of stress on variation and its role in evolution. Biol. Zent. 1982, 100, 705–714. [Google Scholar]
- Kolosova, N.G.; Stefanova, N.A.; Korbolina, E.E.; Fursova, A.Z.; Kozhevnikova, O.S. Senescence-accelerated OXYS rats: A genetic model of premature aging and age-related diseases. Adv. Gerontol. 2014, 27, 336–340. [Google Scholar] [CrossRef]
- Stefanova, N.A.; Kozhevnikova, O.S.; Vitovtov, A.O.; Maksimova, K.Y.; Logvinov, S.V.; Rudnitskaya, E.A.; Korbolina, E.E.; Muraleva, N.A.; Kolosova, N.G. Senescence-accelerated OXYS rats: A model of age-related cognitive decline with relevance to abnormalities in Alzheimer disease. Cell Cycle 2014, 13, 898–909. [Google Scholar] [CrossRef] [PubMed] [Green Version]
- Devyatkin, V.A.; Redina, O.E.; Muraleva, N.A.; Kolosova, N.G. Single-nucleotide polymorphisms (SNPs) both associated with hypertension and contributing to accelerated-senescence traits in OXYS rats. Int. J. Mol. Sci. 2020, 21, 3542. [Google Scholar] [CrossRef] [PubMed]
- Devyatkin, V.A.; Redina, O.E.; Kolosova, N.G.; Muraleva, N.A. Single-nucleotide polymorphisms associated with the senescence-accelerated phenotype of OXYS rats: A focus on Alzheimer’s disease-like and age-related-macular-degeneration-like pathologies. J. Alzheimer’s Dis. 2020, 73, 1167–1183. [Google Scholar] [CrossRef] [PubMed]
- Lu, Z. PubMed and beyond: A survey of web tools for searching biomedical literature. Database 2011, 2011, baq036. [Google Scholar] [CrossRef] [PubMed] [Green Version]
- Vasiliev, G.; Chadaeva, I.; Rasskazov, D.; Ponomarenko, P.; Sharypova, E.; Drachkova, I.; Bogomolov, A.; Savinkova, L.; Ponomarenko, M.; Kolchanov, N.; et al. A bioinformatics model of human diseases on the basis of differentially expressed genes (of domestic versus wild animals) that are orthologs of human genes associated with reproductive-potential changes. Int. J. Mol. Sci. 2021, 22, 2346. [Google Scholar] [CrossRef] [PubMed]
- Klimova, N.V.; Oshchepkova, E.; Chadaeva, I.; Sharypova, E.; Ponomarenko, P.; Drachkova, I.; Rasskazov, D.; Oshchepkov, D.; Ponomarenko, M.; Savinkova, L.; et al. Disruptive selection of human immunostimulatory and immunosuppressive genes both provokes and prevents rheumatoid arthritis, respectively, as a self-domestication syndrome. Front. Genet. 2021, 12, 610774. [Google Scholar] [CrossRef] [PubMed]
- Chadaeva, I.; Ponomarenko, P.; Kozhemyakina, R.; Suslov, V.; Bogomolov, A.; Klimova, N.; Shikhevich, S.; Savinkova, L.; Oshchepkov, D.; Kolchanov, N.A.; et al. Domestication explains two-thirds of differential-gene-expression variance between domestic and wild animals; the remaining one-third reflects intraspecific and interspecific variation. Animals 2021, 11, 2667. [Google Scholar] [CrossRef] [PubMed]
- Hecht, K.; Hai, N.V.; Hecht, T.; Moritz, V.; Woossmann, H. Correlations between hippocampus function and stressed learning and their effect on cerebro-visceral regulation processes. Acta Biol. Med. Ger. 1976, 35, 35–45. [Google Scholar] [PubMed]
- Plyusnina, I.; Oskina, I. Behavioral and adrenocortical responses to open-field test in rats selected for reduced aggressiveness toward humans. Physiol. Behav. 1997, 61, 381–385. [Google Scholar] [CrossRef]
- Sayers, E.W.; Beck, J.; Bolton, E.E.; Bourexis, D.; Brister, J.R.; Canese, K.; Comeau, D.C.; Funk, K.; Kim, S.; Klimke, W.; et al. Database resources of the National Center for Biotechnology Information. Nucleic Acids Res. 2021, 49, D10–D17. [Google Scholar] [CrossRef]
- Bustin, S.A.; Benes, V.; Garson, J.A.; Hellemans, J.; Huggett, J.; Kubista, M.; Mueller, R.; Nolan, T.; Pfaffl, M.W.; Shipley, G.L.; et al. The MIQE guidelines: Minimum information for publication of quantitative real-time PCR experiments. Clin. Chem. 2009, 55, 611–622. [Google Scholar] [CrossRef] [PubMed] [Green Version]
- Hammer, O.; Harper, D.A.T.; Ryan, P.D. PAST: Paleontological statistics software package for education and data analysis. Palaeontol. Electron. 2001, 4, 1–9. [Google Scholar]
- McNeil, J.B.; Jackson, K.E.; Wang, C.; Siew, E.D.; Vincz, A.J.; Shaver, C.M.; Bastarache, J.A.; Ware, L.B. Linear association between hypoalbuminemia and increased risk of acute respiratory distress syndrome in critically ill adults. Crit Care Explor. 2021, 3, e0527. [Google Scholar] [CrossRef]
- Facciorusso, A.; Nacchiero, M.C.; Rosania, R.; Laonigro, G.; Longo, N.; Panella, C.; Ierardi, E. The use of human albumin for the treatment of ascites in patients with liver cirrhosis: Item of safety, facts, controversies and perspectives. Curr. Drug Saf. 2011, 6, 267–274. [Google Scholar] [CrossRef] [PubMed]
- Vassiliou, A.G.; Keskinidou, C.; Kotanidou, A.; Frantzeskaki, F.; Dimopoulou, I.; Langleben, D.; Orfanos, S.E. Knockdown of bone morphogenetic protein type II receptor leads to decreased aquaporin 1 expression and function in human pulmonary microvascular endothelial cells. Can. J. Physiol. Pharmacol. 2020, 98, 834–839. [Google Scholar] [CrossRef] [PubMed]
- Schuoler, C.; Haider, T.J.; Leuenberger, C.; Vogel, J.; Ostergaard, L.; Kwapiszewska, G.; Kohler, M.; Gassmann, M.; Huber, L.C.; Brock, M. Aquaporin 1 controls the functional phenotype of pulmonary smooth muscle cells in hypoxia-induced pulmonary hypertension. Basic Res. Cardiol. 2017, 112, 30. [Google Scholar] [CrossRef] [PubMed] [Green Version]
- Wang, C.Y.; Shahi, P.; Huang, J.T.; Phan, N.N.; Sun, Z.; Lin, Y.C.; Lai, M.D.; Werb, Z. Systematic analysis of the achaete-scute complex-like gene signature in clinical cancer patients. Mol. Clin. Oncol. 2017, 6, 7–18. [Google Scholar] [CrossRef] [PubMed] [Green Version]
- Martin, T.G.; Tawfik, S.; Moravec, C.S.; Pak, T.R.; Kirk, J.A. BAG3 expression and sarcomere localization in the human heart are linked to HSF-1 and are differentially affected by sex and disease. Am. J. Physiol. Heart Circ. Physiol. 2021, 320, H2339–H2350. [Google Scholar] [CrossRef] [PubMed]
- Derosa, G.; Maffioli, P.; Rosati, A.; Basile, A.; D’Angelo, A.; Romano, D.; Sahebkar, A.; Falco, A.; Turco, M.C. Evaluation of BAG3 levels in healthy subjects, hypertensive patients, and hypertensive diabetic patients. J. Cell. Physiol. 2018, 3, 1791–1795. [Google Scholar] [CrossRef]
- Wang, Y.P.; Huang, L.Y.; Sun, W.M.; Zhang, Z.Z.; Fang, J.Z.; Wei, B.F.; Wu, B.H.; Han, Z.G. Insulin receptor tyrosine kinase substrate activates EGFR/ERK signalling pathway and promotes cell proliferation of hepatocellular carcinoma. Cancer Lett. 2013, 337, 96–106. [Google Scholar] [CrossRef] [PubMed]
- Park, J.S.; Pierorazio, P.M.; Lee, J.H.; Lee, H.J.; Lim, Y.S.; Jang, W.S.; Kim, J.; Lee, S.H.; Rha, K.H.; Cho, N.H.; et al. Gene expression analysis of aggressive clinical T1 stage clear cell renal cell carcinoma for identifying potential diagnostic and prognostic biomarkers. Cancers 2020, 12, 222. [Google Scholar] [CrossRef] [Green Version]
- Stojanovic, M.; Goldner, B.; Ivkovic, D. Renal cell carcinoma and arterial hypertension. Clin. Exp. Nephrol. 2009, 13, 295–299. [Google Scholar] [CrossRef]
- Han, F.; Zhao, H.; Lu, J.; Yun, W.; Yang, L.; Lou, Y.; Su, D.; Chen, X.; Zhang, S.; Jin, H.; et al. Anti-Tumor effects of BDH1 in acute myeloid leukemia. Front. Oncol. 2021, 11, 694594. [Google Scholar] [CrossRef]
- Camerino, M.; Giacobino, D.; Manassero, L.; Iussich, S.; Riccardo, F.; Cavallo, F.; Tarone, L.; Olimpo, M.; Lardone, E.; Martano, M.; et al. Prognostic impact of bone invasion in canine oral malignant melanoma treated by surgery and anti-CSPG4 vaccination: A retrospective study on 68 cases (2010–2020). Vet. Comp. Oncol. 2021, 20, 189–197. [Google Scholar] [CrossRef]
- El-Qushayri, A.E.; Benmelouka, A.Y.; Salman, S.; Nardone, B. Melanoma and hypertension, is there an association? A U.S. population based study. Ital. J. Dermatol. Venerol. 2021. [Google Scholar] [CrossRef]
- Damour, A.; Garcia, M.; Seneschal, J.; Leveque, N.; Bodet, C. Eczema herpeticum: Clinical and pathophysiological aspects. Clin. Rev. Allergy Immunol. 2020, 59, 1–18. [Google Scholar] [CrossRef] [PubMed]
- Ohtani, M.; Nishimura, T. Sulfur-containing amino acids in aged garlic extract inhibit inflammation in human gingival epithelial cells by suppressing intercellular adhesion molecule-1 expression and IL-6 secretion. Biomed. Rep. 2020, 12, 99–108. [Google Scholar] [CrossRef] [PubMed] [Green Version]
- Liu, R.; Zhang, Z.; Liu, H.; Hou, P.; Lang, J.; Wang, S.; Yan, H.; Li, P.; Huang, Z.; Wu, H.; et al. Human β-defensin 2 is a novel opener of Ca2+-activated potassium channels and induces vasodilation and hypotension in monkeys. Hypertension 2013, 62, 415–425. [Google Scholar] [CrossRef] [PubMed] [Green Version]
- He, L.; Yang, Y.; Chen, J.; Zou, P.; Li, J. Transcriptional activation of ENPP2 by FoxO4 protects cardiomyocytes from doxorubicin-induced toxicity. Mol. Med. Rep. 2021, 24, 668. [Google Scholar] [CrossRef]
- Matsumura, N.; Zordoky, B.N.; Robertson, I.M.; Hamza, S.M.; Parajuli, N.; Soltys, C.M.; Beker, D.L.; Grant, M.K.; Razzoli, M.; Bartolomucci, A.; et al. Co-administration of resveratrol with doxorubicin in young mice attenuates detrimental late-occurring cardiovascular changes. Cardiovasc. Res. 2018, 114, 1350–1359. [Google Scholar] [CrossRef] [PubMed]
- Xu, X.Y.; Guo, W.J.; Pan, S.H.; Zhang, Y.; Gao, F.L.; Wang, J.T.; Zhang, S.; Li, H.Y.; Wang, R.; Zhang, X. TILRR (FREM1 isoform 2) is a prognostic biomarker correlated with immune infiltration in breast cancer. Aging 2020, 12, 19335–19351. [Google Scholar] [CrossRef]
- Li, H.N.; Li, X.R.; Lv, Z.T.; Cai, M.M.; Wang, G.; Yang, Z.F. Elevated expression of FREM1 in breast cancer indicates favorable prognosis and high-level immune infiltration status. Cancer Med. 2020, 9, 9554–9570. [Google Scholar] [CrossRef]
- Wang, S.; Zhu, G.; Jiang, D.; Rhen, J.; Li, X.; Liu, H.; Lyu, Y.; Tsai, P.; Rose, Y.; Nguyen, T.; et al. Reduced Notch1 cleavage promotes the development of pulmonary hypertension. Hypertension 2021, 79, 79–92. [Google Scholar] [CrossRef]
- Zhou, C.; Yu, J.; Wang, M.; Yang, J.; Xiong, H.; Huang, H.; Wu, D.; Hu, S.; Wang, Y.; Chen, X.Z.; et al. Identification of glycerol-3-phosphate dehydrogenase 1 as a tumour suppressor in human breast cancer. Oncotarget 2017, 8, 101309–101324. [Google Scholar] [CrossRef] [Green Version]
- Azad, G.K.; Singh, V.; Thakare, M.J.; Baranwal, S.; Tomar, R.S. Mitogen-activated protein kinase Hog1 is activated in response to curcumin exposure in the budding yeast Saccharomyces cerevisiae. BMC Microbiol. 2014, 14, 317. [Google Scholar] [CrossRef] [Green Version]
- Kim, Y.B.; Kim, Y.S.; Kim, W.B.; Shen, F.Y.; Lee, S.W.; Chung, H.J.; Kim, J.S.; Han, H.C.; Colwell, C.S.; Kim, Y.I. GABAergic excitation of vasopressin neurons: Possible mechanism underlying sodium-dependent hypertension. Circ. Res. 2013, 113, 1296–1307. [Google Scholar] [CrossRef] [Green Version]
- Triantafyllou, A.I.; Vyssoulis, G.P.; Karpanou, E.A.; Karkalousos, P.L.; Triantafyllou, E.A.; Aessopos, A.; Farmakis, D.T. Impact of β-thalassemia trait carrier state on cardiovascular risk factors and metabolic profile in patients with newly diagnosed hypertension. J. Hum. Hypertens. 2014, 28, 328–332. [Google Scholar] [CrossRef] [PubMed]
- Zheng, H.; Wei, X.C.; Yu, T.; Lei, Q. Anesthesia of a high-altitude area inhabitant who underwent aortic dissection emergency surgery in a low-altitude area. J. Int. Med. Res. 2020, 48, 300060520979871. [Google Scholar] [CrossRef] [PubMed]
- Chen, M.; Li, M.H.; Zhang, N.; Sun, W.W.; Wang, H.; Wang, Y.A.; Zhao, Y.; Wei, W. Pro-angiogenic effect of exosomal microRNA-103a in mice with rheumatoid arthritis via the downregulation of hepatocyte nuclear factor 4 alpha and activation of the JAK/STAT3 signaling pathway. J. Biol. Regul. Homeost Agents 2021, 35, 629–640. [Google Scholar] [PubMed]
- Argnani, L.; Zanetti, A.; Carrara, G.; Silvagni, E.; Guerrini, G.; Zambon, A.; Scire, C.A. Rheumatoid arthritis and cardiovascular risk: Retrospective matched-cohort analysis based on the RECORD study of the italian society for rheumatology. Front. Med. 2021, 8, 745601. [Google Scholar] [CrossRef] [PubMed]
- Ni, Z.; Lu, W.; Li, Q.; Han, C.; Yuan, T.; Sun, N.; Shi, Y. Analysis of the HNF4A isoform-regulated transcriptome identifies CCL15 as a downstream target in gastric carcinogenesis. Cancer Biol. Med. 2021, 18, 530–546. [Google Scholar] [CrossRef] [PubMed]
- Sejourne, J.; Llaneza, D.; Kuti, O.J.; Page, D.T. Social behavioral deficits coincide with the onset of seizure susceptibility in mice lacking serotonin receptor 2c. PLoS ONE 2015, 10, e0136494. [Google Scholar] [CrossRef] [PubMed] [Green Version]
- Veeramachaneni, G.K.; Thunuguntla, V.B.S.C.; Bhaswant, M.; Mathai, M.L.; Bondili, J.S. Pharmacophore directed screening of agonistic natural molecules showing affinity to 5HT2C receptor. Biomolecules 2019, 9, 556. [Google Scholar] [CrossRef] [PubMed] [Green Version]
- Kelm-Nelson, C.A.; Gammie, S. Gene expression within the periaqueductal gray is linked to vocal behavior and early-onset parkinsonism in Pink1 knockout rats. BMC Genom. 2020, 21, 625. [Google Scholar] [CrossRef]
- Shin, N.Y.; Park, Y.W.; Yoo, S.W.; Yoo, J.Y.; Choi, Y.; Jang, J.; Ahn, K.J.; Kim, B.S.; Kim, J.S. Adverse effects of hypertension, supine hypertension, and perivascular space on cognition and motor function in PD. NPJ Parkinsons Dis. 2021, 7, 69. [Google Scholar] [CrossRef] [PubMed]
- Zhao, Z.L.; Du, S.; Shen, S.X.; Luo, P.; Ding, S.K.; Wang, G.G.; Wang, L.X. Biomarkers screening for viral myocarditis through proteomics analysis of plasma exosomes. Zhonghua Yi Xue Za Zhi (Chin. Med. J.) 2019, 99, 343–348. [Google Scholar]
- Fox, S.E.; Falgout, L.; Vander Heide, R.S. COVID-19 myocarditis: Quantitative analysis of the inflammatory infiltrate and a proposed mechanism. Cardiovasc. Pathol. 2021, 54, 107361. [Google Scholar] [CrossRef] [PubMed]
- Karo-Atar, D.; Moshkovits, I.; Eickelberg, O.; Konigshoff, M.; Munitz, A. Paired immunoglobulin-like receptor-B inhibits pulmonary fibrosis by suppressing profibrogenic properties of alveolar macrophages. Am. J. Respir. Cell Mol. Biol. 2013, 48, 456–464. [Google Scholar] [CrossRef] [PubMed]
- Huang, J.; Burke, P.S.; Cung, T.D.; Pereyra, F.; Toth, I.; Walker, B.D.; Borges, L.; Lichterfeld, M.; Yu, X.G. Leukocyte immunoglobulin-like receptors maintain unique antigen-presenting properties of circulating myeloid dendritic cells in HIV-1-infected elite controllers. J. Virol. 2010, 84, 9463–9471. [Google Scholar] [CrossRef] [Green Version]
- Kumar, A.; Mahajan, A.; Salazar, E.A.; Pruitt, K.; Guzman, C.A.; Clauss, M.A.; Almodovar, S.; Dhillon, N.K. Impact of human immunodeficiency virus on pulmonary vascular disease. Glob. Cardiol. Sci. Pract. 2021, 2021, e202112. [Google Scholar] [CrossRef]
- Sakamoto, S.; Matsuura, K.; Masuda, S.; Hagiwara, N.; Shimizu, T. Heart-derived fibroblasts express LYPD-1 and negatively regulate angiogenesis in rat. Regen. Ther. 2020, 15, 27–33. [Google Scholar] [CrossRef]
- Kumar, N.; Verma, R.; Lohana, P.; Lohana, A.; Ramphul, K. Acute myocardial infarction in COVID-19 patients. A review of cases in the literature. Arch. Med. Sci. Atheroscler Dis. 2021, 6, e169–e175. [Google Scholar] [CrossRef]
- Matsushita, Y.; Furukawa, T.; Kasanuki, H.; Nishibatake, M.; Kurihara, Y.; Ikeda, A.; Kamatani, N.; Takeshima, H.; Matsuoka, R. Mutation of junctophilin type 2 associated with hypertrophic cardiomyopathy. J. Hum. Genet. 2007, 52, 543–548. [Google Scholar] [CrossRef]
- Sridharan, A.; Maron, M.S.; Carrick, R.T.; Madias, C.A.; Huang, D.; Cooper, C.; Drummond, J.; Maron, B.J.; Rowin, E.J. Impact of comorbidities on atrial fibrillation and sudden cardiac death in hypertrophic cardiomyopathy. J. Cardiovasc. Electrophysiol. 2021, 33, 20–29. [Google Scholar] [CrossRef]
- Rozanski, A.; Takano, A.P.; Kato, P.N.; Soares, A.G.; Lellis-Santos, C.; Campos, J.C.; Ferreira, J.C.; Barreto-Chaves, M.L.; Moriscot, A.S. M-protein is down-regulated in cardiac hypertrophy driven by thyroid hormone in rats. Mol. Endocrinol. 2013, 27, 2055–2065. [Google Scholar] [CrossRef] [PubMed] [Green Version]
- Grabowski, K.; Herlan, L.; Witten, A.; Qadri, F.; Eisenreich, A.; Lindner, D.; Schadlich, M.; Schulz, A.; Subrova, J.; Mhatre, K.N.; et al. Cpxm2 as a novel candidate for cardiac hypertrophy and failure in hypertension. Hypertens. Res. 2021, 45, 292–307. [Google Scholar] [CrossRef] [PubMed]
- Zeng, Y.; Du, X.; Yao, X.; Qiu, Y.; Jiang, W.; Shen, J.; Li, L.; Liu, X. Mechanism of cell death of endothelial cells regulated by mechanical forces. J. Biomech. 2021, 131, 110917. [Google Scholar] [CrossRef] [PubMed]
- Ashton, K.J.; Tupicoff, A.; Williams-Pritchard, G.; Kiessling, C.J.; See Hoe, L.E.; Headrick, J.P.; Peart, J.N. Unique transcriptional profile of sustained ligand-activated preconditioning in pre- and post-ischemic myocardium. PLoS ONE 2013, 8, e72278. [Google Scholar] [CrossRef] [PubMed] [Green Version]
- Sekino, Y.; Oue, N.; Mukai, S.; Shigematsu, Y.; Goto, K.; Sakamoto, N.; Sentani, K.; Hayashi, T.; Teishima, J.; Matsubara, A.; et al. Protocadherin B9 promotes resistance to bicalutamide and is associated with the survival of prostate cancer patients. Prostate 2019, 79, 234–242. [Google Scholar] [CrossRef]
- Gabbert, L.; Dilling, C.; Meybohm, P.; Burek, M. Deletion of protocadherin gamma C3 induces phenotypic and functional changes in brain microvascular endothelial cells in vitro. Front. Pharmacol. 2020, 11, 590144. [Google Scholar] [CrossRef]
- Wang, H.L.; Zhang, C.L.; Qiu, Y.M.; Chen, A.Q.; Li, Y.N.; Hu, B. Dysfunction of the blood-brain barrier in cerebral microbleeds: From bedside to bench. Aging Dis. 2021, 12, 1898–1919. [Google Scholar] [CrossRef]
- Du, J.; Dong, Y.; Li, Y. Identification and prognostic value exploration of cyclophosphamide (cytoxan)-centered chemotherapy response-associated genes in breast cancer. DNA Cell Biol. 2021, 40, 1356–1368. [Google Scholar] [CrossRef]
- Bloodgood, D.W.; Hardaway, J.A.; Stanhope, C.M.; Pati, D.; Pina, M.M.; Neira, S.; Desai, S.; Boyt, K.M.; Palmiter, R.D.; Kash, T.L. Kappa opioid receptor and dynorphin signaling in the central amygdala regulates alcohol intake. Mol. Psychiatry 2021, 26, 2187–2199. [Google Scholar] [CrossRef]
- Uchiyama, M.; Mizukami, S.; Arima, K.; Nishimura, T.; Tomita, Y.; Abe, Y.; Tanaka, N.; Honda, Y.; Goto, H.; Hasegawa, M.; et al. Association between serum 25-hydroxyvitamin D and physical performance measures in middle-aged and old Japanese men and women: The Unzen study. PLoS ONE 2021, 16, e0261639. [Google Scholar] [CrossRef]
- Landrum, M.; Lee, J.; Riley, G.; Jang, W.; Rubinstein, W.; Church, D.; Maglott, D. ClinVar: Public archive of relationships among sequence variation and human phenotype. Nucleic Acids Res. 2014, 42, D980–D985. [Google Scholar] [CrossRef] [Green Version]
- Elavarasi, A.; Dash, D.; Tripathi, M.; Bhatia, R. Cerebellar ataxia and neuropathy as presenting features of hepatitis-B related cirrhosis and portal hypertension. BMJ Case Rep. 2017, 2017, bcr2017221912. [Google Scholar] [CrossRef]
- Miki, Y.; Kidoguchi, Y.; Sato, M.; Taketomi, Y.; Taya, C.; Muramatsu, K.; Gelb, M.H.; Yamamoto, K.; Murakami, M. Dual roles of group iid phospholipase A2 in inflammation and cancer. J. Biol. Chem. 2016, 291, 15588–155601. [Google Scholar] [CrossRef] [PubMed] [Green Version]
- Karpinska-Mirecka, A.; Bartosinska, J.; Krasowska, D. The impact of hypertension, diabetes, lipid disorders, overweight/obesity and nicotine dependence on health-related quality of life and psoriasis severity in psoriatic patients receiving systemic conventional and biological treatment. Int. J. Environ. Res. Public Health 2021, 18, 13167. [Google Scholar] [CrossRef] [PubMed]
- Htwe, Y.M.; Wang, H.; Belvitch, P.; Meliton, L.; Bandela, M.; Letsiou, E.; Dudek, S.M. Group V phospholipase A2 mediates endothelial dysfunction and acute lung injury caused by methicillin-resistant Staphylococcus Aureus. Cells 2021, 10, 1731. [Google Scholar] [CrossRef] [PubMed]
- Launay, J.M.; Herve, P.; Callebert, J.; Mallat, Z.; Collet, C.; Doly, S.; Belmer, A.; Diaz, S.L.; Hatia, S.; Cote, F.; et al. Serotonin 5-HT2B receptors are required for bone-marrow contribution to pulmonary arterial hypertension. Blood 2012, 119, 1772–1780. [Google Scholar] [CrossRef] [PubMed] [Green Version]
- Wu, C.; Su, J.; Wang, X.; Wang, J.; Xiao, K.; Li, Y.; Xiao, Q.; Ling, M.; Xiao, Y.; Qin, C.; et al. Overexpression of the phospholipase A2 group V gene in glioma tumors is associated with poor patient prognosis. Cancer Manag. Res. 2019, 11, 3139–3152. [Google Scholar] [CrossRef] [Green Version]
- Li, B.; Yang, H.; Shen, B.; Huang, J.; Qin, Z. Procollagen-lysine, 2-oxoglutarate 5-dioxygenase 1 increases cellular proliferation and colony formation capacity in lung cancer via activation of E2F transcription factor 1. Oncol. Lett. 2021, 22, 851. [Google Scholar] [CrossRef]
- Li, J.; Lam, A.S.M.; Yau, S.T.Y.; Yiu, K.K.L.; Tsoi, K.K.F. Antihypertensive treatments and risks of lung Cancer: A large population-based cohort study in Hong Kong. BMC Cancer 2021, 21, 1202. [Google Scholar] [CrossRef]
- Tian, L.; Zhou, H.; Wang, G.; Wang, W.Y.; Li, Y.; Xue, X. The relationship between PLOD1 expression level and glioma prognosis investigated using public databases. PeerJ 2021, 9, e11422. [Google Scholar] [CrossRef]
- Mehta, M.B.; Shewale, S.V.; Sequeira, R.N.; Millar, J.S.; Hand, N.J.; Rader, D.J. Hepatic protein phosphatase 1 regulatory subunit 3B (Ppp1r3b) promotes hepatic glycogen synthesis and thereby regulates fasting energy homeostasis. J. Biol. Chem. 2017, 292, 10444–10454. [Google Scholar] [CrossRef] [Green Version]
- Oben, A.; Jauk, V.; Battarbee, A.; Longo, S.; Szychowski, J.; Tita, A.; Harper, L. Value of HbA1c in obese women with gestational diabetes. Am. J. Perinatol. 2021. [Google Scholar] [CrossRef] [PubMed]
- Panossian, A.; Seo, E.J.; Efferth, T. Novel molecular mechanisms for the adaptogenic effects of herbal extracts on isolated brain cells using systems biology. Phytomedicine 2018, 50, 257–284. [Google Scholar] [CrossRef] [PubMed]
- Tang, Y.; Fung, E.; Xu, A.; Lan, H.Y. C-reactive protein and ageing. Clin. Exp. Pharmacol. Physiol. 2017, 44, 9–14. [Google Scholar] [CrossRef] [PubMed] [Green Version]
- Touraine, P.; Martini, J.F.; Zafrani, B.; Durand, J.C.; Labaille, F.; Malet, C.; Nicolas, A.; Trivin, C.; Postel-Vinay, M.C.; Kuttenn, F.; et al. Increased expression of prolactin receptor gene assessed by quantitative polymerase chain reaction in human breast tumors versus normal breast tissues. J. Clin. Endocrinol. Metab. 1998, 83, 667–674. [Google Scholar] [CrossRef]
- Zhou, W.; Wang, Y.; Gao, H.; Jia, Y.; Xu, Y.; Wan, X.; Zhang, Z.; Yu, H.; Yan, S. Identification of key genes involved in pancreatic ductal adenocarcinoma with diabetes mellitus based on gene expression profiling analysis. Pathol. Oncol. Res. 2021, 27, 604730. [Google Scholar] [CrossRef]
- Zhao, C.Y.; Hua, C.H.; Li, C.H.; Zheng, R.Z.; Li, X.Y. High PYGL expression predicts poor prognosis in human gliomas. Front. Neurol. 2021, 12, 652931. [Google Scholar] [CrossRef]
- Xia, W.; Su, L.; Jiao, J. Cold-induced protein RBM3 orchestrates neurogenesis via modulating Yap mRNA stability in cold stress. J. Cell Biol. 2018, 217, 3464–3479. [Google Scholar] [CrossRef]
- Takahashi, Y.; Hori, M.; Shimoji, K.; Miyajima, M.; Akiyama, O.; Arai, H.; Aoki, S. Changes in delta ADC reflect intracranial pressure changes in craniosynostosis. Acta Radiol. Open 2017, 6, 2058460117728535. [Google Scholar] [CrossRef] [Green Version]
- Jogi, A.; Brennan, D.J.; Ryden, L.; Magnusson, K.; Ferno, M.; Stal, O.; Borgquist, S.; Uhlen, M.; Landberg, G.; Pahlman, S.; et al. Nuclear expression of the RNA-binding protein RBM3 is associated with an improved clinical outcome in breast cancer. Mod. Pathol. 2009, 22, 1564–1574. [Google Scholar] [CrossRef]
- Sarang, Z.; Saghy, T.; Budai, Z.; Ujlaky-Nagy, L.; Bedekovics, J.; Beke, L.; Mehes, G.; Nagy, G.; Ruhl, R.; Moise, A.R.; et al. Retinol saturase knock-out mice are characterized by impaired clearance of apoptotic cells and develop mild autoimmunity. Biomolecules 2019, 9, 737. [Google Scholar] [CrossRef] [Green Version]
- Martin Calderon, L.; Chaudhury, M.; Pope, J.E. Healthcare utilization and economic burden in systemic sclerosis: A systematic review. Rheumatology 2021, keab847. [Google Scholar] [CrossRef] [PubMed]
- Zhao, L.; Zhu, X.; Xia, M.; Li, J.; Guo, A.Y.; Zhu, Y.; Yang, X. Quercetin ameliorates gut microbiota dysbiosis that drives hypothalamic damage and hepatic lipogenesis in monosodium glutamate-induced abdominal obesity. Front. Nutr. 2021, 8, 671353. [Google Scholar] [CrossRef] [PubMed]
- Li, R.; Luo, S.Y.; Zuo, Z.G.; Yu, Z.; Chen, W.N.; Ye, Y.X.; Xia, M. Association between serum uric acid to creatinine ratio and metabolic syndrome based on community residents in Chashan town, Dongguan city. Zhonghua Yu Fang Yi Xue Za Zhi (Chin. J. Prev. Med.) 2021, 55, 1449–1455. [Google Scholar]
- Mei, J.; Hu, K.; Peng, X.; Wang, H.; Liu, C. Decreased expression of SLC16A12 mRNA predicts poor prognosis of patients with clear cell renal cell carcinoma. Medicine 2019, 98, e16624. [Google Scholar] [CrossRef]
- Liu, J.; Bao, J.; Zhang, W.; Li, Q.; Hou, J.; Wei, X.; Huang, Y. The potential of visceral adipose tissue in distinguishing clear cell renal cell carcinoma from renal angiomyolipoma with minimal fat. Cancer Manag. Res. 2021, 13, 8907–8914. [Google Scholar] [CrossRef]
- Zuercher, J.; Neidhardt, J.; Magyar, I.; Labs, S.; Moore, A.T.; Tanner, F.C.; Waseem, N.; Schorderet, D.F.; Munier, F.L.; Bhattacharya, S.; et al. Alterations of the 5’untranslated region of SLC16A12 lead to age-related cataract. Investig. Ophthalmol. Vis. Sci. 2010, 51, 3354–3361. [Google Scholar] [CrossRef] [Green Version]
- Ang, M.J.; Afshari, N.A. Cataract and systemic disease: A review. Clin. Exp. Ophthalmol. 2021, 49, 118–127. [Google Scholar] [CrossRef]
- Christensen, H.L.; Barbuskaite, D.; Rojek, A.; Malte, H.; Christensen, I.B.; Fuchtbauer, A.C.; Fuchtbauer, E.M.; Wang, T.; Praetorius, J.; Damkier, H.H. The choroid plexus sodium-bicarbonate cotransporter NBCe2 regulates mouse cerebrospinal fluid pH. J. Physiol. 2018, 596, 4709–4728. [Google Scholar] [CrossRef] [Green Version]
- Betz, M.V.; Nemec, K.B.; Zisman, A.L. Plant-based diets in kidney disease: Nephrology professionals’ perspective. J. Ren. Nutr. 2021. [Google Scholar] [CrossRef]
- Kant, S.; Stopa, E.G.; Johanson, C.E.; Baird, A.; Silverberg, G.D. Choroid plexus genes for CSF production and brain homeostasis are altered in Alzheimer’s disease. Fluids Barriers CNS 2018, 15, 34. [Google Scholar] [CrossRef] [Green Version]
- Coatl-Cuaya, H.; Tendilla-Beltran, H.; de Jesús-Vásquez, L.M.; Garces-Ramirez, L.; Gomez-Villalobos, M.J.; Flores, G. Losartan enhances cognitive and structural neuroplasticity impairments in spontaneously hypertensive rats. J. Chem. Neuroanat. 2021, 120, 102061. [Google Scholar] [CrossRef] [PubMed]
- Yuting, Y.; Lafeng, F.; Qiwei, H. Secreted modular calcium-binding protein 2 promotes high fat diet (HFD)-induced hepatic steatosis through enhancing lipid deposition, fibrosis and inflammation via targeting TGF-β1. Biochem. Biophys. Res. Commun. 2019, 509, 48–55. [Google Scholar] [CrossRef] [PubMed]
- Calvopina, D.A.; Lewindon, P.J.; Ramm, L.E.; Noble, C.; Hartel, G.F.; Leung, D.H.; Ramm, G.A. Gamma-glutamyl transpeptidase-to-platelet ratio as a biomarker of liver disease and hepatic fibrosis severity in paediatric cystic fibrosis. J. Cyst. Fibros. 2021. [Google Scholar] [CrossRef] [PubMed]
- Hyun, C.L.; Park, S.J.; Kim, H.S.; Song, H.J.; Kim, H.U.; Lee, C.; Lee, D.H.; Maeng, Y.H.; Kim, Y.S.; Jang, B. The intestinal stem cell marker SMOC2 is an independent prognostic marker associated with better survival in gastric cancer. Anticancer Res. 2021, 41, 3689–3698. [Google Scholar] [CrossRef] [PubMed]
- Gomez-Abenza, E.; Ibanez-Molero, S.; Garcia-Moreno, D.; Fuentes, I.; Zon, L.I.; Mione, M.C.; Cayuela, M.L.; Gabellini, C.; Mulero, V. Zebrafish modeling reveals that SPINT1 regulates the aggressiveness of skin cutaneous melanoma and its crosstalk with tumor immune microenvironment. J. Exp. Clin. Cancer Res. 2019, 38, 405. [Google Scholar] [CrossRef] [Green Version]
- Soffietti, R.; Ruda, R.; Mutani, R. Management of brain metastases. J. Neurol. 2002, 249, 1357–1369. [Google Scholar] [CrossRef]
- Huang, H.P.; Chang, M.H.; Chen, Y.T.; Hsu, H.Y.; Chiang, C.L.; Cheng, T.S.; Wu, Y.M.; Wu, M.Z.; Hsu, Y.C.; Shen, C.C.; et al. Persistent elevation of hepatocyte growth factor activator inhibitors in cholangiopathies affects liver fibrosis and differentiation. Hepatology 2012, 55, 161–172. [Google Scholar] [CrossRef]
- Takashima, Y.; Keino-Masu, K.; Yashiro, H.; Hara, S.; Suzuki, T.; van Kuppevelt, T.H.; Masu, M.; Nagata, M. Heparan sulfate 6-O-endosulfatases, Sulf1 and Sulf2, regulate glomerular integrity by modulating growth factor signaling. Am. J. Physiol. Renal Physiol. 2016, 310, F395–F408. [Google Scholar] [CrossRef] [Green Version]
- Saito, N.; Toyoda, M.; Ono, M.; Kondo, M.; Moriya, H.; Kimura, M.; Sawada, K.; Fukagawa, M. Regulation of blood pressure and phosphorylation of β1-integrin in renal tissue in a rat model of diabetic nephropathy. Tokai J. Exp. Clin. Med. 2021, 46, 172–179. [Google Scholar]
- Lee, H.Y.; Yeh, B.W.; Chan, T.C.; Yang, K.F.; Li, W.M.; Huang, C.N.; Ke, H.L.; Li, C.C.; Yeh, H.C.; Liang, P.I.; et al. Sulfatase-1 overexpression indicates poor prognosis in urothelial carcinoma of the urinary bladder and upper tract. Oncotarget 2017, 8, 47216–47229. [Google Scholar] [CrossRef]
- Chen, J.S.; Lu, C.L.; Huang, L.C.; Shen, C.H.; Chen, S.C. Chronic kidney disease is associated with upper tract urothelial carcinoma: A nationwide population-based cohort study in Taiwan. Medicine 2016, 95, e3255. [Google Scholar] [CrossRef] [PubMed]
- Clarke, W.T.; Edwards, B.; McCullagh, K.J.; Kemp, M.W.; Moorwood, C.; Sherman, D.L.; Burgess, M.; Davies, K.E. Syncoilin modulates peripherin filament networks and is necessary for large-calibre motor neurons. J. Cell Sci. 2010, 123, 2543–2552. [Google Scholar] [CrossRef] [PubMed] [Green Version]
- Silva, P.S.C.D.; Boing, A.F. Factors associated with leisure-time physical activity: Analysis of Brazilians with chronic diseases. Cien Saude Colet (Sci. Collect. Health) 2021, 26, 5727–5738. [Google Scholar] [CrossRef] [PubMed]
- Wang, D.; Deng, L.; Xu, X.; Ji, Y.; Jiao, Z. Elevated SYNC expression is associated with gastric tumorigenesis and infiltration of M2-polarized macrophages in the gastric tumor immune microenvironment. Genet. Test. Mol. Biomarkers 2021, 25, 236–246. [Google Scholar] [CrossRef]
- Hao, X.L.; Gao, L.Y.; Deng, X.J.; Han, F.; Chen, H.Q.; Jiang, X.; Liu, W.B.; Wang, D.D.; Chen, J.P.; Cui, Z.H.; et al. Identification of TC2N as a novel promising suppressor of PI3K-AKT signaling in breast cancer. Cell Death Dis. 2019, 10, 424. [Google Scholar] [CrossRef]
- Xu, J.; Ou, X.; Li, J.; Cai, Q.; Sun, K.; Ye, J.; Peng, J. Overexpression of TC2N is associated with poor prognosis in gastric cancer. J. Cancer. 2021, 12, 807–817. [Google Scholar] [CrossRef]
- Jeng, J.Y.; Harasztosi, C.; Carlton, A.J.; Corns, L.F.; Marchetta, P.; Johnson, S.L.; Goodyear, R.J.; Legan, K.P.; Ruttiger, L.; Richardson, G.P.; et al. MET currents and otoacoustic emissions from mice with a detached tectorial membrane indicate the extracellular matrix regulates Ca2+ near stereocilia. J. Physiol. 2021, 599, 2015–2036. [Google Scholar] [CrossRef]
- Frisina, R.D.; Wheeler, H.E.; Fossa, S.D.; Kerns, S.L.; Fung, C.; Sesso, H.D.; Monahan, P.O.; Feldman, D.R.; Hamilton, R.; Vaughn, D.J.; et al. Comprehensive audiometric analysis of hearing impairment and tinnitus after cisplatin-based chemotherapy in survivors of adult-onset cancer. J. Clin. Oncol. 2016, 34, 2712–2720. [Google Scholar] [CrossRef]
- Solares, C.A.; Edling, A.E.; Johnson, J.M.; Baek, M.J.; Hirose, K.; Hughes, G.B.; Tuohy, V.K. Murine autoimmune hearing loss mediated by CD4+ T cells specific for inner ear peptides. J. Clin. Investig. 2004, 113, 1210–1217. [Google Scholar] [CrossRef] [Green Version]
- Xu, Z.; Ruan, J.; Pan, L.; Chen, C. Candidate genes identified in systemic sclerosis-related pulmonary arterial hypertension were associated with immunity, inflammation, and cytokines. Cardiovasc. Ther. 2021, 2021, 6651009. [Google Scholar] [CrossRef]
- Kiermayer, C.; Northrup, E.; Schrewe, A.; Walch, A.; de Angelis, M.H.; Schoensiegel, F.; Zischka, H.; Prehn, C.; Adamski, J.; Bekeredjian, R.; et al. Heart-specific knockout of the mitochondrial thioredoxin reductase (Txnrd2) induces metabolic and contractile dysfunction in the aging myocardium. J. Am. Heart Assoc. 2015, 4, e002153. [Google Scholar] [CrossRef] [PubMed] [Green Version]
- Liang, J.; Zhu, R.; Yang, Y.; Li, R.; Hong, C.; Luo, C. A predictive model for dilated cardiomyopathy with pulmonary hypertension. ESC Heart Fail. 2021, 8, 4255–4264. [Google Scholar] [CrossRef] [PubMed]
- Mou, D.; Ding, D.; Yan, H.; Qin, B.; Dong, Y.; Li, Z.; Che, L.; Fang, Z.; Xu, S.; Lin, Y.; et al. Maternal supplementation of organic selenium during gestation improves sows and offspring antioxidant capacity and inflammatory status and promotes embryo survival. Food Funct. 2020, 11, 7748–7761. [Google Scholar] [CrossRef] [PubMed]
- Trinchese, G.; Cimmino, F.; Cavaliere, G.; Rosati, L.; Catapano, A.; Sorriento, D.; Murru, E.; Bernardo, L.; Pagani, L.; Bergamo, P.; et al. Heart mitochondrial metabolic flexibility and redox status are improved by donkey and human milk intake. Antioxidants 2021, 10, 1807. [Google Scholar] [CrossRef] [PubMed]
- Busceti, C.L.; Cotugno, M.; Bianchi, F.; Forte, M.; Stanzione, R.; Marchitti, S.; Battaglia, G.; Nicoletti, F.; Fornai, F.; Rubattu, S. Brain overexpression of uncoupling protein-2 (UCP2) delays renal damage and stroke occurrence in stroke-prone spontaneously hypertensive rats. Int. J. Mol. Sci. 2020, 21, 4289. [Google Scholar] [CrossRef] [PubMed]
- Kim, J.W.; Cardin, D.B.; Vaishampayan, U.N.; Kato, S.; Grossman, S.R.; Glazer, P.M.; Shyr, Y.; Ivy, S.P.; LoRusso, P.M. Clinical activity and safety of cediranib and olaparib combination in patients with metastatic pancreatic ductal adenocarcinoma without brca mutation. Oncologist 2021, 26, e1104–e1109. [Google Scholar] [CrossRef]
- Albert, F.W.; Somel, M.; Carneiro, M.; Aximu-Petri, A.; Halbwax, M.; Thalmann, O.; Blanco-Aguiar, J.A.; Plyusnina, I.Z.; Trut, L.; Villafuerte, R.; et al. A comparison of brain gene expression levels in domesticated and wild animals. PLoS Genet. 2012, 8, e1002962. [Google Scholar] [CrossRef] [Green Version]
- Sato, D.X.; Rafati, N.; Ring, H.; Younis, S.; Feng, C.; Blanco-Aguiar, J.A.; Rubin, C.J.; Villafuerte, R.; Hallbook, F.; Carneiro, M.; et al. Brain transcriptomics of wild and domestic rabbits suggests that changes in dopamine signaling and ciliary function contributed to evolution of tameness. Genome Biol. Evol. 2020, 12, 1918–1928. [Google Scholar] [CrossRef]
- Yang, X.; Zhang, H.; Shang, J.; Liu, G.; Xia, T.; Zhao, C.; Sun, G.; Dou, H. Comparative analysis of the blood transcriptomes between wolves and dogs. Anim. Genet. 2018, 49, 291–302. [Google Scholar] [CrossRef]
- Hekman, J.P.; Johnson, J.L.; Edwards, W.; Vladimirova, A.V.; Gulevich, R.G.; Ford, A.L.; Kharlamova, A.V.; Herbeck, Y.; Acland, G.M.; Raetzman, L.T.; et al. Anterior pituitary transcriptome suggests differences in ACTH release in tame and aggressive foxes. G3 2018, 8, 859–873. [Google Scholar] [CrossRef] [Green Version]
- Long, K.; Mao, K.; Che, T.; Zhang, J.; Qiu, W.; Wang, Y.; Tang, Q.; Ma, J.; Li, M.; Li, X. Transcriptome differences in frontal cortex between wild boar and domesticated pig. Anim. Sci. J. 2018, 89, 848–857. [Google Scholar] [CrossRef] [PubMed]
- Yang, Y.; Adeola, A.C.; Xie, H.B.; Zhang, Y.P. Genomic and transcriptomic analyses reveal selection of genes for puberty in Bama Xiang pigs. Zool. Res. 2018, 39, 424–430. [Google Scholar] [PubMed]
- Fallahshahroudi, A.; Lotvedt, P.; Belteky, J.; Altimiras, J.; Jensen, P. Changes in pituitary gene expression may underlie multiple domesticated traits in chickens. Heredity 2019, 122, 195–204. [Google Scholar] [CrossRef] [Green Version]
- Samet, H. A top-down quadtree traversal algorithm. IEEE Trans. Pattern Anal. Mach. Intell. 1985, 7, 94–98. [Google Scholar] [CrossRef] [PubMed]
- Sun, G.-L.; Shen, W.; Wen, J.-F. Triosephosphate Isomerase Genes in Two Trophic Modes of Euglenoids (Euglenophyceae) and Their Phylogenetic Analysis. J. Eukaryot. Microbiol. 2008, 55, 170–177. [Google Scholar] [CrossRef] [PubMed]
- Morozova, O.V.; Alekseeva, A.E.; Sashina, T.A.; Brusnigina, N.F.; Epifanova, N.V.; Kashnikov, A.U.; Zverev, V.V.; Novikova, N.A. Phylodynamics of G4P [8] and G2P [4] strains of rotavirus A isolated in Russia in 2017 based on full-genome analyses. Virus Genes 2020, 56, 537–545. [Google Scholar] [CrossRef] [PubMed]
- Hakizimana, J.N.; Yona, C.; Kamana, O.; Nauwynck, H.; Misinzo, G. African Swine Fever Virus Circulation between Tanzania and Neighboring Countries: A Systematic Review and Meta-Analysis. Viruses 2021, 13, 306. [Google Scholar] [CrossRef] [PubMed]
- Zhang, Y.; Katoh, T.K.; Finet, C.; Izumitani, H.F.; Toda, M.J.; Watabe, H.-A.; Katoh, T. Phylogeny and evolution of mycophagy in the Zygothrica genus group (Diptera: Drosophilidae). Mol. Phylogenetics Evol. 2021, 163, 107257. [Google Scholar] [CrossRef]
- Crowley, J.P.; Metzger, J.B.; Merrill, E.W.; Valeri, C.R. Whole blood viscosity in beta thalassemia minor. Ann. Clin. Lab. Sci. 1992, 22, 229–235. [Google Scholar]
- Philibert, C.; Bouillot, S.; Huber, P.; Faury, G. Protocadherin-12 deficiency leads to modifications in the structure and function of arteries in mice. Pathol. Biol. 2012, 60, 34–40. [Google Scholar] [CrossRef]
- Mukai, S.; Oue, N.; Oshima, T.; Imai, T.; Sekino, Y.; Honma, R.; Sakamoto, N.; Sentani, K.; Kuniyasu, H.; Egi, H.; et al. Overexpression of PCDHB9 promotes peritoneal metastasis and correlates with poor prognosis in patients with gastric cancer. J. Pathol. 2017, 243, 100–110. [Google Scholar] [CrossRef] [PubMed]
- Ponomarenko, M.; Rasskazov, D.; Chadaeva, I.; Sharypova, E.; Drachkova, I.; Oshchepkov, D.; Ponomarenko, P.; Savinkova, L.; Oshchepkova, E.; Nazarenko, M.; et al. Candidate SNP markers of atherogenesis significantly shifting the affinity of TATA-binding protein for human gene promoters show stabilizing natural selection as a sum of neutral drift accelerating atherogenesis and directional natural selection slowing it. Int. J. Mol. Sci. 2020, 21, 1045. [Google Scholar] [CrossRef] [PubMed] [Green Version]
- Ponomarenko, M.; Rasskazov, D.; Arkova, O.; Ponomarenko, P.; Suslov, V.; Savinkova, L.; Kolchanov, N. How to use SNP_TATA_Comparator to find a significant change in gene expression caused by the regulatory SNP of this gene’s promoter via a change in affinity of the TATA-binding protein for this promoter. Biomed. Res. Int. 2015, 2015, 359835. [Google Scholar] [CrossRef] [PubMed] [Green Version]
- Varzari, A.; Tudor, E.; Bodrug, N.; Corloteanu, A.; Axentii, E.; Deyneko, I.V. Age-specific association of CCL5 gene polymorphism with pulmonary tuberculosis: A case-control study. Genet. Test. Mol. Biomark. 2018, 22, 281–287. [Google Scholar] [CrossRef] [PubMed]
- Cho, S.N.; Choi, J.A.; Lee, J.; Son, S.H.; Lee, S.A.; Nguyen, T.D.; Choi, S.Y.; Song, C.H. Ang II-Induced hypertension exacerbates the pathogenesis of tuberculosis. Cells 2021, 10, 2478. [Google Scholar] [CrossRef] [PubMed]
- Haeussler, M.; Raney, B.; Hinrichs, A.; Clawson, H.; Zweig, A.; Karolchik, D.; Casper, J.; Speir, M.; Haussler, D.; Kent, W. Navigating protected genomics data with UCSC Genome Browser in a box. Bioinformatics 2015, 31, 764–766. [Google Scholar] [CrossRef] [PubMed] [Green Version]
- Stajich, J.E.; Block, D.; Boulez, K.; Brenner, S.E.; Chervitz, S.A.; Dagdigian, C.; Fuellen, G.; Gilbert, J.G.; Korf, I.; Lapp, H.; et al. The Bioperl toolkit: Perl modules for the life sciences. Genome Res. 2002, 12, 1611–1618. [Google Scholar] [CrossRef] [Green Version]
- Waardenberg, A.; Basset, S.; Bouveret, R.; Harvey, R. CompGO: An R package, for comparing and visualizing Gene Ontology enrichment differences between DNA binding experiments. BMC Bioinform. 2015, 16, 275. [Google Scholar] [CrossRef] [Green Version]
- Zerbino, D.; Wilder, S.; Johnson, N.; Juettemann, T.; Flicek, P. The Ensembl regulatory build. Genome Biol. 2015, 16, 56. [Google Scholar] [CrossRef] [Green Version]
- Day, I.N. dbSNP in the detail and copy number complexities. Hum. Mutat. 2010, 31, 2–4. [Google Scholar] [CrossRef]
- Martiney, J.A.; Cerami, A.; Slater, A.F. Inhibition of hemozoin formation in Plasmodium falciparum trophozoite extracts by heme analogs: Possible implication in the resistance to malaria conferred by the beta-thalassemia trait. Mol. Med. 1996, 2, 236–246. [Google Scholar] [CrossRef] [PubMed] [Green Version]
- Ponomarenko, P.; Savinkova, L.; Drachkova, I.; Lysova, M.; Arshinova, T.; Ponomarenko, M.; Kolchanov, N. A step-by-step model of TBP/TATA box binding allows predicting human hereditary diseases by single nucleotide polymorphism. Dokl. Biochem. Biophys. 2008, 419, 88–92. [Google Scholar] [CrossRef] [PubMed]
- Delgadillo, R.; Whittington, J.; Parkhurst, L.; Parkhurst, L. The TBP core domain in solution variably bends TATA sequences via a three-step binding mechanism. Biochemistry 2009, 48, 1801–1809. [Google Scholar] [CrossRef] [PubMed]
- Hahn, S.; Buratowski, S.; Sharp, P.; Guarente, L. Yeast TATA-binding protein TFIID binds to TATA elements with both consensus and nonconsensus DNA sequences. Proc. Natl. Acad. Sci. USA 1989, 86, 5718–5722. [Google Scholar] [CrossRef] [Green Version]
- Karas, H.; Knuppel, R.; Schulz, W.; Sklenar, H.; Wingender, E. Combining structural analysis of DNA with search routines for the detection of transcription regulatory elements. Comput. Applic. Biosci. 1996, 12, 441–446. [Google Scholar] [CrossRef] [Green Version]
- Ponomarenko, M.P.; Ponomarenko, J.V.; Frolov, A.S.; Podkolodny, N.L.; Savinkova, L.K.; Kolchanov, N.A.; Overton, G.C. Identification of sequence-dependent features correlating to activity of DNA sites interacting with proteins. Bioinformatics 1999, 15, 687–703. [Google Scholar] [CrossRef]
- Bucher, P. Weight matrix descriptions of four eukaryotic RNA polymerase II promoter elements derived from 502 unrelated promoter sequences. J. Mol. Biol. 1990, 212, 563–578. [Google Scholar] [CrossRef]
- Flatters, D.; Lavery, R. Sequence-dependent dynamics of TATA-Box binding sites. Biophys. J. 1998, 75, 372–381. [Google Scholar] [CrossRef] [Green Version]
- Ponomarenko, P.M.; Suslov, V.V.; Savinkova, L.K.; Ponomarenko, M.P.; Kolchanov, N.A. A precise equilibrium equation for four steps of binding between TBP and TATA-box allows for the prediction of phenotypical expression upon mutation. Biophysics 2010, 55, 358–369. [Google Scholar] [CrossRef]
- Mogno, I.; Vallania, F.; Mitra, R.D.; and Cohen, B.A. TATA is a modular component of synthetic promoters. Genome Res. 2010, 20, 1391–1397. [Google Scholar] [CrossRef] [Green Version]
- Pugh, B. Purification of the human TATA-binding protein, TBP. Methods Mol. Biol. 1995, 37, 359–367. [Google Scholar]
- Savinkova, L.; Drachkova, I.; Arshinova, T.; Ponomarenko, P.; Ponomarenko, M.; Kolchanov, N. An experimental verification of the predicted effects of promoter TATA-box polymorphisms associated with human diseases on interactions between the TATA boxes and TATA-binding protein. PLoS ONE 2013, 8, e54626. [Google Scholar]
- Drachkova, I.; Savinkova, L.; Arshinova, T.; Ponomarenko, M.; Peltek, S.; Kolchanov, N. The mechanism by which TATA-box polymorphisms associated with human hereditary diseases influence interactions with the TATA-binding protein. Hum. Mutat. 2014, 35, 601–608. [Google Scholar] [CrossRef] [PubMed]
- Kimura, M. A simple method for estimating evolutionary rates of base substitutions through comparative studies of nucleotide sequences. J. Mol. Evol. 1980, 16, 111–120. [Google Scholar] [CrossRef]
- Li, W.H.; Wu, C.I.; Luo, C.C. A new method for estimating synonymous and nonsynonymous rates of nucleotide substitution considering the relative likelihood of nucleotide and codon changes. Mol. Biol. Evol. 1985, 2, 150–174. [Google Scholar] [PubMed] [Green Version]
- Oggenfuss, U.; Badet, T.; Wicker, T.; Hartmann, F.E.; Singh, N.K.; Abraham, L.; Karisto, P.; Vonlanthen, T.; Mundt, C.; McDonald, B.A.; et al. A population-level invasion by transposable elements triggers genome expansion in a fungal pathogen. eLife 2021, 10, e69249. [Google Scholar] [CrossRef] [PubMed]
- Kasowski, M.; Grubert, F.; Heffelfinger, C.; Hariharan, M.; Asabere, A.; Waszak, S.; Habegger, L.; Rozowsky, J.; Shi, M.; Urban, A.; et al. Variation in transcription factor binding among humans. Science 2010, 328, 232–235. [Google Scholar] [CrossRef] [Green Version]
- 1000 Genomes Project Consortium; Abecasis, G.; Auton, A.; Brooks, L.; DePristo, M.; Durbin, R.; Handsaker, R.; Kang, H.; Marth, G.; McVean, G.; et al. An integrated map of genetic variation from 1.092 human genomes. Nature 2012, 491, 56–65. [Google Scholar]
- Haldane, J.B.S. The cost of natural selection. J. Genet. 1957, 55, 511–524. [Google Scholar] [CrossRef]
- Kimura, M. Evolutionary rate at the molecular level. Nature 1968, 217, 624–626. [Google Scholar] [CrossRef]
- Hill, A.E.; Plyler, Z.E.; Tiwari, H.; Patki, A.; Tully, J.P.; McAtee, C.W.; Moseley, L.A.; Sorscher, E.J. Longevity and plasticity of CFTR provide an argument for noncanonical SNP organization in hominid DNA. PLoS ONE 2014, 9, e109186. [Google Scholar] [CrossRef] [PubMed]
- Naumenko, E.; Popova, N.; Nikulina, E.; Dygalo, N.; Shishkina, G.; Borodin, P.; Markel, A. Behavior, adrenocortical activity, and brain monoamines in Norway rats selected for reduced aggressiveness towards man. Pharmacol. Biochem. Behav. 1989, 33, 85–91. [Google Scholar] [CrossRef]
- Paxinos, G.; Watson, C.R. The Rat Brain in Stereotaxic Coordinates, 7th ed.; Academic Press: London, UK, 2013; p. 472. [Google Scholar]
- Bolger, A.M.; Lohse, M.; Usadel, B. Trimmomatic: A flexible trimmer for Illumina sequence data. Bioinformatics 2014, 30, 2114–2120. [Google Scholar] [CrossRef] [PubMed] [Green Version]
- Kim, D.; Pertea, G.; Trapnell, C.; Pimentel, H.; Kelley, R.; Salzberg, S.L. TopHat2: Accurate alignment of transcriptomes in the presence of insertions, deletions and gene fusions. Genome Biol. 2013, 14, 36. [Google Scholar] [CrossRef] [Green Version]
- Li, H.; Handsaker, B.; Wysoker, A.; Fennell, T.; Ruan, J.; Homer, N.; Marth, G.; Abecasis, G.; Durbin, R. The Sequence alignment/map (SAM) format and SAMtools. Bioinformatics 2009, 25, 2078–2079. [Google Scholar] [CrossRef] [Green Version]
- Anders, S.; Pyl, P.T.; Huber, W. HTSeq—A Python framework to work with high-throughput sequencing data. Bioinformatics 2015, 31, 166–169. [Google Scholar] [CrossRef]
- Love, M.I.; Huber, W.; Anders, S. Moderated estimation of fold change and dispersion for RNA-seq data with DESeq2. Genome Biol. 2014, 15, 550. [Google Scholar] [CrossRef] [Green Version]
- Anders, S.; Huber, W. Differential expression analysis for sequence count data. Genome Biol. 2010, 11, 106. [Google Scholar] [CrossRef] [Green Version]
- Ye, J.; Coulouris, G.; Zaretskaya, I.; Cutcutache, I.; Rozen, S.; Madden, T.L. Primer-BLAST: A tool to design target-specific primers for polymerase chain reaction. BMC Bioinform. 2012, 13, 134. [Google Scholar] [CrossRef] [Green Version]
- Tian, L.; Chen, Y.; Wang, D.W.; Liu, X.H. Validation of reference genes via qRT-PCR in multiple conditions in brandt’s voles, lasiopodomys brandtii. Animals 2021, 11, 897. [Google Scholar] [CrossRef]
- Zamani, A.; Powell, K.L.; May, A.; Semple, B.D. Validation of reference genes for gene expression analysis following experimental traumatic brain injury in a pediatric mouse model. Brain Res. Bull. 2020, 156, 43–49. [Google Scholar] [CrossRef] [PubMed]
- Gholami, K.; Loh, S.Y.; Salleh, N.; Lam, S.K.; Hoe, S.Z. Selection of suitable endogenous reference genes for qPCR in kidney and hypothalamus of rats under testosterone influence. PLoS ONE 2017, 12, e0176368. [Google Scholar] [CrossRef] [PubMed] [Green Version]
- Penning, L.C.; Vrieling, H.E.; Brinkhof, B.; Riemers, F.M.; Rothuizen, J.; Rutteman, G.R.; Hazewinkel, H.A. A validation of 10 feline reference genes for gene expression measurements in snap-frozen tissues. Vet. Immunol. Immunopathol. 2007, 120, 212–222. [Google Scholar] [CrossRef] [PubMed]


| Group | Tame vs. Aggressive Rats |
|---|---|
| Total number of sequence reads (NCBI SRA ID: PRJNA668014) | 169,529,658 |
| Reads mapped to reference rat genome RGSC Rnor_6.0, UCSC Rn6, July 2014 (%) | 146,521,467 (88.74%) |
| Expressed genes identified | 14,039 |
| Statistically significant DEGs (PADJ < 0.05, Fisher’s Z-test with Benjamini correction) | 42 |
| # | Rat Gene, Name | Symbol | log2 | p | PADJ |
|---|---|---|---|---|---|
| 1 | Albumin | Alb | 3.21 | <10−11 | <10−7 |
| 2 | Aquaporin 1 (Colton blood group) | Aqp1 | 5.91 | <10−6 | <10−2 |
| 3 | Achaete-scute family bHLH transcription factor 3 | Ascl3 | 2.38 | <10−4 | <0.05 |
| 4 | BAG cochaperone 3 (synonym: BCL2-associated athanogene 3) | Bag3 | −0.92 | <10−4 | <0.05 |
| 5 | BAR/IMD domain-containing adaptor protein 2-like 1 | Baiap2l1 | 3.67 | <10−4 | <0.05 |
| 6 | 3-hydroxybutyrate dehydrogenase 1 | Bdh1 | 0.40 | <10−4 | <0.05 |
| 7 | Cholecystokinin B receptor | Cckbr | 1.24 | <10−8 | <10−4 |
| 8 | Chondroitin sulfate proteoglycan 4B | Cspg4b | 3.47 | <10−4 | <0.05 |
| 9 | Defensin β17 | Defb17 | 5.94 | <10−4 | <0.05 |
| 10 | Ectonucleotide pyrophosphatase/phosphodiesterase 2 | Enpp2 | 2.41 | <10−3 | <0.05 |
| 11 | Fras1-related extracellular matrix 1 | Frem1 | 3.16 | <10−3 | <0.05 |
| 12 | Glycerol-3-phosphate dehydrogenase 1 | Gpd1 | −1.34 | <10−6 | <10−3 |
| 13 | Hemoglobin, β adult major chain | Hbb-b1 | −6.19 | <10−7 | <10−4 |
| 14 | Hepatocyte nuclear factor 4α | Hnf4a | 6.51 | <10−3 | <0.05 |
| 15 | 5-hydroxytryptamine receptor 2C (synonym: serotonin receptor 2C) | Htr2c | 2.03 | <10−3 | <0.05 |
| 16 | Keratin 2 | Krt2 | −1.43 | <10−6 | <10−3 |
| 17 | Leukocyte immunoglobulin-like receptor, subfamily B, member 3-like | Lilrb3l | 7.45 | <10−4 | <0.05 |
| 18 | Lymphocyte antigen 6 complex/Plaur domain-containing 1 | Lypd1 | −0.89 | <10−4 | <0.05 |
| 19 | MORN repeat-containing 1 | Morn1 | 1.42 | <10−11 | <10−7 |
| 20 | Myomesin 2 | Myom2 | −1.24 | <10−4 | <0.05 |
| 21 | Protocadherin β9 | Pcdhb9 | −1.03 | <10−4 | <0.05 |
| 22 | Protocadherin γ subfamily A1 | Pcdhga1 | 2.45 | <10−4 | <0.05 |
| 23 | Prodynorphin | Pdyn | −0.89 | <10−4 | <0.05 |
| 24 | Phospholipase A2, group IID | Pla2g2d | 2.84 | <10−4 | <0.05 |
| 25 | Phospholipase A2, group V | Pla2g5 | 3.85 | <10−4 | <0.05 |
| 26 | Procollagen-lysine, 2-oxoglutarate 5-dioxygenase 1 | Plod1 | −0.67 | <10−3 | <0.05 |
| 27 | Protein phosphatase 1, regulatory subunit 3B | Ppp1r3b | 2.45 | <10−4 | <0.05 |
| 28 | Prolactin receptor | Prlr | 6.43 | <10−5 | <10−2 |
| 29 | Glycogen phosphorylase L | Pygl | −1.21 | <10−5 | <0.05 |
| 30 | RNA-binding motif protein 3 | Rbm3 | 0.89 | <10−4 | <0.05 |
| 31 | Retinol saturase | Retsat | −0.98 | <10−4 | <0.05 |
| 32 | Solute carrier family 16, member 12 | Slc16a12 | 3.08 | <10−3 | <0.05 |
| 33 | Solute carrier family 4, member 5 | Slc4a5 | 6.27 | <10−6 | <10−3 |
| 34 | SPARC-related modular calcium-binding 2 | Smoc2 | −2.09 | <10−4 | <0.05 |
| 35 | Serine peptidase inhibitor, Kunitz type 1 | Spint1 | −1.39 | <10−7 | <10−4 |
| 36 | Sulfatase 1 | Sulf1 | 3.72 | <10−6 | <10−2 |
| 37 | Syncoilin, intermediate filament protein | Sync | 1.17 | <10−3 | <0.05 |
| 38 | Tandem C2 domains, nuclear | Tc2n | 3.47 | <10−5 | <10−2 |
| 39 | Tectorin α | Tecta | 1.38 | <10−8 | <10−5 |
| 40 | Transmembrane protein 60 | Tmem60 | 0.79 | <10−4 | <0.05 |
| 41 | Thioredoxin reductase 2 | Txnrd2 | −0.71 | <10−5 | <10−2 |
| 42 | Uncoupling protein 2 | Ucp2 | 0.73 | <10−4 | <0.05 |
| Design | Behavioral “Glove” Test [74] and the qPCR Data on Gene Expression [This Work] | |||||||||
|---|---|---|---|---|---|---|---|---|---|---|
| Rat | Set | No. 1 | 2 | 3 | 4 | 5 | 6 | 7 | 8 | |
| Glovetest | A | −3 | −3 | −3 | −3 | −3 | −3 | −3 | −3 | |
| T | 3 | 3 | 3 | 3 | 3 | 3 | 3 | 3 | ||
| DEG | Set | Relative expression with respect to four reference genes, qPCR, M0 ± SEM | TOTAL | |||||||
| Ascl3 | A | 0.16 ± 0.02 | 0.88 ± 0.30 | 0.82 ± 0.08 | 0.09 ± 0.04 | 0.18 ± 0.03 | 0.07 ± 0.07 | 0.27 ± 0.11 | 0.32 ± 0.05 | 0.35 ± 0.17 |
| T | 4.85 ± 4.38 | 3.40 ± 1.69 | 1.75 ± 0.24 | 2.21 ± 0.12 | 2.92 ± 0.05 | 4.48 ± 0.17 | 3.83 ± 0.33 | 2.64 ± 0.15 | 3.26 ± 1.71 | |
| Defb17 | A | 0.005 ± 0.005 | 0.01 ± 0.005 | 0.005 ± 0.005 | 0.005 ± 0.005 | 0.005 ± 0.005 | ND | 0.005 ± 0.005 | 0.005 ± 0.005 | 0.01 ± 0.01 |
| T | 1.72 ± 0.04 | 3.22 ± 0.42 | 2.52 ± 0.14 | 1.82 ± 0.55 | 2.45 ± 0.10 | 4.43 ± 0.26 | 1.99 ± 0.89 | 2.34 ± 0.27 | 2.56 ± 0.53 | |
| # | Species | Hypertensive | Normotensive | Tissue | NDEG | Ref. |
|---|---|---|---|---|---|---|
| 1 | rat | OXYS | Wistar | hippocampus | 85 | [40] |
| 2 | rat | OXYS | Wistar | prefrontal cortex | 73 | [41] |
| 3 | rat | OXYS | Wistar | retina | 85 | [42] |
| 4 | rat | ISIAH | WAG | brain stem | 206 | [43] |
| 5 | rat | ISIAH | WAG | hypothalamus | 137 | [44] |
| 6 | rat | ISIAH | WAG | renal medulla | 882 | [45] |
| 7 | rat | ISIAH | WAG | renal cortex | 309 | [46] |
| 8 | rat | ISIAH | WAG | adrenal gland | 1020 | [47] |
| 9 | rat | SHR | Wistar | brain pericytes | 21 | [48] |
| 10 | rat | SHR | Wistar | kidney | 35 | [49] |
| 11 | rat | SD, monocrotaline-treated | SD, saline-treated | lung | 10 | [50] |
| 12 | rat | Dahl-SS, water after salt diet | Dahl-SS, QSYQ after salt diet | kidney | 13 | [51] |
| 13 | rat | Resp18-null Dahl-SS | Dahl-SS | kidney | 14 | [52] |
| 14 | rat | prenatal dexamethasone stress | norm | adrenal gland | 93 | [7] |
| 15 | mice | Toxoplasma infection in pregnancy | norm | uterus | 10 | [53] |
| 16 | mice | BPH/2J | BPN/3J | kidney | 883 | [54] |
| 17 | rabbit | G2K1C-treated | norm | middle cerebral artery | 230 | [55] |
| 18 | chicken | high (1.2%) Ca diet | normal (0.8%) Ca diet | kidney | 92 | [56] |
| 19 | chicken | cold stress with salt diet | healthy chicken | pulmonary arteries | 18 | [57] |
| Σ | 4 species | 14 animal models of human hypertension | 14 tissues | 4216 | ||
| # | Hypertensive | Normotensive | Tissue | NDEG | Ref. |
|---|---|---|---|---|---|
| 1 | renal medullary hypertension | norm | renal medulla | 13 | [26] |
| 2 | pulmonary arterial hypertension | norm | lung | 49 | [27] |
| 3 | pulmonary arterial hypertension | norm | lung | 119 | [28] |
| 4 | men with pulmonary arterial hypertension | normal men | blood | 14 | [29] |
| 5 | women with pulmonary arterial hypertension | normal women | blood | 15 | [29] |
| 6 | pulmonary hypertension during pulmonary fibrosis | norm | lung | 3520 | [30] |
| 7 | BMPR2-deficient human cells | normal cells | pulmonary artery endothelial cells | 483 | [31] |
| 8 | preeclampsia | normal pregnant | placenta | 1228 | [32] |
| 9 | preeclampsia | normal pregnant | placenta | 10 | [33] |
| 10 | preeclampsia | normal pregnant | venous blood | 64 | [34] |
| 11 | preeclampsia | normal pregnant | decidua basalis | 372 | [35] |
| 12 | excessive miR-210 in SWAN-71 cells | normal SWAN-71 cells | trophoblast cell line SWAN-71 | 19 | [36] |
| 13 | hypertension-induced nephrosclerosis | norm | kidney | 16 | [37] |
| 14 | hypertension-related pre-invasive squamous cancer | normal cells, the same biopsies | squamous lung cancer cells | 119 | [38] |
| 15 | hypertension-induced atrial fibrillation | norm | auricle tissue biopsy | 300 | [39] |
| 16 | hypertension-induced coronary artery disease | norm | peripheral blood | 1524 | [39] |
| Σ | 10 human hypertension-related disorders | 12 tissues | 7865 | ||
| Rat Gene | Total Number of DEGs | Binomial Distribution | Rat Gene | Total Number of DEGs | Binomial Distribution | ||||||
|---|---|---|---|---|---|---|---|---|---|---|---|
| # | Symbol | NPC1: Opposite Signs | NPC2: Matching Signs | p | PADJ | # | Symbol | NPC1: Opposite Signs | NPC2: Matching Signs | p | PADJ |
| i | ii | iii | iv | v | vi | i | ii | iii | iv | v | vi |
| 1 | Alb | 1 | 1 | 0.75 | 1.00 | 22 | Pcdhga1 | 1 | 1 | 0.75 | 1.00 |
| 2 | Aqp1 | 6 | 6 | 0.61 | 1.00 | 23 | Pdyn | 0 | 0 | ND | ND |
| 3 | Ascl3 | 1 | 1 | 0.75 | 1.00 | 24 | Pla2g2d | 19 | 12 | 0.14 | 1.00 |
| 4 | Bag3 | 2 | 2 | 0.69 | 1.00 | 25 | Pla2g5 | 19 | 12 | 0.14 | 1.00 |
| 5 | Baiap2l1 | 1 | 0 | 0.50 | 1.00 | 26 | Plod1 | 3 | 1 | 0.31 | 1.00 |
| 6 | Bdh1 | 2 | 0 | 0.25 | 1.00 | 27 | Ppp1r3b | 2 | 3 | 0.50 | 1.00 |
| 7 | Cckbr | 1 | 0 | 0.50 | 1.00 | 28 | Prlr | 0 | 1 | 0.50 | 1.00 |
| 8 | Cspg4b | 0 | 0 | ND | ND | 29 | Pygl | 0 | 1 | 0.50 | 1.00 |
| 9 | Defb17 | 2 | 3 | 0.50 | 1.00 | 30 | Rbm3 | 15 | 12 | 0.35 | 1.00 |
| 10 | Enpp2 | 3 | 8 | 0.11 | 1.00 | 31 | Retsat | 5 | 2 | 0.23 | 1.00 |
| 11 | Frem1 | 1 | 1 | 0.75 | 1.00 | 32 | Slc16a12 | 7 | 6 | 0.50 | 1.00 |
| 12 | Gpd1 | 4 | 1 | 0.19 | 1.00 | 33 | Slc4a5 | 7 | 5 | 0.83 | 1.00 |
| 13 | Hbb-b1 | 24 | 3 | 10−4 | 10−3 | 34 | Smoc2 | 3 | 1 | 0.31 | 1.00 |
| 14 | Hnf4a | 0 | 0 | ND | ND | 35 | Spint1 | 1 | 1 | 0.75 | 1.00 |
| 15 | Htr2c | 3 | 3 | 0.65 | 1.00 | 36 | Sulf1 | 0 | 0 | ND | ND |
| 16 | Krt2 | 22 | 13 | 0.09 | 1.00 | 37 | Sync | 0 | 0 | ND | ND |
| 17 | Lilrb3l | 10 | 1 | 10−2 | 0.24 | 38 | Tc2n | 2 | 0 | 0.25 | 1.00 |
| 18 | Lypd1 | 11 | 7 | 0.24 | 1.00 | 39 | Tecta | 0 | 1 | 0.50 | 1.00 |
| 19 | Morn1 | 0 | 4 | 0.06 | 1.00 | 40 | Tmem60 | 0 | 0 | ND | ND |
| 20 | Myom2 | 2 | 1 | 0.50 | 1.00 | 41 | Txnrd2 | 2 | 0 | 0.25 | 1.00 |
| 21 | Pcdhb9 | 10 | 0 | 10−3 | 0.05 | 42 | Ucp2 | 1 | 1 | 0.75 | 1.00 |
| # | Species | Hypertensive | Normotensive | Tissue | DEG | log2 | PADJ | Ref. |
|---|---|---|---|---|---|---|---|---|
| i | ii | iii | iv | v | v | vi | vii | viii |
| 1 | rat | ISIAH | WAG | brain stem | Hbb-b1 | 1.42 | 10−2 | [43] |
| 2 | rat | ISIAH | WAG | hypothalamus | Hbb-b1 | 2.02 | 10−2 | [44] |
| 3 | rat | ISIAH | WAG | renal medulla | Hbb-b1 | 1.18 | 10−2 | [45] |
| 4 | rat | ISIAH | WAG | adrenal gland | Hbb-b1 | 1.32 | 10−2 | [47] |
| 5 | rat | ISIAH | WAG | adrenal gland | Hba2 | 0.69 | 10−2 | [47] |
| 6 | rat | ISIAH | WAG | adrenal gland | Hbb | 2.02 | 10−2 | [47] |
| 7 | rat | ISIAH | WAG | adrenal gland | Hbb-m | 3.78 | 10−2 | [47] |
| 8 | rat | ISIAH | WAG | brain stem | Hba2 | 0.58 | 0.05 | [43] |
| 9 | rat | ISIAH | WAG | brain stem | Hbb | 1.88 | 10−2 | [43] |
| 10 | rat | ISIAH | WAG | brain stem | Hbb-m | 3.65 | 10−2 | [43] |
| 11 | rat | ISIAH | WAG | hypothalamus | Hba1 | 1.14 | 10−2 | [44] |
| 12 | rat | ISIAH | WAG | hypothalamus | Hba2 | 1.32 | 10−2 | [44] |
| 13 | rat | ISIAH | WAG | hypothalamus | Hbb | 3.23 | 10−2 | [44] |
| 14 | rat | ISIAH | WAG | hypothalamus | Hbb-m | 1.09 | 10−2 | [44] |
| 15 | rat | ISIAH | WAG | renal medulla | Hbb | −0.68 | 10−2 | [45] |
| 16 | rat | ISIAH | WAG | renal medulla | Hbb-m | 2.72 | 10−2 | [45] |
| 17 | rat | ISIAH | WAG | renal medulla | Hbb-s | 2.38 | 10−2 | [45] |
| 18 | human | preeclampsia | norm | placenta | HBD | −0.63 | 10−3 | [32] |
| 19 | human | pulmonary hypertension during pulmonary fibrosis | norm | lungs | HBD | −2.83 | 10−3 | [30] |
| 20 | human | pulmonary hypertension | norm | lungs | HBA1 | 2.08 | 10−9 | [28] |
| 21 | human | pulmonary hypertension | norm | lungs | HBB | 2.46 | 10−10 | [28] |
| 22 | human | HT-induced coronary disease | norm | peripheral blood | HBBP1 | 1.03 | 0.05 | [39] |
| 23 | human | HT-induced coronary disease | norm | peripheral blood | HBE1 | 1.42 | 0.05 | [39] |
| 24 | human | HT-induced coronary disease | norm | peripheral blood | HBG2 | 4.49 | 0.05 | [39] |
| 25 | human | HT-induced coronary disease | norm | peripheral blood | HBM | 5.33 | 0.05 | [39] |
| 26 | human | HT-induced coronary disease | norm | peripheral blood | HBQ1 | 3.10 | 0.05 | [39] |
| 27 | human | HT-induced atrial fibrillation | norm | auricle tissue biopsy | HBA2 | 2.37 | 10−2 | [39] |
| 28 | rat | ISIAH | WAG | brain stem | Pcdhb7 | 1.60 | 10−2 | [43] |
| 29 | mouse | BPH/2J | BPN/3J | kidneys | Pcdhb16 | 1.22 | 10−3 | [54] |
| 30 | human | pulmonary hypertension during pulmonary fibrosis | norm | lungs | PCDHB10 | 1.89 | 10−2 | [30] |
| 31 | human | pulmonary hypertension during pulmonary fibrosis | norm | lungs | PCDHB15 | 1.47 | 10−4 | [30] |
| 32 | human | pulmonary hypertension during pulmonary fibrosis | norm | lungs | PCDHB16 | 1.38 | 10−4 | [30] |
| 33 | human | pulmonary hypertension during pulmonary fibrosis | norm | lungs | PCDHB17P | 1.21 | 10−2 | [30] |
| 34 | human | pulmonary hypertension during pulmonary fibrosis | norm | lungs | PCDHB4 | 2.93 | 10−4 | [30] |
| 35 | human | pulmonary hypertension during pulmonary fibrosis | norm | lungs | PCDHB6 | 1.35 | 10−2 | [30] |
| 36 | human | HT-induced coronary disease | norm | peripheral blood | PCDHB11 | 1.12 | 0.05 | [39] |
| 37 | human | HT-induced coronary disease | norm | peripheral blood | PCDHB13 | 1.04 | 0.05 | [39] |
| # | Domestic Animals | Wild Animals | Tissue | NDEG | Ref. |
|---|---|---|---|---|---|
| 1 | tame rats | aggressive rats | hypothalamus | 46 | [72] |
| 2 | tame rats | aggressive rats | frontal cortex | 20 | [187] |
| 3 | guinea pigs | cavy | frontal cortex | 883 | [187] |
| 4 | domestic rabbits | wild rabbits | frontal cortex | 17 | [187] |
| 5 | domestic rabbits | wild rabbits | parietal-temporal cortex | 216 | [188] |
| 6 | domestic rabbits | wild rabbits | amygdala | 118 | [188] |
| 7 | domestic rabbits | wild rabbits | hypothalamus | 43 | [188] |
| 8 | domestic rabbits | wild rabbits | hippocampus | 100 | [188] |
| 9 | dogs | wolves | blood | 450 | [189] |
| 10 | dogs | wolves | frontal cortex | 13 | [187] |
| 11 | tame foxes | aggressive foxes | pituitary | 327 | [190] |
| 12 | pigs | boars | frontal cortex | 30 | [187] |
| 13 | pigs | boars | frontal cortex | 34 | [191] |
| 14 | pigs | boars | pituitary | 22 | [192] |
| 15 | domestic chicken | wild chicken | pituitary | 474 | [193] |
| Σ | 7 domestic animal species | 7 wild animal species | 8 tissues | 2393 |
| (a) Humans | (b) Animals | |||||||||
|---|---|---|---|---|---|---|---|---|---|---|
| Gene | Effect of Gene Expression Changes on Hypertension (HT): Hypertensive (→) or Normotensive (←) | RNA-Seq | Effect of Gene Expression Changes during Divergence from the Most Recent Common Ancestor | Ref. | ||||||
| Downregulation | HT | Upregulation | HT | DEG | log2 | Downregulation | Upregulation | Tissue | ||
| i | ii | iii | iv | v | vi | vii | viii | ix | x | xi |
| HBB, HBD | low blood viscosity [199] | ← | high-altitude environment provokes hyperhemoglobinemia and hypertension [103] | → | Hbb-b1 | −6.19 | tame rat | aggressive rat | hippocampus | [this work] |
| Hbb-b1 | −3.97 | tame rat | aggressive rat | hypothalamus | [72] | |||||
| Hbbl | −5.92 | dogs | wolves | blood | [189] | |||||
| Hba1 | −4.06 | dogs | wolves | blood | [189] | |||||
| Hbad | −1.07 | domestic chickens | wild chickens | pituitary | [193] | |||||
| Hbm | −6.46 | dogs | wolves | blood | [189] | |||||
| Hbz1 | −7.10 | dogs | wolves | blood | [189] | |||||
| PCDHB9 | wide vascular inner diameter [200] | ← | higher risks of gastric cancer [93], surgical removal of which relieves hypertension [12] | → | Pcdhb9 | −1.03 | tame rat | aggressive rat | hippocampus | [this work] |
| Pcdhb9 | −1.01 | tame rat | aggressive rat | hypothalamus | [72] | |||||
| Pcdhb15 | −1.04 | domestic rabbits | wild rabbits | parietal-temporal cortex | [188] | |||||
| (a) Humans | Effect of Expression Changes of Genes Encoding Hemoglobin Subunits and β-Protocadherins in Patients | Binomial Distribution | Pearson’s χ2 Test | Fisher’s Exact Test | |||
|---|---|---|---|---|---|---|---|
| (b) Animals | Hypertensive | Normotensive | χ2 | p | |||
| Effect of expression changes of genes encoding hemoglobin subunits and β-protocadherins during animal microevolution | wild | 10 | 0 | 10−4 | 20.00 | 10−3 | 10−5 |
| domestic | 0 | 10 | 10−4 | ||||
| Data: GRCh38, dbSNP rel. 153 [210] | H0: Neutral Drift [229,230] | H0: “→HT and ←HT Equivalence” | |||||||
|---|---|---|---|---|---|---|---|---|---|
| SNPs | NGENE | NSNP | NRES | N> | N< | p(H0: N> < N<) [227] | N→HT | N←HT | p(H0: N→HT ≡ N←HT ) |
| Whole-genome norm for SNPs of TBP sites [228] | 104 | 105 | 103 | 200 | 800 | >0.99 | - | - | - |
| HT-related candidate SNP markers at TBP sites [this work] | 3 | 85 | 27 | 8 | 19 | >0.99 | 8 | 19 | <0.05 |
| No. | Gene | Forward, 5′→3′ | Reverse, 5′→3′ |
|---|---|---|---|
| DEGs identified in hippocampus of tame versus aggressive adult male rats [this work] | |||
| 1 | Ascl3 | CCTCTGCTGCCCTTTTCCAG | ACTTGACTCGCTGCCTCTCT |
| 2 | Defb17 | TGGTAGCTTGGACTTGAGGAAAGAA | TGCAGCAGTGTGTTCCAGGTC |
| Reference genes | |||
| 3 | B2m | GTGTCTCAGTTCCACCCACC | TTACATGTCTCGGTCCCAGG |
| 4 | Hprt1 | TCCCAGCGTCGTGATTAGTGA | CCTTCATGACATCTCGAGCAAG |
| 5 | Ppia | TTCCAGGATTCATGTGCCAG | CTTGCCATCCAGCCACTC |
| 6 | Rpl30 | CATCTTGGCGTCTGATCTTG | TCAGAGTCTGTTTGTACCCC |
Publisher’s Note: MDPI stays neutral with regard to jurisdictional claims in published maps and institutional affiliations. |
© 2022 by the authors. Licensee MDPI, Basel, Switzerland. This article is an open access article distributed under the terms and conditions of the Creative Commons Attribution (CC BY) license (https://creativecommons.org/licenses/by/4.0/).
Share and Cite
Oshchepkov, D.; Chadaeva, I.; Kozhemyakina, R.; Zolotareva, K.; Khandaev, B.; Sharypova, E.; Ponomarenko, P.; Bogomolov, A.; Klimova, N.V.; Shikhevich, S.; et al. Stress Reactivity, Susceptibility to Hypertension, and Differential Expression of Genes in Hypertensive Compared to Normotensive Patients. Int. J. Mol. Sci. 2022, 23, 2835. https://doi.org/10.3390/ijms23052835
Oshchepkov D, Chadaeva I, Kozhemyakina R, Zolotareva K, Khandaev B, Sharypova E, Ponomarenko P, Bogomolov A, Klimova NV, Shikhevich S, et al. Stress Reactivity, Susceptibility to Hypertension, and Differential Expression of Genes in Hypertensive Compared to Normotensive Patients. International Journal of Molecular Sciences. 2022; 23(5):2835. https://doi.org/10.3390/ijms23052835
Chicago/Turabian StyleOshchepkov, Dmitry, Irina Chadaeva, Rimma Kozhemyakina, Karina Zolotareva, Bato Khandaev, Ekaterina Sharypova, Petr Ponomarenko, Anton Bogomolov, Natalya V. Klimova, Svetlana Shikhevich, and et al. 2022. "Stress Reactivity, Susceptibility to Hypertension, and Differential Expression of Genes in Hypertensive Compared to Normotensive Patients" International Journal of Molecular Sciences 23, no. 5: 2835. https://doi.org/10.3390/ijms23052835