
Effect of Different Parameters of In Vitro Static Tensile Strain on Human Periodontal Ligament Cells Simulating the Tension Side of Orthodontic Tooth Movement

 ,
,  , ,
, ,
Abstract
:1. Introduction
2. Results
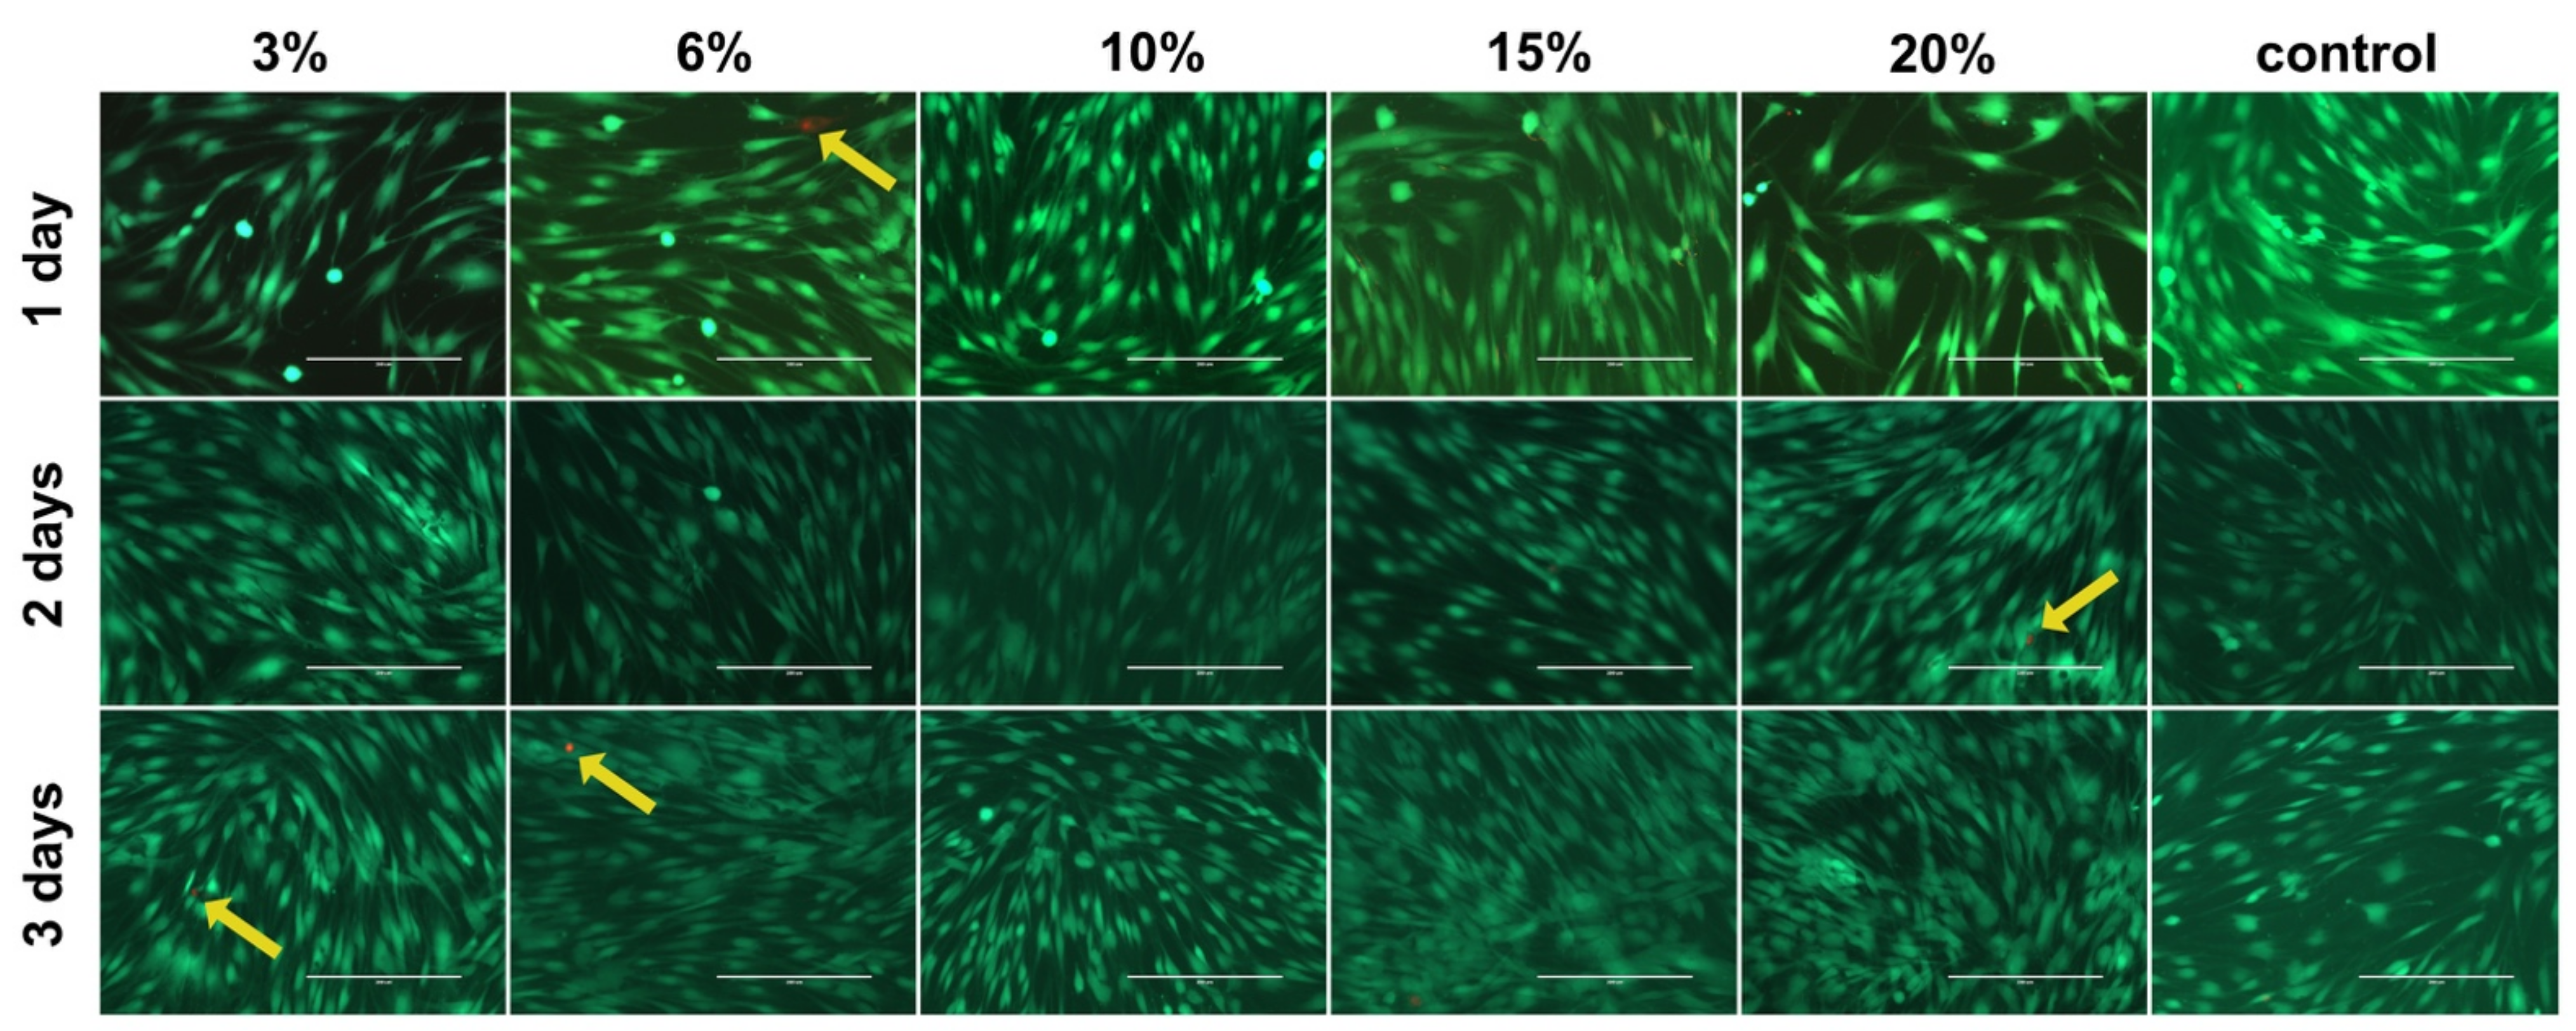
2.1. Cell Viability
2.2. Reference Gene Selection
2.3. Expression of Target Genes
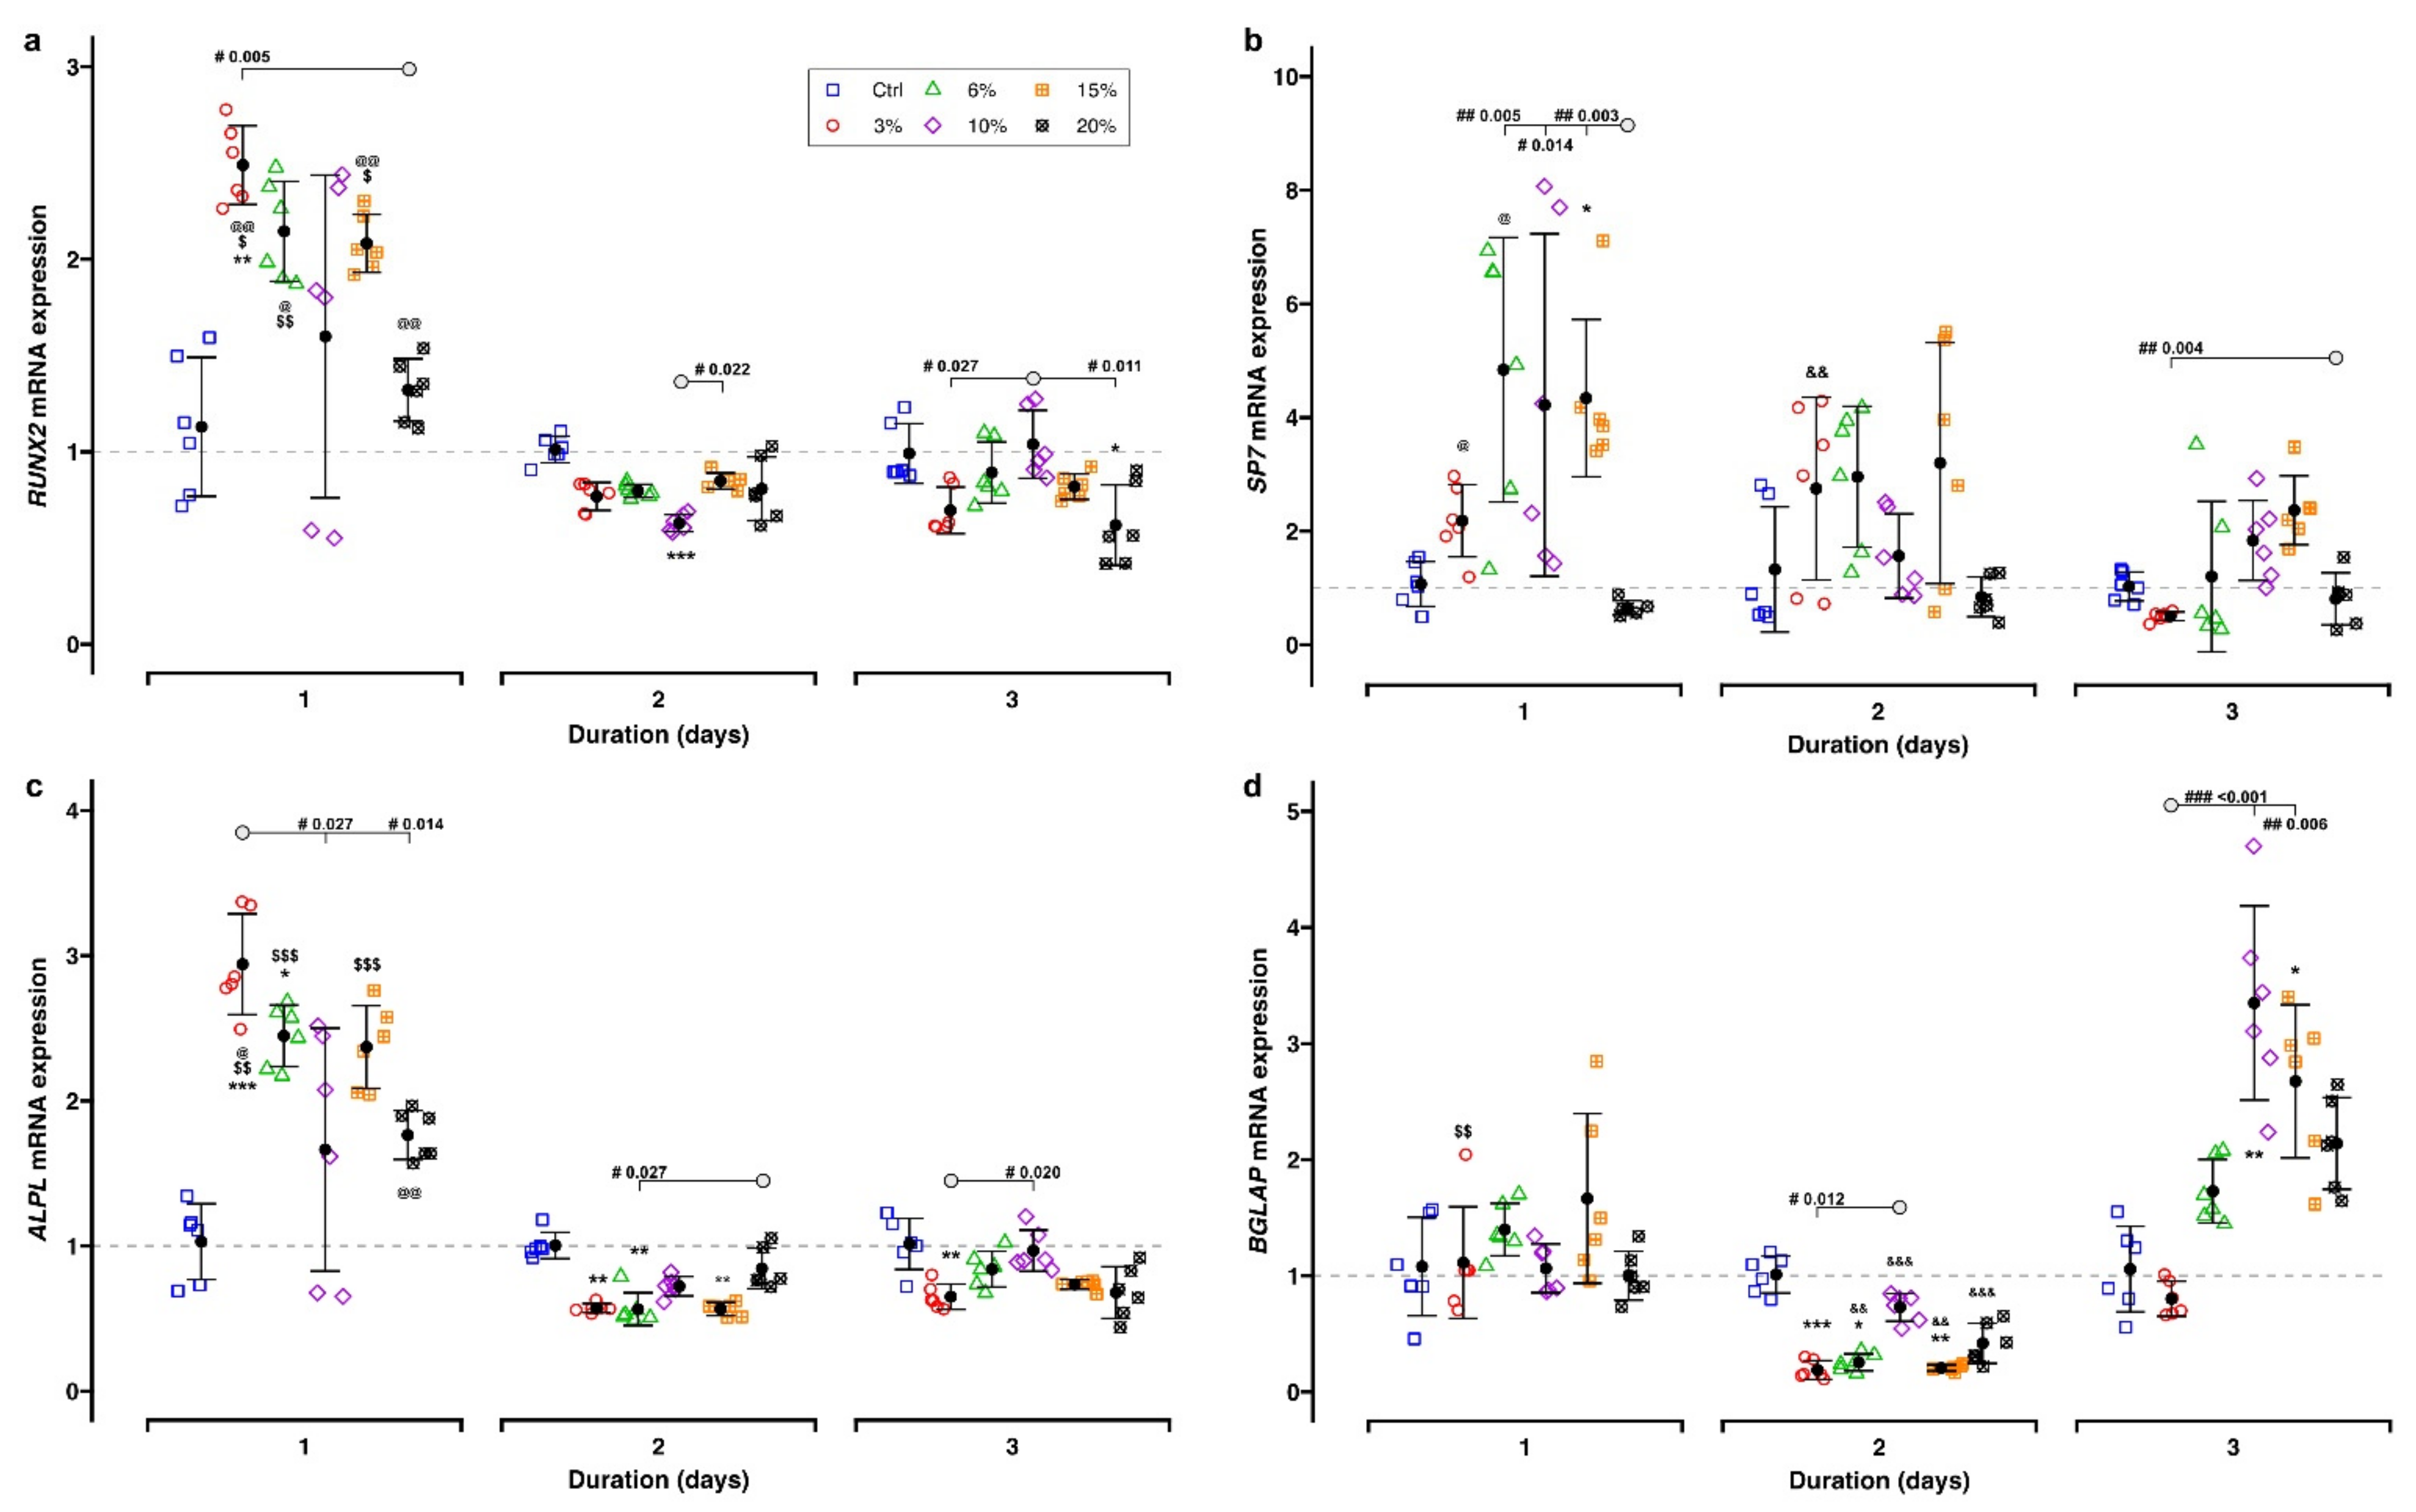
2.3.1. Bone-Remodeling-Related Target Genes
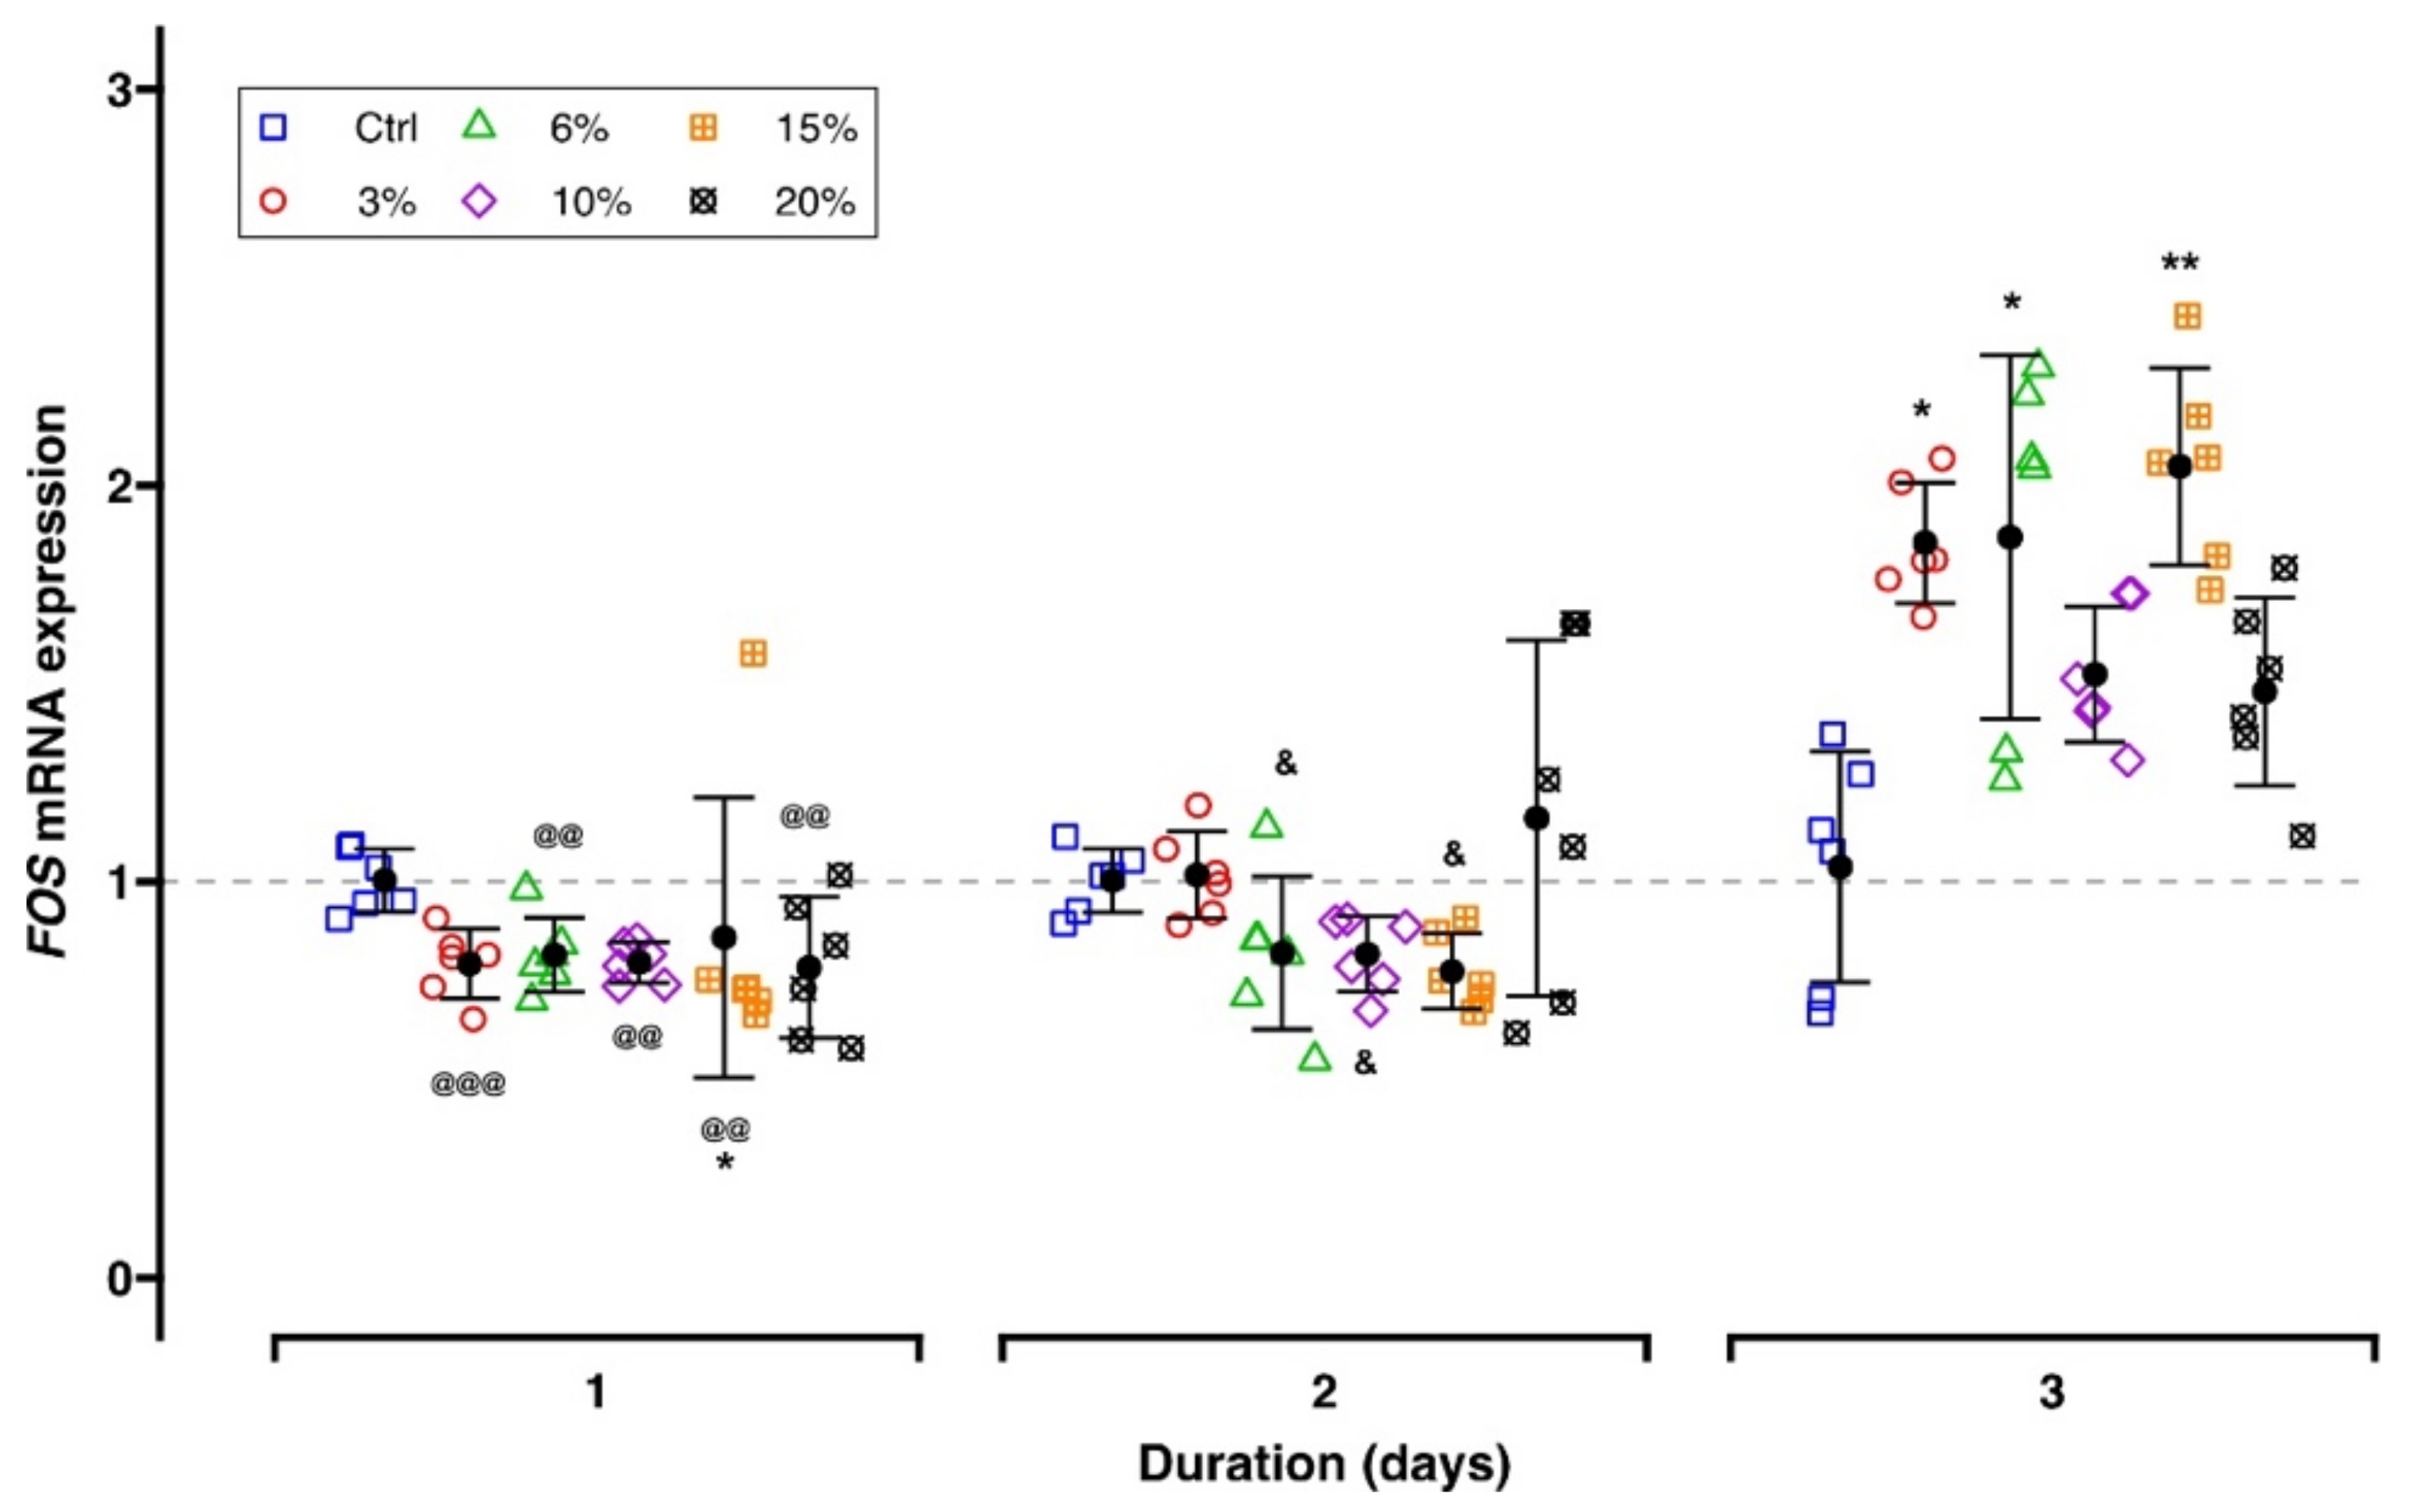
2.3.2. Mechanosensation-Related Target Genes
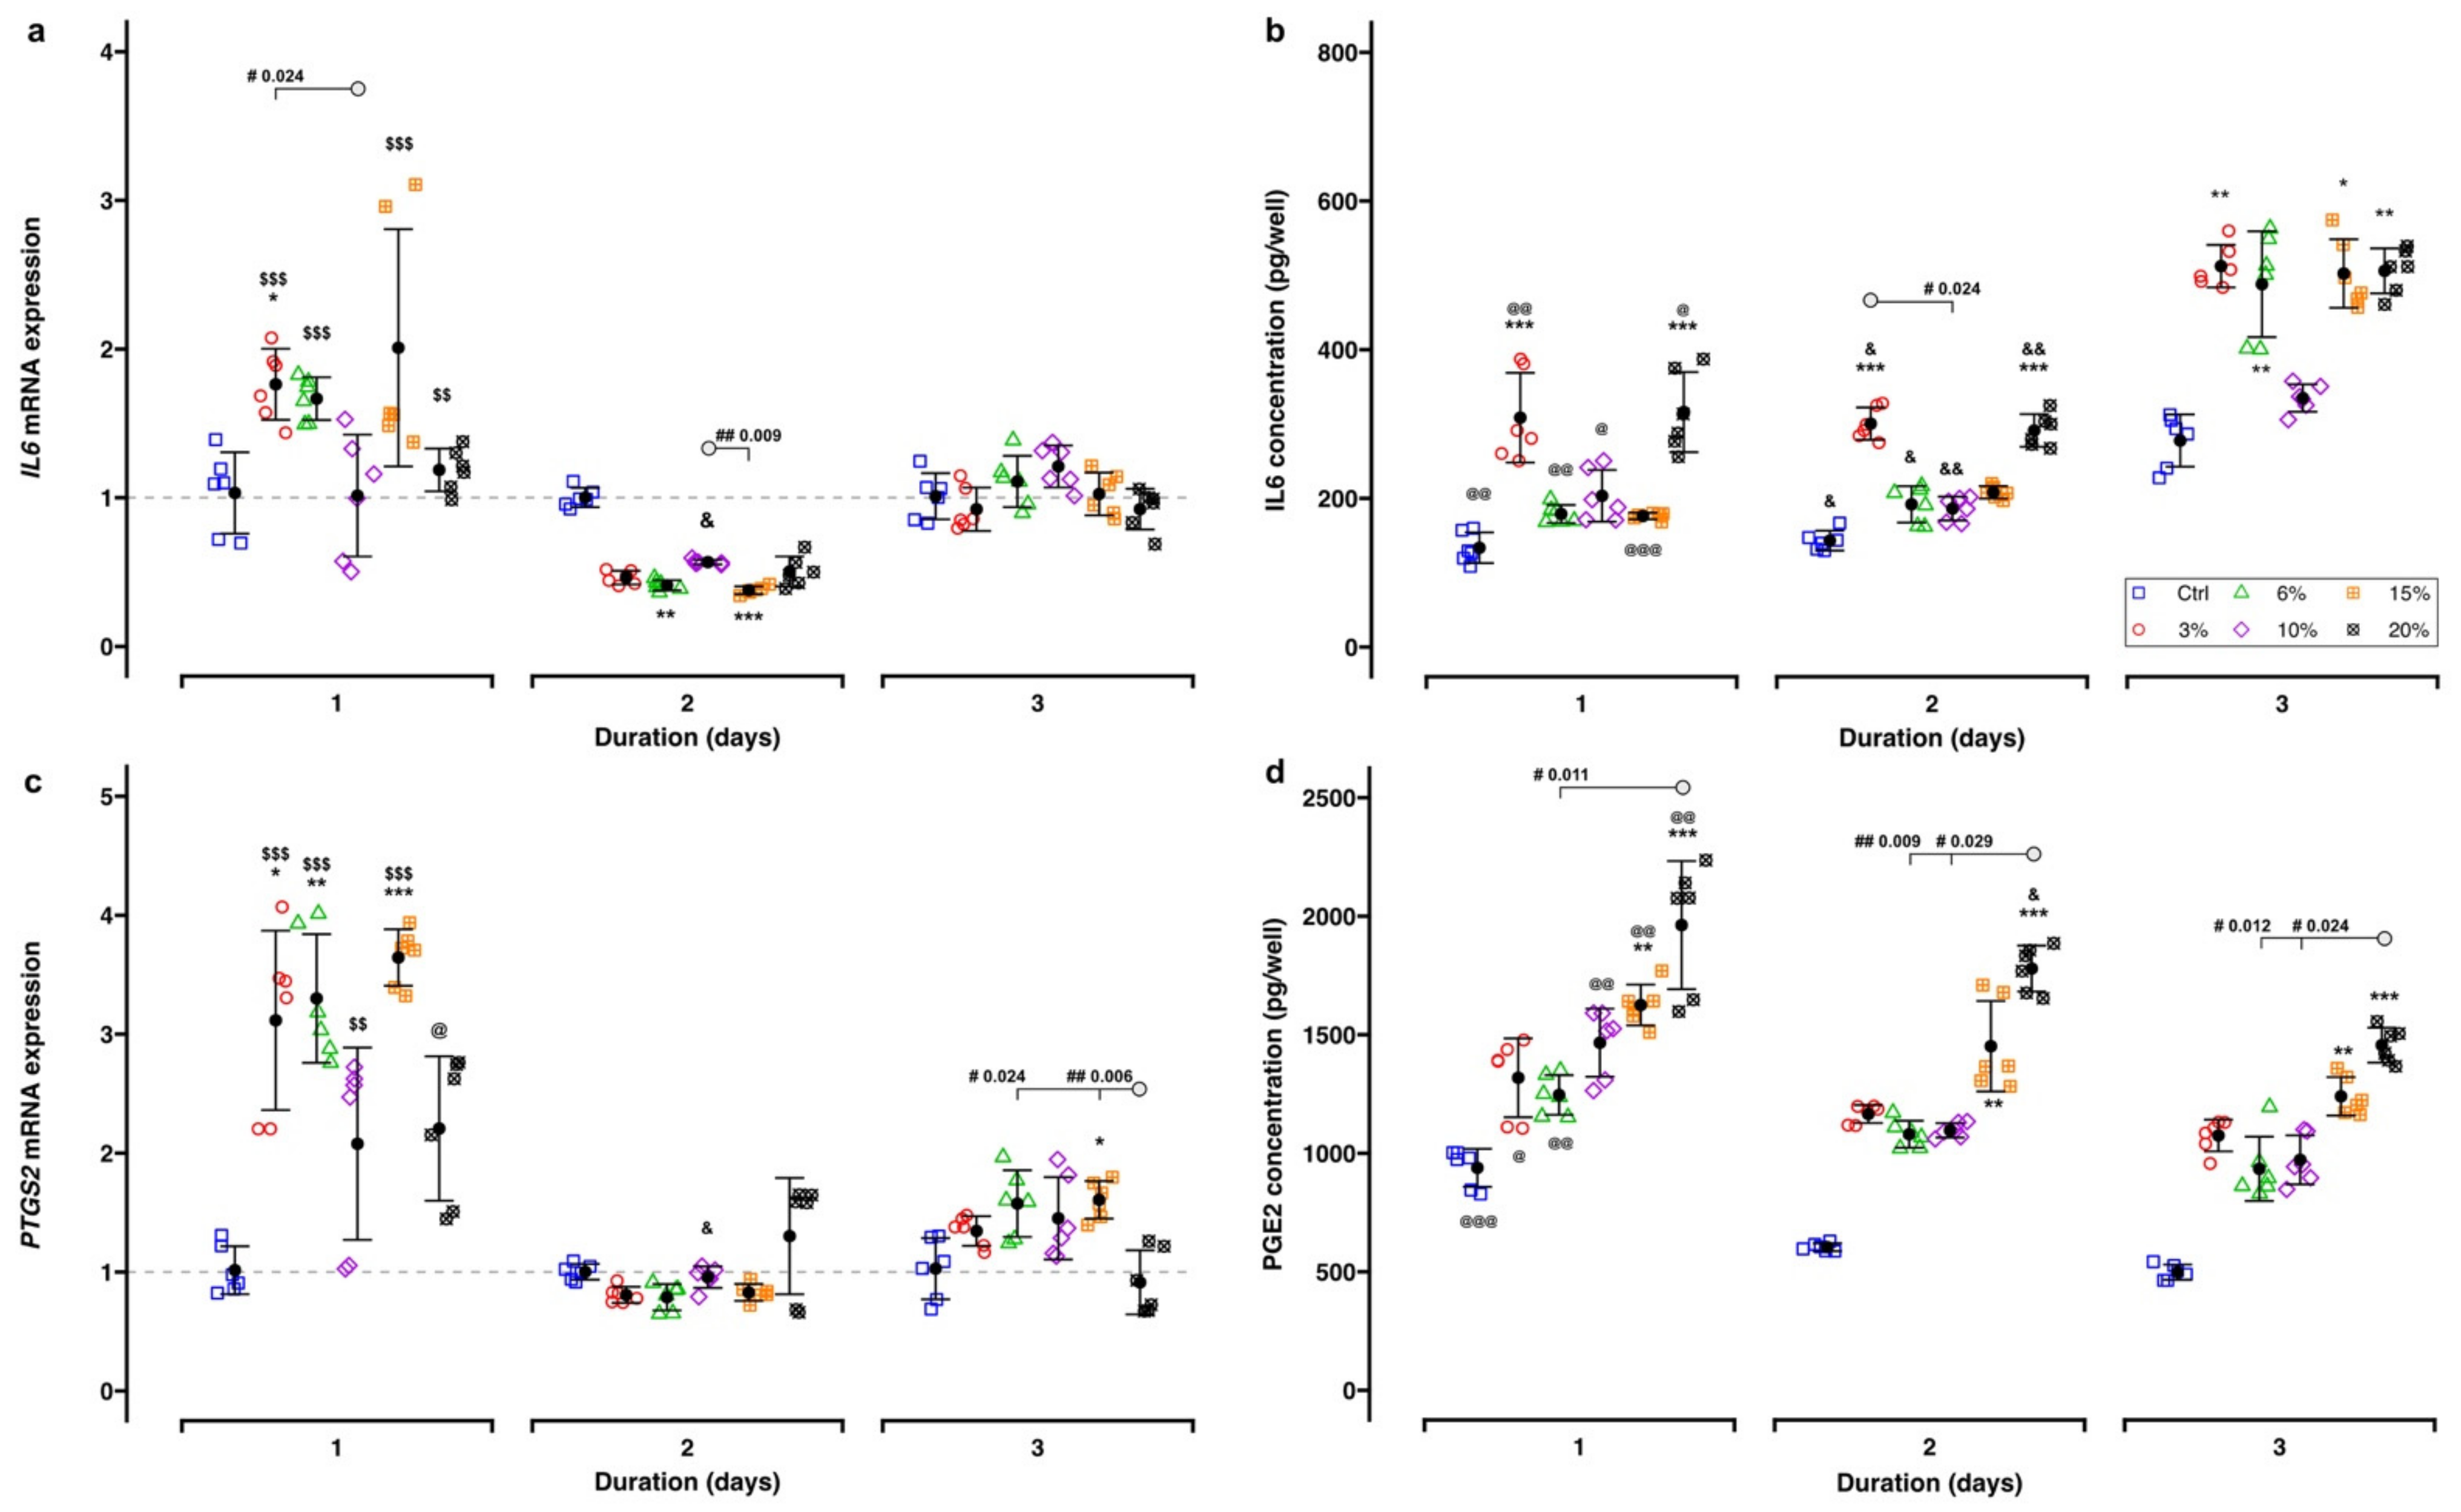
2.3.3. Inflammation-Related Target Genes
3. Discussion
3.1. Selection of Tensile Strain Parameters
3.2. Effect of Different Parameters of Tensile Strain on Bone Remodeling
3.3. Effect of Different Parameters of Tensile Strain on Mechanosensing
3.4. Effect of Different Parameters of Tensile Strain on Inflammation
3.5. Clinical Relevance
3.6. Strengths and Limitations of the Study
4. Materials and Methods
4.1. Primary Cell Culture
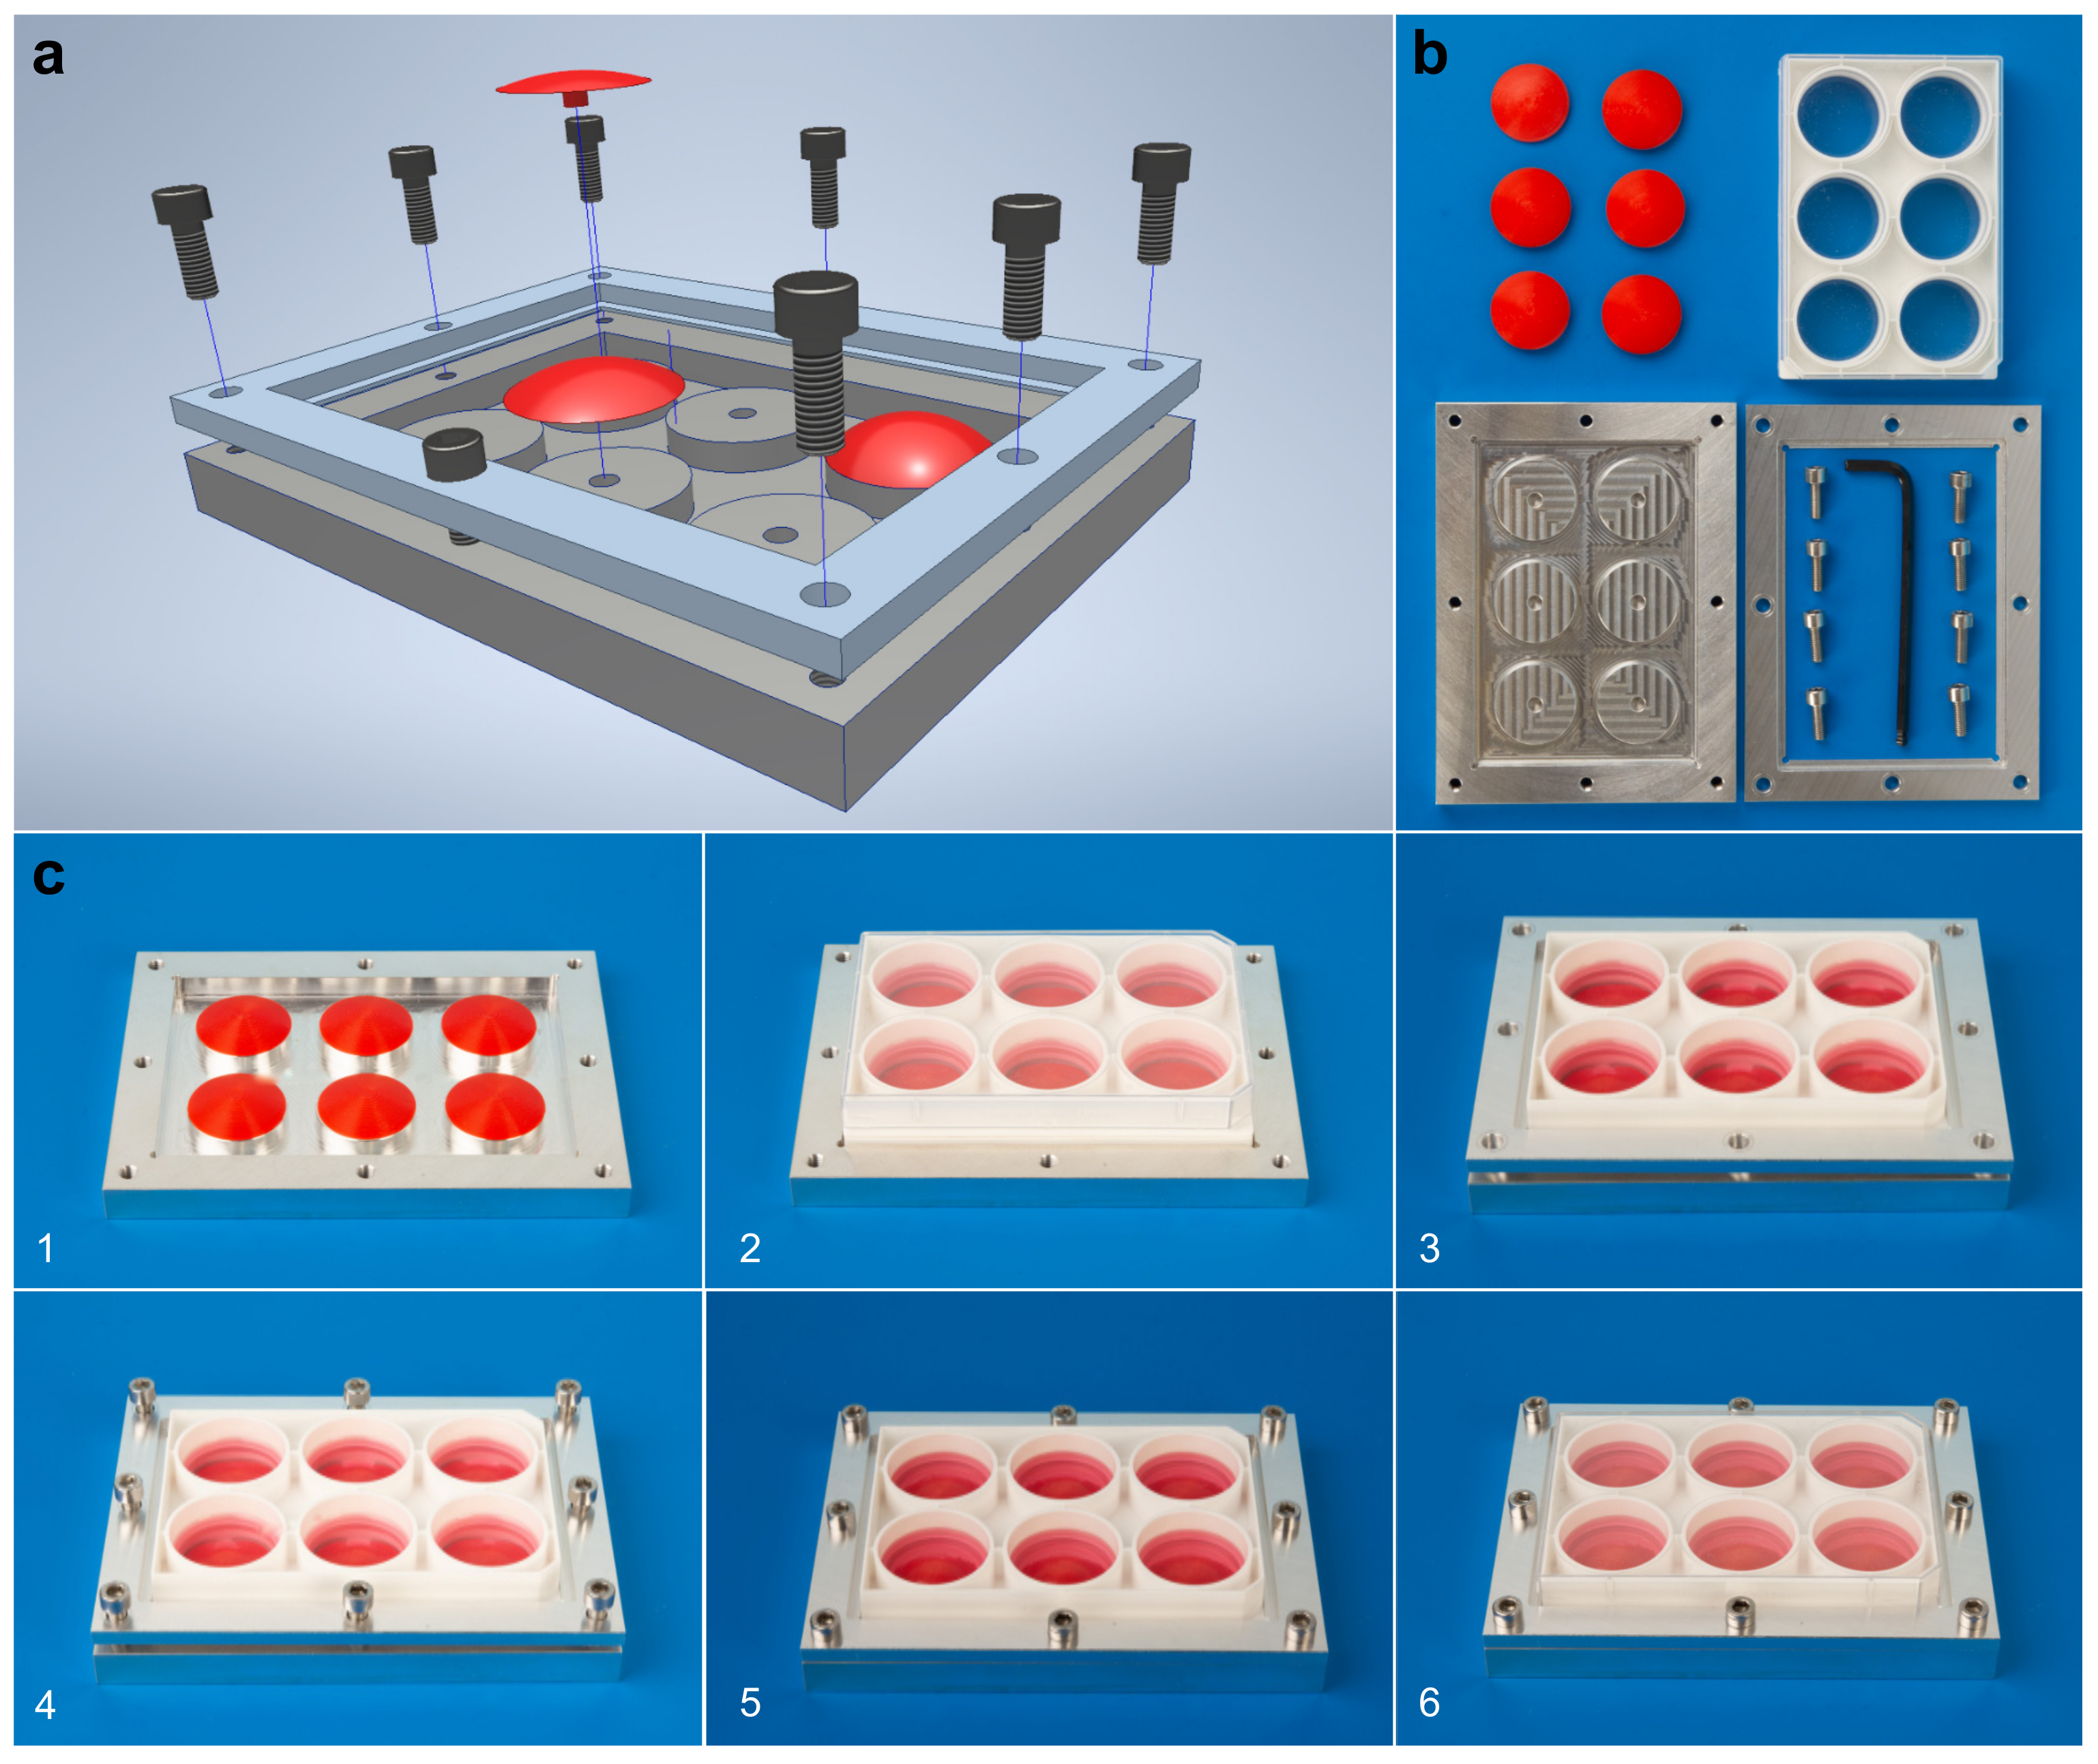
4.2. Tensile Strain Application Using a Custom-Made Tension Apparatus
4.3. Cell Viability
4.4. Sample Preparation
4.5. Gene Expression Analysis
4.6. Enzyme-Linked Immunosorbent Assay
4.7. Statistics
5. Conclusions
Supplementary Materials
Author Contributions
Funding
Institutional Review Board Statement
Informed Consent Statement
Data Availability Statement
Acknowledgments
Conflicts of Interest
Abbreviations
| ALPL | Alkaline phosphatase, biomineralization associated |
| BGLAP | Bone gamma-carboxyglutamate protein |
| ELISA | Enzyme-linked immunosorbent assay |
| FC | Fold change |
| IL10 | Interleukin 10 |
| IL1B | Interleukin 1B |
| IL6 | Interleukin 6 |
| IL8 | Interleukin 8 |
| KW | Kruskal-Wallis test |
| MIQE | Minimum Information for Publication of Quantitative Real-Time PCR Experiment |
| OPG | Osteoprotegerin |
| OTM | Orthodontic teeth movement |
| Padj. | Adjusted P |
| PDL | Periodontal ligament |
| PDLCs | Periodontal ligament cells |
| PGE2 | Prostaglandin E2 |
| PTGS2 | Prostaglandin-endoperoxide synthase 2 |
| qPCR | Quantitative real-time polymerase chain reaction |
| RANKL | Receptor activator of the nuclear factor kappa ligand |
| RT-qPCR | Reverse transcription qPCR |
| RUNX2 | Runt-related transcription factor 2 |
| SD | Standard deviation |
| TNF | Tumor necrosis factor α |
| TNFRSF11B | Tumor necrosis factor-alpha receptor superfamily member 11B |
References
- Wichelhaus, A. Orthodontic Therapy—Fundamental Treatment Concepts; Georg Thieme: New York, NY, USA, 2017. [Google Scholar]
- Pavasant, P.; Yongchaitrakul, T. Role of mechanical stress on the function of periodontal ligament cells. Periodontology 2000 2011, 56, 154–165. [Google Scholar] [CrossRef]
- Yamaguchi, M.; Kasai, K. Inflammation in periodontal tissues in response to mechanical forces. Arch. Immunol. Ther. Exp. 2005, 53, 388–398. [Google Scholar]
- Long, P.; Hu, J.; Piesco, N.; Buckley, M.; Agarwal, S. Low magnitude of tensile strain inhibits IL-1beta-dependent induction of pro-inflammatory cytokines and induces synthesis of IL-10 in human periodontal ligament cells in vitro. J. Dent. Res. 2001, 80, 1416–1420. [Google Scholar] [CrossRef]
- Zeichner-David, M. Genetic influences on orthodontic tooth movement. In Biological Mechanisms of Tooth Movement, 2nd ed.; Krishnan, V., Davidovitch, Z., Eds.; Wiley: Chichester, UK, 2015; pp. 145–163. [Google Scholar]
- Li, L.; Han, M.; Li, S.; Wang, L.; Xu, Y. Cyclic tensile stress during physiological occlusal force enhances osteogenic differentiation of human periodontal ligament cells via ERK1/2-Elk1 MAPK pathway. DNA Cell Biol. 2013, 32, 488–497. [Google Scholar] [CrossRef] [PubMed] [Green Version]
- Shi, J.; Folwaczny, M.; Wichelhaus, A.; Baumert, U. Differences in RUNX2 and P2RX7 gene expression between mono- and coculture of human periodontal ligament cells and human osteoblasts under compressive force application. Orthod. Craniofacial Res. 2019, 22, 168–176. [Google Scholar] [CrossRef] [PubMed]
- Nakashima, K.; Zhou, X.; Kunkel, G.; Zhang, Z.; Deng, J.M.; Behringer, R.R.; de Crombrugghe, B. The novel zinc finger-containing transcription factor osterix is required for osteoblast differentiation and bone formation. Cell 2002, 108, 17–29. [Google Scholar] [CrossRef] [Green Version]
- Rutkovskiy, A.; Stensløkken, K.O.; Vaage, I.J. Osteoblast Differentiation at a Glance. Med. Sci. Monit. Basic Res. 2016, 22, 95–106. [Google Scholar] [CrossRef] [Green Version]
- Boyce, B.F.; Xing, L. Biology of RANK, RANKL, and osteoprotegerin. Arthritis Res. Ther. 2007, 9 (Suppl. S1), S1. [Google Scholar] [CrossRef] [Green Version]
- Yamaguchi, N.; Chiba, M.; Mitani, H. The induction of c-fos mRNA expression by mechanical stress in human periodontal ligament cells. Arch. Oral Biol. 2002, 47, 465–471. [Google Scholar] [CrossRef]
- Krishnan, V.; Davidovitch, Z. Biology of orthodontic tooth movement. In Biological Mechanisms of Tooth Movement, 2nd ed.; Krishnan, V., Davidovitch, Z., Eds.; Wiley: Chichester, UK, 2015; pp. 15–29. [Google Scholar]
- Baumert, U.; Golan, I.; Becker, B.; Hrala, B.P.; Redlich, M.; Roos, H.A.; Palmon, A.; Reichenberg, E.; Müßig, D. Pressure simulation of orthodontic force in osteoblasts: A pilot study. Orthod. Craniofacial Res. 2004, 7, 3–9. [Google Scholar] [CrossRef] [PubMed]
- Janjic Rankovic, M.; Docheva, D.; Wichelhaus, A.; Baumert, U. Effect of static compressive force on in vitro cultured PDL fibroblasts: Monitoring of viability and gene expression over 6 days. Clin. Oral Investig. 2020, 24, 2497–2511. [Google Scholar] [CrossRef] [PubMed]
- Benjakul, S.; Jitpukdeebodintra, S.; Leethanakul, C. Effects of low magnitude high frequency mechanical vibration combined with compressive force on human periodontal ligament cells in vitro. Eur. J. Orthod. 2018, 40, 356–363. [Google Scholar] [CrossRef] [Green Version]
- Sun, C.; Janjic Rankovic, M.; Folwaczny, M.; Otto, S.; Wichelhaus, A.; Baumert, U. Effect of Tension on Human Periodontal Ligament Cells: Systematic Review and Network Analysis. Front. Bioeng. Biotechnol. 2021, 9, 695053. [Google Scholar] [CrossRef] [PubMed]
- Li, M.; Zhang, C.; Yang, Y. Effects of mechanical forces on osteogenesis and osteoclastogenesis in human periodontal ligament fibroblasts: A systematic review of in vitro studies. Bone Jt. Res. 2019, 8, 19–31. [Google Scholar] [CrossRef] [PubMed]
- Spitz, A.; Christovam, I.O.; Maranon-Vasquez, G.A.; Masterson, D.F.; Adesse, D.; Maia, L.C.; Bolognese, A.M. Global gene expression profile of periodontal ligament cells submitted to mechanical loading: A systematic review. Arch. Oral Biol. 2020, 118, 104884. [Google Scholar] [CrossRef] [PubMed]
- Zhao, D.; Wu, Y.; Xu, C.; Zhang, F. Cyclic-stretch induces apoptosis in human periodontal ligament cells by activation of caspase-5. Arch. Oral Biol. 2017, 73, 129–135. [Google Scholar] [CrossRef]
- Wang, L.; Yang, X.; Wan, L.; Wang, S.; Pan, J.; Liu, Y. ARHGAP17 inhibits pathological cyclic strain-induced apoptosis in human periodontal ligament fibroblasts via Rac1/Cdc42. Clin. Exp. Pharmacol. Physiol. 2020, 47, 1591–1599. [Google Scholar] [CrossRef] [PubMed]
- Zhao, D.; Wu, Y.; Zhuang, J.; Xu, C.; Zhang, F. Activation of NLRP1 and NLRP3 inflammasomes contributed to cyclic stretch-induced pyroptosis and release of IL-1beta in human periodontal ligament cells. Oncotarget 2016, 7, 68292–68302. [Google Scholar] [CrossRef] [Green Version]
- Yoshino, H.; Morita, I.; Murota, S.I.; Ishikawa, I. Mechanical stress induces production of angiogenic regulators in cultured human gingival and periodontal ligament fibroblasts. J. Periodontal Res. 2003, 38, 405–410. [Google Scholar] [CrossRef]
- Yang, Y.; Wang, B.K.; Chang, M.L.; Wan, Z.Q.; Han, G.L. Cyclic Stretch Enhances Osteogenic Differentiation of Human Periodontal Ligament Cells via YAP Activation. Biomed Res. Int. 2018, 2018, 2174824. [Google Scholar] [CrossRef]
- Zhuang, J.; Wang, Y.; Qu, F.; Wu, Y.; Zhao, D.; Xu, C. Gasdermin-d Played a Critical Role in the Cyclic Stretch-Induced Inflammatory Reaction in Human Periodontal Ligament Cells. Inflammation 2019, 42, 548–558. [Google Scholar] [CrossRef] [PubMed]
- Cho, J.H.; Lee, S.K.; Lee, J.W.; Kim, E.C. The role of heme oxygenase-1 in mechanical stress- and lipopolysaccharide-induced osteogenic differentiation in human periodontal ligament cells. Angle Orthod. 2010, 80, 552–559. [Google Scholar] [CrossRef] [PubMed]
- Liu, J.; Li, Q.; Liu, S.; Gao, J.; Qin, W.; Song, Y.; Jin, Z. Periodontal Ligament Stem Cells in the Periodontitis Microenvironment Are Sensitive to Static Mechanical Strain. Stem Cells Int. 2017, 2017, 1380851. [Google Scholar] [CrossRef]
- Long, P.; Liu, F.; Piesco, N.P.; Kapur, R.; Agarwal, S. Signaling by mechanical strain involves transcriptional regulation of proinflammatory genes in human periodontal ligament cells in vitro. Bone 2002, 30, 547–552. [Google Scholar] [CrossRef] [Green Version]
- Agarwal, S.; Long, P.; Seyedain, A.; Piesco, N.; Shree, A.; Gassner, R. A central role for the nuclear factor-κB pathway in anti-inflammatory and proinflammatory actions of mechanical strain. FASEB J. 2003, 17, 899–901. [Google Scholar] [CrossRef] [PubMed]
- Gilbert, J.A.; Weinhold, P.S.; Banes, A.J.; Link, G.W.; Jones, G.L. Strain profiles for circular cell culture plates containing flexible surfaces employed to mechanically deform cells in vitro. J. Biomech. 1994, 27, 1169–1177. [Google Scholar] [CrossRef]
- Bustin, S.A.; Benes, V.; Garson, J.A.; Hellemans, J.; Huggett, J.; Kubista, M.; Mueller, R.; Nolan, T.; Pfaffl, M.W.; Shipley, G.L.; et al. The MIQE guidelines: Minimum Information for publication of Quantitative real-time PCR Experiments. Clin. Chem. 2009, 55, 611–622. [Google Scholar] [CrossRef] [Green Version]
- Yang, L.; Yang, Y.; Wang, S.; Li, Y.; Zhao, Z. In vitro mechanical loading models for periodontal ligament cells: From two-dimensional to three-dimensional models. Arch. Oral Biol. 2015, 60, 416–424. [Google Scholar] [CrossRef]
- Li, L.; Han, M.X.; Li, S.; Xu, Y.; Wang, L. Hypoxia regulates the proliferation and osteogenic differentiation of human periodontal ligament cells under cyclic tensile stress via mitogen-activated protein kinase pathways. J. Periodontol. 2014, 85, 498–508. [Google Scholar] [CrossRef]
- Ren, D.; Wei, F.; Hu, L.; Yang, S.; Wang, C.; Yuan, X. Phosphorylation of Runx2, induced by cyclic mechanical tension via ERK1/2 pathway, contributes to osteodifferentiation of human periodontal ligament fibroblasts. J. Cell. Physiol. 2015, 230, 2426–2436. [Google Scholar] [CrossRef]
- Konstantonis, D.; Papadopoulou, A.; Makou, M.; Eliades, T.; Basdra, E.; Kletsas, D. The role of cellular senescence on the cyclic stretching-mediated activation of MAPK and ALP expression and activity in human periodontal ligament fibroblasts. Exp. Gerontol. 2014, 57, 175–180. [Google Scholar] [CrossRef] [PubMed]
- Chen, Y.; Mohammed, A.; Oubaidin, M.; Evans, C.A.; Zhou, X.; Luan, X.; Diekwisch, T.G.; Atsawasuwan, P. Cyclic stretch and compression forces alter microRNA-29 expression of human periodontal ligament cells. Gene 2015, 566, 13–17. [Google Scholar] [CrossRef]
- Andersen, K.L.; Norton, L.A. A device for the application of known simulated orthodontic forces to human cells in vitro. J. Biomech. 1991, 24, 649–654. [Google Scholar] [CrossRef]
- Natali, A.N.; Pavan, P.G.; Scarpa, C. Numerical analysis of tooth mobility: Formulation of a non-linear constitutive law for the periodontal ligament. Dent. Mater. 2004, 20, 623–629. [Google Scholar] [CrossRef] [PubMed]
- Mühlemann, H.R.; Zander, H.A. Tooth mobility (III): The mechanism of tooth mobility. J. Periodontol. 1954, 25, 128–153. [Google Scholar] [CrossRef]
- Hao, Y.; Xu, C.; Sun, S.Y.; Zhang, F.Q. Cyclic stretching force induces apoptosis in human periodontal ligament cells via caspase-9. Arch. Oral Biol. 2009, 54, 864–870. [Google Scholar] [CrossRef]
- Memmert, S.; Damanaki, A.; Weykopf, B.; Rath-Deschner, B.; Nokhbehsaim, M.; Gotz, W.; Golz, L.; Till, A.; Deschner, J.; Jager, A. Autophagy in periodontal ligament fibroblasts under biomechanical loading. Cell Tissue Res. 2019, 378, 499–511. [Google Scholar] [CrossRef]
- Nogueira, A.V.; Nokhbehsaim, M.; Eick, S.; Bourauel, C.; Jäger, A.; Jepsen, S.; Rossa, C., Jr.; Deschner, J.; Cirelli, J.A. Biomechanical loading modulates proinflammatory and bone resorptive mediators in bacterial-stimulated PDL cells. Mediat. Inflamm. 2014, 2014, 425421. [Google Scholar] [CrossRef]
- Chang, M.; Lin, H.; Fu, H.; Wang, B.; Han, G.; Fan, M. MicroRNA-195-5p regulates osteogenic differentiation of periodontal ligament cells under mechanical loading. J. Cell. Physiol. 2017, 232, 3762–3774. [Google Scholar] [CrossRef]
- Komori, T. Regulation of Proliferation, Differentiation and Functions of Osteoblasts by Runx2. Int. J. Mol. Sci. 2019, 20, 1694. [Google Scholar] [CrossRef] [Green Version]
- Ziros, P.G.; Gil, A.P.; Georgakopoulos, T.; Habeos, I.; Kletsas, D.; Basdra, E.K.; Papavassiliou, A.G. The bone-specific transcriptional regulator Cbfa1 is a target of mechanical signals in osteoblastic cells. J. Biol. Chem. 2002, 277, 23934–23941. [Google Scholar] [CrossRef] [Green Version]
- Li, S.; Zhang, H.; Li, S.; Yang, Y.; Huo, B.; Zhang, D. Connexin 43 and ERK regulate tension-induced signal transduction in human periodontal ligament fibroblasts. J. Orthop. Res. 2015, 33, 1008–1014. [Google Scholar] [CrossRef] [Green Version]
- Yang, Y.; Yang, Y.; Li, X.; Cui, L.; Fu, M.; Rabie, A.B.; Zhang, D. Functional analysis of core binding factor a1 and its relationship with related genes expressed by human periodontal ligament cells exposed to mechanical stress. Eur. J. Orthod. 2010, 32, 698–705. [Google Scholar] [CrossRef] [Green Version]
- Tang, N.; Zhao, Z.; Zhang, L.; Yu, Q.; Li, J.; Xu, Z.; Li, X. Up-regulated osteogenic transcription factors during early response of human periodontal ligament stem cells to cyclic tensile strain. Arch. Med. Sci. 2012, 8, 422–430. [Google Scholar] [CrossRef]
- Jiang, Z.; Hua, Y. Hydrogen sulfide promotes osteogenic differentiation of human periodontal ligament cells via p38-MAPK signaling pathway under proper tension stimulation. Arch. Oral Biol. 2016, 72, 8–13. [Google Scholar] [CrossRef] [PubMed] [Green Version]
- Chen, Y.J.; Shie, M.Y.; Hung, C.J.; Wu, B.C.; Liu, S.L.; Huang, T.H.; Kao, C.T. Activation of focal adhesion kinase induces extracellular signal-regulated kinase-mediated osteogenesis in tensile force-subjected periodontal ligament fibroblasts but not in osteoblasts. J. Bone Miner. Metab. 2014, 32, 671–682. [Google Scholar] [CrossRef] [PubMed]
- Chiba, M.; Mitani, H. Cytoskeletal changes and the system of regulation of alkaline phosphatase activity in human periodontal ligament cells induced by mechanical stress. Cell Biochem. Funct. 2004, 22, 249–256. [Google Scholar] [CrossRef] [PubMed]
- Yamaguchi, M.; Shimizu, N. Identification of factors mediating the decrease of alkaline phosphatase activity caused by tension-force in periodontal ligament cells. Gen. Pharmacol. 1994, 25, 1229–1235. [Google Scholar] [CrossRef]
- Wada, S.; Kanzaki, H.; Narimiya, T.; Nakamura, Y. Novel device for application of continuous mechanical tensile strain to mammalian cells. Biol. Open 2017, 6, 518–524. [Google Scholar] [CrossRef] [PubMed] [Green Version]
- Wu, Y.; Ou, Y.; Liao, C.; Liang, S.; Wang, Y. High-throughput sequencing analysis of the expression profile of microRNAs and target genes in mechanical force-induced osteoblastic/cementoblastic differentiation of human periodontal ligament cells. Am. J. Transl. Res. 2019, 11, 3398–3411. [Google Scholar] [PubMed]
- Jacobs, C.; Grimm, S.; Ziebart, T.; Walter, C.; Wehrbein, H. Osteogenic differentiation of periodontal fibroblasts is dependent on the strength of mechanical strain. Arch. Oral Biol. 2013, 58, 896–904. [Google Scholar] [CrossRef] [PubMed]
- Nazet, U.; Schröder, A.; Spanier, G.; Wolf, M.; Proff, P.; Kirschneck, C. Simplified method for applying static isotropic tensile strain in cell culture experiments with identification of valid RT-qPCR reference genes for PDL fibroblasts. Eur. J. Orthod. 2020, 42, 359–370. [Google Scholar] [CrossRef] [PubMed]
- Marchesan, J.T.; Scanlon, C.S.; Soehren, S.; Matsuo, M.; Kapila, Y.L. Implications of cultured periodontal ligament cells for the clinical and experimental setting: A review. Arch. Oral Biol. 2011, 56, 933–943. [Google Scholar] [CrossRef] [PubMed] [Green Version]
- Jacobs, C.; Walter, C.; Ziebart, T.; Dirks, I.; Schramm, S.; Grimm, S.; Krieger, E.; Wehrbein, H. Mechanical loading influences the effects of bisphosphonates on human periodontal ligament fibroblasts. Clin. Oral Investig. 2015, 19, 699–708. [Google Scholar] [CrossRef] [PubMed]
- Kletsas, D.; Basdra, E.K.; Papavassiliou, A.G. Effect of protein kinase inhibitors on the stretch-elicited c-Fos and c-Jun up-regulation in human PDL osteoblast-like cells. J. Cell. Physiol. 2002, 190, 313–321. [Google Scholar] [CrossRef]
- Peverali, F.A.; Basdra, E.K.; Papavassiliou, A.G. Stretch-mediated activation of selective MAPK subtypes and potentiation of AP-1 binding in human osteoblastic cells. Mol. Med. 2001, 7, 68–78. [Google Scholar] [CrossRef] [PubMed]
- Papadopoulou, A.; Iliadi, A.; Eliades, T.; Kletsas, D. Early responses of human periodontal ligament fibroblasts to cyclic and static mechanical stretching. Eur. J. Orthod. 2017, 39, 258–263. [Google Scholar] [CrossRef] [Green Version]
- Lee, S.I.; Park, K.H.; Kim, S.J.; Kang, Y.G.; Lee, Y.M.; Kim, E.C. Mechanical stress-activated immune response genes via Sirtuin 1 expression in human periodontal ligament cells. Clin. Exp. Immunol. 2012, 168, 113–124. [Google Scholar] [CrossRef] [Green Version]
- Jacobs, C.; Walter, C.; Ziebart, T.; Grimm, S.; Meila, D.; Krieger, E.; Wehrbein, H. Induction of IL-6 and MMP-8 in human periodontal fibroblasts by static tensile strain. Clin. Oral Investig. 2014, 18, 901–908. [Google Scholar] [CrossRef]
- Scheller, J.; Chalaris, A.; Schmidt-Arras, D.; Rose-John, S. The pro- and anti-inflammatory properties of the cytokine interleukin-6. Biochim. Biophys. Acta 2011, 1813, 878–888. [Google Scholar] [CrossRef] [PubMed] [Green Version]
- Ohzeki, K.; Yamaguchi, M.; Shimizu, N.; Abiko, Y. Effect of cellular aging on the induction of cyclooxygenase-2 by mechanical stress in human periodontal ligament cells. Mech. Ageing Dev. 1999, 108, 151–163. [Google Scholar] [CrossRef]
- Suzuki, R.; Nemoto, E.; Shimauchi, H. Cyclic tensile force up-regulates BMP-2 expression through MAP kinase and COX-2/PGE2 signaling pathways in human periodontal ligament cells. Exp. Cell Res. 2014, 323, 232–241. [Google Scholar] [CrossRef] [PubMed]
- Nokhbehsaim, M.; Deschner, B.; Winter, J.; Bourauel, C.; Jäger, A.; Jepsen, S.; Deschner, J. Anti-inflammatory effects of EMD in the presence of biomechanical loading and interleukin-1β in vitro. Clin. Oral Investig. 2012, 16, 275–283. [Google Scholar] [CrossRef]
- Gkantidis, N.; Christou, P.; Topouzelis, N. The orthodontic-periodontic interrelationship in integrated treatment challenges: A systematic review. J. Oral Rehabil. 2010, 37, 377–390. [Google Scholar] [CrossRef] [PubMed]
- Vanarsdall, R.L., Jr.; Blasi, I., Jr.; Secchi, A.G. Periodontal-orthodontic interrelationships. In Orthodontics—Current Principles and Techniques, 6th ed.; Graber, L.W., Vanarsdall, R.L., Jr., Vig, K.W.L., Huang, G.J., Eds.; Elsevier: St. Louis, MO, USA, 2017; pp. 623–658. [Google Scholar]
- Monsarrat, P.; Blaizot, A.; Kemoun, P.; Ravaud, P.; Nabet, C.; Sixou, M.; Vergnes, J.N. Clinical research activity in periodontal medicine: A systematic mapping of trial registers. J. Clin. Periodontol. 2016, 43, 390–400. [Google Scholar] [CrossRef]
- Di Spirito, F.; La Rocca, M.; De Bernardo, M.; Rosa, N.; Sbordone, C.; Sbordone, L. Possible Association of Periodontal Disease and Macular Degeneration: A Case-Control Study. Dent. J. 2020, 9, 1. [Google Scholar] [CrossRef]
- Di Spirito, F.; Toti, P.; Pilone, V.; Carinci, F.; Lauritano, D.; Sbordone, L. The Association between Periodontitis and Human Colorectal Cancer: Genetic and Pathogenic Linkage. Life 2020, 10, 211. [Google Scholar] [CrossRef]
- Krishnan, V.; Viecilli, R.F.; Davidovitch, Z. Cellular and molecular biology behind orthodontic tooth movement. In Biological Mechanisms of Tooth Movement, 2nd ed.; Krishnan, V., Davidovitch, Z., Eds.; Wiley: Chichester, UK, 2015; pp. 30–50. [Google Scholar]
- Janjic, M.; Docheva, D.; Trickovic Janjic, O.; Wichelhaus, A.; Baumert, U. In Vitro Weight-Loaded Cell Models for Understanding Mechanodependent Molecular Pathways Involved in Orthodontic Tooth Movement: A Systematic Review. Stem Cells Int. 2018, 2018, 3208285. [Google Scholar] [CrossRef] [Green Version]
- Vansant, L.; Cadenas De Llano-Perula, M.; Verdonck, A.; Willems, G. Expression of biological mediators during orthodontic tooth movement: A systematic review. Arch. Oral Biol. 2018, 95, 170–186. [Google Scholar] [CrossRef]
- Somerman, M.J.; Archer, S.Y.; Imm, G.R.; Foster, R.A. A comparative study of human periodontal ligament cells and gingival fibroblasts in vitro. J. Dent. Res. 1988, 67, 66–70. [Google Scholar] [CrossRef]
- Goseki, T.; Shimizu, N.; Iwasawa, T.; Takiguchi, H.; Abiko, Y. Effects of in vitro cellular aging on alkaline phosphatase, cathepsin activities and collagen secretion of human periodontal ligament derived cells. Mech. Ageing Dev. 1996, 91, 171–183. [Google Scholar] [CrossRef]
- Sawa, Y.; Phillips, A.; Hollard, J.; Yoshida, S.; Braithwaite, M.W. Impairment of osteocalcin production in senescent periodontal ligament fibroblasts. Tissue Cell 2000, 32, 198–204. [Google Scholar] [CrossRef] [PubMed]
- Abiko, Y.; Shimizu, N.; Yamaguchi, M.; Suzuki, H.; Takiguchi, H. Effect of aging on functional changes of periodontal tissue cells. Ann. Periodontol. 1998, 3, 350–369. [Google Scholar] [CrossRef]
- Itaya, T.; Kagami, H.; Okada, K.; Yamawaki, A.; Narita, Y.; Inoue, M.; Sumita, Y.; Ueda, M. Characteristic changes of periodontal ligament-derived cells during passage. J. Periodontal Res. 2009, 44, 425–433. [Google Scholar] [CrossRef] [PubMed]
- Stoddart, M.J.; Richards, R.G.; Alini, M. In vitro experiments with primary mammalian cells: To pool or not to pool? Eur. Cell. Mater. 2012, 24, i–ii. [Google Scholar] [CrossRef] [PubMed]
- Mayahara, K.; Kobayashi, Y.; Takimoto, K.; Suzuki, N.; Mitsui, N.; Shimizu, N. Aging stimulates cyclooxygenase-2 expression and prostaglandin E2 production in human periodontal ligament cells after the application of compressive force. J. Periodontal Res. 2007, 42, 8–14. [Google Scholar] [CrossRef] [PubMed]
- Toume, S.; Gefen, A.; Weihs, D. Printable low-cost, sustained and dynamic cell stretching apparatus. J. Biomech. 2016, 49, 1336–1339. [Google Scholar] [CrossRef] [PubMed]
- Bustin, S.A.; Beaulieu, J.F.; Huggett, J.; Jaggi, R.; Kibenge, F.S.; Olsvik, P.A.; Penning, L.C.; Toegel, S. MIQE précis: Practical implementation of minimum standard guidelines for fluorescence-based quantitative real-time PCR experiments. BMC Mol. Biol. 2010, 11, 74. [Google Scholar] [CrossRef] [Green Version]
- Chirieleison, S.M.; Marsh, R.A.; Kumar, P.; Rathkey, J.K.; Dubyak, G.R.; Abbott, D.W. Nucleotide-binding oligomerization domain (NOD) signaling defects and cell death susceptibility cannot be uncoupled in X-linked inhibitor of apoptosis (XIAP)-driven inflammatory disease. J. Biol. Chem. 2017, 292, 9666–9679. [Google Scholar] [CrossRef] [Green Version]
- Xie, F.; Xiao, P.; Chen, D.; Xu, L.; Zhang, B. miRDeepFinder: A miRNA analysis tool for deep sequencing of plant small RNAs. Plant Mol. Biol. 2012, 80, 75–84. [Google Scholar] [CrossRef]
- Livak, K.J.; Schmittgen, T.D. Analysis of relative gene expression data using real-time quantitative PCR and the 2−ΔΔCT Method. Methods 2001, 25, 402–408. [Google Scholar] [CrossRef] [PubMed]
- Shi, J.; Baumert, U.; Folwaczny, M.; Wichelhaus, A. Influence of static forces on the expression of selected parameters of inflammation in periodontal ligament cells and alveolar bone cells in a co-culture in vitro model. Clin. Oral Investig. 2019, 23, 2617–2628. [Google Scholar] [CrossRef] [PubMed] [Green Version]
- Gronthos, S.; Zannettino, A.C.; Hay, S.J.; Shi, S.; Graves, S.E.; Kortesidis, A.; Simmons, P.J. Molecular and cellular characterisation of highly purified stromal stem cells derived from human bone marrow. J. Cell Sci. 2003, 116, 1827–1835. [Google Scholar] [CrossRef] [PubMed] [Green Version]
- Gartland, A.; Buckley, K.A.; Dillon, J.P.; Curran, J.M.; Hunt, J.A.; Gallagher, J.A. Isolation and Culture of Human Osteobalsts. In Human Cell Culture Protocols, 2nd ed.; Picot, J., Ed.; Methods in Molecular Medicine; Humana Press: Totowa, NJ, USA, 2005; pp. 29–54. [Google Scholar]


| Analyte | Magnitude | Duration of Tensile Strain Application (Days) | KW of Duration (Magnitude Fixed) | ||||||
|---|---|---|---|---|---|---|---|---|---|
| 1 Day | 2 Days | 3 Days | |||||||
| Mean (SD) | [95% CI] | Mean (SD) | [95% CI] | Mean (SD) | [95% CI] | Padj. | Sign. | ||
| ALPL (FC) | 3 | 2.94 (0.35) | [3.35;3.37] | 0.57 (0.03) | [0.57;0.63] | 0.65 (0.09) | [0.70;0.80] | 0.002 | ** |
| 6 | 2.45 (0.21) | [2.61;2.68] | 0.56 (0.11) | [0.56;0.79] | 0.84 (0.12) | [0.91;1.02] | 0.001 | ** | |
| 10 | 1.66 (0.84) | [2.45;2.52] | 0.72 (0.07) | [0.75;0.82] | 0.97 (0.14) | [1.08;1.20] | 0.051 | n.s. | |
| 15 | 2.37 (0.28) | [2.58;2.76] | 0.57 (0.05) | [0.58;0.62] | 0.73 (0.03) | [0.76;0.76] | 0.001 | ** | |
| 20 | 1.76 (0.17) | [1.90;1.97] | 0.84 (0.14) | [0.99;1.05] | 0.68 (0.18) | [0.83;0.92] | 0.002 | ** | |
| KW of magnitude (duration fixed) | <0.001 *** | <0.001 *** | 0.001 ** | ||||||
| BGLAP (FC) | 3 | 1.11 (0.48) | [1.05;2.04] | 0.19 (0.08) | [0.28;0.30] | 0.80 (0.15) | [0.96;1.01] | 0.001 | ** |
| 6 | 1.40 (0.23) | [1.62;1.70] | 0.25 (0.07) | [0.32;0.35] | 1.73 (0.27) | [2.05;2.08] | 0.002 | ** | |
| 10 | 1.06 (0.21) | [1.21;1.34] | 0.73 (0.12) | [0.81;0.85] | 3.35 (0.84) | [3.74;4.70] | 0.001 | ** | |
| 15 | 1.67 (0.73) | [2.25;2.85] | 0.21 (0.03) | [0.22;0.24] | 2.68 (0.66) | [3.04;3.40] | 0.001 | ** | |
| 20 | 1.00 (0.21) | [1.13;1.34] | 0.42 (0.17) | [0.59;0.65] | 2.14 (0.40) | [2.51;2.65] | 0.001 | ** | |
| KW of magnitude (duration fixed) | 0.077 n.s. | <0.001 *** | <0.001 *** | ||||||
| PTGS2 (FC) | 3 | 3.12 (0.75) | [3.47;4.07] | 0.81 (0.07) | [0.83;0.93] | 1.35 (0.12) | [1.45;1.48] | 0.001 | ** |
| 6 | 3.30 (0.54) | [3.93;4.01] | 0.79 (0.11) | [0.86;0.91] | 1.58 (0.28) | [1.77;1.97] | 0.001 | ** | |
| 10 | 2.08 (0.81) | [2.63;2.72] | 0.96 (0.09) | [1.02;1.05] | 1.45 (0.35) | [1.82;1.95] | 0.004 | ** | |
| 15 | 3.64 (0.24) | [3.78;3.94] | 0.83 (0.07) | [0.85;0.94] | 1.61 (0.16) | [1.75;1.80] | 0.001 | ** | |
| 20 | 2.21 (0.61) | [2.74;2.76] | 1.30 (0.49) | [1.65;1.65] | 0.91 (0.27) | [1.22;1.26] | 0.014 | * | |
| KW of magnitude (duration fixed) | <0.001 *** | 0.017 * | 0.001 ** | ||||||
| FOS (FC) | 3 | 0.79 (0.09) | [0.83;0.91] | 1.02 (0.11) | [1.08;1.19] | 1.85 (0.15) | [2.01;2.07] | 0.001 | ** |
| 6 | 0.81 (0.09) | [0.84;0.98] | 0.82 (0.19) | [0.85;1.14] | 1.87 (0.46) | [2.23;2.30] | 0.003 | ** | |
| 10 | 0.80 (0.05) | [0.84;0.85] | 0.82 (0.09) | [0.90;0.91] | 1.52 (0.17) | [1.73;1.73] | 0.003 | ** | |
| 15 | 0.86 (0.35) | [0.75;1.58] | 0.77 (0.10) | [0.87;0.91] | 2.05 (0.25) | [2.17;2.43] | 0.003 | ** | |
| 20 | 0.78 (0.18) | [0.93;1.02] | 1.16 (0.45) | [1.65;1.65] | 1.48 (0.24) | [1.66;1.79] | 0.012 | * | |
| KW of magnitude (duration fixed) | 0.041 * | 0.024 * | 0.001 ** | ||||||
| IL6 (FC) | 3 | 1.76 (0.24) | [1.92;2.08] | 0.46 (0.05) | [0.51;0.52] | 0.92 (0.15) | [1.06;1.15] | 0.001 | ** |
| 6 | 1.67 (0.14) | [1.78;1.83] | 0.41 (0.03) | [0.43;0.46] | 1.11 (0.17) | [1.17;1.39] | 0.001 | ** | |
| 10 | 1.01 (0.41) | [1.33;1.53] | 0.57 (0.02) | [0.57;0.59] | 1.21 (0.14) | [1.32;1.37] | 0.018 | * | |
| 15 | 2.01 (0.80) | [2.96;3.11] | 0.38 (0.03) | [0.39;0.42] | 1.03 (0.14) | [1.14;1.21] | 0.001 | ** | |
| 20 | 1.19 (0.14) | [1.30;1.38] | 0.50 (0.10) | [0.56;0.67] | 0.92 (0.14) | [1.00;1.06] | 0.001 | ** | |
| KW of magnitude (duration fixed) | <0.001 *** | <0.001 *** | 0.036 * | ||||||
| RUNX2 (FC) | 3 | 2.49 (0.20) | [2.65;2.78] | 0.77 (0.07) | [0.83;0.83] | 0.70 (0.12) | [0.84;0.87] | 0.003 | ** |
| 6 | 2.15 (0.26) | [2.38;2.48] | 0.80 (0.03) | [0.82;0.85] | 0.89 (0.16) | [1.08;1.10] | 0.003 | ** | |
| 10 | 1.60 (0.84) | [2.37;2.44] | 0.63 (0.04) | [0.67;0.69] | 1.04 (0.18) | [1.25;1.27] | 0.064 | n.s. | |
| 15 | 2.08 (0.15) | [2.22;2.30] | 0.85 (0.04) | [0.86;0.92] | 0.82 (0.07) | [0.86;0.92] | 0.003 | ** | |
| 20 | 1.32 (0.16) | [1.44;1.54] | 0.81 (0.17) | [0.98;1.03] | 0.62 (0.21) | [0.85;0.90] | 0.002 | ** | |
| KW of magnitude (duration fixed) | <0.001 *** | <0.001 *** | 0.002 ** | ||||||
| SP7 (FC) | 3 | 2.18 (0.64) | [2.76;2.97] | 2.75 (1.61) | [4.17;4.29] | 0.50 (0.08) | [0.54;0.60] | 0.003 | ** |
| 6 | 4.84 (2.33) | [6.56;6.94] | 2.96 (1.24) | [3.94;4.17] | 1.20 (1.32) | [2.07;3.53] | 0.018 | * | |
| 10 | 4.22 (3.01) | [7.70;8.07] | 1.56 (0.74) | [2.42;2.51] | 1.84 (0.70) | [2.22;2.92] | 0.140 | n.s. | |
| 15 | 4.34 (1.38) | [4.18;7.11] | 3.20 (2.12) | [5.36;5.51] | 2.37 (0.61) | [2.42;3.48] | 0.059 | n.s. | |
| 20 | 0.65 (0.13) | [0.67;0.88] | 0.84 (0.35) | [1.25;1.27] | 0.81 (0.46) | [0.92;1.54] | 0.519 | n.s. | |
| KW of magnitude (duration fixed) | <0.001 *** | 0.022 * | 0.002 ** | ||||||
| PGE2 (pg/well) | 0 | 938.7 (80.1) | [1002.1;1002.6] | 603.7 (16.6) | [615.3;629.6] | 498.3 (32.3) | [526.3;542.6] | 0.001 | ** |
| 3 | 1318.5 (166.3) | [1437.6;1477.3] | 1165.5 (38.0) | [1197.8;1198.7] | 1075.0 (67.1) | [1130.2;1131.5] | 0.034 | * | |
| 6 | 1246.0 (83.8) | [1331.5;1348.9] | 1080.2 (56.9) | [1110.2;1171.1] | 934.5 (135.6) | [963.4;1195.3] | 0.005 | ** | |
| 10 | 1466.3 (143.4) | [1590.9;1591.6] | 1096.7 (30.4) | [1130.2;1134.0] | 972.2 (103.3) | [1093.4;1099.7] | 0.002 | ** | |
| 15 | 1625.5 (86.0) | [1642.1;1769.5] | 1451.6 (190.9) | [1678.3;1709.5] | 1240.2 (81.0) | [1321.7;1358.0] | 0.006 | ** | |
| 20 | 1962.5 (270.1) | [2140.6;2236.1] | 1779.1 (96.5) | [1856.2;1885.7] | 1456.2 (73.6) | [1505.3;1556.1] | 0.003 | ** | |
| KW of magnitude (duration fixed) | <0.001 *** | <0.001 *** | <0.001 *** | ||||||
| IL6 (pg/well) | 0 | 133.5 (20.6) | [157.1;159.8] | 143.1 (13.4) | [147.2;166.8] | 277.7 (35.1) | [305.1;312.5] | 0.002 | ** |
| 3 | 308.6 (60.4) | [381.1;387.4] | 300.5 (21.7) | [325.2;327.9] | 512.4 (28.6) | [532.1;559.9] | 0.003 | ** | |
| 6 | 179.0 (12.1) | [184.6;198.8] | 192.0 (24.5) | [211.7;216.8] | 488.1 (71.1) | [549.0;563.2] | 0.003 | ** | |
| 10 | 203.4 (34.7) | [241.5;250.6] | 186.3 (16.0) | [200.0;201.7] | 335.0 (18.5) | [350.6;357.6] | 0.003 | ** | |
| 15 | 176.3 (4.5) | [179.5;180.0] | 208.1 (8.4) | [215.1;220.0] | 502.5 (46.2) | [541.5;574.6] | 0.001 | ** | |
| 20 | 316.1 (53.9) | [375.1;387.3] | 291.3 (22.0) | [303.4;324.9] | 506.0 (30.3) | [532.7;539.2] | 0.003 | ** | |
| KW of magnitude (duration fixed) | <0.001 *** | <0.001 *** | <0.001 *** | ||||||
| Parameter | Membrane Area Increase | |||||
|---|---|---|---|---|---|---|
| 0% (Control) | 3% | 6% | 10% | 15% | 20% | |
| Radius r (mm) 1 | n.a. | 50.62 | 36.82 | 29.54 | 25.25 | 22.82 |
| Height h (mm) 1 | n.a. | 2.94 | 4.16 | 5.38 | 6.58 | 7.60 |
| Volume of medium (mL) | 2.89 | 4.37 | 4.96 | 5.54 | 6.08 | 6.52 |
| Gene | GenBank Accession Number | Primer Sequence (f: 5′-Forward Primer-3′; r: 5′-Reverse Primer-3′) | Annealing Temp. (°C) | Data Acquisition Temp. (°C) | Amplicon Size (bp) | Primer Efficiency | Source |
|---|---|---|---|---|---|---|---|
| PTGS2 | NM_000963.4 | f: AAGCCTTCTCTAACCTCTCC r: GCCCTCGCTTATGATCTGTC | 58 | 77 | 234 | 1.995 | Janjic Rankovic et al. [14], Shi et al. [87] |
| IL6 | NM_000600.5 | f: TGGCAGAAAACAACCTGAACC r: TGGCTTGTTCCTCACTACTCTC | 58 | 76 | 168 | 1.955 | Janjic Rankovic et al. [14], Shi et al. [87] |
| FOS | NM_005252.4 | f: GCTTTGCAGACCGAGATTGC r: TTGAGGAGAGGCAGGGTGAA | 58 | 83 | 203 | 1.860 | Janjic Rankovic et al. [14] |
| RUNX2 | NM_001015051.4 | f: GCGCATTCCTCATCCCAGTA r: GGCTCAGGTAGGAGGGGTAA | 58 | 81 | 176 | 1.954 | Shi et al. [7], Janjic Rankovic et al. [14] |
| SP7 | NM_001173467.3 | f: GGCACAAAGAAGCCGTACTC r: CACTGGGCAGACAGTCAGAA | 61 | 81 | 247 | 1.935 | Gronthos et al. [88] |
| ALPL | NM_001127501.4 | f: GGACCATTCCCACGTCTTCAC r: CCTTGTAGCCAGGCCCATTG | 64 | 80 | 137 | 1.968 | Liu et al. [26] |
| BGLAP | NM_199173.6 | f: AGCGAGGTAGTGAAGAGAC r: GAAAGCCGATGTGGTCAG | 64 | 82 | 142 | 2.076 | Gartland et al. [89] |
| TNFRSF11B | NM_001066 | f: TCAAGCAGGAGTGCAATCG r: AGAATGCCTCCTCACACAGG | 64 | 81 | 342 | 1.941 | Yang et al. [46] |
| TNF | NM_000594.4 | Commercial primer pair from realtimeprimers.com (Order information: VHPS-9415 †) | 58 | 79 | 173 | 1.967 | Janjic Rankovic et al. [14], Shi et al. [87] |
| POLR2A | NM_000937.5 | f: TCGCTTACTGTCTTCCTGTTGG r: TGTGTTGGCAGTCACCTTCC | 58 | 79 | 108 | 1.886 | Nazet et al. [55] |
| RPL22 | NM_000983.4 | f: TGATTGCACCCACCCTGTAG r: GGTTCCCAGCTTTTCCGTTC | 61 | 75 | 98 | 1.939 | Nazet et al. [55] |
Publisher’s Note: MDPI stays neutral with regard to jurisdictional claims in published maps and institutional affiliations. |
© 2022 by the authors. Licensee MDPI, Basel, Switzerland. This article is an open access article distributed under the terms and conditions of the Creative Commons Attribution (CC BY) license (https://creativecommons.org/licenses/by/4.0/).
Share and Cite
Sun, C.; Janjic Rankovic, M.; Folwaczny, M.; Stocker, T.; Otto, S.; Wichelhaus, A.; Baumert, U. Effect of Different Parameters of In Vitro Static Tensile Strain on Human Periodontal Ligament Cells Simulating the Tension Side of Orthodontic Tooth Movement. Int. J. Mol. Sci. 2022, 23, 1525. https://doi.org/10.3390/ijms23031525
Sun C, Janjic Rankovic M, Folwaczny M, Stocker T, Otto S, Wichelhaus A, Baumert U. Effect of Different Parameters of In Vitro Static Tensile Strain on Human Periodontal Ligament Cells Simulating the Tension Side of Orthodontic Tooth Movement. International Journal of Molecular Sciences. 2022; 23(3):1525. https://doi.org/10.3390/ijms23031525
Chicago/Turabian StyleSun, Changyun, Mila Janjic Rankovic, Matthias Folwaczny, Thomas Stocker, Sven Otto, Andrea Wichelhaus, and Uwe Baumert. 2022. "Effect of Different Parameters of In Vitro Static Tensile Strain on Human Periodontal Ligament Cells Simulating the Tension Side of Orthodontic Tooth Movement" International Journal of Molecular Sciences 23, no. 3: 1525. https://doi.org/10.3390/ijms23031525