
Comparative Analysis of Sugar Metabolites and Their Transporters in Sugarcane Following Sugarcane mosaic virus (SCMV) Infection

 ,
, 
Abstract
:1. Introduction
2. Results
2.1. Analysis of Sugarcane Transcriptome following SCMV Infection
2.2. Effect of SCMV Infection on Sugar Metabolism
2.3. Differential Gene Expression Profiling of Sugar Metabolites Transcripts following SCMV Infection
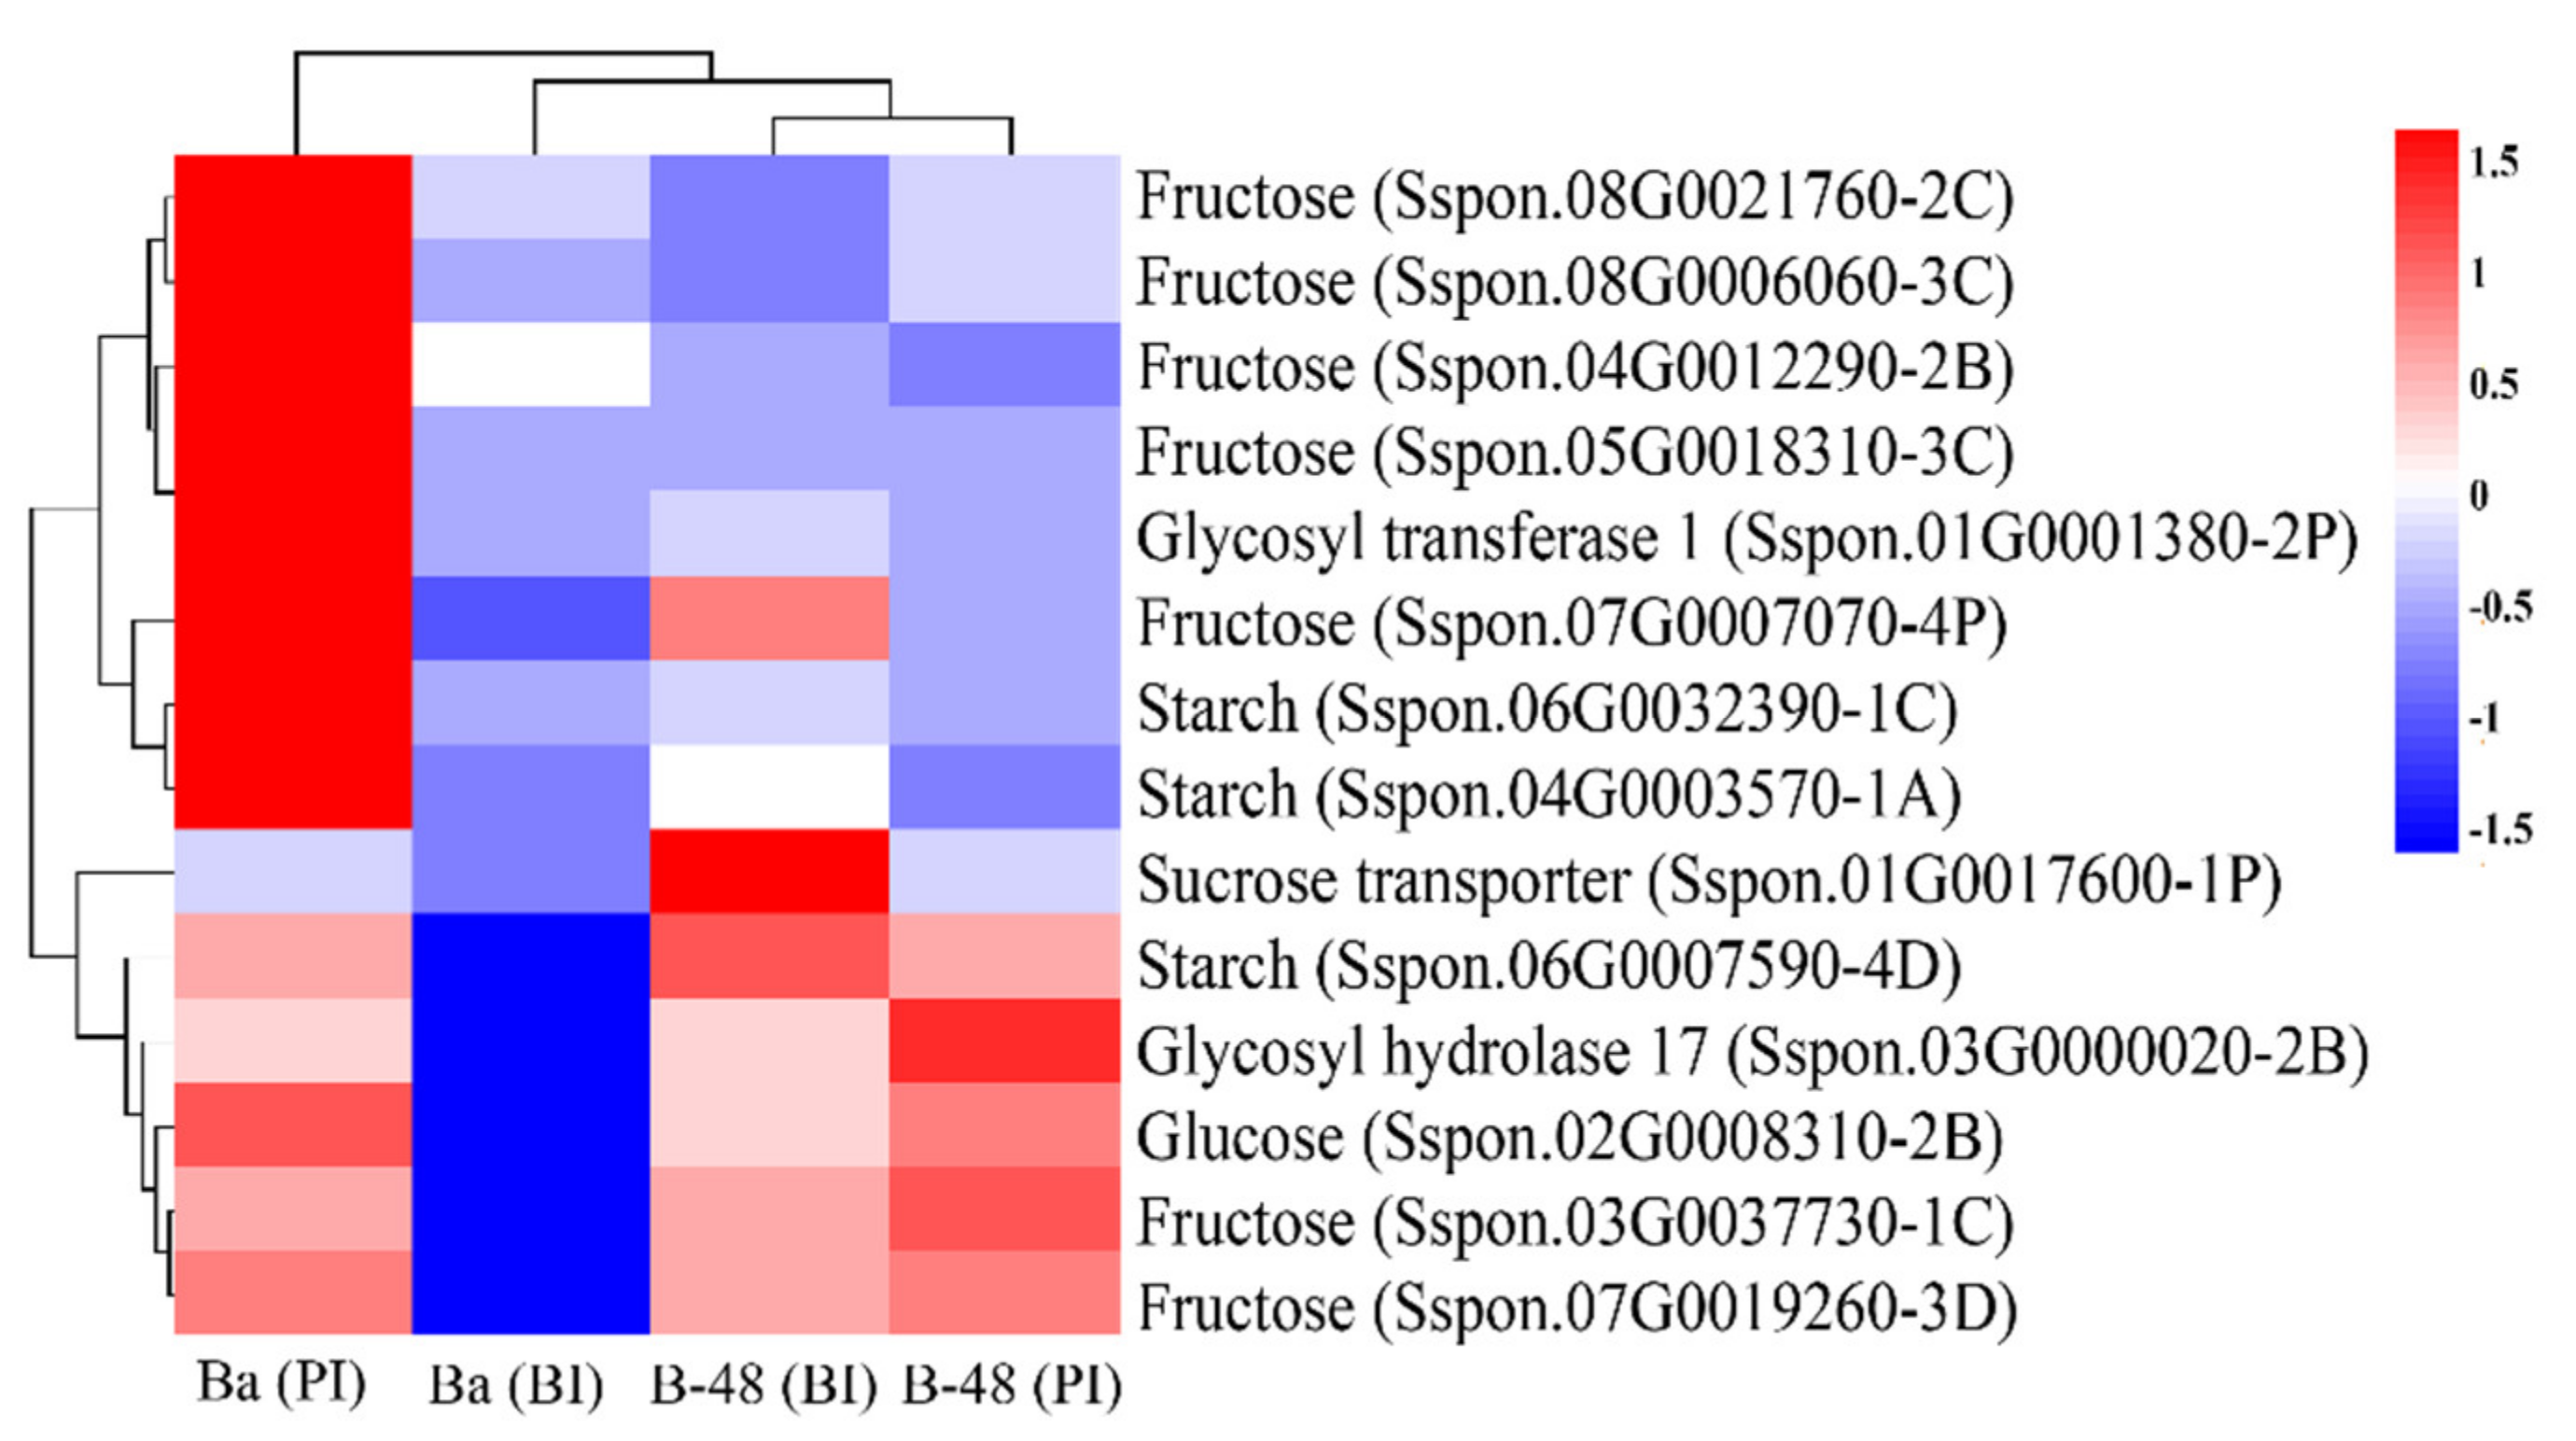
2.3.1. Fructose
2.3.2. Starch
2.3.3. Sucrose
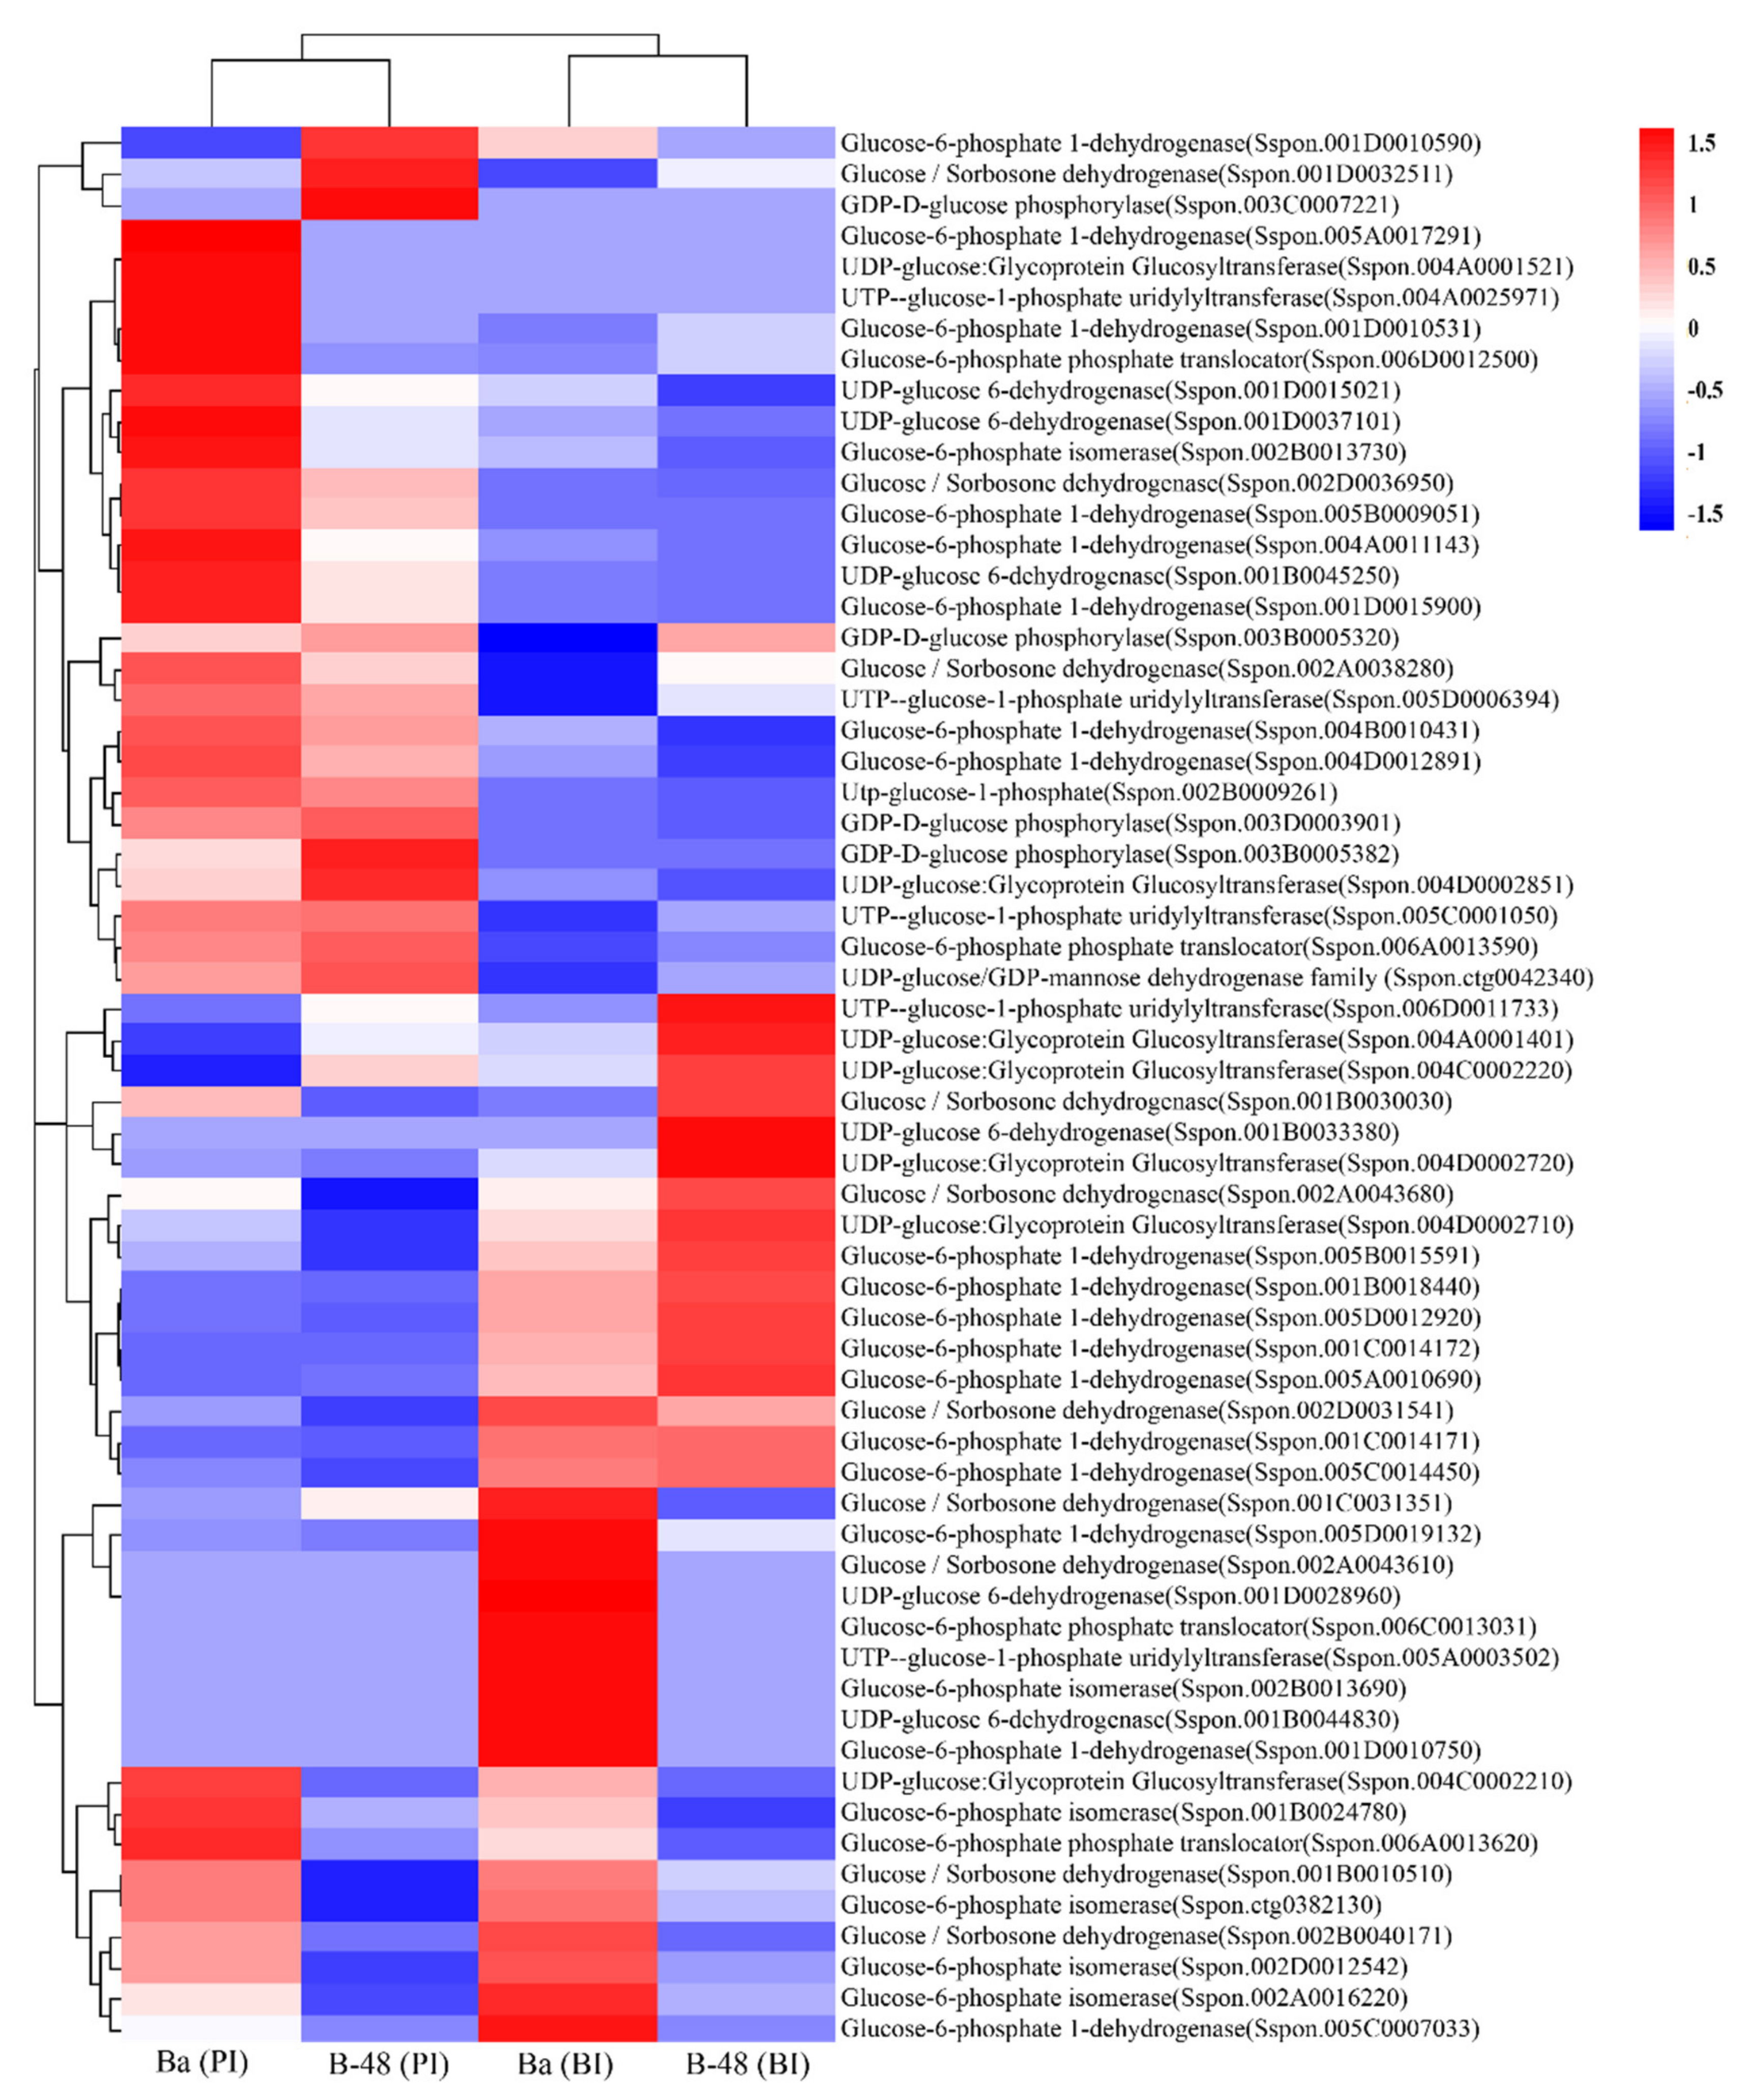
2.3.4. Glucose
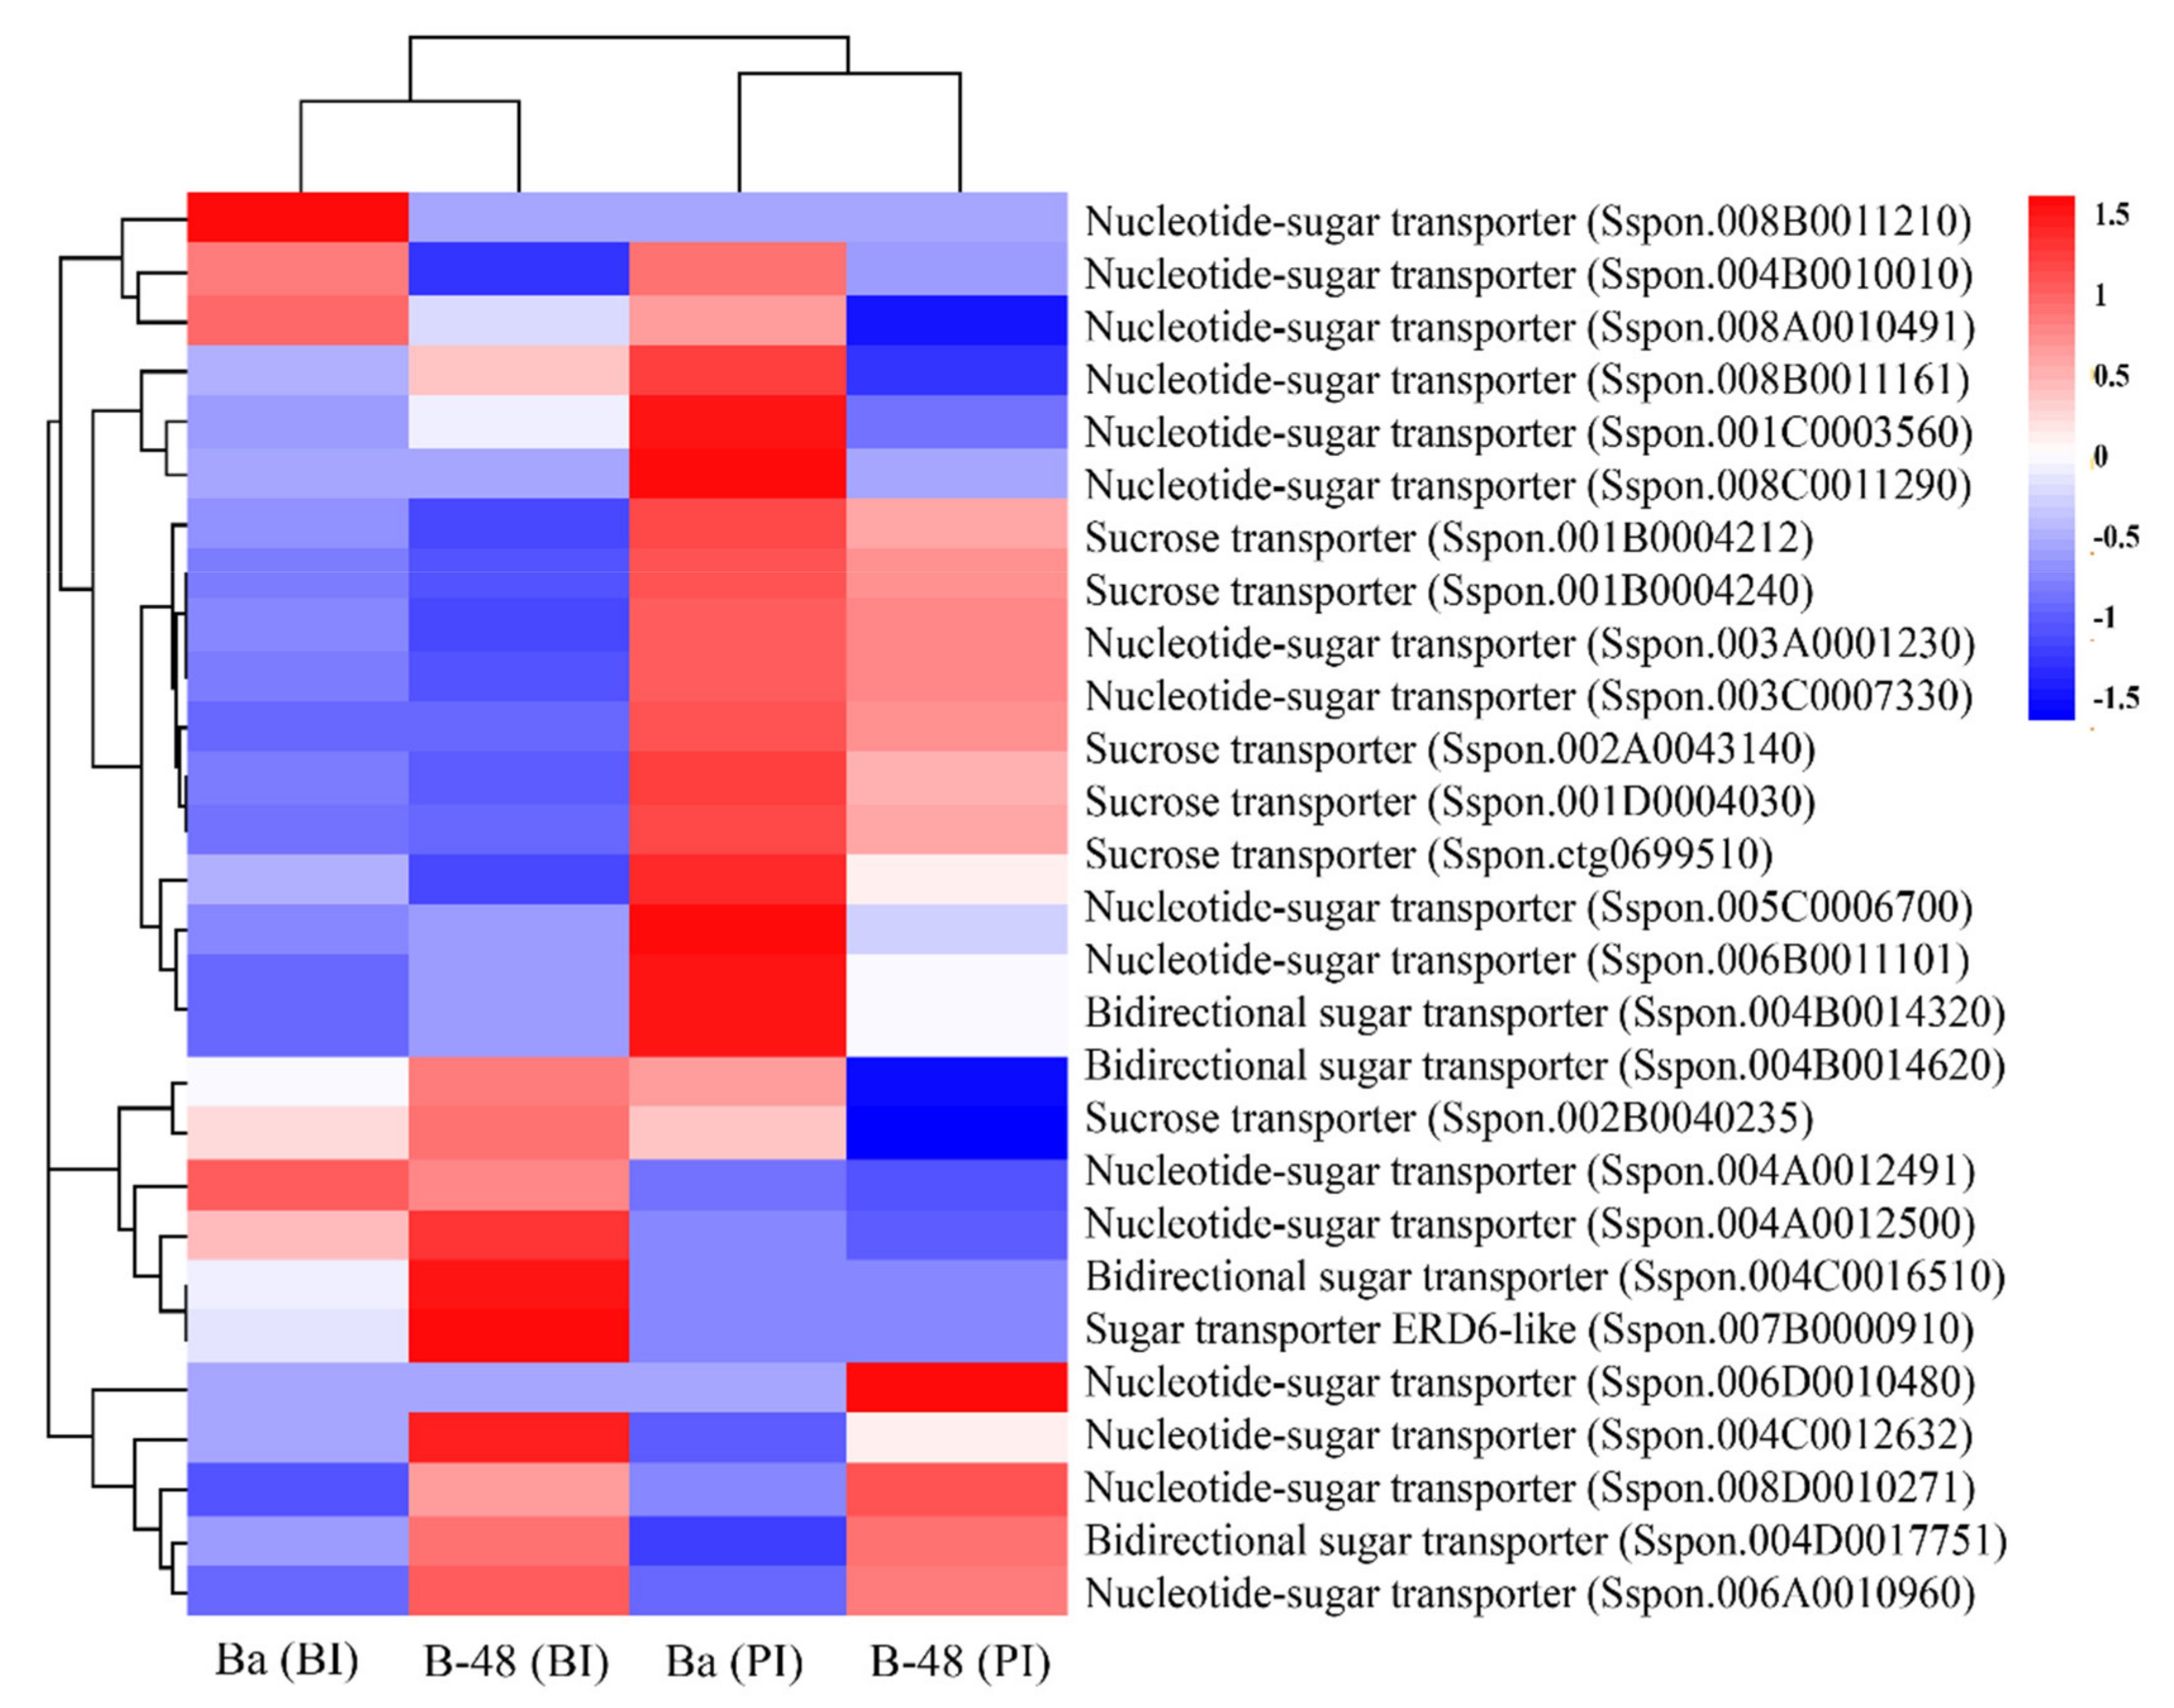
2.4. Differential Gene Expression Profiling of Sugar Transporter Transcripts following SCMV Infection
2.5. Identification of Carbohydrate Active enZYmes (CAZy) in Badila and B-48
2.6. Validation of Transcriptome Profiling through Quantitative Real-Time PCR
2.7. Protein Expression Profiling
3. Discussion
4. Materials and Methods
4.1. Plant Samples and SCMV Infection
4.2. Transcriptome Analysis
4.2.1. RNA Extraction
4.2.2. RNA Sequence Library Preparation
4.2.3. Genome Assembly and Mapping
4.2.4. Functional Annotation of Genes
4.2.5. Real-Time Quantitative PCR Analysis
4.3. Proteomics Analysis
4.3.1. Protein Extraction and Digestion
4.3.2. Peptide Labeling and Fractionation
4.3.3. LC-MS/MS Assessment and Data Processing
4.3.4. Protein Functional Annotation and Enrichment Analysis
4.4. Carbohydrate Active enZYmes (CAZymes) Detection
Supplementary Materials
Author Contributions
Funding
Institutional Review Board Statement
Informed Consent Statement
Data Availability Statement
Conflicts of Interest
References
- D’Hont, A. Unraveling the genome structure of polyploids using FISH and GISH, Examples of sugarcane and banana. Cytogenet. Genome Res. 2005, 109, 27–33. [Google Scholar] [CrossRef]
- Mulyono, S.; Nadirah, J. Identifying sugarcane plantation using LANDSAT-8 images with support vector machines. IOP Conf. Ser. Earth Environ. Sci. 2016, 47, 012008. [Google Scholar] [CrossRef] [Green Version]
- Brar, N.S.; Dhillon, B.S.; Saini, K.; Sharma, P.J. Agronomy of sugarbeet cultivation—A review. Agric. Rev. 2015, 36, 184–197. [Google Scholar] [CrossRef]
- Iqbal, M.A.; Saleem, A.M.; Sciences, E. Sugar beet potential to beat sugarcane as a sugar crop in Pakistan. J. Agric. Environ. Sci. 2015, 15, 36–44. [Google Scholar]
- Food and agriculture organization of United states data. FAO Statistical Database. 2021. Available online: https://www.fao.org/faostat/en/ (accessed on 1 November 2021).
- Cheavegatti-Gianotto, A.; de Abreu, H.M.C.; Arruda, P.; Bespalhok Filho, J.C.; Burnquist, W.L.; Creste, S.; di Ciero, L.; Ferro, J.A.; de Oliveira Figueira, A.V.; de Sousa Filgueiras, T.J.; et al. Sugarcane (Saccharum X Officinarum): A reference study for the regulation of genetically modified cultivars in Brazil. Trop. Plant Biol. 2011, 4, 62–89. [Google Scholar] [CrossRef] [PubMed] [Green Version]
- Partida, V.G.S.; Dias, H.M.; Corcino, D.S.M.; Van Sluys, M. Sucrose-phosphate phosphatase from sugarcane reveals an ancestral tandem duplication. BMC Plant Biol. 2021, 21, 23. [Google Scholar] [CrossRef] [PubMed]
- Lorimer, G.; Buchanan, B.; Wolosiuk, R.J. Photosynthesis: The carbon reactions. In Plant Physiology; Sinauer Associates: Sunderland, MA, USA, 2010; pp. 199–242. [Google Scholar]
- Kalt-Torres, W.; Kerr, P.S.; Usuda, H.; Huber, S.C. Diurnal changes in maize leaf photosynthesis: I. Carbon exchange rate, assimilate export rate, and enzyme activities. Plant Physiol. 1987, 83, 283–288. [Google Scholar] [CrossRef] [PubMed] [Green Version]
- Ainsworth, E.A.; Bush, D.R. Carbohydrate export from the leaf: A highly regulated process and target to enhance photosynthesis and productivity. Plant Physiol. 2011, 155, 64–69. [Google Scholar] [CrossRef] [Green Version]
- Hatch, M.D. Sugar accumulation by sugarcane storage tissue: The role of sucrose phosphate. Biochem. J. 1964, 93, 521. [Google Scholar] [CrossRef] [PubMed] [Green Version]
- Rae, A.L.; Grof, C.P.; Casu, R.E.; Bonnett, G.D. Sucrose accumulation in the sugarcane stem: Pathways and control points for transport and compartmentation. Field Crops Res. 2005, 92, 159–168. [Google Scholar] [CrossRef]
- Casu, R.E.; Grof, C.P.; Rae, A.L.; McIntyre, C.L.; Dimmock, C.M.; Manners, J.M. Identification of a novel sugar transporter homologue strongly expressed in maturing stem vascular tissues of sugarcane by expressed sequence tag and microarray analysis. Plant Mol. Biol. 2003, 52, 371–386. [Google Scholar] [CrossRef]
- Rae, A.L.; Perroux, J.M.; Grof, C.P. Sucrose partitioning between vascular bundles and storage parenchyma in the sugarcane stem: A potential role for the ShSUT1 sucrose transporter. Planta 2005, 220, 817–825. [Google Scholar] [CrossRef]
- Reinders, A.; Sivitz, A.B.; Hsi, A.; Grof, C.P.; Perroux, J.M.; Ward, J.M. Sugarcane ShSUT1: Analysis of sucrose transport activity and inhibition by sucralose. Plant Cell Environ. 2006, 29, 1871–1880. [Google Scholar] [CrossRef] [PubMed] [Green Version]
- ElSayed, A.I.; Ramadan, M.F.; Komor, E.J. Expression of sucrose transporter (ShSUT1) in a Hawaiian sugarcane cultivar infected with Sugarcane yellow leaf virus (SCYLV). Physiol. Mol. Plant Pathol. 2010, 75, 56–63. [Google Scholar] [CrossRef]
- ElSayed, A.I.; Weig, A.R.; Sariyeva, G.; Hummel, E.; Yan, S.-L.; Bertolini, A.; Komor, E.J. Assimilate export inhibition in Sugarcane yellow leaf virus-infected sugarcane is not due to less transcripts for sucrose transporters and sucrose-phosphate synthase or to callose deposition in sieve plates. Physiol. Mol. Plant Pathol. 2013, 81, 64–73. [Google Scholar] [CrossRef]
- Galtier, N.; Foyer, C.H.; Huber, J.; Voelker, T.A.; Huber, S.C. Effects of elevated sucrose-phosphate synthase activity on photosynthesis, assimilate partitioning, and growth in tomato (Lycopersicon esculentum var UC82B). Plant Physiol. 1993, 101, 535–543. [Google Scholar] [CrossRef] [PubMed] [Green Version]
- Worrell, A.C.; Bruneau, J.-M.; Summerfelt, K.; Boersig, M.; Voelker, T.A. Expression of a maize sucrose phosphate synthase in tomato alters leaf carbohydrate partitioning. Plant Cell. 1991, 3, 1121–1130. [Google Scholar] [PubMed] [Green Version]
- Grof, C.P.; Albertson, P.L.; Bursle, J.; Perroux, J.M.; Bonnett, G.D.; Manners, J.M. Sucrose-phosphate synthase, a biochemical marker of high sucrose accumulation in sugarcane. Crop Sci. 2007, 47, 1530–1539. [Google Scholar] [CrossRef]
- Biemelt, S.; Sonnewald, U.J.J. Plant–microbe interactions to probe regulation of plant carbon metabolism. J. Plant Physiol. 2006, 163, 307–318. [Google Scholar] [CrossRef]
- Lemoine, R.; La Camera, S.; Atanassova, R.; Dédaldéchamp, F.; Allario, T.; Pourtau, N.; Bonnemain, J.-L.; Laloi, M.; Coutos-Thévenot, P.; Maurousset, L.J. Source-to-sink transport of sugar and regulation by environmental factors. Front. Plant Sci. 2013, 4, 272. [Google Scholar] [CrossRef] [Green Version]
- Bezrutczyk, M.; Yang, J.; Eom, J.S.; Prior, M.; Sosso, D.; Hartwig, T.; Szurek, B.; Oliva, R.; Vera-Cruz, C.; White, F.F.; et al. Sugar flux and signaling in plant–microbe interactions. Plant J. 2018, 93, 675–685. [Google Scholar] [CrossRef] [Green Version]
- Llave, C.J.C. Dynamic cross-talk between host primary metabolism and viruses during infections in plants. Curr. Opin. Virol. 2016, 19, 50–55. [Google Scholar] [CrossRef] [Green Version]
- Henrissat, B.; Davies, G.J.J. Glycoside hydrolases and glycosyltransferases. Families, modules, and implications for genomics. Plant Physiol. 2000, 124, 1515–1519. [Google Scholar] [CrossRef] [Green Version]
- Henrissat, B.; Davies, G.J.C. Structural and sequence-based classification of glycoside hydrolases. Curr. Opin. Struct. Biol. 1997, 7, 637–644. [Google Scholar] [CrossRef]
- Lairson, L.; Henrissat, B.; Davies, G.; Withers, S.G. Glycosyltransferases: Structures, functions, and mechanisms. Annu. Rev. Biochem. 2008, 77, 521–555. [Google Scholar] [CrossRef] [Green Version]
- Dhugga, K.S.J.C. Building the wall: Genes and enzyme complexes for polysaccharide synthases. Curr. Opin. Plant Biol. 2001, 4, 488–493. [Google Scholar] [CrossRef]
- Aspeborg, H.; Schrader, J.; Coutinho, P.M.; Stam, M.; Kallas, A.; Djerbi, S.; Nilsson, P.; Denman, S.; Amini, B.; Sterky, F.J.; et al. Carbohydrate-active enzymes involved in the secondary cell wall biogenesis in hybrid aspen. Plant Physiol. 2005, 137, 983–997. [Google Scholar] [CrossRef] [Green Version]
- Dhugga, K.S. Biosynthesis of non-cellulosic polysaccharides of plant cell walls. Phytochemistry 2012, 74, 8–19. [Google Scholar] [CrossRef] [PubMed]
- Minic, Z.J.P. Physiological roles of plant glycoside hydrolases. Planta 2008, 227, 723–740. [Google Scholar] [CrossRef] [PubMed]
- Linhardt, R.; Galliher, P.; Cooney, C.L. Polysaccharide lyases. Appl. Biochem. Biotechnol. 1987, 12, 135–176. [Google Scholar] [CrossRef]
- Garron, M.-L.; Cygler, M.J.G. Structural and mechanistic classification of uronic acid-containing polysaccharide lyases. Glycobiology 2010, 20, 1547–1573. [Google Scholar] [CrossRef] [Green Version]
- Cantarel, B.L.; Lombard, V.; Henrissat, B.J. Complex carbohydrate utilization by the healthy human microbiome. PLoS ONE 2012, 7, e28742. [Google Scholar] [CrossRef] [PubMed] [Green Version]
- Tsai, A.Y.L.; Canam, T.; Gorzsás, A.; Mellerowicz, E.J.; Campbell, M.M.; Master, E.R. Constitutive expression of a fungal glucuronoyl esterase in Arabidopsis reveals altered cell wall composition and structure. Plant Biotechnol. J. 2012, 10, 1077–1087. [Google Scholar] [CrossRef]
- Henrissat, B.; Coutinho, P.M.; Davies, G.J.J. A census of carbohydrate-active enzymes in the genome of Arabidopsis thaliana. Plant Mol. Biol. 2001, 47, 55–72. [Google Scholar] [CrossRef] [PubMed]
- Hervé, C.; Rogowski, A.; Blake, A.W.; Marcus, S.E.; Gilbert, H.J.; Knox, J.P. Carbohydrate-binding modules promote the enzymatic deconstruction of intact plant cell walls by targeting and proximity effects. Proc. Natl. Acad. Sci. USA 2010, 107, 15293–15298. [Google Scholar] [CrossRef] [PubMed] [Green Version]
- Mandadi, K.K.; Scholthof, K.-B.G. Plant immune responses against viruses: How does a virus cause disease? Plant Cell 2013, 25, 1489–1505. [Google Scholar] [CrossRef] [Green Version]
- Yao, W.; Ruan, M.; Qin, L.; Yang, C.; Chen, R.; Chen, B.; Zhang, M.Q. Field performance of transgenic sugarcane lines resistant to sugarcane mosaic virus. Front. Plant Sci. 2017, 8, 104. [Google Scholar] [CrossRef] [Green Version]
- Akbar, S.; Yao, W.; Yu, K.; Qin, L.; Ruan, M.; Powell, C.A.; Chen, B.; Zhang, M.Q. Photosynthetic characterization and expression profiles of sugarcane infected by Sugarcane mosaic virus (SCMV). Photosynth. Res. 2020, 150, 279–294. [Google Scholar] [CrossRef]
- Akbar, S.; Wei, Y.; Yuan, Y.; Khan, M.T.; Qin, L.; Powell, C.A.; Chen, B.; Zhang, M.Q. Gene expression profiling of reactive oxygen species (ROS) and antioxidant defense system following Sugarcane mosaic virus (SCMV) infection. BMC Plant Biol. 2020, 20, 532. [Google Scholar] [CrossRef] [PubMed]
- Zhang, J.; Zhang, X.; Tang, H.; Zhang, Q.; Hua, X.; Ma, X.; Zhu, F.; Jones, T.; Zhu, X.; Bowers, J.; et al. Allele-defined genome of the autopolyploid sugarcane Saccharum spontaneum L. Nat. Genet. 2018, 50, 1565–1573. [Google Scholar] [CrossRef] [PubMed] [Green Version]
- López-Gresa, M.P.; Lisón, P.; Kim, H.K.; Choi, Y.H.; Verpoorte, R.; Rodrigo, I.; Conejero, V.; Bellés, J.M.J. Metabolic fingerprinting of tomato mosaic virus infected Solanum lycopersicum. J. Plant Physiol. 2012, 169, 1586–1596. [Google Scholar] [CrossRef] [PubMed] [Green Version]
- Fernández-Calvino, L.; Osorio, S.; Hernández, M.L.; Hamada, I.B.; Del Toro, F.J.; Donaire, L.; Yu, A.; Bustos, R.; Fernie, A.R.; Martínez-Rivas, J.M.; et al. Virus-induced alterations in primary metabolism modulate susceptibility to Tobacco rattle virus in Arabidopsis. Plant Physiol. 2014, 166, 1821–1838. [Google Scholar] [CrossRef] [PubMed] [Green Version]
- Love, A.J.; Martin, T.; Graham, I.A.; Milner, J.J. Carbohydrate partitioning and sugar signalling in Cauliflower mosaic virus-infected turnip and Arabidopsis. Physiol. Mol. Plant Pathol. 2005, 67, 83–91. [Google Scholar] [CrossRef]
- De Haro, L.A.; Arellano, S.M.; Novák, O.; Feil, R.; Dumón, A.D.; Mattio, M.F.; Tarkowská, D.; Llauger, G.; Strnad, M.; Lunn, J.E.; et al. Mal de Río Cuarto virus infection causes hormone imbalance and sugar accumulation in wheat leaves. BMC Plant Biol. 2019, 19, 112. [Google Scholar] [CrossRef] [PubMed] [Green Version]
- Cohen, J.; Loebenstein, G.J.P. An electron microscope study of starch lesions in cucumber cotyledons infected with tobacco mosaic virus. Phytopathology 1975, 65, e9. [Google Scholar] [CrossRef]
- Tomenius, K.; Oxelfelt, P.J. Ultrastructure of pea leaf cells infected with three strains of red clover mottle virus. J. Gen. Virol. 1982, 61, 143–147. [Google Scholar] [CrossRef]
- Handford, M.G.; Carr, J.P. A defect in carbohydrate metabolism ameliorates symptom severity in virus-infected Arabidopsis thaliana. J. Gen. Virol. 2007, 88, 337–341. [Google Scholar] [CrossRef]
- Otulak, K.; Chouda, M.; Bujarski, J.; Garbaczewska, G.J.M. The evidence of Tobacco rattle virus impact on host plant organelles ultrastructure. Micron 2015, 70, 7–20. [Google Scholar] [CrossRef] [PubMed]
- Chandran, D.J. Co-option of developmentally regulated plant SWEET transporters for pathogen nutrition and abiotic stress tolerance. IUBMB Life 2015, 67, 461–471. [Google Scholar] [CrossRef] [Green Version]
- Calderan-Rodrigues, M.J.; Fonseca, J.G.; Clemente, H.; Labate, C.A.; Jamet, E. Glycoside hydrolases in plant cell wall proteomes: Predicting functions that could be relevant for improving biomass transformation processes. Adv. Biofuel Bioenergy 2018, 1, 165–182. [Google Scholar]
- Sawitri, W.D.; Afidah, S.N.; Nakagawa, A.; Hase, T.; Sugiharto, B.J. Identification of UDP-glucose binding site in glycosyltransferase domain of sucrose phosphate synthase from sugarcane (Saccharum officinarum) by structure-based site-directed mutagenesis. Biophys. Rev. 2018, 10, 293–298. [Google Scholar] [CrossRef] [PubMed] [Green Version]
- Stare, T.; Stare, K.; Weckwerth, W.; Wienkoop, S.; Gruden, K.J.P. Comparison between proteome and transcriptome response in potato (Solanum tuberosum L.) leaves following potato virus Y (PVY) infection. Proteomes 2017, 5, 14. [Google Scholar] [CrossRef] [PubMed] [Green Version]
- Berggård, T.; Linse, S.; James, P.J.P. Methods for the detection and analysis of protein–protein interactions. Proteomics 2007, 7, 2833–2842. [Google Scholar] [CrossRef]
- Koch, K.E. Carbohydrate-modulated gene expression in plants. Annu. Rev. Plant Biol. 1996, 47, 509–540. [Google Scholar] [CrossRef] [PubMed] [Green Version]
- Sheen, J.; Zhou, L.; Jang, J.-C. Sugars as signaling molecules. Curr. Opin. Plant Biol. 1999, 2, 410–418. [Google Scholar] [CrossRef]
- Smeekens, S.J.A. Sugar-induced signal transduction in plants. Annu. Rev. Plant Biol. 2000, 51, 49–81. [Google Scholar] [CrossRef] [PubMed] [Green Version]
- Ehness, R.; Ecker, M.; Godt, D.E.; Roitsch, T.J. Glucose and stress independently regulate source and sink metabolism and defense mechanisms via signal transduction pathways involving protein phosphorylation. Plant Cell 1997, 9, 1825–1841. [Google Scholar] [CrossRef] [PubMed] [Green Version]
- Roitsch, T.J. Source-sink regulation by sugar and stress. Curr. Opin. Plant Biol. 1999, 2, 198–206. [Google Scholar] [CrossRef]
- Herbers, K.; Meuwly, P.; Frommer, W.B.; Metraux, J.-P.; Sonnewald, U.J. Systemic acquired resistance mediated by the ectopic expression of invertase: Possible hexose sensing in the secretory pathway. Plant Cell 1996, 8, 793–803. [Google Scholar] [CrossRef] [PubMed] [Green Version]
- Xiao, W.; Sheen, J.; Jang, J.-C. The role of hexokinase in plant sugar signal transduction and growth and development. Plant Mol. Biol. 2000, 44, 451–461. [Google Scholar] [CrossRef] [PubMed]
- Johnson, R.; Ryan, C.A. Wound-inducible potato inhibitor II genes: Enhancement of expression by sucrose. Plant Mol. Biol. 1990, 14, 527–536. [Google Scholar] [CrossRef] [PubMed]
- Sadka, A.; DeWald, D.B.; May, G.D.; Park, W.D.; Mullet, J.E. Phosphate modulates transcription of soybean VspB and other sugar-inducible genes. Plant Cell 1994, 6, 737–749. [Google Scholar] [CrossRef] [Green Version]
- Schulz, A.; Beyhl, D.; Marten, I.; Wormit, A.; Neuhaus, E.; Poschet, G.; Büttner, M.; Schneider, S.; Sauer, N.; Hedrich, R.J. Proton-driven sucrose symport and antiport are provided by the vacuolar transporters SUC4 and TMT1/2. Plant J. 2011, 68, 129–136. [Google Scholar] [CrossRef] [PubMed]
- Eveland, A.L.; Jackson, D.P. Sugars, signalling, and plant development. J. Exp. Biol. 2012, 63, 3367–3377. [Google Scholar] [CrossRef] [PubMed] [Green Version]
- Schmölzer, K.; Gutmann, A.; Diricks, M.; Desmet, T.; Nidetzky, B.J. Sucrose synthase: A unique glycosyltransferase for biocatalytic glycosylation process development. Biotechnol. Adv. 2016, 34, 88–111. [Google Scholar] [CrossRef] [PubMed]
- Chen, S.; Hajirezaei, M.; Börnke, F.J. Differential expression of sucrose-phosphate synthase isoenzymes in tobacco reflects their functional specialization during dark-governed starch mobilization in source leaves. Plant Physiol. 2005, 139, 1163–1174. [Google Scholar] [CrossRef] [PubMed] [Green Version]
- Lunn, J.E.; ap Rees, T. Apparent equilibrium constant and mass-action ratio for sucrose-phosphate synthase in seeds of Pisum sativum. Biochem. J. 1990, 267, 739–743. [Google Scholar] [CrossRef] [Green Version]
- Verma, A.K.; Upadhyay, S.; Verma, P.C.; Solomon, S.; Singh, S.B. Functional analysis of sucrose phosphate synthase (SPS) and sucrose synthase (SS) in sugarcane (Saccharum) cultivars. Plant Biol. 2011, 13, 325–332. [Google Scholar] [CrossRef]
- Addy, H.S.; Nurmalasari, A.; Wahyudi, A.H.S.; Sholeh, A.; Anugrah, C.; Iriyanto, F.E.S.; Darmanto, W.; Sugiharto, B.J.A. Detection and response of sugarcane against the infection of Sugarcane mosaic virus (SCMV) in Indonesia. Agronomy 2017, 7, 50. [Google Scholar] [CrossRef] [Green Version]
- Shalitin, D.; Wolf, S.J. Cucumber mosaic virus infection affects sugar transport in melon plants. Plant Physiol. 2000, 123, 597–604. [Google Scholar] [CrossRef] [Green Version]
- Stein, O.; Granot, D.J. An overview of sucrose synthases in plants. Front. Plant Sci. 2019, 10, 95. [Google Scholar] [CrossRef] [Green Version]
- Chourey, P.S.; Nelson, O.E. The enzymatic deficiency conditioned by the shrunken-1 mutations in maize. Biochem. Genet. 1976, 14, 1041–1055. [Google Scholar] [CrossRef]
- Zrenner, R.; Salanoubat, M.; Willmitzer, L.; Sonnewald, U.J. Evidence of the crucial role of sucrose synthase for sink strength using transgenic potato plants (Solanum tuberosum L.). Plant J. 1995, 7, 97–107. [Google Scholar] [CrossRef] [PubMed]
- Tang, G.-Q.; Sturm, A.J.P. Antisense repression of sucrose synthase in carrot (Daucus carota L.) affects growth rather than sucrose partitioning. Plant Mol. Biol. 1999, 41, 465–479. [Google Scholar] [CrossRef] [PubMed]
- Herbers, K.; Takahata, Y.; Melzer, M.; Mock, H.P.; Hajirezaei, M.; Sonnewald, U. Regulation of carbohydrate partitioning during the interaction of potato virus Y with tobacco. Mol. Plant Pathol. 2000, 1, 51–59. [Google Scholar] [CrossRef]
- Fraser, R.S.S. The synthesis of tobacco mosaic virus RNA and ribosomal RNA in tobacco leaves. J. Gen. Virol. 1973, 18, 267–279. [Google Scholar] [CrossRef] [PubMed]
- Šindelár, L. Changes in the activity of glucose-6-phosphate dehydrogenase and some problems relating to its regulation in tobacco plants infected with potato virus Y. Biol. Plant. 1986, 28, 440–448. [Google Scholar] [CrossRef]
- Šindelářová, M.; Šindelář, L.; Burketová, L. Dynamic changes in the activities of glucose-6-phosphate dehydrogenase, ribulose bisphosphate carboxylase and ribonuclease in tobacco leaves, leaf discs and mesophyll protoplasts in relation to TMV multiplication. Physiol. Mol. Plant Pathol. 1997, 51, 99–109. [Google Scholar] [CrossRef]
- Turner, J.F.; Turner, D.H. The regulation of glycolysis and the pentose phosphate pathway. In Metabolism and Respiration; Academic Press: Cambridge, MA, USA, 1980; pp. 279–316. [Google Scholar]
- Šindelář, L.; Šindelářová, M. Correlation of viral RNA biosynthesis with glucose-6-phosphate dehydrogenase activity and host resistance. Planta 2002, 215, 862–869. [Google Scholar] [CrossRef]
- Grauvogel, C.; Brinkmann, H.; Petersen, J. Evolution of the Glucose-6-Phosphate Isomerase: The Plasticity of Primary Metabolism in Photosynthetic Eukaryotes. Mol. Biol. Evol. 2007, 24, 1611–1621. [Google Scholar] [CrossRef] [PubMed] [Green Version]
- Martin, W.; Herrmann, R.G.J. Gene transfer from organelles to the nucleus: How much, what happens, and why? Plant Physiol. 1998, 118, 9–17. [Google Scholar] [CrossRef] [Green Version]
- Yu, T.-S.; Lue, W.-L.; Wang, S.-M.; Chen, J.J. Mutation of Arabidopsis plastid phosphoglucose isomerase affects leaf starch synthesis and floral initiation. Plant Physiol. 2000, 123, 319–326. [Google Scholar] [CrossRef] [Green Version]
- Patrick, J.J. Solute efflux from the host at plant-microorganism interfaces. Funct. Plant Biol. 1989, 16, 53–67. [Google Scholar] [CrossRef]
- Riesmeier, J.W.; Willmitzer, L.; Frommer, W.B. Isolation and characterization of a sucrose carrier cDNA from spinach by functional expression in yeast. EMBO J. 1992, 11, 4705–4713. [Google Scholar] [CrossRef]
- Riesmeier, J.W.; Willmitzer, L.; Frommer, W.B. Evidence for an essential role of the sucrose transporter in phloem loading and assimilate partitioning. EMBO J. 1994, 13, 1–7. [Google Scholar] [CrossRef] [PubMed]
- Chen, L.-Q.; Hou, B.-H.; Lalonde, S.; Takanaga, H.; Hartung, M.L.; Qu, X.-Q.; Guo, W.-J.; Kim, J.-G.; Underwood, W.; Chaudhuri, B.; et al. Sugar transporters for intercellular exchange and nutrition of pathogens. Nature 2010, 468, 527–532. [Google Scholar] [CrossRef] [Green Version]
- Boorer, K.J.; Loo, D.; Wright, E.M. Steady-state and presteady-state kinetics of the H+/hexose cotransporter (STP1) from Arabidopsis thaliana expressed in Xenopus oocytes. J. Biol. Chem. 1994, 269, 20417–20424. [Google Scholar] [CrossRef]
- Chu, Z.; Yuan, M.; Yao, J.; Ge, X.; Yuan, B.; Xu, C.; Li, X.; Fu, B.; Li, Z.; Bennetzen, J.L.; et al. Promoter mutations of an essential gene for pollen development result in disease resistance in rice. Genes Dev. 2006, 20, 1250–1255. [Google Scholar] [CrossRef] [Green Version]
- Asai, Y.; Kobayashi, Y.; Kobayashi, I.J. Microbiology, Increased expression of the tomato SlSWEET15 gene during grey mold infection and the possible involvement of the sugar efflux to apoplasm in the disease susceptibility. J. Plant Pathol. Microbiol. 2016, 7, 329. [Google Scholar] [CrossRef] [Green Version]
- Tadege, M.; Bucher, M.; Stähli, W.; Suter, M.; Dupuis, I.; Kuhlemeier, C.J. Activation of plant defense responses and sugar efflux by expression of pyruvate decarboxylase in potato leaves. Plant J. 1998, 16, 661–671. [Google Scholar] [CrossRef] [Green Version]
- Zerillo, M.M.; Adhikari, B.N.; Hamilton, J.P.; Buell, C.R.; Lévesque, C.A.; Tisserat, N.J. Carbohydrate-active enzymes in Pythium and their role in plant cell wall and storage polysaccharide degradation. PLoS ONE 2013, 8, e72572. [Google Scholar]
- Vogt, T.; Jones, P.J. Glycosyltransferases in plant natural product synthesis: Characterization of a supergene family. Trends Plants Sci. 2000, 5, 380–386. [Google Scholar] [CrossRef]
- Bowles, D.; Lim, E.-K.; Poppenberger, B.; Vaistij, F.E. Glycosyltransferases of lipophilic small molecules. Annu. Rev. Plant Biol. 2006, 57, 567–597. [Google Scholar] [CrossRef]
- Jones, P.; Vogt, T. Glycosyltransferases in secondary plant metabolism: Tranquilizers and stimulant controllers. Planta 2001, 213, 164–174. [Google Scholar] [CrossRef]
- Le Roy, J.; Huss, B.; Creach, A.; Hawkins, S.; Neutelings, G.J. Glycosylation is a major regulator of phenylpropanoid availability and biological activity in plants. Front. Plant Sci. 2016, 7, 735. [Google Scholar] [CrossRef] [Green Version]
- Cantarel, B.L.; Coutinho, P.M.; Rancurel, C.; Bernard, T.; Lombard, V.; Henrissat, B.J. The Carbohydrate-Active EnZymes database (CAZy): An expert resource for glycogenomics. Nucleic Acids Res. 2009, 37, D233–D238. [Google Scholar] [CrossRef]
- Ökmen, B.; Bachmann, D.; De Wit, P.J. A conserved GH17 glycosyl hydrolase from plant pathogenic Dothideomycetes releases a DAMP causing cell death in tomato. Mol. Plant Pathol. 2019, 20, 1710–1721. [Google Scholar] [CrossRef]
- Akbar, S.; Tahir, M.; Wang, M.-B.; Liu, Q.J.B. Expression analysis of hairpin RNA carrying Sugarcane mosaic virus (SCMV) derived sequences and transgenic resistance development in a model rice plant. BioMed Res. Int. 2017, 2017, 1646140. [Google Scholar] [CrossRef] [Green Version]
- Kanehisa, M.; Goto, S.; Sato, Y.; Kawashima, M.; Furumichi, M.; Tanabe, M. Data, information, knowledge and principle: Back to metabolism in KEGG. Nucleic Acids Res. 2013, 42, D199–D205. [Google Scholar] [CrossRef] [Green Version]


Publisher’s Note: MDPI stays neutral with regard to jurisdictional claims in published maps and institutional affiliations. |
© 2021 by the authors. Licensee MDPI, Basel, Switzerland. This article is an open access article distributed under the terms and conditions of the Creative Commons Attribution (CC BY) license (https://creativecommons.org/licenses/by/4.0/).
Share and Cite
Akbar, S.; Yao, W.; Qin, L.; Yuan, Y.; Powell, C.A.; Chen, B.; Zhang, M. Comparative Analysis of Sugar Metabolites and Their Transporters in Sugarcane Following Sugarcane mosaic virus (SCMV) Infection. Int. J. Mol. Sci. 2021, 22, 13574. https://doi.org/10.3390/ijms222413574
Akbar S, Yao W, Qin L, Yuan Y, Powell CA, Chen B, Zhang M. Comparative Analysis of Sugar Metabolites and Their Transporters in Sugarcane Following Sugarcane mosaic virus (SCMV) Infection. International Journal of Molecular Sciences. 2021; 22(24):13574. https://doi.org/10.3390/ijms222413574
Chicago/Turabian StyleAkbar, Sehrish, Wei Yao, Lifang Qin, Yuan Yuan, Charles A. Powell, Baoshan Chen, and Muqing Zhang. 2021. "Comparative Analysis of Sugar Metabolites and Their Transporters in Sugarcane Following Sugarcane mosaic virus (SCMV) Infection" International Journal of Molecular Sciences 22, no. 24: 13574. https://doi.org/10.3390/ijms222413574