Article

Comprehensive Simulation of Ca2+ Transients in the Continuum of Mouse Skeletal Muscle Fiber Types

by
Oscar A. Rincón
1,2,
Andrés F. Milán
2,
Juan C. Calderón
2 and
Marco A. Giraldo
1,*
1
Biophysics Group, Institute of Physics, University of Antioquia, Medellín 050010, Colombia
2
Physiology and Biochemistry Research Group-PHYSIS, Faculty of Medicine, University of Antioquia, Medellín 050010, Colombia
*
Author to whom correspondence should be addressed.
Int. J. Mol. Sci. 2021, 22(22), 12378; https://doi.org/10.3390/ijms222212378
Submission received: 6 September 2021 / Revised: 1 October 2021 / Accepted: 12 October 2021 / Published: 17 November 2021
(This article belongs to the Special Issue Muscular Structure, Physiology and Metabolism)

Abstract

:
Mag-Fluo-4 has revealed differences in the kinetics of the Ca2+ transients of mammalian fiber types (I, IIA, IIX, and IIB). We simulated the changes in [Ca2+] through the sarcomere of these four fiber types, considering classical (troponin –Tn–, parvalbumin –Pv–, adenosine triphosphate –ATP–, sarcoplasmic reticulum Ca2+ pump –SERCA–, and dye) and new (mitochondria –MITO–, Na+/Ca2+ exchanger –NCX–, and store-operated calcium entry –SOCE–) Ca2+ binding sites, during single and tetanic stimulation. We found that during a single twitch, the sarcoplasmic peak [Ca2+] for fibers type IIB and IIX was around 16 µM, and for fibers type I and IIA reached 10–13 µM. The release rate in fibers type I, IIA, IIX, and IIB was 64.8, 153.6, 238.8, and 244.5 µM ms−1, respectively. Both the pattern of change and the peak concentrations of the Ca2+-bound species in the sarcoplasm (Tn, PV, ATP, and dye), the sarcolemma (NCX, SOCE), and the SR (SERCA) showed the order IIB ≥ IIX > IIA > I. The capacity of the NCX was 2.5, 1.3, 0.9, and 0.8% of the capacity of SERCA, for fibers type I, IIA, IIX, and IIB, respectively. MITO peak [Ca2+] ranged from 0.93 to 0.23 µM, in fibers type I and IIB, respectively, while intermediate values were obtained in fibers IIA and IIX. The latter numbers doubled during tetanic stimulation. In conclusion, we presented a comprehensive mathematical model of the excitation–contraction coupling that integrated most classical and novel Ca2+ handling mechanisms, overcoming the limitations of the fast- vs. slow-fibers dichotomy and the use of slow dyes.

1. Introduction

In mammalian skeletal muscle fibers, the action potentials (AP) lead to contractions mediated by the release of Ca2+ from the sarcoplasmic reticulum (SR), in a process known as excitation–contraction coupling (ECC) [1]. After release, the Ca2+ ions bind to a diversity of sites, which include troponin (Tn), parvalbumin (PV), and adenosine triphosphate (ATP). They also flow into the mitochondria (MITO) [1], before being transported back to the SR by a Ca2+ ATPase (SERCA). Small amounts of Ca2+ are transported outside the cell by the Na+/Ca2+ exchanger (NCX). Store-operated Ca2+ entry (SOCE) allows Ca2+ enter the fiber through Orai1, as a response to the intra SR Ca2+ sensing function of the stromal interaction molecules (STIM) [2,3,4]. In fast twitch fibers, SOCE acts in a transient fast mode during an individual AP and after each AP in a train of stimulations [5].
Experiments in muscle fibers loaded with fluorescent indicators have revealed sizeable differences in the kinetic parameters of electrically elicited Ca2+ transients according to the continuum of fiber types [6]. These variances arise due to the differential quantity and kinetics of the proteins and organelles involved in Ca2+ handling present in the muscle fibers [1,6]. For instance, SERCA is more abundant in fast fibers [7,8], and PV is almost negligible in slow, but abundantly found in the fastest fibers [9].
Mathematical models that integrate information obtained on mammalian ECC under different experimental conditions have been used to simulate Ca2+ transients in both slow-twitch and fast-twitch fibers [10,11]. However, the nature of the fibers used has not always been doubtlessly established. Furthermore, a major limitation of several models is their dichotomic approach (slow and fast), yet there are experimentally measured Ca2+ transients of at least four fiber types: I, IIA, IIX, and IIB [6]. Some models have not included important mechanisms dealing with Ca2+, such as the mitochondria or the NCX, despite their importance in shaping the Ca2+ transients in different fiber types [12,13].
A recent model of skeletal muscle ECC, interestingly included the MITO and proteins such as the mitochondrial Ca2+ uniporter (MCU) and the mitochondrial NCX (NCE) [14]. However, that model was performed based on Ca2+ transients’ measurements with Fura-2, while the most suitable dyes to study ECC in skeletal muscle seem to be the low affinity, fast Ca2+ dyes, such as Mag-Fura-2 and Mag-Fluo-4 [1,15]. This explains why the reported amplitude of the signal (0.4 µM) was very low compared to previously published values being 10–20 µM in murine Flexor digitorum brevis (FDB) fibers with Mag-Fura-2 and Mag-Fluo-4 [15,16,17].
In this work, we used measurements carried out with the fast Ca2+ dye Mag-Fluo-4 and a theoretical model to estimate the Ca2+ movements produced during single and tetanic Ca2+ transients in the four murine skeletal muscle fiber types. This permitted us to make a simulated comparison of the Ca2+ movement across the four fiber types, including the variations in the mitochondrial [Ca2+], the NCX, the SOCE, and their influence on the sarcoplasmic Ca2+ regulation, and further overcoming the limitations imposed by slow Ca2+ dyes.

2. Results

Experimentally recorded, raw, single, and tetanic Mag-Fluo-4 Ca2+ transients were calibrated in order to obtain the ∆[Ca2+] in the sarcoplasm (Figure 1). The [Ca2+] peaks for the continuum of fiber types were: IIB and IIX: 16.58 µM, IIA: 12.77 µM, and I: 10.13 µM (Figure 1A). For the tetanic Ca2+ transients, subsequent peaks were also calculated (I: 11.24, 12.95, 14.81, and 16.47 µM; IIB: 12.13, 12.29, 12.24, and 11.96 µM) (Figure 1B).
These calibrated signals fed all next estimations and simulations, as described in the Methods section and Table 1. First, we mathematically estimated the release rate of Ca2+ (JRel) for both single and tetanic transients (Figure 2A,B; Table 2) and then simulated the Ca2+ kinetics in the sarcoplasm (Figure 2C,D), the SR (Figure 2E,F), and MITO (Figure 2G,H). Fibers type II peaked higher than fibers type I (~137% higher for IIA and 269–277% higher for IIX and IIB). The JRel estimated in tetanic Ca2+ transients shows that the last peak’s amplitude is reduced over 10 times for type I fibers and up to 7 times for IIB, IIX, and IIA (Figure 2B; Table 2). The simulated sarcoplasmic ∆[Ca2+] closely resembled the experimental recording described above. The [Ca2+]SR rapidly decreased and slowly recovered as expected. Although qualitatively similar for all fiber types, quantitative differences arose mainly between the fibers type I and all fibers type II, in agreement with the fact that the Ca2+ released by the fibers type I was the lowest.
There was a higher value in ∆[Ca2+]MITO for the fibers type I (up to four times) as compared to the three fibers type II. The total [Ca2+] in MITO, considering both forms, bound to B and free, achieves a peak value of 0.26–1.12 µM after a single AP and 0.72–2.8 µM after 5 AP. Regarding the SR compartment, our calculations show that the available Ca2+ is reduced up to ~63% (I: 82%, IIA: 63%, IIX: 64%, and IIB: 63%) for single transients, but to almost 53% (I: 76%, IIA: 63%, IIX: 56%, and IIB: 53%) after a train of five shocks (Figure 2E,F).
We also calculated the variations in [Ca2+] for the buffers present in the three simulated compartments (Figure 3), for both single (left column) and tetanic transients (right column). The differences in [CaPV] show the PV buffer influence in the first part of [Ca2+] decay obtained in the IIX and IIB fibers, compared with I and IIA fibers. The second part of the decay, when the sarcoplasmic [Ca2+] is near steady state, was less affected by the PV buffering. The Δ[CaDye] and Δ[CaATP] simulations were not shown as they resemble the shape of the sarcoplasmic [Ca2+] already shown (Figure 2C,D), but with different peaks (reported in Table 3). The ∆[CaDye] explains only 2.7% of the intracellular dye in the fiber type IIA and 2.2% in fiber types I, IIX, and IIB, thus ensuring dye unsaturation.
Figure 4 shows that the [Ca2+] in the sarcoplasm is mainly recaptured by the SERCA. In general, the amount of Ca2+ handled by the NCX was 41–121 times lower after 1 AP and 34–88 times lower after 5 AP, compared to the SERCA capacity. Moreover, the rate of transport by NCX was notably reduced when the sarcoplasmic [Ca2+] achieves low values in IIX and IIB fibers given its low affinity. The SERCA pump maintains its influence in [Ca2+] regulation near resting conditions. The [Ca2+] returned to the sarcoplasm by the SOCE was negligible in all fibers compared to the total [Ca2+] released. The total [Ca2+] handled by each mechanism after the simulated time intervals, the free [Ca2+] reached in each compartment, and the Ca2+ bound to the chemical species are reported in Table 3. A longer time interval of the tetanic Ca2+ transient simulation was included for some reactions (Figure S1). The total amount of Ca2+ obtained at rest considering all compartments of the model, including the extracellular space, remained constant during the simulated activation interval. We obtained that the variations in the total amount of Ca2+ were lower than 10−6 µM. This result evidence that truncation errors were negligible during the simulations.

3. Discussion

The main findings of the present work were: (i) during a single twitch, the sarcoplasmic peak [Ca2+] for fibers type IIB and IIX is between 15–25 µM, and for fibers type I and IIA reaches 6–12 µM, (ii) both the pattern of change and the peak concentrations of the Ca2+-bound species in the sarcomere, the sarcolemma, and inside the SR showed the order IIB ≥ IIX > IIA > I, (iii) the mitochondrial peak [Ca2+] and the MITO buffers saturation showed the pattern I >> IIA >> IIX ≥ IIB.
Previous models of mammalian ECC were affected by either uncertainty in the classification of fiber types, unreliable kinetics of the raw Ca2+ signals due to the use of slow Ca2+ dyes, or the lack of information about the role of several intracellular compartments in Ca2+ handling. To overcome these limitations, we based our model on the first calibration of Ca2+ transients of the four main fiber types found in mammals, obtained using the fast Ca2+ dye Mag-Fluo-4, and integrated new information gathered on MITO, SR, NCX, and SOCE, along basic knowledge on sarcoplasmic Ca2+ movements and buffering.

3.1. A Model which Includes Four Fiber Types

Preceding models addressed ECC in one or two fiber types, mainly as most previous functional and biochemical information came from a dichotomic approach of muscle fibers: either slow vs. fast, or type I vs. type II [13,14,16,34,35,36,37]. Additionally, simulations that have recently become spatially and mathematically more complex have remained biochemically oversimplified [38,39]. By taking Ca2+ transients obtained in molecularly typed fibers covering the whole spectra from I to IIB as experimental source, our model adds novel information on the ECC-fiber type relationships.
The fact that molecular and biochemical differences (i.e., isoforms and their biochemical properties) underlie the differences in ECC among fiber types has been described in detail elsewhere and we refer the readers to those papers [1,6,40].
However, there is still a lack of molecular and biochemical information, particularly for fibers type IIA and IIX. Our adjustments and results for these two types of fibers seem reliable as most values obtained laid between those of fibers type I and IIB. This agrees with the fact that fibers IIA and IIX showed kinetics of the Ca2+ transients, Ca2+ sensitivity, and other dynamic properties which are mostly intermediate between I and IIB [6,40,41,42]. Together, this confirms that most values of molecular, biochemical, and physiological parameters follow a continuum from I, to IIA, to IIX, to IIB.

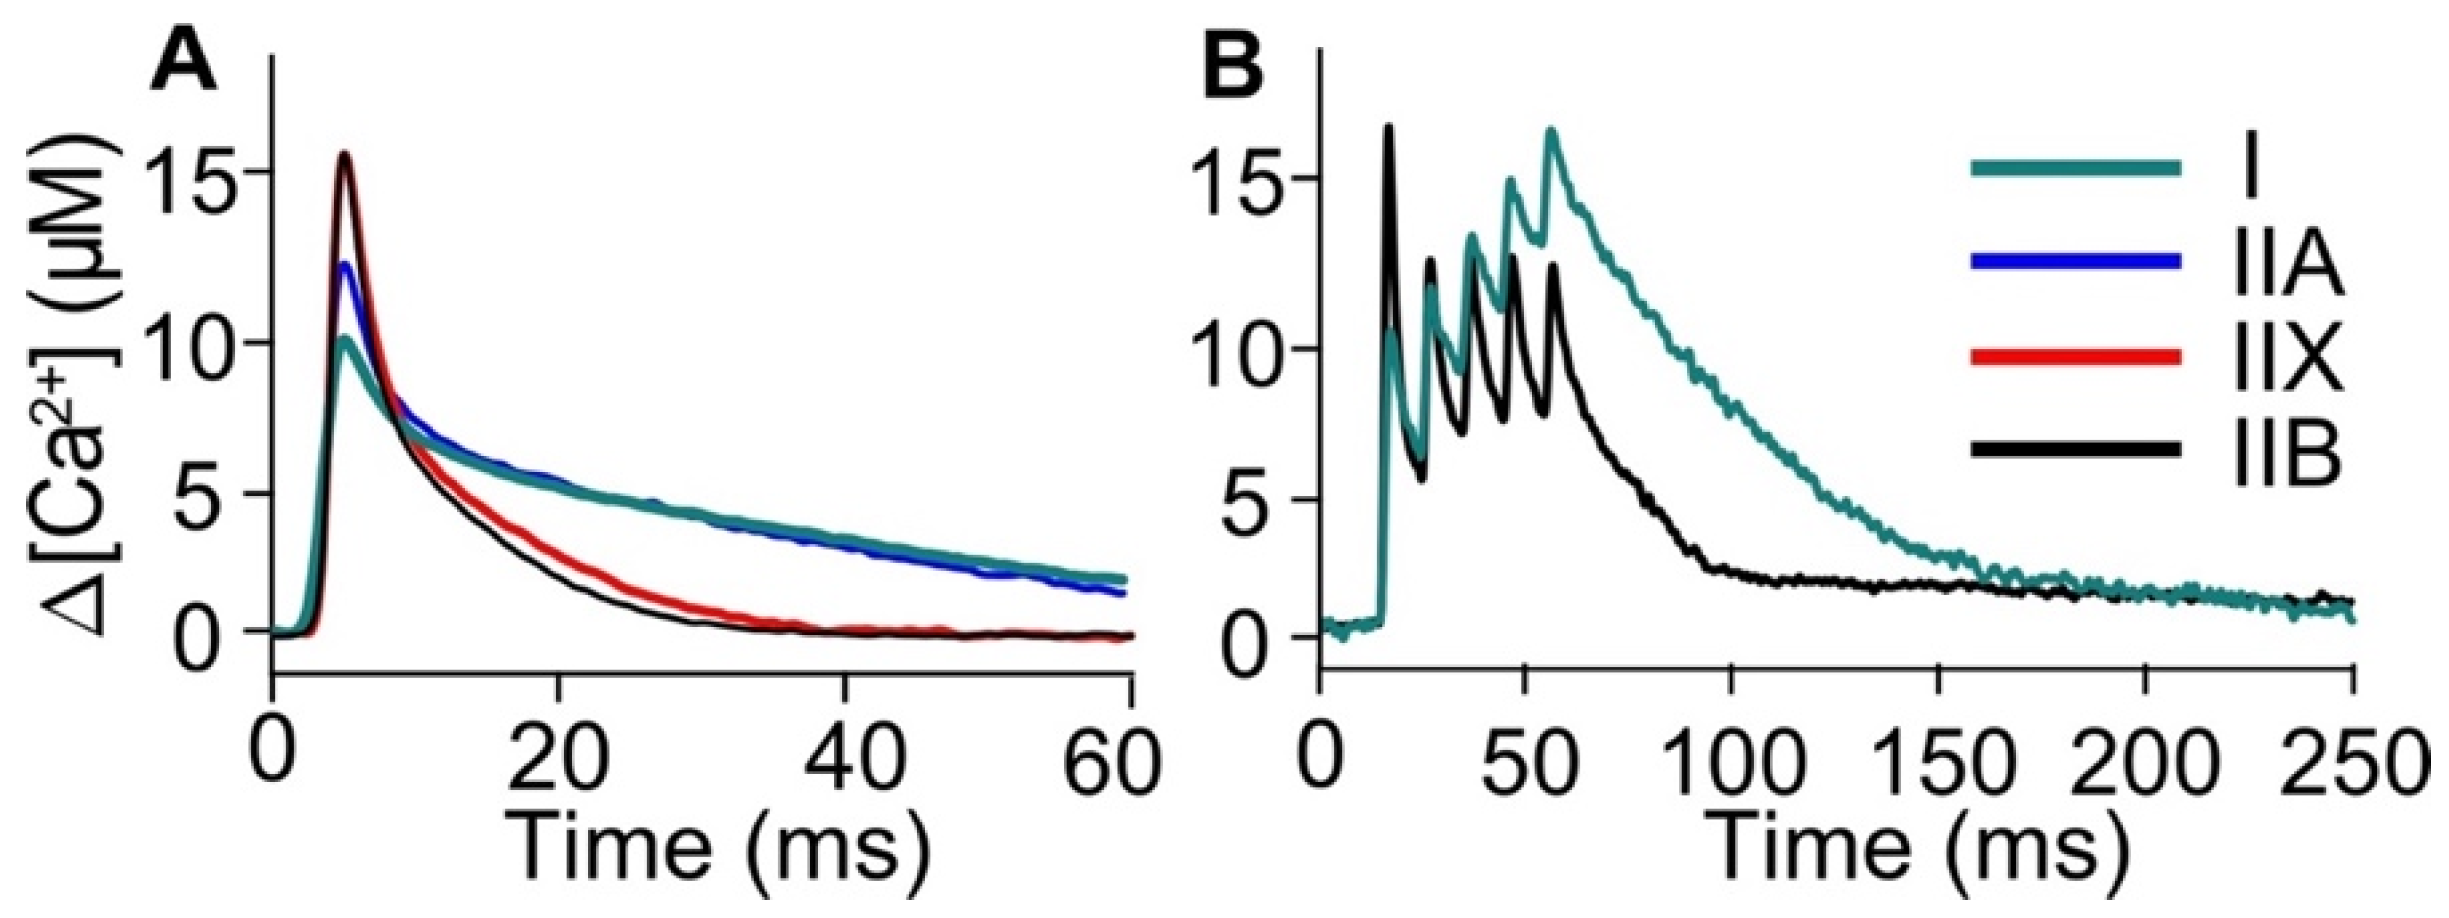
3.2. [Ca2+] Kinetics with a Fast Ca2+ Dye

The Ca2+ transients modeled in the present study were obtained with the fast Ca2+ dye Mag-Fluo-4. Two issues with quantitative impact on the results deserve attention: the biochemical properties of the dye and its loading conditions.
This dye has a 2:1 Mag-Fluo-4–Ca2+ binding stoichiometry, with an in situ Kd of 1.652 × 10⁵ µM2 [17]. This explains why it can reliably track the Ca2+ transients even in the fastest types, i.e., IIB, demonstrate subtle differences among all four fiber types and resolve every peak in a tetanic transient, being a trustable source for the model. On the other hand, as the fibers typically have ~200 µM of Mag-Fluo-4 [17], we found that less than ~3% of the dye is bound to Ca2+.
The very low affinity of the dye and the lack of saturation confer Mag-Fluo-4 the ability to determine a trustable peak sarcoplasmic [Ca2+]. Our results with Mag-Fluo-4 (calibration performed in the present study and [17]) join those with Mag-Fura-2 [16,35] which show that the peak [Ca2+] in fast fibers IIX or IIB is typically between 15 and 25 µM in mammalian skeletal muscle (16–22 °C). The numbers for type I and IIA fibers also agree with a study reporting peak Ca2+ for soleus slow fibers [13]. That work, however, may have really used type I and IIA fibers, as the periphery of the soleus muscles of mouse used in the experiments have both types of fibers evenly distributed, as we have verified using specific antibodies and confocal microscopy (not shown). In conclusion, that paper and our results agree in that peak [Ca2+] for fibers types I and IIA is between 6 and 12 µM [13]. The above numbers are one order of magnitude higher than those reported with slow dyes [14,33,43,44]. This fact may, for instance, reduce the estimated maximum rate of Ca2+ flux during SOCE or excitation-coupled Ca2+ entry (ECCE) activations [33,45], as this value depends on the driving force for Ca2+ [46], which in turn is reduced if sarcoplasmic [Ca2+] is raised. Trustable peak sarcoplasmic [Ca2+] also permits a better quantitation of the chemical species involved in ECC ([CaTn], [CaTNS], [CaPV], [CaATP], [CaDye], free [Ca2+], etc.), including peak [Ca2+] inside compartments such as MITO.

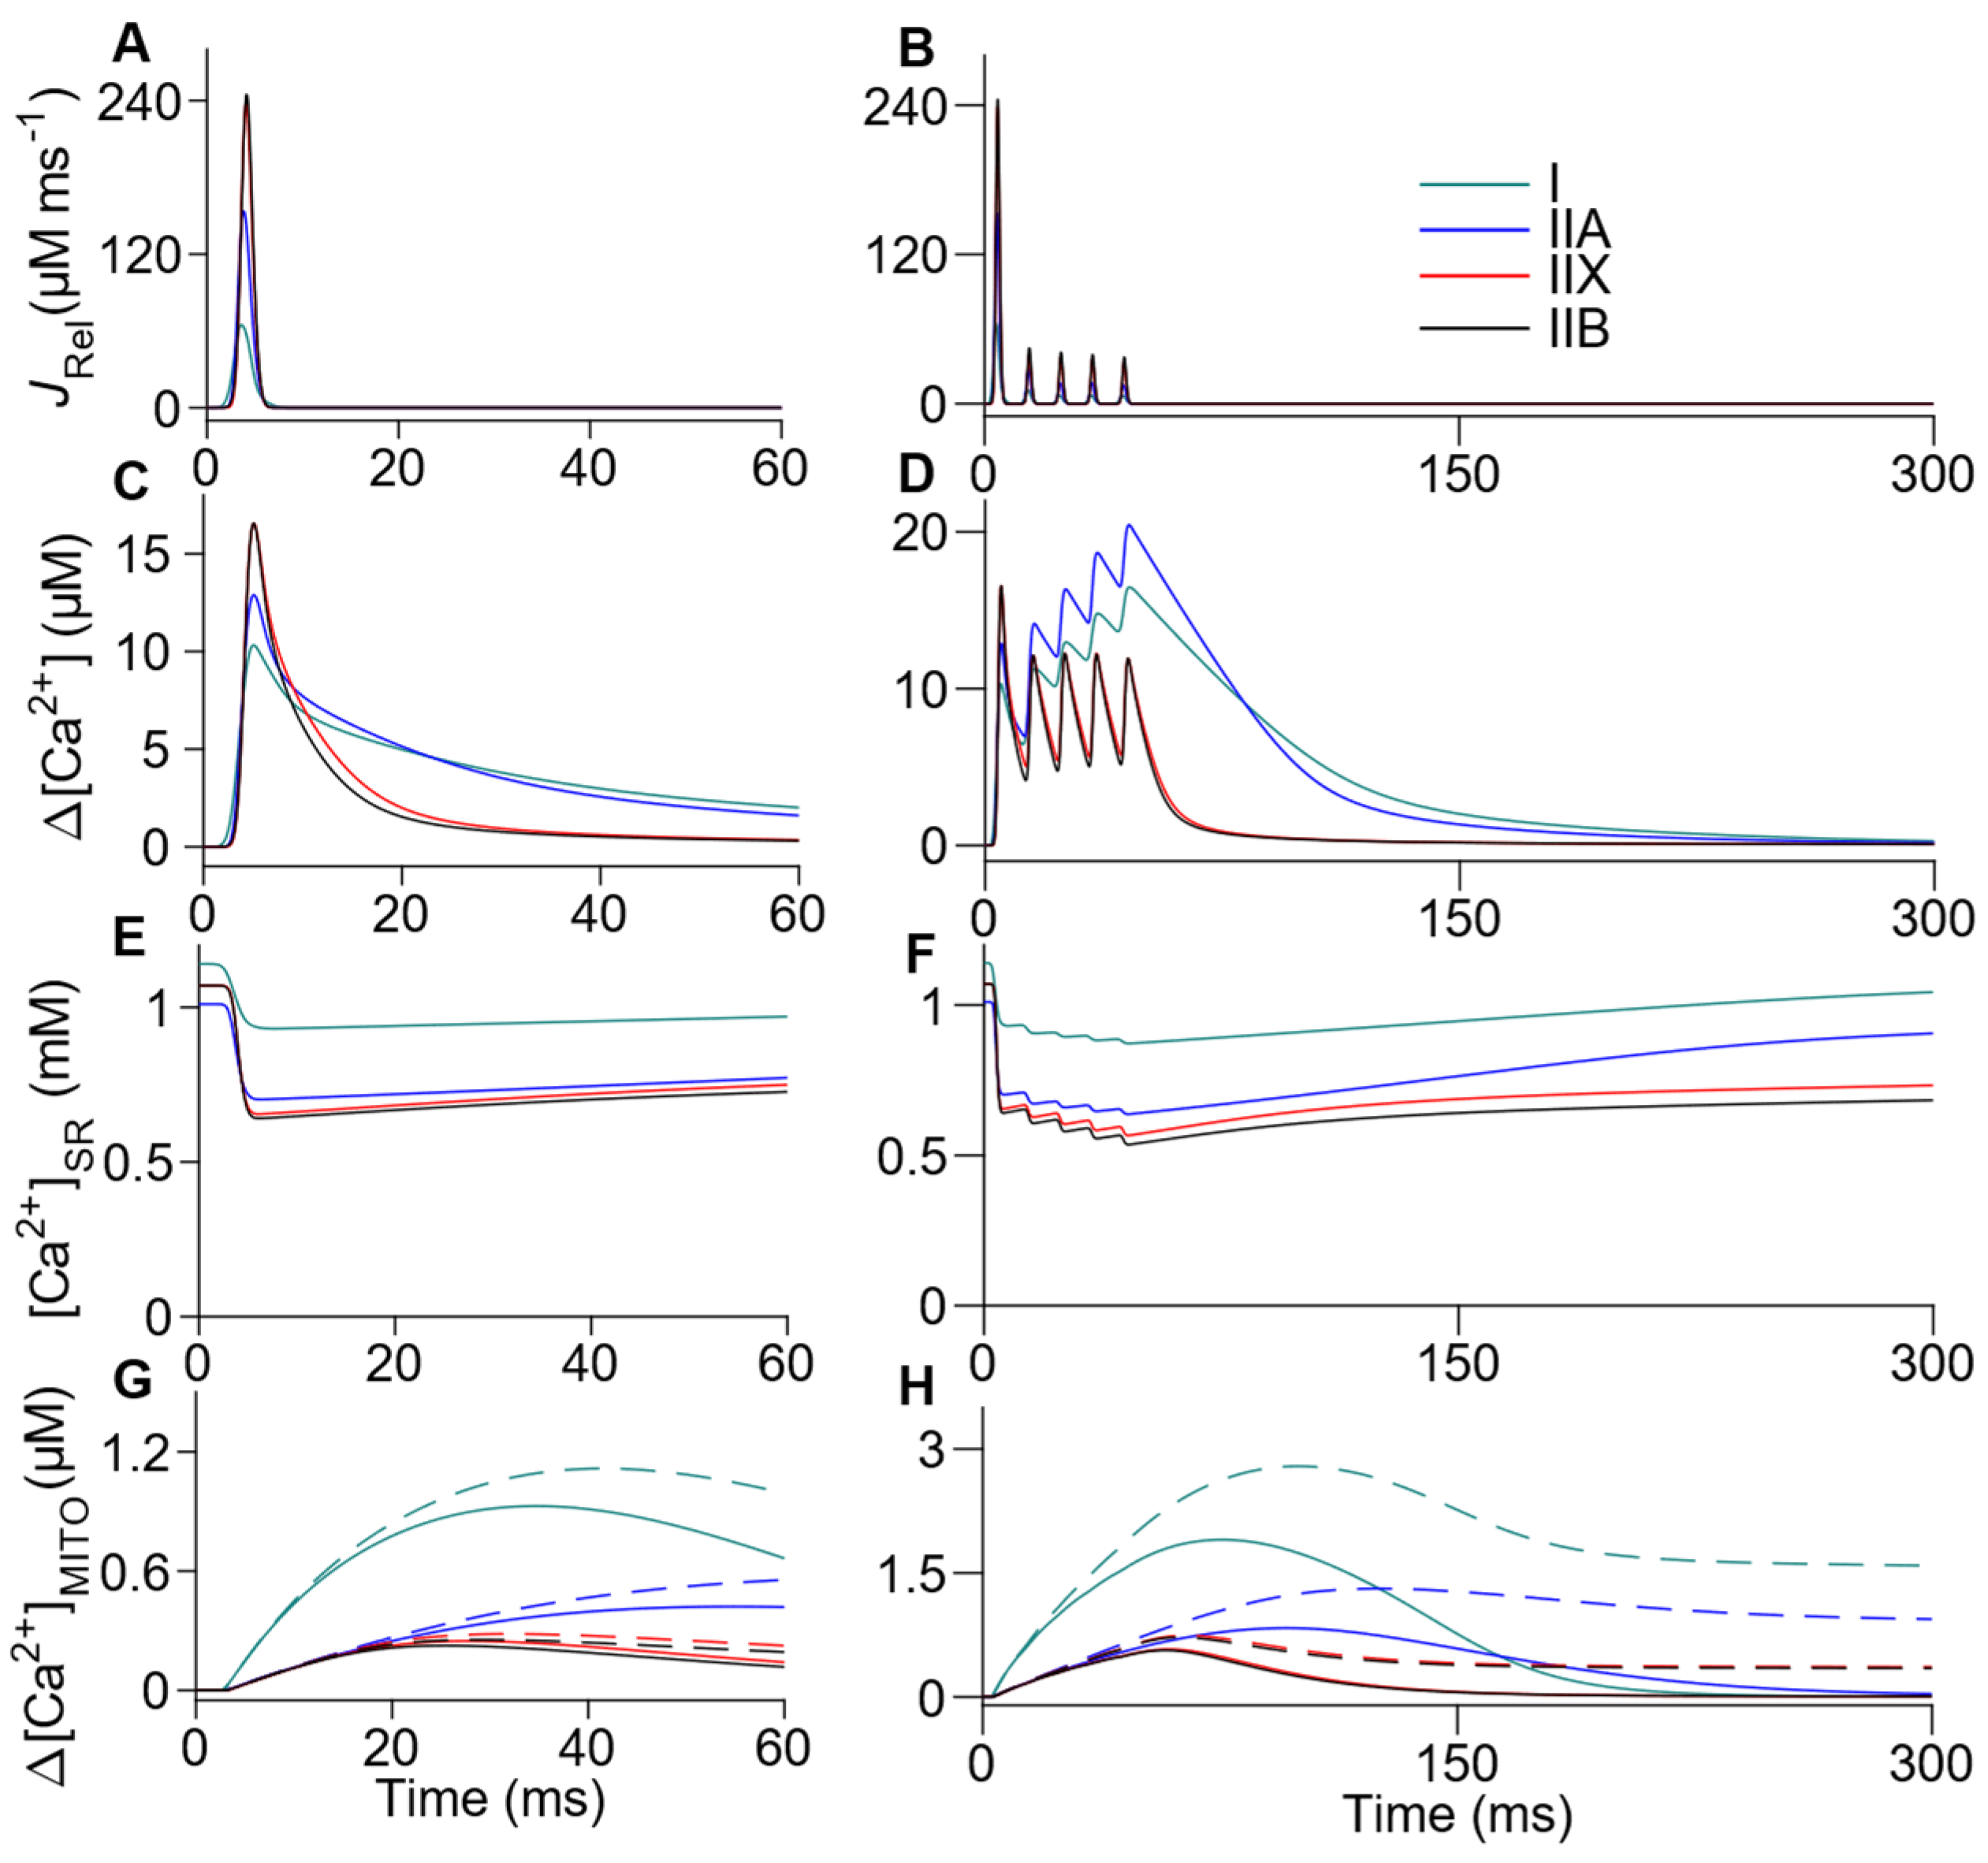
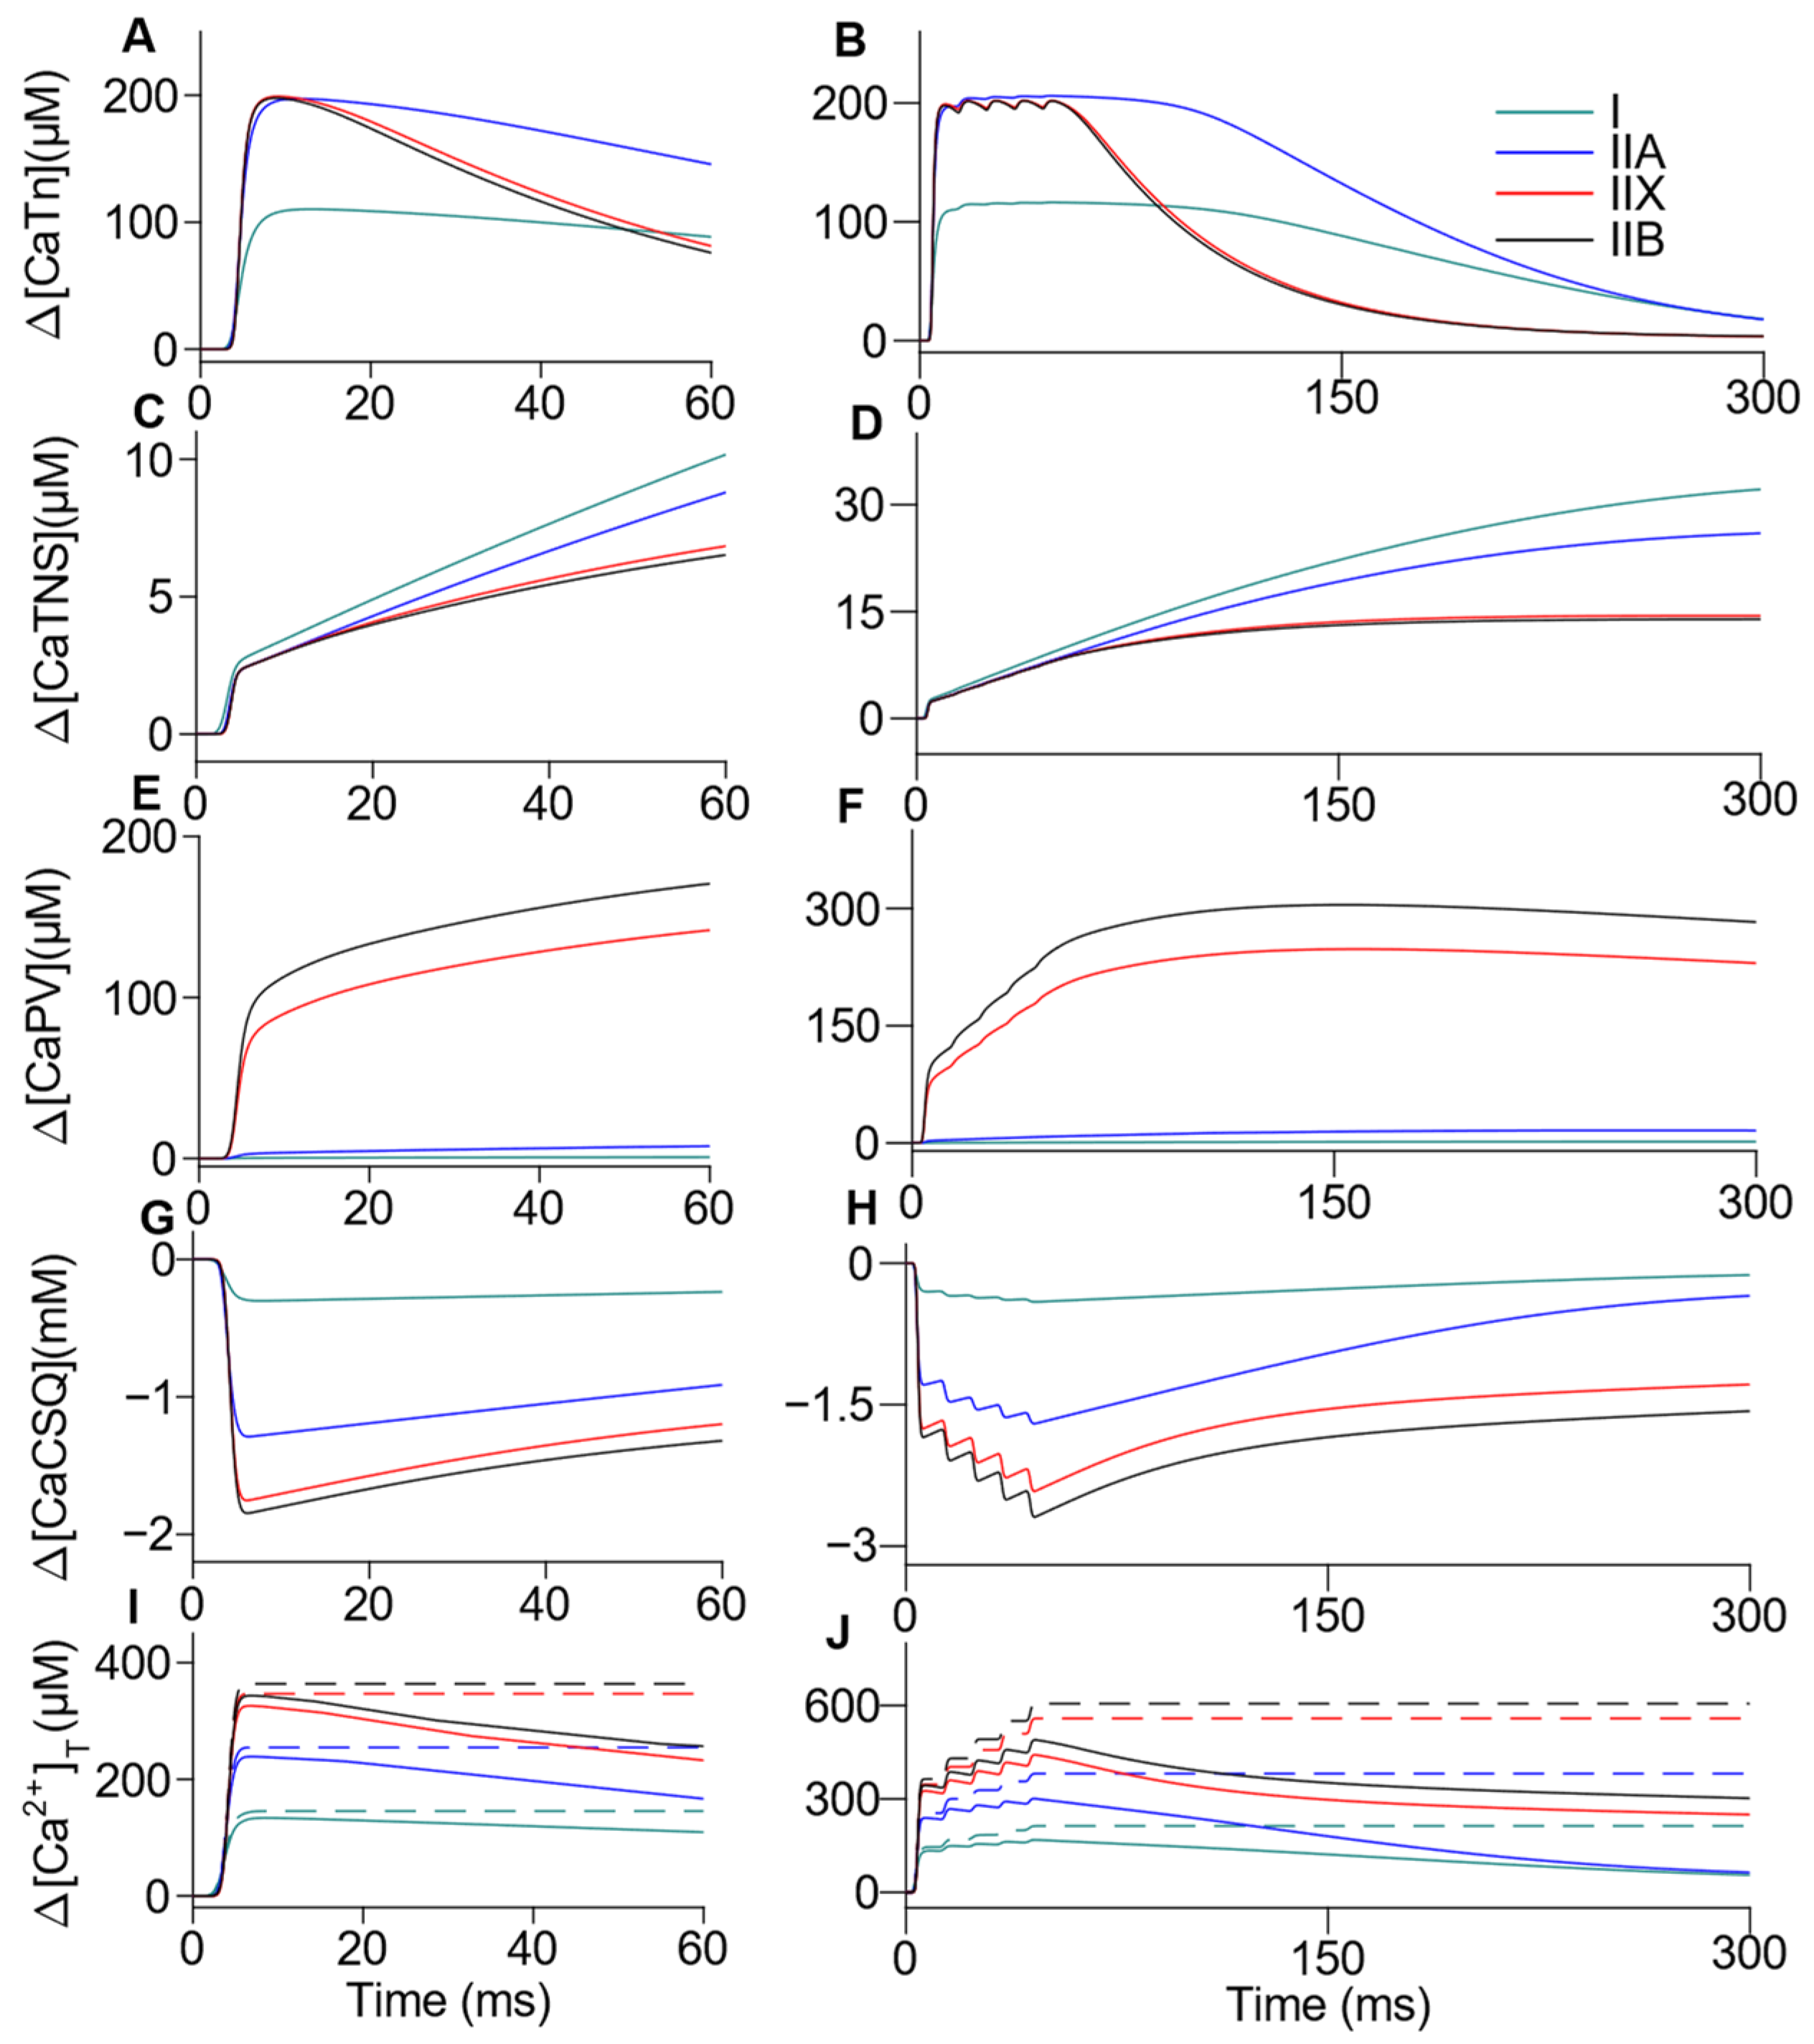
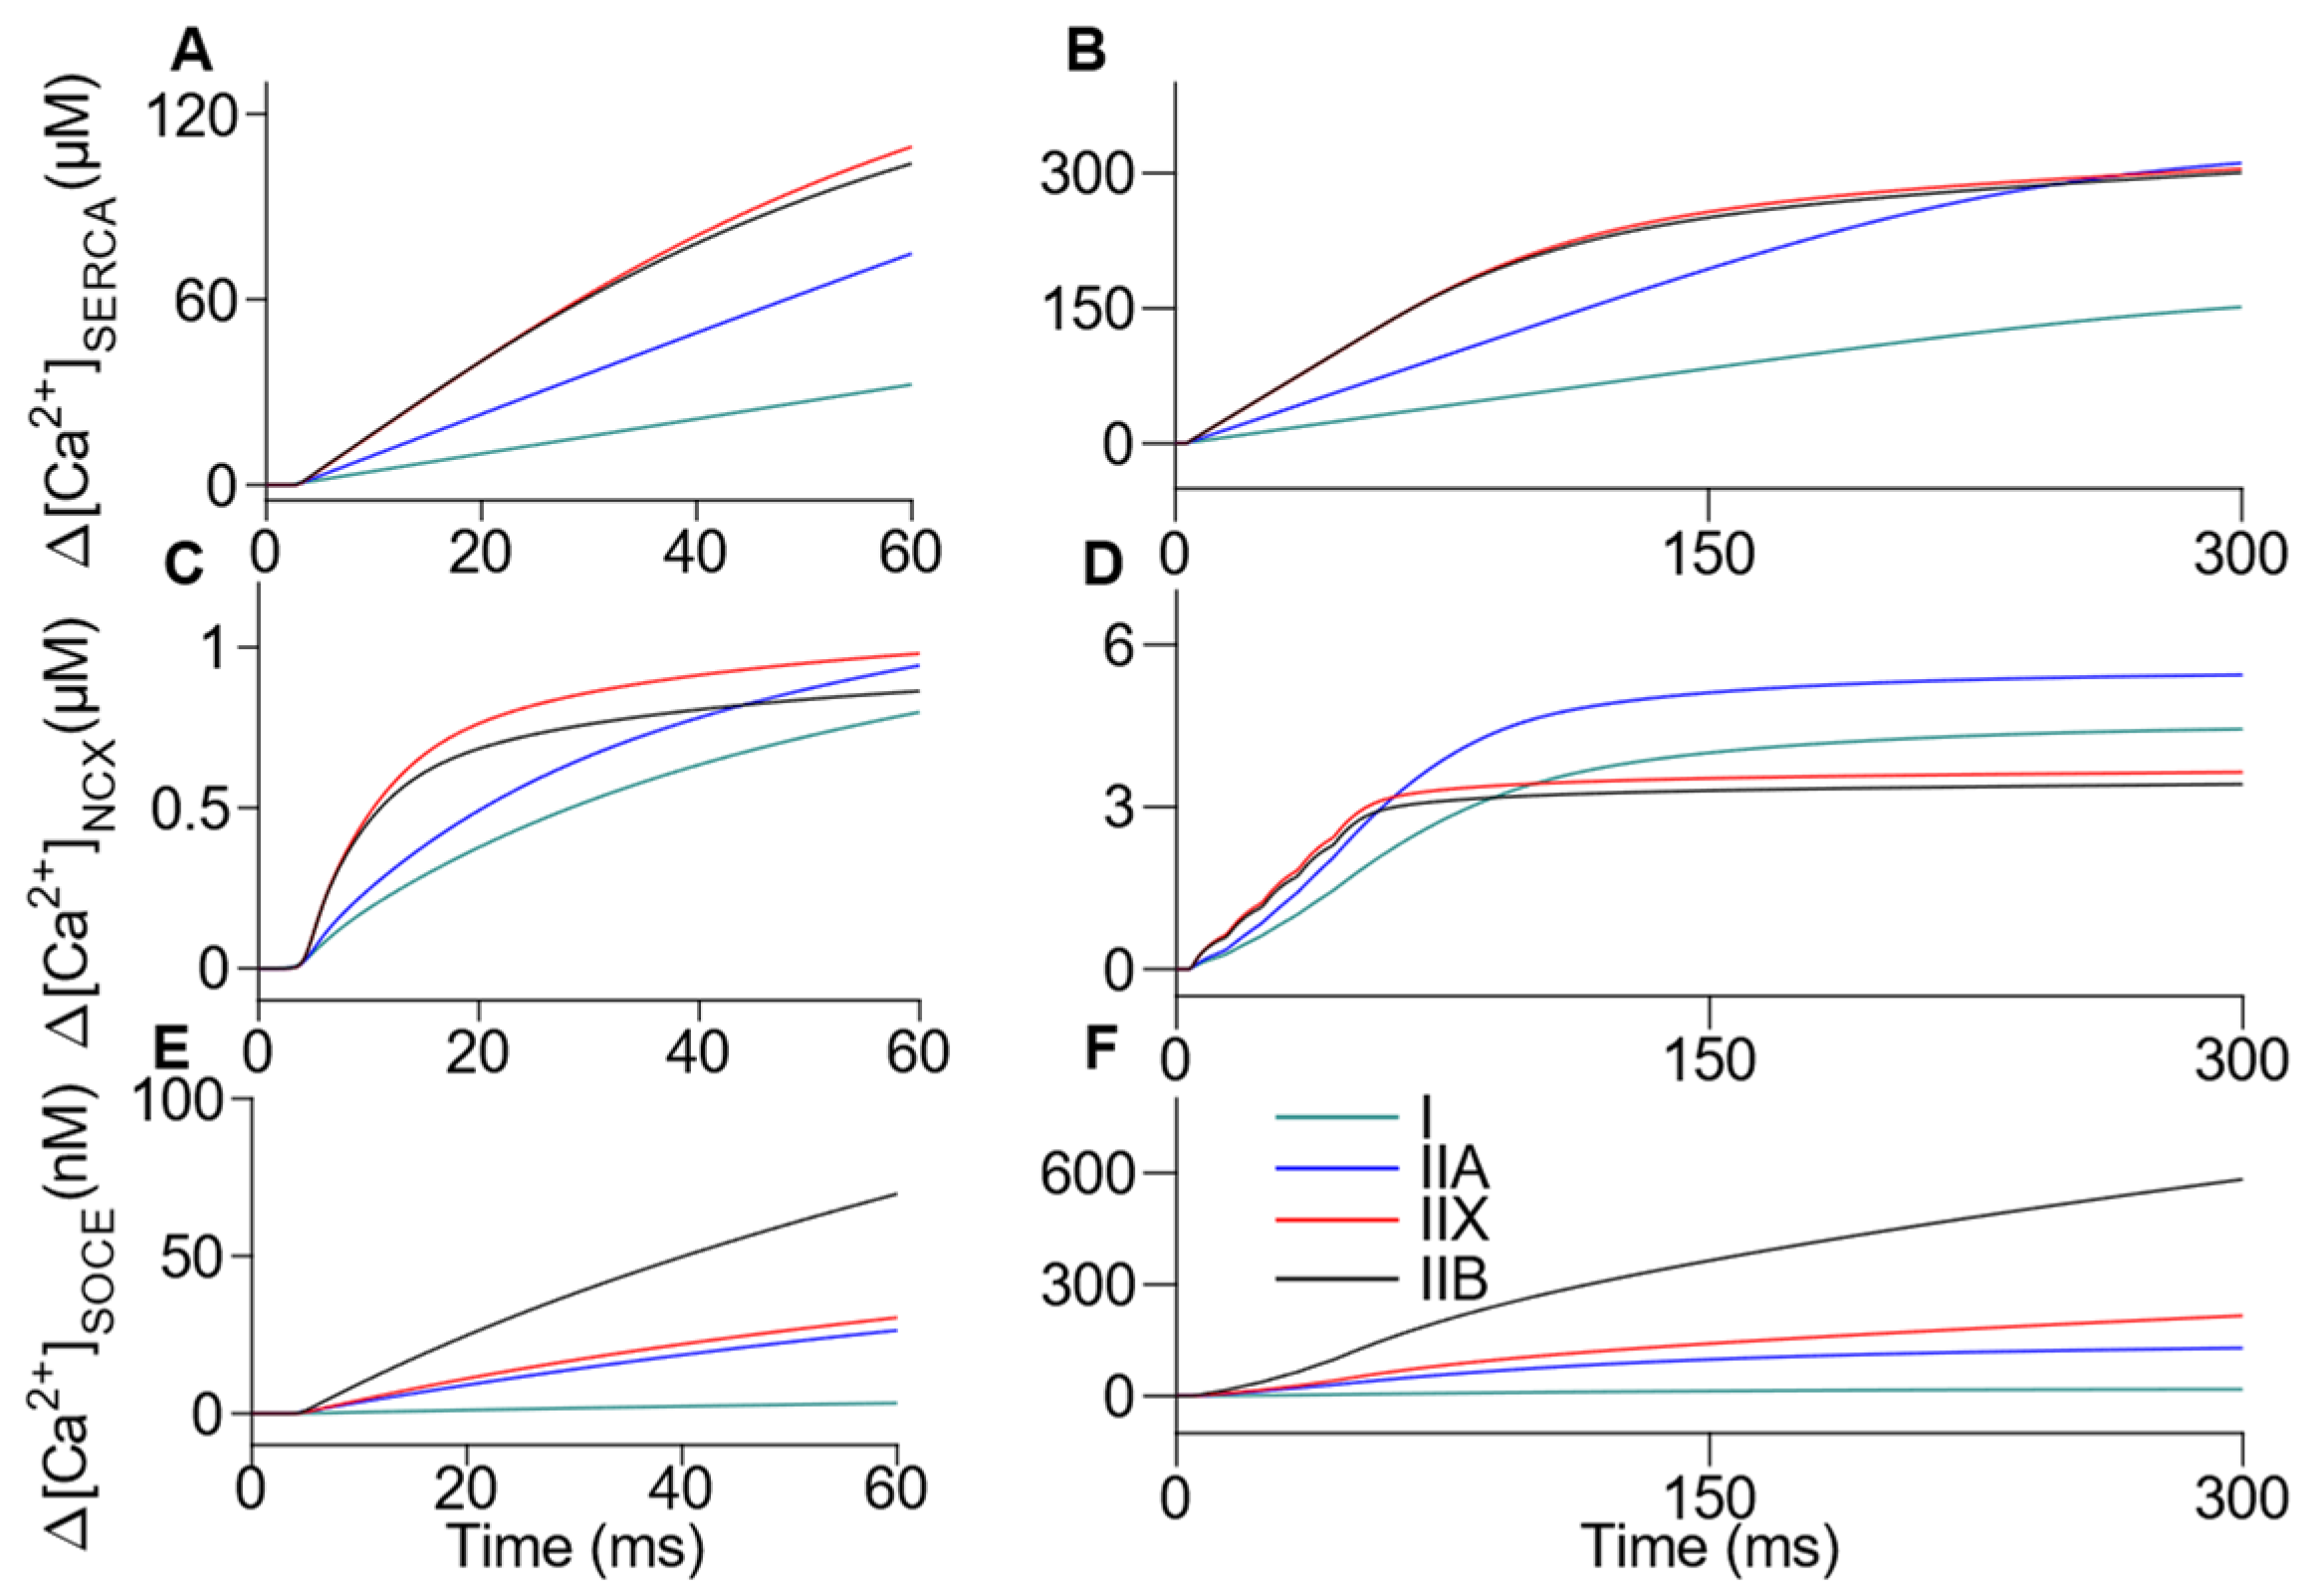
3.3. Comprehensive Integration of Mechanisms Involved in Ca2+ Handling: Sarcoplasm, SR, MITO, NCX and SOCE

The ECC is becoming more complex [1] and experimentally addressing some questions is challenging. For instance, important papers have investigated Ca2+ kinetics in MITO and SR, as well as SOCE function in fast fibers [33,47,48], but differences among all fiber types are infrequently [12] or never studied. The mathematical model presented here helps address these limitations.
The peak flux differences found in the release rate are consistent with the two- to ten-fold higher content of the ryanodine receptor (RyR) in the fastest fibers, compared to the other fibers [6,49,50,51]. The comparable values of half-width and rise time in all fiber types can be explained as all fiber types share the RyR1 isoform [52].
Upon release, Ca2+ has multiple fates: (i) binds to classical sarcoplasmic buffers such as PV, Tn, TNS, ATP, and the dye; (ii) enters into MITO and SR, or (iii) is recycled through the NCX and SOCE mechanisms [1].
In fast fibers (16–22 °C), [CaTn] has ranged from 80 µM [27] to around 240 µM [16,39], being ~199 µM for IIA, IIX, and IIB in the present study, within 7 ms from the beginning of the release of Ca2+. Slow fibers gave values of 85 µM [13] and ~110 µM (fibers type I in the present study) within 15 ms. Different reaction rate constants arising from temperature corrections, our larger SERCA capacity, as well as the inclusion of MITO and SOCE, explain why the peak [CaTn] is somewhat lower in the fast fibers in our model than in the model of Baylor and Hollingworth (2007) [16]. The TNS peaked 31 µM during a train of APs in slow fiber types after 200 ms [13], and in the present work, such as with Tn, have peaked below, being 22 µM. Specifically in type IIX and IIB fibers, which have a higher quantity of PV, their influence is reduced, as the binding and unbinding rates are similar to those of PV.
The peak concentration of [CaPV] in fast fibers has ranged from 90 µM [27] to 120 µM [16], close to the 116–142 µM for IIX and IIB found in the present study, after 25 ms of Ca2+ release. Slow fibers are devoid of PV [13], or very low values have been measured in fibers type I and IIA in murines [53,54], justifying the values found (~0.5-5 µM) here. Then, the continuum of [CaPV] in I, IIA, IIX, and IIB fibers followed the order IIB > IIX >> IIA > I.
The peak [CaATP] we found for fibers IIX and IIB coincides with the values reported previously for fast fibers, i.e., 60 µM [27] and ~70 µM [16]. In all cases, the peak was within 6 ms from the release. In type I fibers, we report a value of 23 µM, with IIA being an intermediate. Then, the continuum of [CaATP] in all fibers was IIB = IIX > IIA > I.
The [CaDye] concentration reached a peak at around 22 µM [16] or 5 µM (IIB, present study) for fast fibers, indicating far-from-saturation conditions and likely not affecting Ca2+ release. Variations depend on differences in loading conditions used by the researchers in different laboratories. The value found for type I fibers in the present study was 3 µM. The order resembled that of the peak [Ca2+] in the sarcoplasm and the Ca2+-ATP reaction.
Peak change in [Ca2+] inside MITO was reported to be 0.35 µM for a single twitch in fast fibers in Marcucci et al. (2018) [14]. The peak [Ca2+] was ~0.25 µM in our results for fibers type IIX and IIB, about 25 ms after Ca2+ release. This concentration is similar to that obtained experimentally in fast mouse fibers [47]. Somewhat later, [Ca2+] peaked inside MITO in type I fibers, reaching a value of 0.9 µM. This delay likely reflects Ca2+ diffusion into MITO, as measured in mouse using genetically encoded sensors [55]. Notably, the peak [Ca2+] was far higher in I than in II, likely as the MCU of slow fibers has more capacity than that of the fast fibers [30], with no difference in the properties of the NCE, allowing more Ca2+ to accumulate inside MITO of fibers type I. Additionally, in fibers type I, the lower amount of PV compared to II allows more Ca2+ free to diffuse into MITO. For fibers IIA, their intermediate amount of Ca2+ released, along with their intermediate amount of PV and SERCA content may explain their midsize value of Ca2+ inside MITO. According to their peak amplitude, Ca2+ transients in MITO can be ordered as I >> IIA >> IIX ≥ IIB.
Previous works have estimated the total concentration of MITO buffers [B]. From the simulated analysis of the total [B] in cardiac muscle fibers performed in [56], a value of 2 µM was found to be optimal. In the work of Marcucci et al. (2018) [14] for skeletal muscle fibers a larger buffer concentration of 20 µM was also tested. In the present study, a value of 20 µM was used. A sizeable total [B] inside MITO is expected in order to deal with the larger and faster amounts of Ca2+ released in skeletal compared to cardiac muscle, and to explain the slowing of decay of the Ca2+ transients when the MITO uptake is blunted [12,47]. However, well calibrated, high resolution, experimental measurements of MITO Ca2+ buffering and kinetics are still required to reach an accurate estimate of the total [B] and [Ca2+] inside MITO in skeletal muscle fibers.
Ca2+ pumped by the SERCA was estimated to be 1.5–3.5 µM in fast fibers [16], but amounted up to ~50 µM for IIX fibers in our model, after 25 ms. In slow fibers, a value somewhat below 1 µM was reported [13] at the same time (50 ms), but we found ~15 µM for type I. The differences between models can be explained due to temperature, as well as half-width differences in the recordings that fed the simulation. According to the intermediate kinetics of the decay phase of the Ca2+ transients in fibers IIA, as well as our previous discussion, midsize values for IIA were expected. The difference of Ca2+ pumped by SERCA 50 ms after Ca2+ release was IIB = IIX >> IIA >> I. The total capacity of Ca2+ extrusion by the NCX in fibers type IIB, IIX, and IIA was only 1.1–-1.3 times higher than in I, suggesting that the larger amount of NCX1 in fibers type I is balanced by the larger capacity of the NCX3 present in fibers type II. The Ca2+ extruded by the t-system seems to be immediately recycled and has been called a counter-flux [5]. Our results confirmed that SOCE is quantitatively small in skeletal muscle [33,46], and it is difficult to speculate on the importance of the minor differences among fibers. More robust experimental data should be gathered before a conclusion about this issue can be stated.

3.4. Final Remarks

Although the above analyses give averages of peak sarcoplasmic/compartments [Ca2+], spatially refined models for fast fibers have shown up to a 20-fold gradient in the sarcoplasmic [Ca2+], depending on the distance of a subcellular region from the Ca2+ release units [13,16,39]. This phenomenon is also expected to apply to all fiber types, but the magnitude of those gradients inside the fibers was not explored in the present study.
Single-compartment simulations are expected to have errors associated with an inability to estimate local gradients in [Ca2+] and in the [Ca2+] bound to the binding sites. In the present study, the SOCE flux is associated with changes in [Ca2+] in the SR compartment. However, Ca2+ gradients in the SR have been measured during ECC and the Ca2+ levels decrease more rapidly in the terminal cisternae than in other regions of the SR [57]. Therefore, a model that considers the gradients in the SR would allow a more accurate estimate of the amount of Ca2+ entered by the SOCE.
Additionally, as our Ca2+-bound chemical species had higher concentrations than those recently estimated, the thermal changes associated with ECC in mammalian muscle should be higher than proposed [27]. Our model may be a source to build a more complete model on thermal changes in all fiber types during single and tetanic stimulation.

4. Materials and Methods

4.1. Experimental Single and Tetanic Ca2+ Transients

Typical fluorescence experimental recordings (F) of single Ca2+ transients of fiber types I, IIA, IIX, and IIB were taken from [6]. Tetanic Ca2+ transients (100 Hz) of types I and IIB fibers were taken from [12]. The tetanic Ca2+ transient of IIA and IIX fibers were simulated assuming that they share morphology with I and IIB fibers, respectively, as published [6,12]. In all cases the signals were obtained with Mag-Fluo-4 in electrically stimulated isolated fibers from mouse muscles. Fibers were classified based on myosin heavy chain determination as detailed described in the above references. The conversion of F of single and tetanic experimental recordings to [Ca2+] was performed according to the calibration method and the value parameters presented in [17]. Briefly, [Ca2+] was calculated using the expression:
[ Ca 2 + ] = K d [ D ] T ( F F min ) ( F max F min ) 2 ( F max F ) 2
where Fmax and Fmin are the maximum and minimum fluorescences (150.9 A.U and 0.14 A.U) respectively, Kd is the in situ dissociation constant of Mag-Fluo-4 (1.652 × 10⁵ µM2), and [D]T is the total dye concentration (229.1 µM), at 20 °C. As the experimental Ca2+ transients that feed the model were acquired between 21–23 °C, no temperature corrections were performed in the calibration parameters.

4.2. Model Description

The rate of change of free [Ca2+] was described in three compartments (SR, sarcoplasm, and MITO) with a system of differential equations. The rate of change of [Ca2+] with respect to time in the SR was determined by
d [ Ca 2 + ] SR dt = J Rel   + J SERCA F ( [ Ca 2 + ] SR ,   CSQ )
where JRel is the release rate flux, JSERCA is the SERCA flux, and F the reaction rate of Ca2+ in the SR with calsequestrin (CSQ). The rate of change of sarcoplasmic [Ca2+] was expressed as:
d [ Ca 2 + ] dt = J Rel J SERCA J NCX d [ Ca 2 + ] MITO dt + J SOCE F ( [ Ca 2 + ] SR ,   S )
where JNCX is the NCX flux, [Ca2+]MITO the mitochondrial [Ca2+], JSOCE is the SOCE flux, and F([Ca2+], S) the reaction rate with the sarcoplasmic Ca2+ binding sites S. The change in time of [Ca2+] in the MITO was given by
d [ Ca 2 + ] MITO dt = J MCU J NCE F ( [ Ca 2 + ] MITO ,   B )
where JMCU was the inflow through the MCU, JNCE outflow through the NCE, and F([Ca2+]MITO, B) the reaction rate with B. The B was 20 µM of binding sites, which react with Ca2+ [14].
The parameters that describe the JRel, and the values of maximum capacity of SERCA, NCX, NCE, and SOCE (VSERCA, VNCX, VNCE, and VSOCE), were fitted to the measured Ca2+ transients. All other values of the model were taken from the literature, and the specific references are given in Table 1 and Table S1.

4.2.1. Release Rate of Ca2+

The JRel of Ca2+ from the SR in fast and slow fibers were estimated from measurements of sarcoplasmic Ca2+ transients obtained with Mag-Fluo-4 (Figure 1A), as previously done with Mag-Fura-2 [35]. This approximation assumes that Ca2+ and other chemical species that react with Ca2+ are uniformly distributed in the sarcoplasm, which is thus described as a single compartment. The time derivative of the total Ca2+ concentration in the sarcoplasm, d[Ca]T/dt, is given by the sum of the inflows and outflows through the membrane. Therefore, from the sum of d[Ca]T/dt and outflows, we obtained the release rate of Ca2+. A gaussian model was used to simulate the JRel elicited by a single AP:
J Rel ( t ) = j = 1 M f Rel , j i = 1 N R i e ( ( t ( j 1 ) T 2 ) T 1 , i τ i ) 2
where N is the number of peaks used to fit the JRel produced by a single AP, R is the peak amplitude, Ti is the location in the time axis, and τ relates to the width of each peak. R, T, and τ were adjusted to fit the peak amplitude, half-width, rise time, and decay time of the release rate of Ca2+ elicited by a single AP (Table 2). fRel is the multiplication factor used in the second and subsequent APs to fit the measured peaks amplitudes. M is the number of APs and T2 of 10 ms is the time between stimulations.

4.2.2. Reaction of Ca2+ with Sarcomeric Buffers

The local reactions of Ca2+ with S of the chemical species in the compartments were described by the law of mass action,
F ( [ Ca 2 + ] ,   S ) = k [ SCa 2 + ] k + [ Ca 2 + ] [ S ]
with k+ the binding rate constant, and k the unbinding rate constant. The interactions of Ca2+ and Mg2+ with the binding sites were described as reversible reactions. The reactions with ATP, B and CSQ were described as single reversible reactions. As Mg2+ competes with Ca2+ for the PV, their interactions are described with two simultaneous reversible reactions. Additionally, as recently described in Milán et al. (2021) [17], two molecules of the fluorescent indicator Mag-Fluo-4 (Dye) bind to one Ca2+. The k+ and k values associated with the ATP, Tn, and PV binding sites were taken from Baylor and Hollingworth (2007) [16] and Hollingworth et al. (2012) [13], CSQ from Barclay et al. (2021) [27], and B from Marcucci et al. (2018) [14]. A temperature of 22 °C and a Q10 of 2 were considered to adjust the reaction rates (Table S1). The resulting ordinary differential equations system was solved using the ode15s solver in MATLAB 2021b (MathWorks, Natick, MA, USA). The occupancy fraction of the binding sited at equilibrium were obtained from the simulated data.

4.2.3. Muscle Proteins Concentration

The Tn molecules concentration were 120 µM in all fiber types such as in Hollingworth et al. (2012) [13]. As each fast fiber Tn molecule has two Ca2+ binding sites and slow fiber molecules one, we thus assumed a concentration of 240 µM with positive cooperativity for IIA, IIX, and IIB fibers, and 120 µM for type I fibers. Additionally, as each Tn molecule has two non-specific sites (TNS) we considered concentrations of 240 µM for the binding sites of fast and slow fibers. As the Tn molecules are located in the myofibrillar space (MS), the average [Tn] and [TNS] in the sarcoplasm was rescaled by the occupation of the MS volume in the sarcoplasm (VMS and Vsarc in Table 1).
The [PV] in the fastest fibers can achieve large concentrations, 1.5–1.9 mM [16,27]. We also considered that fibers type I have 300 times less [PV] [7], leading to 6 µM. Fibers IIA have a [PV] closer to fibers type I than type IIB, so we assumed 10 times more PV content in IIA than in I type [58], giving 60 µM, which is far lower than IIX and IIB, as expected. The ATP, Dye, CSQ, and B concentrations were listed in Table 1.

4.2.4. Reuptake Rate of Ca2+ by SERCA

The reuptake of Ca2+ by SERCA to the SR is described by the Michaelis–Menten kinetics and expressed as:
J SERCA = V SERCA [ Ca 2 + ] h SERCA [ Ca 2 + ] h SERCA + K SERCA h SERCA
where VSERCA is the maximum flux rate, [Ca2+] is the Ca2+ concentration in the sarcoplasm, KSERCA is the dissociation constant and hSERCA the Hill coefficient. The SERCA isoform predominantly expressed in fast-twitch muscle fibers is the 1a, whereas in slow-twitch is the 2a [59]. Both have similar KSERCA and hSERCA [29], however different content of SR pump molecules [8], and thus VSERCA. The VSERCA was then adjusted to match the decay phase of the measured and simulated Ca2+ transients in all fiber types.

4.2.5. The Mitochondrial Ca2+ Uniporter (MCU) Inflow and the Sodium Ca2+ Exchanger (NCE) Outflow

The JMCU was represented by a saturable first-order transporter, independent of the internal [Ca2+]MITO:
J MCU = V MCU [ Ca 2 + ] h MCU [ Ca 2 + ] h MCU + K MCU h MCU
where VMCU is the maximum flux rate, [Ca2+] is the Ca2+ concentration in the sarcoplasm, and KMCU is the [Ca2+] where the transport rate is half-maximum. VMCU values were taken as 0.012 μM ms1 in fast and 0.049 μM ms1 in slow fibers at 16 °C [13,16], and adjusted considering a Q10 of 2.
The JNCE was modelled with a stoichiometry of 3:1 and described with the following expression [31]:
J NCE = V NCE ( e 0.5 Ψ m , mito F RT [ Na + ] 3 [ Ca 2 + ] mito K NCE , Na + 3   ·   K NCE , Ca 2 + e 0.5 Ψ m , mito F RT [ Na + ] mito 3 [ Ca 2 + ] K NCE , Na + 3   ·   K NCE , Ca 2 + 1 + [ Na + ] 3 K NCE , Na + 3 + [ Ca 2 + ] mito K NCE , Ca 2 + + [ Na + ] 3 [ Ca 2 + ] mito K NCE , Na + 3 K NCE , Ca 2 + + [ Na + ] mito 3 K NCE , Na + 3 + [ Ca 2 + ] K NCE , Ca 2 + + [ Na + ] mito 3 [ Ca 2 + ] K NCE , Na + 3 K NCE , Ca 2 + )
where ∆Ψm,mito is the mitochondrial membrane potential, VNCE is the NCE activity, and KNCE,Ca2+ and KNCE,Na+ are the dissociation constants for the Ca2+ and Na2+ binding to the NCE, respectively. F, R, and T denote the Faraday constant, the ideal gas constant and temperature, respectively. VNCE was modulated in the fastest fibers to reproduce the speed of the [Ca2+]mito decay phase, completed in a period of about 100 ms and measured during a single twitch, as in Rudolf et al. (2004) [55].

4.2.6. Ca2+ Flux through the NCX

To describe the sarcolemmal NCX, the same expression of the NCE, with stoichiometry of 3:1 was used, although with different simulated values. Reported Ca2+-transport rate values for SERCA range from 10 (in membrane vesicles) to 13–14 nmol mg⁻1 min⁻1 (NCX3 and NCX1 isoforms, respectively) [60,61]. We assumed a maximum transfer rate (VNCX) between 30 and 40% higher than that of SERCA. As the NCX is predominantly located in the T-tubule membrane [62], whereas the SERCA in the SR membrane, we thus rescaled VNCX by a ratio (T-tubule membrane/SR membrane) of 0.066 and 0.111 in fast and slow fibers [20], i.e., between 214.5 and 120.1 µM s−1 for all fibers type II. In fibers type I we used 93.2 µM ms−1. For KNCX,Ca2+ and KNCX,Na+, we, respectively took values of 140 µM and 14 mM in fast fibers, and 130 µM and 11 mM in slow fibers [32].

4.2.7. The Effect of Store-operated Ca2+ Entry (SOCE)

We described the flux, JSOCE, as a fraction, PSOCE, of a given maximum value, and VSOCE as JSOCE= VSOCE PSOCE [63]. As said, PSOCE change as a function of the [Ca2+] in the SR, which can be described by the function:
P SOCE = K SOCE h SOCE [ Ca 2 + ] SR h SOCE + K SOCE h SOCE
where KSOCE and hSOCE are the Ca2+ dissociation constant of STIM1 (0.35 mM) and the Hill coefficient (4.7), respectively [33]. We assumed that the VSOCE in the fastest IIB fibers achieved up to 35 µM s1 [33]. Lower values were used for IIX, IIA, and I fibers.

5. Conclusions

Our mathematical, comprehensive model allows us to gain insight into the kinetics of the Ca2+ transients obtained with the fast Ca2+ dye Mag-Fluo-4, for the continuum of skeletal muscle fiber types. Sarcoplasmic peak [Ca2+] is one order of magnitude higher than reported with slow dyes. The magnitudes of change of the Ca2+-bound forms of the Ca2+ buffers studied follow the order IIB ≥ IIX > IIA > I, except for mitochondrial peak [Ca2+] which showed the pattern I >> IIA >> IIX ≥ IIB. The kinetics for fibers IIA and IIX proved to be intermediate between I and IIB fibers, supporting dynamic data. The results may help better quantitate SOCE fluxes and thermal changes in mammalian fiber types in the future and support the use of fast Ca2+ dyes for most experimental approaches in skeletal muscle.

Supplementary Materials

The following are available online at https://www.mdpi.com/article/10.3390/ijms222212378/s1.

Author Contributions

All authors listed met the conditions required for full authorship. M.A.G. and J.C.C. designed the study and obtained the funding. O.A.R. prepared the mathematical model and M.A.G., J.C.C. and A.F.M. gave feedback. M.A.G., J.C.C. and O.A.R. analyzed the results. M.A.G. and J.C.C. wrote the first draft and all the authors reviewed and approved the final version. All authors have read and agreed to the published version of the manuscript.

Funding

This work was funded by the Committee of Research (CODI) of the University of Antioquia, Colombia (code 2015-7858) and the Planning Office of University of Antioquia (Project code E01708-K).

Institutional Review Board Statement

Not applicable.

Informed Consent Statement

Not applicable.

Data Availability Statement

The data presented in this study are available on request from the corresponding author.

Acknowledgments

We thank Jaime Ignacio Montoya for his support during the development of this investigation.

Conflicts of Interest

The authors declare no conflict of interest. The funders had no role in the design of the study; in the collection, analyses, or interpretation of data; in the writing of the manuscript, or in the decision to publish the results.

References

  1. Calderón, J.C.; Bolaños, P.; Caputo, C. The excitation–contraction coupling mechanism in skeletal muscle. Biophys. Rev. 2014, 6, 133–160. [Google Scholar] [CrossRef] [PubMed] [Green Version]
  2. Stiber, J.; Hawkins, A.; Zhang, Z.S.; Wang, S.; Burch, J.; Graham, V.; Ward, C.C.; Seth, M.; Finch, E.; Malouf, N.; et al. STIM1 signalling controls store-operated calcium entry required for development and contractile function in skeletal muscle. Nat. Cell Biol. 2008, 10, 688–697. [Google Scholar] [CrossRef] [Green Version]
  3. Wei-LaPierre, L.; Carrell, E.M.; Boncompagni, S.; Protasi, F.; Dirksen, R.T. Orai1-dependent calcium entry promotes skeletal muscle growth and limits fatigue. Nat. Commun. 2013, 4, 2805. [Google Scholar] [CrossRef] [PubMed] [Green Version]
  4. Protasi, F.; Pietrangelo, L.; Boncompagni, S. Calcium entry units (CEUs): Perspectives in skeletal muscle function and disease. J. Muscle Res. Cell Motil. 2021, 42, 233–249. [Google Scholar] [CrossRef] [PubMed]
  5. Koenig, X.; Choi, R.H.; Launikonis, B.S. Store-operated Ca2+ entry is activated by every action potential in skeletal muscle. Commun. Biol. 2018, 1, 31. [Google Scholar] [CrossRef] [PubMed]
  6. Calderón, J.C.; Bolaños, P.; Caputo, C. Myosin heavy chain isoform composition and Ca2+ transients in fibres from enzymatically dissociated murine soleus and extensor digitorum longus muscles. J. Physiol. 2010, 588, 267–279. [Google Scholar] [CrossRef]
  7. Leberer, E.; Pette, D. Immunochemical quantification of sarcoplasmic reticulum Ca-ATPase, of calsequestrin and of parvalbumin in rabbit skeletal muscles of defined fiber composition. Eur. J. Biochem. 1986, 156, 489–496. [Google Scholar] [CrossRef]
  8. Ferguson, D.G.; Franzini-Armstrong, C. The Ca2+ ATPase content of slow and fast twitch fibers of guinea pig. Muscle Nerve 1988, 11, 561–570. [Google Scholar] [CrossRef]
  9. Heizmann, C.W. Parvalbumin, and intracellular calcium-binding protein; distribution, properties and possible roles in mammalian cells. Experientia 1984, 40, 910–921. [Google Scholar] [CrossRef]
  10. Cannell, M.B.; Allen, D.G. Model of calcium movements during activation in the sarcomere of frog skeletal muscle. Biophys. J. 1984, 45, 913–925. [Google Scholar] [CrossRef] [Green Version]
  11. Baylor, S.M.; Hollingworth, S. Model of Sarcomeric Ca2+ Movements, Including ATP Ca2+ Binding and Diffusion, during Activation of Frog Skeletal Muscle. J. Gen. Physiol. 1998, 112, 297–316. [Google Scholar] [CrossRef] [PubMed] [Green Version]
  12. Calderón, J.C.; Bolaños, P.; Caputo, C. Tetanic Ca2+ transient differences between slow- and fast-twitch mouse skeletal muscle fibres: A comprehensive experimental approach. J. Muscle Res. Cell Motil. 2014, 35, 279–293. [Google Scholar] [CrossRef]
  13. Hollingworth, S.; Kim, M.M.; Baylor, S.M. Measurement and simulation of myoplasmic calcium transients in mouse slow-twitch muscle fibres. J. Physiol. 2012, 590, 575–594. [Google Scholar] [CrossRef] [Green Version]
  14. Marcucci, L.; Canato, M.; Protasi, F.; Stienen, G.J.M.; Reggiani, C. A 3D diffusional-compartmental model of the calcium dynamics in cytosol, sarcoplasmic reticulum and mitochondria of murine skeletal muscle fibers. PLoS ONE 2018, 13, e0201050. [Google Scholar] [CrossRef] [PubMed] [Green Version]
  15. Baylor, S.M.; Hollingworth, S. Calcium indicators and calcium signalling in skeletal muscle fibres during excitation–contraction coupling. Prog. Biophys. Mol. Biol. 2011, 105, 162–179. [Google Scholar] [CrossRef] [PubMed] [Green Version]
  16. Baylor, S.M.; Hollingworth, S. Simulation of Ca2+ movements within the sarcomere of fast-twitch mouse fibers stimulated by action potentials. J. Gen. Physiol. 2007, 130, 283–302. [Google Scholar] [CrossRef] [Green Version]
  17. Milán, A.F.; Rincón, O.A.; Arango, L.B.; Reutovich, A.A.; Smith, G.L.; Giraldo, M.A.; Bou-Abdallah, F.; Calderón, J.C. Calibration of mammalian skeletal muscle Ca2+ transients recorded with the fast Ca2+ dye Mag-Fluo-4. Biochim. Biophys. Acta-Gen. Subj. 2021, 1865, 129939. [Google Scholar] [CrossRef]
  18. Luff, A.R.; Atwood, H.L. Changes in the sarcoplasmic reticulum and transverse tubular system of fast and slow skeletal muscles of the mouse during postnatal development. J. Cell Biol. 1971, 51, 369–383. [Google Scholar] [CrossRef]
  19. Chen, G.; Carroll, S.; Racay, P.; Dick, J.; Pette, D.; Traub, I.; Vrbova, G.; Eggli, P.; Celio, M.; Schwaller, B. Deficiency in parvalbumin increases fatigue resistance in fast-twitch muscle and upregulates mitochondria. Am. J. Physiol. Physiol. 2001, 281, C114–C122. [Google Scholar] [CrossRef]
  20. Eisenberg, B.R. Quantitative Ultrastructure of Mammalian Skeletal Muscle. In Comprehensive Physiology; Wiley: Hoboken, NJ, USA, 1983; pp. 73–112. [Google Scholar]
  21. Williams, D.A.; Head, S.I.; Bakker, A.J.; Stephenson, D.G. Resting calcium concentrations in isolated skeletal muscle fibres of dystrophic mice. J. Physiol. 1990, 428, 243–256. [Google Scholar] [CrossRef]
  22. Fryer, M.W.; Stephenson, D.G. Total and sarcoplasmic reticulum calcium contents of skinned fibres from rat skeletal muscle. J. Physiol. 1996, 493, 357–370. [Google Scholar] [CrossRef]
  23. Westerblad, H.; Allen, D.G. Myoplasmic free Mg2+ concentration during repetitive stimulation of single fibres from mouse skeletal muscle. J. Physiol. 1992, 453, 413–434. [Google Scholar] [CrossRef]
  24. Westerblad, H.; Allen, D.G. The role of sarcoplasmic reticulum in relaxation of mouse muscle; effects of 2,5-di(tert-butyl)-1,4-benzohydroquinone. J. Physiol. 1994, 474, 291–301. [Google Scholar] [CrossRef] [Green Version]
  25. Sperelakis, N. Cell Physiology Source Book; Elsevier Inc.: Amsterdam, The Netherlands, 2012; ISBN 9780123877383. [Google Scholar]
  26. Boyman, L.; Chikando, A.C.; Williams, G.S.B.; Khairallah, R.J.; Kettlewell, S.; Ward, C.W.; Smith, G.L.; Kao, J.P.Y.; Lederer, W.J. Calcium movement in cardiac mitochondria. Biophys. J. 2014, 107, 1289–1301. [Google Scholar] [CrossRef] [Green Version]
  27. Barclay, C.J.; Launikonis, B.S. Components of activation heat in skeletal muscle. J. Muscle Res. Cell Motil. 2021, 42. [Google Scholar] [CrossRef] [PubMed]
  28. Kushmerick, M.J.; Moerland, T.S.; Wiseman, R.W. Mammalian skeletal muscle fibers distinguished by contents of phosphocreatine, ATP, and Pi. Proc. Natl. Acad. Sci. USA 1992, 89, 7521–7525. [Google Scholar] [CrossRef] [PubMed] [Green Version]
  29. Lytton, J.; Westlin, M.; Burk, S.E.; Shull, G.E.; MacLennan, D.H. Functional comparisons between isoforms of the sarcoplasmic or endoplasmic reticulum family of calcium pumps. J. Biol. Chem. 1992, 267, 14483–14489. [Google Scholar] [CrossRef]
  30. Sembrowich, W.L.; Quintinskie, J.J.; Li, G. Calcium uptake in mitochondria from different skeletal muscle types. J. Appl. Physiol. 1985, 59, 137–141. [Google Scholar] [CrossRef]
  31. Dash, R.K.; Beard, D.A. Analysis of cardiac mitochondrial Na2+-Ca2+ exchanger kinetics with a biophysical model of mitochondrial Ca2+ handing suggests a 3:1 stoichiometry. J. Physiol. 2008, 586, 3267–3285. [Google Scholar] [CrossRef] [PubMed]
  32. Donoso, P.; Hidalgo, C. Sodium-calcium exchange in transverse tubules isolated from frog skeletal muscle. Biochim. Biophys. Acta-Biomembr. 1989, 978, 8–16. [Google Scholar] [CrossRef]
  33. Koenig, X.; Choi, R.H.; Schicker, K.; Singh, D.P.; Hilber, K.; Launikonis, B.S. Mechanistic insights into store-operated Ca 2+ entry during excitation-contraction coupling in skeletal muscle. Biochim. Biophys. Acta-Mol. Cell Res. 2019, 1866, 1239–1248. [Google Scholar] [CrossRef]
  34. Gillis, J.M.; Thomason, D.; Lefèvre, J.; Kretsinger, R.H. Parvalbumins and muscle relaxation: A computer simulation study. J. Muscle Res. Cell Motil. 1982, 3, 377–398. [Google Scholar] [CrossRef]
  35. Baylor, S.M.; Hollingworth, S. Sarcoplasmic reticulum calcium release compared in slow-twitch and fast-twitch fibres of mouse muscle. J. Physiol. 2003, 551, 125–138. [Google Scholar] [CrossRef]
  36. Bakker, A.J.; Cully, T.R.; Wingate, C.D.; Barclay, C.J.; Launikonis, B.S. Doublet stimulation increases Ca2+ binding to troponin C to ensure rapid force development in skeletal muscle. J. Gen. Physiol. 2017, 149, 323–334. [Google Scholar] [CrossRef] [PubMed] [Green Version]
  37. Senneff, S.; Lowery, M.M. Effects of extracellular potassium on calcium handling and force generation in a model of excitation-contraction coupling in skeletal muscle. J. Theor. Biol. 2021, 519, 110656. [Google Scholar] [CrossRef]
  38. Wang, M.; Sun, J.; Yang, Q. Modeling and simulation of excitation-contraction coupling of fast-twitch skeletal muscle fibers. Technol. Health Care 2020, 28, 13–24. [Google Scholar] [CrossRef]
  39. Holash, R.J.; MacIntosh, B.R. A stochastic simulation of skeletal muscle calcium transients in a structurally realistic sarcomere model using MCell. PLoS Comput. Biol. 2019, 15, e1006712. [Google Scholar] [CrossRef]
  40. Bottinelli, R.; Reggiani, C. Human skeletal muscle fibres: Molecular and functional diversity. Prog. Biophys. Mol. Biol. 2000, 73, 195–262. [Google Scholar] [CrossRef]
  41. Schiaffino, S.; Reggiani, C. Fiber Types in Mammalian Skeletal Muscles. Physiol. Rev. 2011, 91, 1447–1531. [Google Scholar] [CrossRef] [PubMed] [Green Version]
  42. Schiaffino, S.; Gorza, L.; Sartore, S.; Saggin, L.; Ausoni, S.; Vianello, M.; Gundersen, K.; LØmo, T. Three myosin heavy chain isoforms in type 2 skeletal muscle fibres. J. Muscle Res. Cell Motil. 1989, 10, 197–205. [Google Scholar] [CrossRef] [PubMed]
  43. Olsson, K.; Cheng, A.J.; Al-Ameri, M.; Wyckelsma, V.L.; Rullman, E.; Westerblad, H.; Lanner, J.T.; Gustafsson, T.; Bruton, J.D. Impaired sarcoplasmic reticulum Ca2+ release is the major cause of fatigue-induced force loss in intact single fibres from human intercostal muscle. J. Physiol. 2020, 598, 773–787. [Google Scholar] [CrossRef]
  44. Weiss, N.; Andrianjafiniony, T.; Dupré-Aucouturier, S.; Pouvreau, S.; Desplanches, D.; Jacquemond, V. Altered myoplasmic Ca2+ handling in rat fast-twitch skeletal muscle fibres during disuse atrophy. Pflugers Arch. Eur. J. Physiol. 2010, 459, 631–644. [Google Scholar] [CrossRef] [PubMed]
  45. Launikonis, B.S.; Stephenson, D.G.; Friedrich, O. Rapid Ca2+ flux through the transverse tubular membrane, activated by individual action potentials in mammalian skeletal muscle. J. Physiol. 2009, 587, 2299–2312. [Google Scholar] [CrossRef]
  46. Launikonis, B.S.; Murphy, R.M.; Edwards, J.N. Toward the roles of store-operated Ca2+ entry in skeletal muscle. Pflügers Arch.-Eur. J. Physiol. 2010, 460, 813–823. [Google Scholar] [CrossRef]
  47. Yi, J.; Ma, C.; Li, Y.; Weisleder, N.; Ríos, E.; Ma, J.; Zhou, J. Mitochondrial Calcium Uptake Regulates Rapid Calcium Transients in Skeletal Muscle during Excitation-Contraction (E-C) Coupling. J. Biol. Chem. 2011, 286, 32436–32443. [Google Scholar] [CrossRef] [Green Version]
  48. Canato, M.; Scorzeto, M.; Giacomello, M.; Protasi, F.; Reggiani, C.; Stienen, G.J.M. Massive alterations of sarcoplasmic reticulum free calcium in skeletal muscle fibers lacking calsequestrin revealed by a genetically encoded probe. Proc. Natl. Acad. Sci. USA 2010, 107, 22326–22331. [Google Scholar] [CrossRef] [PubMed] [Green Version]
  49. Appelt, D.; Buenviaje, B.; Champ, C.; Franzini-Armstrong, C. Quantitation of ‘junctional feet’ content in two types of muscle fiber from hind limb muscles of the rat. Tissue Cell 1989, 21, 783–794. [Google Scholar] [CrossRef]
  50. Franzini-Armstrong, C.; Ferguson, D.G.; Champ, C. Discrimination between fast- and slow-twitch fibres of guinea pig skeletal muscle using the relative surface density of junctional transverse tubule membrane. J. Muscle Res. Cell Motil. 1988, 9, 403–414. [Google Scholar] [CrossRef]
  51. Damiani, E.; Margreth, A. Characterization study of the ryanodine receptor and of calsequestrin isoforms of mammalian skeletal muscles in relation to fibre types. J. Muscle Res. Cell Motil. 1994, 15, 86–101. [Google Scholar] [CrossRef]
  52. Lee, Y.S.; Ondrias, K.; Duhl, A.J.; Ehrlich, B.E.; Kim, D.H. Comparison of calcium release from sarcoplasmic reticulum of slow and fast twitch muscles. J. Membr. Biol. 1991, 122, 155–163. [Google Scholar] [CrossRef] [PubMed]
  53. Ecob-Prince, M.S.; Leberer, E. Parvalbumin in mouse muscle in vivo and in vitro. Differentiation 1989, 40, 10–16. [Google Scholar] [CrossRef] [PubMed]
  54. Gundersen, K.; Leberer, E.; Lømo, T.; Pette, D.; Staron, R.S. Fibre types, calcium-sequestering proteins and metabolic enzymes in denervated and chronically stimulated muscles of the rat. J. Physiol. 1988, 398, 177–189. [Google Scholar] [CrossRef]
  55. Rudolf, R.; Mongillo, M.; Magalhaães, P.J.; Pozzan, T. In vivo monitoring of Ca2+ uptake into mitochondria of mouse skeletal muscle during contraction. J. Cell Biol. 2004, 166, 527–536. [Google Scholar] [CrossRef] [PubMed] [Green Version]
  56. Wüst, R.C.I.; Helmes, M.; Martin, J.L.; van der Wardt, T.J.T.; Musters, R.J.P.; van der Velden, J.; Stienen, G.J.M. Rapid frequency-dependent changes in free mitochondrial calcium concentration in rat cardiac myocytes. J. Physiol. 2017, 595, 2001–2019. [Google Scholar] [CrossRef] [Green Version]
  57. Reddish, F.N.; Miller, C.L.; Deng, X.; Dong, B.; Patel, A.A.; Ghane, M.A.; Mosca, B.; McBean, C.; Wu, S.; Solntsev, K.M.; et al. Rapid subcellular calcium responses and dynamics by calcium sensor G-CatchER+. iScience 2021, 24, 102129. [Google Scholar] [CrossRef] [PubMed]
  58. Heizmann, C.W.; Berchtold, M.W.; Rowlerson, A.M. Correlation of parvalbumin concentration with relaxation speed in mammalian muscles. Proc. Natl. Acad. Sci. USA 1982, 79, 7243–7247. [Google Scholar] [CrossRef] [Green Version]
  59. Periasamy, M.; Kalyanasundaram, A. SERCA pump isoforms: Their role in calcium transport and disease. Muscle Nerve 2007, 35, 430–442. [Google Scholar] [CrossRef]
  60. Linck, B.; Qiu, Z.; He, Z.; Tong, Q.; Hilgemann, D.W.; Philipson, K.D. Functional comparison of the three isoforms of the Na+/Ca2+ exchanger (NCX1, NCX2, NCX3). Am. J. Physiol. Physiol. 1998, 274, C415–C423. [Google Scholar] [CrossRef] [PubMed]
  61. Mickelson, J.R.; Beaudry, T.M.; Louis, C.F. Regulation of skeletal muscle sarcolemmal ATP-dependent calcium transport by calmodulin and cAMP-dependent protein kinase. Arch. Biochem. Biophys. 1985, 242, 127–136. [Google Scholar] [CrossRef]
  62. Sacchetto, R.; Margreth, A.; Pelosi, M.; Carafoli, E. Colocalization of the Dihydropyridine Receptor, the Plasma-Membrane Calcium ATPase Isoform 1 and the Sodium/Calcium Exchanger to the Junctional-Membrane Domain of Transverse Tubules of Rabbit Skeletal Muscle. Eur. J. Biochem. 1996, 237, 483–488. [Google Scholar] [CrossRef] [PubMed]
  63. Activation of Store-Operated Calcium Entry in Airway Smooth Muscle Cells: Insight from a Mathematical Model. Available online: https://journals.plos.org/plosone/article?id=10.1371/journal.pone.0069598 (accessed on 19 March 2021).
Figure 1. Experimental, calibrated measurements of [Ca2+] during Ca2+ transients elicited by a single and a train of AP (100 Hz) in mouse fibers at room temperature (21–23 °C). All fibers were classified by myosin heavy chain direct determination in the original paper. Fluorescence recordings generated with Mag-Fluo-4 were used to obtain the ∆[Ca2+] in the sarcoplasm produced by a single AP in fiber types I (green), IIA (blue), IIX (red), and IIB (black) (A) and a train of 5 AP in fibers I and IIB (B).
Ijms 22 12378 g001
Figure 2. Simulation of release rate of Ca2+ and free [Ca2+] in the three compartments of the model. The release rate of Ca2+ was estimated from the measurements of ∆[Ca2+] in fibers I, IIA, IIX, and IIB (A). The model was used to reproduce the Δ[Ca2+] obtained experimentally in the sarcoplasm (C,D) and to estimate the Δ[Ca2+] in the SR (E,F), and MITO (G,H, solid line). The release rate of Ca2+ was used in the first AP of the tetanic Ca2+ transient simulation and in subsequent AP rescaled to match the experimental Δ[Ca2+] peaks (B). The tetanic Ca2+ transient of IIA and IIX fibers were simulated assuming that they share morphology with I and IIB fibers, respectively. The total [Ca2+] in MITO during the Ca2+ transients (G,H, dashed lines), was obtained from the sum of Δ[Ca2+]MITO and the Ca2+ bound to B. MITO simulations were extended in time for the tetanic transients in the Figure S1, in order to show the return of [Ca2+] to the basal levels.
Ijms 22 12378 g002
Figure 3. Simulation of single and tetanic Ca2+ transients buffering. The Δ[Ca2+] coupled to the sarcoplasmic buffers: Tn (A,B), non-specific sites (TNS) (C,D), and PV (E,F); and the SR buffer: calsequestrin (CSQ) (G,H) is shown for single (left column) and tetanic (right column) transients. The total [Ca2+] in the sarcoplasm (solid line), was calculated as the sum of the Δ[Ca2+] in both free and bound forms, whereas the total [Ca2+] released (dashed line), is the numerical integration of JRel (I,J).
Ijms 22 12378 g003
Figure 4. Simulation of kinetics of Ca2+ reuptake by the SR, and movement across the sarcolemma during single and tetanic Ca2+ transients in the continuum of fiber types. The [Ca2+] released is recaptured from the sarcoplasm to the SR by the SERCA (A,B), extruded from the sarcoplasm to the extracellular space through the NCX (C,D), and returned from the extracellular space to the sarcoplasm through the SOCE (E,F) in single (left column) and tetanic (right column) transients.
Ijms 22 12378 g004
Table 1. List of parameters used for the multi-compartment model simulations of Ca2+ transients in skeletal muscle fiber types I, IIA, IIX, and IIB a.
ParameterDescriptionFiber TypeReferences
IIA, IIX, and IIBI
Sarcomeric volumes
VSRFiber volume occupied by the SR5.5%2.9%[18]
VT-tubuleFiber volume occupied by the T-tubule0.4%0.2%[18]
VmitoFiber volume occupied by MITO8.5%15.4%[19]
VMSFiber volume occupied by the MS75%81%[20]
Vsarc*Fiber volume occupied by the sarcoplasm85.6%81.5%(Present study)
Concentrations
[Ca2+]rest,sarcResting free Ca2+ in sarcoplasm106 nM106 nM[21]
[Ca2+]rest,SRResting free Ca2+ in SR1.01 mM1.14 mM[22]
[Mg2+]rest,sarcResting free Mg2+ in sarcoplasm0.78 mM0.78 mM[23]
[Mg2+]TTotal [Mg2+]3300 µM3300 µM[24]
[Na+]sarcSarcoplasmic [Na+]10 mM10 mM[25]
[Na+]mitoMitochondrial [Na+]5 mM5 mM[26]
[Na+]extraExtracellular [Na+]140 mM140 mM[25]
[Ca2+]extraExtracellular [Ca2+]1 mM1 mM[25]
[Tn]TTotal [Tn]240 µM120 µM[13]
[TNS]TTotal [TNS]240 µM240 µM[13]
[PV]TTotal [PV]1900–60 µM6 µM[7,9,27]
[ATP]TTotal [ATP]8 mM5 mM[28]
[CSQ]TTotal [CSQ]46 mM23 mM[27]
[B]TTotal [B]20 µM20 µM[14]
SERCA
VSERCAMaximum flux rate for SERCA2.5–1.4 µM ms10.6 µM ms1(Present study)
KSERCASERCA half-maximum pump [Ca2+]0.44 µM0.38 µM[29]
hSERCASERCA Hill coefficient2.12.2[29]
MCU
VMCUMaximum flux rate MCU18.2 µM s174.3 µM s1[13,16] and (Present study)
KMCUMCU half-maximum pump [Ca2+]1.2 µM1.97 µM[30]
hMCUMCU Hill coefficient23.5[30]
NCE
VNCEMaximum flux rate NCE2.25 µM s19.19 µM s1(Present study)
KNCE,Ca2+Ca2+ binding constant of NCE1.1 mM1.1 mM[14]
KNCE,Na+Na+ binding constant of NCE8.2 mM8.2 mM[31]
ΔΨm,mitoMitochondrial membrane potential190 mV190 mV[31]
NCX
VNCXMaximum flux rate NCX214.5–120.1 µM s193.2 µM s1(Present study)
KNCX,Ca2+Ca2+ binding constant of NCX140 µM130 µM[32]
KNCX,Na+Na+ binding constant of NCX14 mM11 mM[32]
ΔΨmSarcolemmal membrane potential80 mV80 mV[25]
SOCE
VSOCEMaximum flux rate for SOCE35–19 µM s115 µM s1[33] and (Present study)
KSOCESOCE half-maximum pump [Ca2+]0.35 mM0.35 mM[33]
hSOCESOCE Hill coefficient4.74.7[33]
*Vsarc was calculated as 100%-VSR-VT-tubule-Vmito.
a The concentrations of free Ca2+ in the sarcoplasm and of the binding sites Tn, PV, ATP, and dye are referred to the sarcoplasmic water volume. The free Ca2+ in the SR and CSQ are relative to the SR volume. The free Ca2+ in the MITO and B are relative to the MITO volume. When required, the vales of the parameters taken from the literature were adjusted to 22 °C. SR: sarcoplasmic reticulum. MITO: mitochondria. MS: myofibril space. Tn: troponin. TNS: troponin non-specific sites. PV: parvalbumin. ATP: adenosine triphosphate. CSQ: calsequestrin. B: total MITO buffers. SERCA: sarcoendoplasmic reticulum Ca2+ adenosine triphosphatase. MCU: mitochondrial Ca2+ uniporter. NCE: mitochondrial Na+/Ca2+ exchanger. NCX: Na+/Ca2+ exchanger. SOCE: store-operated Ca2+ entry. V indicates maximum capacity of the mechanism. K indicates the concentration which induces half-maximal activation of the mechanism.
Table 2. Estimated kinetic parameters of the Ca2+ release rate function a.
Fiber TypeIIIAIIXIIB
Peak amplitude (µM ms−1)64.8153.6238.8244.5
10–90% Rise time (ms)1.71.21.21.2
Half-width (ms)1.91.41.31.3
90–10% Decay time (ms)2.41.81.51.5
fRel (2nd AP)0.170.180.180.17
fRel (3rd AP)0.100.110.170.15
fRel (4th AP)0.100.110.160.15
fRel (5th AP)0.100.100.150.14
afRel is the multiplication factor used in the second and subsequent action potentials (APs) to fit the measured peak amplitudes.
Table 3. Maximum [Ca2+] variations reached during the simulated time intervals of single (60 ms) and tetanic (300 ms) Ca2+ transients of I, IIA, IIX, and IIB fiber types a.
Fiber TypeIIIAIIXIIBIIIAIIXIIB
SingleTetanic
∆[Ca2+] (µM)10.3112.8916.5516.5616.4720.4416.5516.56
[Ca2+]SR (mM)0.930.70.650.640.870.640.570.54
∆[Ca2+]MITO (µM)0.930.420.250.231.90.830.580.56
∆[CaB] (µM)0.330.140.080.071.610.90.360.34
∆[CaTn] (µM)110.23197.28199.09197.75116.39206.05202.16201.85
∆[CaTNS] (µM)10.178.796.846.5232.1525.9914.4213.92
∆[CaPv] (µM)0.787.63141.78170.661.7616.27247.96304.5
∆[CaATP] (µM)23.3446.6159.7559.7937.1673.6559.7559.79
∆[CaDye] (µM)3.234.025.145.145.116.315.145.14
∆[Ca2+]T (µM)133.69238.93325.8343.28168.29300.92441.78489.53
∆[Ca2+]Rel (µM)145.48254.58346.68363.71213.43381.58558.4606.1
∆[CaCSQ] (mM)−0.3−1.29−1.75−1.85−0.41−1.7−2.42−2.69
∆[Ca2+]SERCA (µM)32.4874.84109.39103.96151.42311.23304.76300.58
∆[Ca2+]NCX (µM)0.80.940.980.864.445.443.643.42
∆[Ca2+]SOCE (nM)3.2926.3930.4469.7318129215.9582.63
a Abbreviations as in Table 1.
Publisher’s Note: MDPI stays neutral with regard to jurisdictional claims in published maps and institutional affiliations.

