Article

Integrating Statistical and Machine-Learning Approach for Meta-Analysis of Bisphenol A-Exposure Datasets Reveals Effects on Mouse Gene Expression within Pathways of Apoptosis and Cell Survival

1
Machine Learning Applications and Deep Learning Group, JetBrains Research, Kantemirovskaya Str., 2, 197342 St. Petersburg, Russia
2
Department of Neuroscience, Functional Pharmacology, University of Uppsala, BMC, Husargatan 3, Box 593, 751 24 Uppsala, Sweden
3
Information Technologies and Programming Faculty, ITMO University, Kronverksky Pr. 49, bldg. A, 197101 St. Petersburg, Russia
4
St. Petersburg School of Physics, Mathematics, and Computer Science, HSE University, 16 Soyuza Pechatnikov Street, 190121 St. Petersburg, Russia
5
Department of Analytical Chemistry, Faculty of Chemistry, Gdańsk University of Technology, 11/12 Narutowicza Str., 80-233 Gdańsk, Poland
6
Department of Pharmaceutical Biosciences, Molecular Neuropharmacology, Uppsala Biomedical Centre, University of Uppsala, Husargatan 3, Box 591, 751 24 Uppsala, Sweden
7
Department of Pharmaceutical Biosciences, Pharmaceutical Bioinformatics, Uppsala Biomedical Centre, University of Uppsala, Husargatan 3, Box 591, 751 24 Uppsala, Sweden
8
Institute of Translational Medicine and Biotechnology, I. M. Sechenov First Moscow State Medical University, Trubetskay Str. 8, bldg 2, 119991 Moscow, Russia
*
Author to whom correspondence should be addressed.
Int. J. Mol. Sci. 2021, 22(19), 10785; https://doi.org/10.3390/ijms221910785
Submission received: 1 September 2021 / Revised: 23 September 2021 / Accepted: 27 September 2021 / Published: 5 October 2021
(This article belongs to the Section Molecular Toxicology)

Abstract

:
Bisphenols are important environmental pollutants that are extensively studied due to different detrimental effects, while the molecular mechanisms behind these effects are less well understood. Like other environmental pollutants, bisphenols are being tested in various experimental models, creating large expression datasets found in open access storage. The meta-analysis of such datasets is, however, very complicated for various reasons. Here, we developed an integrating statistical and machine-learning model approach for the meta-analysis of bisphenol A (BPA) exposure datasets from different mouse tissues. We constructed three joint datasets following three different strategies for dataset integration: in particular, using all common genes from the datasets, uncorrelated, and not co-expressed genes, respectively. By applying machine learning methods to these datasets, we identified genes whose expression was significantly affected in all of the BPA microanalysis data tested; those involved in the regulation of cell survival include: Tnfr2, Hgf-Met, Agtr1a, Bdkrb2; signaling through Mapk8 (Jnk1)); DNA repair (Hgf-Met, Mgmt); apoptosis (Tmbim6, Bcl2, Apaf1); and cellular junctions (F11r, Cldnd1, Ctnd1 and Yes1). Our results highlight the benefit of combining existing datasets for the integrated analysis of a specific topic when individual datasets are limited in size.

1. Introduction

Bisphenols have been in commercial use as plasticizers for over 70 years. They are reported to be estrogenic mimics that may interfere with hormonal homeostasis. One very prevalent bisphenol, bisphenol A (BPA), is used for manufacturing polysulfones and polycarbonate plastics, epoxy resins, and thermal paper. BPA is considered an endocrine and metabolic disruptor, able to interfere with important physiological systems, such as insulin-glucagon signaling [1,2,3,4]. Comparatively, BPA has one of the highest production volumes of any chemical worldwide, with global production estimated at 7.7 million metric tons in 2015, and it is expected to reach 10.6 million metric tons by 2022 [5]. Mammals are exposed to BPA daily through several routes, such as the consumption of food and drink, drugs, air born inhalation, and contact materials, such as various plastics, medical devices, and store receipts [6,7,8]. However, the main exposure route of BPA is through diet as many food packages contain BPA, allowing it to leach into the food and be ingested [6,9,10,11,12]. Due to its pervasiveness in the environment, BPA has been detected in the urine and sera in 90% of the people sampled, as well as in the amniotic fluid, placenta, and breast milk of women [7,13,14,15,16,17,18]. It has become increasingly clear that BPA can bioaccumulate in the food chain. In fact, in a study in Africa, BPA reached very high concentrations in food (940 ng/g), biological fluids (209 ng/mL), consumer and PCPs (3.6 μg/g), and semisolids (154 μg/g) [19].
Considering the prevalence of BPA in the biome and its suspected disruption of human physiology, many groups have used various model organisms, including mice or human cell lines, in an attempt to determine how BPA interacts with different biological signaling systems [20]. Some of these groups have performed a microarray analysis after BPA exposure and deposited this information in public data banks [21,22]. However, most of the published datasets are relatively small, and meta-analysis studies that attempt to integrate existing microarray datasets regarding exposure to BPA are currently lacking. There is an opportunity to combine the existing datasets to improve the accuracy of the identified genes and pathways involved in BPA exposure.
It is somewhat surprising that most of the literature on data mining and chemometric data calculations refers to the exposure-instrumental/biological testing loop while less attention has been paid to exposure-gene expression correlations treatment with advanced environmetrics. The impact of BPA on cardiometabolic factors [23] has shown a positive correlation between patients’ BPA concentrations and diabetes (87%), overweight (28%), obesity (85%), elevated waist circumference (100%), cardiovascular diseases (80%), and hypertension (66%) in cross-sectional studies. Unfortunately, none of these studies can confirm if BPA can be proven as a risk factor of the observed anomalies or if these elevated BPA concentrations result from the already pre-disordered status of the given patient. The problem is of increasing importance as BPA (at environmentally relevant concentrations) has been confirmed to affect pre-implanted embryos and has been detected in samples of serum and follicular fluid collected from women and the umbilical cord at ca. 1–2 ng/mL levels [11]. For this reason, it is warranted to pay more attention to studies on the exposure-gene expression loop to unveil these interrelationships.
The amount of functional genomics data in the form of expression profiles from various experimental designs and model organisms are increasing rapidly, with over 1000 new submissions yearly to the ArrayExpress repository (https://www.ebi.ac.uk/arrayexpress/, accessed on 10 February 2020) [24]. Currently, the largest repositories of public functional genomics data are ArrayExpresses and NCBI Geo (https://www.ncbi.nlm.nih.gov/geo/, accessed on 10 February 2020) [25], which, in January 2020, contained 72,578 and 97,273 unique experiments, respectively; although 59,374 were found in both databases and, hence, redundant [26]. Currently, the majority of these are in the form of microarray data, although, since 2018, the number of RNASeq experiments submitted to ArrayExpress is higher than the number of microarray submissions [24]. Utilizing these databanks for novel large-scale analysis poses challenges due to the diversity of the technical platforms used to generate the data, resulting in differences in file formats, signal levels, and data variance, as well as differences in experimental design. Although several attempts have been made to simplify data retrieval and data selection, such as the All Of gene Expression (AOE) web portal [26] and Biostudies database, which is now becoming the successor of ArrayExpress [24], the challenges of between-experiments normalization and adjusting for the differences in experimental design remain. These difficulties in combining and analysing functional genomics data from various sources necessitate innovative and more powerful methods to utilize these data for novel analyses.
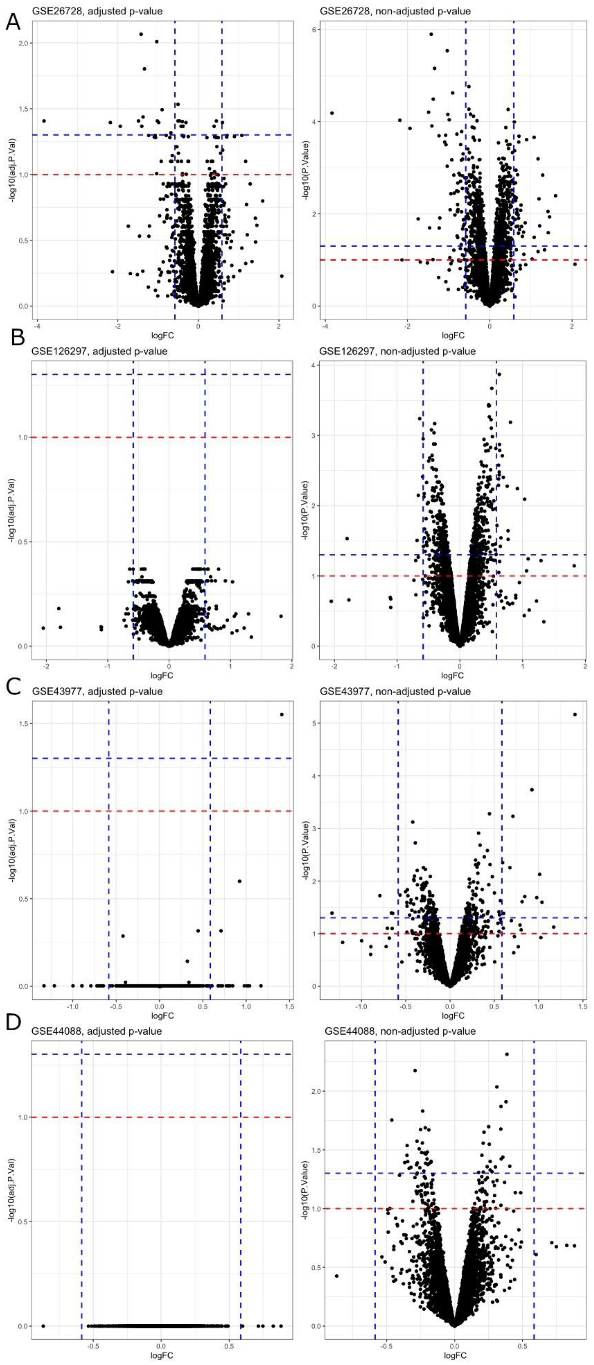
In this manuscript, we studied the gene expression changes from four available microarray datasets of mice under the influence of BPA exposure. The standard approach in analysing gene expression changes is to perform differential expression analysis with statistical tests for differences in intensity [27]. We performed this traditional differential gene expression analysis of individual GEO datasets. However, this method suffers from various issues, such as uncertainty in p-value choice to select the right set of “important” genes in terms of biological effects and the necessity of dealing with the problem of multiple comparisons. In contrast, machine learning methods, especially feature selection methods, are widely used today in gene expression analysis, providing the ability to select the right set of “important” genes in terms of the quality of the prediction model [27,28]. In this study, we focused on applying machine learning methods in terms of feature selection (FS), revealing key genes influenced by BPA exposure.
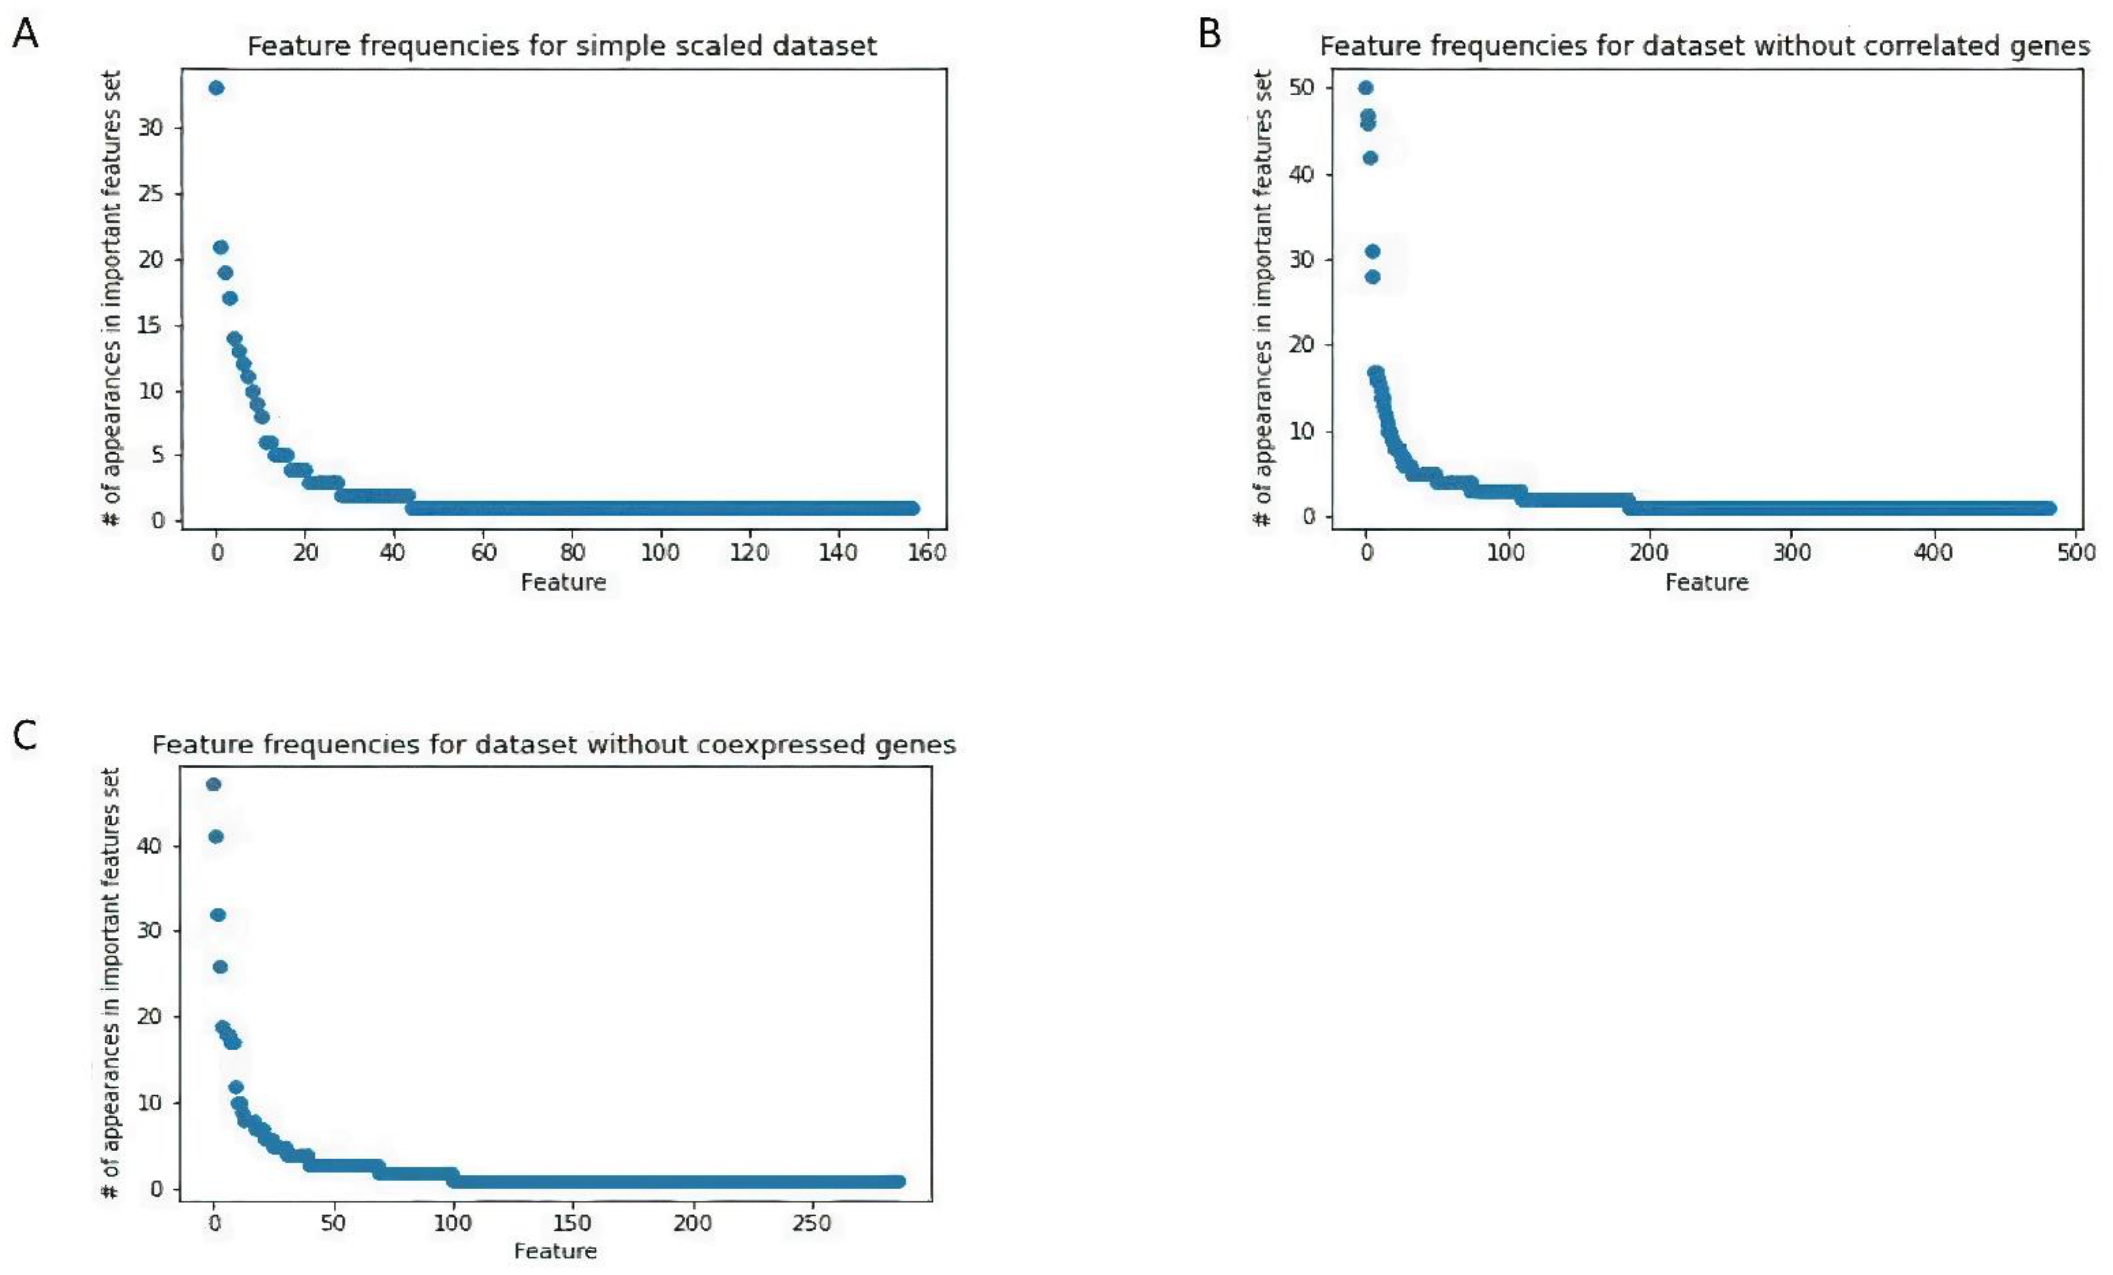
We constructed three joint datasets following three different correlation-based pre-processing approaches, namely using all of the common genes through four GEO datasets, uncorrelated, and no co-expressed genes, respectively. By applying machine learning methods to these joint datasets, we identified genes whose expression was significantly changed in all of the BPA microanalysis data tested. We went on to determine that a subset of these genes is involved in the regulation of cell survival and apoptosis. Our results highlight the benefit of combining existing datasets for integrated analysis for a specific topic when individual datasets are limited in size, in our case when studying the effects of BPA.

2. Results

2.1. Differential Gene Expression Analysis

Differential gene expression analysis was performed in several ways in terms of statistical significance. As described in the Methods section, we declared a gene differentially expressed if an observed expression difference between two experimental conditions reported an adjusted p-value < 0.05. We also performed the same analysis with an adjusted p-value < 0.1, non-adjusted p-value < 0.05, and non-adjusted p-value < 0.1 (Figure 1). After applying multiple adjustment corrections, the analysis determined that GSE26728 was the only dataset with differentially expressed genes. All of the other datasets examined did not show any differentially expressed genes, neither with an adjusted p-value < 0.05 nor with an adjusted p-value < 0.1. On the contrary, all the datasets showed differentially expressed genes with both a non-adjusted p-value < 0.05 and a non-adjusted p-value < 0.1. Therefore, we could state that there were no common differentially expressed genes among the four datasets.

2.2. Machine Learning Methods

In our study, we found that ensemble-based methods (Section 4.2.1) tended to overfit the data studied (Table 1). Both the Random Forest (RF) model and the Support Vector Machine (SVM) ensemble model were able to learn the training dataset, producing 1.0 training accuracy, but failed to generalize, producing a test accuracy only slightly higher than 0.5. Due to the high differences in training and test accuracies for fitted models, we did not use feature sets from these models in any subsequent analysis.
In contrast, the iterative model seemed to be able to construct more meaningful feature sets before it overfit our data. The iterative feature selection procedure (Section 4.2.2) with two binary classification models, Naïve Bayesian classifier (NB) and Logistic Regression (LR), were applied to the datasets. The resulting feature sets, composed of selected genes, were used to train a single SVM model in order to prove the predictive ability of the selected features (Section 4.3). Table 2 and Table 3 show the test/training cross-validation accuracies and ROC AUC scores of the SVM model. Although the training accuracies and ROC AUC scores remained close to 1.0, the differences between the training and test scores significantly decreased, showing the ability of the models to generalize.

2.3. Gene Lists Analysis

In the next step, we analyzed the number of appearances of each feature in the feature sets, obtained by 100 runs of the iterative feature selection procedure on each of the datasets (ref. to Section 4.4.1). We considered the most frequent features to be the most important genes in terms of distinguishing between the BPA-exposed and control samples. For these genes, pathway analysis was performed using DAVID [29] to determine the most enriched pathways and biological processes within each dataset (Section 4.4.2). This revealed that the most frequent genes from the simple scaled dataset (Figure 2A and Table 4), without correlated genes dataset (Figure 2B and Table 5), and without co-expressed genes dataset (Figure 2C and Table 6) did not cluster together in any Gene Ontology (GO) biological processes (BP). By examining the top genes for all of the datasets, we could observe 24 common genes (Table 7).
Next, the 24 common genes were used for pathway analysis using DAVID to find the most enriched biological processes. The functional annotation in DAVID showed that one cluster of genes (Dbp, P2ry1, Tbl1x, Nrip1, and Yes1) was related to GO:004594: the positive regulation of transcription from RNA polymerase II promoter. There were also two genes belonging to the ephrin receptor signaling pathway (GO:0048013), Efnb2 and Efna4.
We then examined important features for the intersection of the top 30 genes from the machine learning models with the cut-off of 20 appearances. It was expected that important (the most frequent) features for datasets without correlated and without co-expressed genes would be similar due to the similarity of the pre-processing procedure. Five common genes among the top 30 genes were found for these datasets: F11r, Pfkfb1, Zfp839, Csn1s2b, Yes1. Moreover, there were two genes (Rad9a, Senp5) that appear in the top 30 genes in the simple scaled dataset only.
The genes from the top 30 important genes dataset were also utilized in the pathway analysis using DAVID to determine the most enriched biological processes. Although most of the genes did not form any obvious clusters, the functional annotation in DAVID showed that the two largest clusters of Gene Ontology (GO) biological processes (BP) were related to the regulation of apoptosis (GO:0042981) and proteolysis (Table 8). In fact, two clusters, having some gene overlap, were related to the general regulation of apoptosis or the negative regulation of apoptosis (GO:0043066) (Table 8 and Figure 3).

3. Discussion

Bisphenols are important pollutants that significantly infiltrated the biome. Their potential to disrupt physiology has led several groups to perform microarray analysis using biological material from mice after BPA intervention. The large datasets created by these works have been deposited in public data banks [21,22], but no other analysis has been performed. Using machine learning, we mined a subset of these microarray datasets and were able to define not only a method for performing a meta-analysis of these large datasets but also produce pathways conserved across different BPA interventions within a species.
Our research confirms the importance of combining datasets in a meta-analysis but also highlights the importance of different pre-processing steps before applying machine learning methods, especially for small datasets. In this study, we focused on various correlation-based gene averaging processes. We showed that the usage of these strategies leads to different, but, in general, related, solutions. This suggests that co-expression-based pre-processing produces a dataset modification that promotes a solution candidate. Using hard voting, the final result was aggregated from the results of running three models on dataset modifications. The strategies to improve this process might include a deeper investigation of the differences in outcomes between the models, as well as more sensitive aggregation.
BPA exposure has been shown to disrupt mitochondria integrity, leading to elevated ROS levels and apoptosis rates in human granulosa and HT-22 cells, which are derived from the mouse brain [30,31]. The BPA-inhibited proliferation of neural progenitor cells and rat embryonic midbrain cells through the suppression of the JNK signaling pathway has also been reported [32,33]. Our gene ontology analysis using DAVID indicated that a significant group of the top 30 transcripts recovered from machine learning models were linked to the regulation of apoptosis (see 
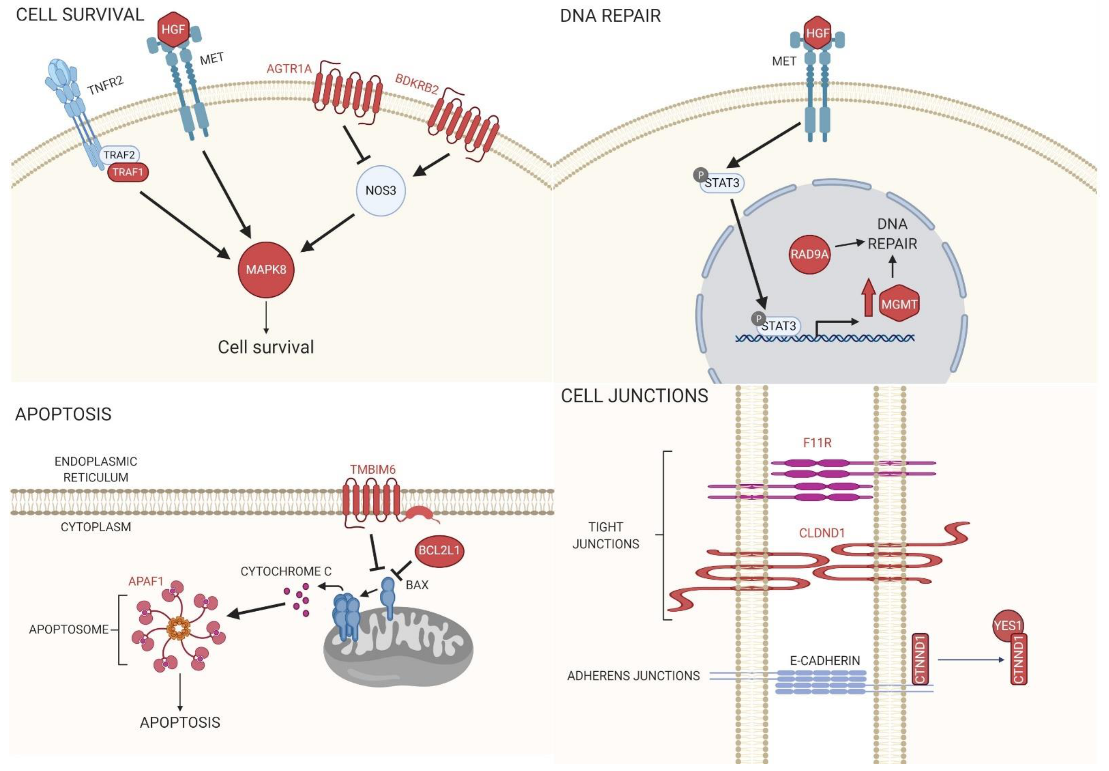
Table 8). Furthermore, by using DAVID and STRING, it became evident that many of the genes encoding these transcripts categorized as being involved in the regulation of apoptosis were, in fact, cell survival pathways that converged on Mitogen-Activated Protein Kinase 8 (Mapk8, also known as Jnk1) (Figure 3). The protein of one of the transcripts recovered, Hepatocyte growth factor (Hgf), activates MET Proto-Oncogene, Receptor Tyrosine Kinase (Met), which not only regulates Mapk8 activation but also leads to increased transcriptional expression of another gene in our dataset, O-6-Methylguanine-DNA Methyltransferase (Mgmt) [34]. Mgmt and Rad9a proteins, whose transcript levels were also shown to be affected by BPA, are both involved in repairing damaged DNA [35]. Furthermore, in mouse macrophages, it was determined that BPA-induced mitochondrial disruption reduced BCL2 protein expression, which led to caspase-dependent apoptosis [36]. In our study, one of the top 30 genes was Bcl2l1, whose protein is known to inhibit Bax-induced apoptosis (Figure 3). Furthermore, the protein of another gene recovered in the study, Apaf1, acts downstream of Bax, and, along with Caspase-9, forms an apoptosome to induce apoptosis (Figure 3) [37]. Interestingly, we also showed that Tmbim6 transcript levels are affected by BPA, and Tmbim6 was shown to inhibit Bax-induced apoptosis (Figure 3) [38].
Three of the top 30 genes, F11 Receptor (F11r, also known as Jam-1), Claudin Domain Containing 1 (Cldnd1), and Catenin Delta 1 (Ctnnd1), are associated with either tight or adherens junctions (see Table 8 and Figure 3). In a recent study, the reproductive toxicity of BPA was investigated. Male CD-1 mice were orally administrated BPA, and the results showed that this exposure was sufficient to induce disorders in spermatogenesis, including damaging the tight junctions between Sertoli cells [39]. Another study examined the effect of BPA in female rats on the expression levels of tight junction (TJ) transcripts in the uterus during early pregnancy. This study found profound alterations in the TJ gene transcript levels of uterine epithelial cells when the rats were exposed to BPA, which led to changes in fluid and ion transport across the epithelium, blocking the receptivity of the uterus to blastocyst implantation [40]. In fact, this study saw profound effects on claudin transcript levels, such as Cldnd1, including low expression levels or even the loss of expression.
Interestingly, our study recovered transcripts for two receptors that are in pathways regulated by Angiotensin I Converting Enzyme (ACE), Angiotensin II Receptor Type 1a (Agtr1a), and Bradykinin Receptor B2 (Bdkrb2) (see Table 8 and Figure 3). In both rat cardiac cells and human endothelial cell lines, it was shown that BPA was proangiogenic, including the upregulation of Nitric Oxide Synthase 3 [41,42,43]. In another report, it was discovered in rat striatum that the inhibition of ACE was able to alleviate the ROS-inducing effects of a BPA + 1-methyl-4-phenylpyridinium ion (MPP(+)) mixture [44]. Interestingly, both Agtr1a and Bdkrb2 signal upstream of Nos3, where Agtr1a leads to Nos3 inhibition and Bdkrb2 leads to activation (Figure 3).
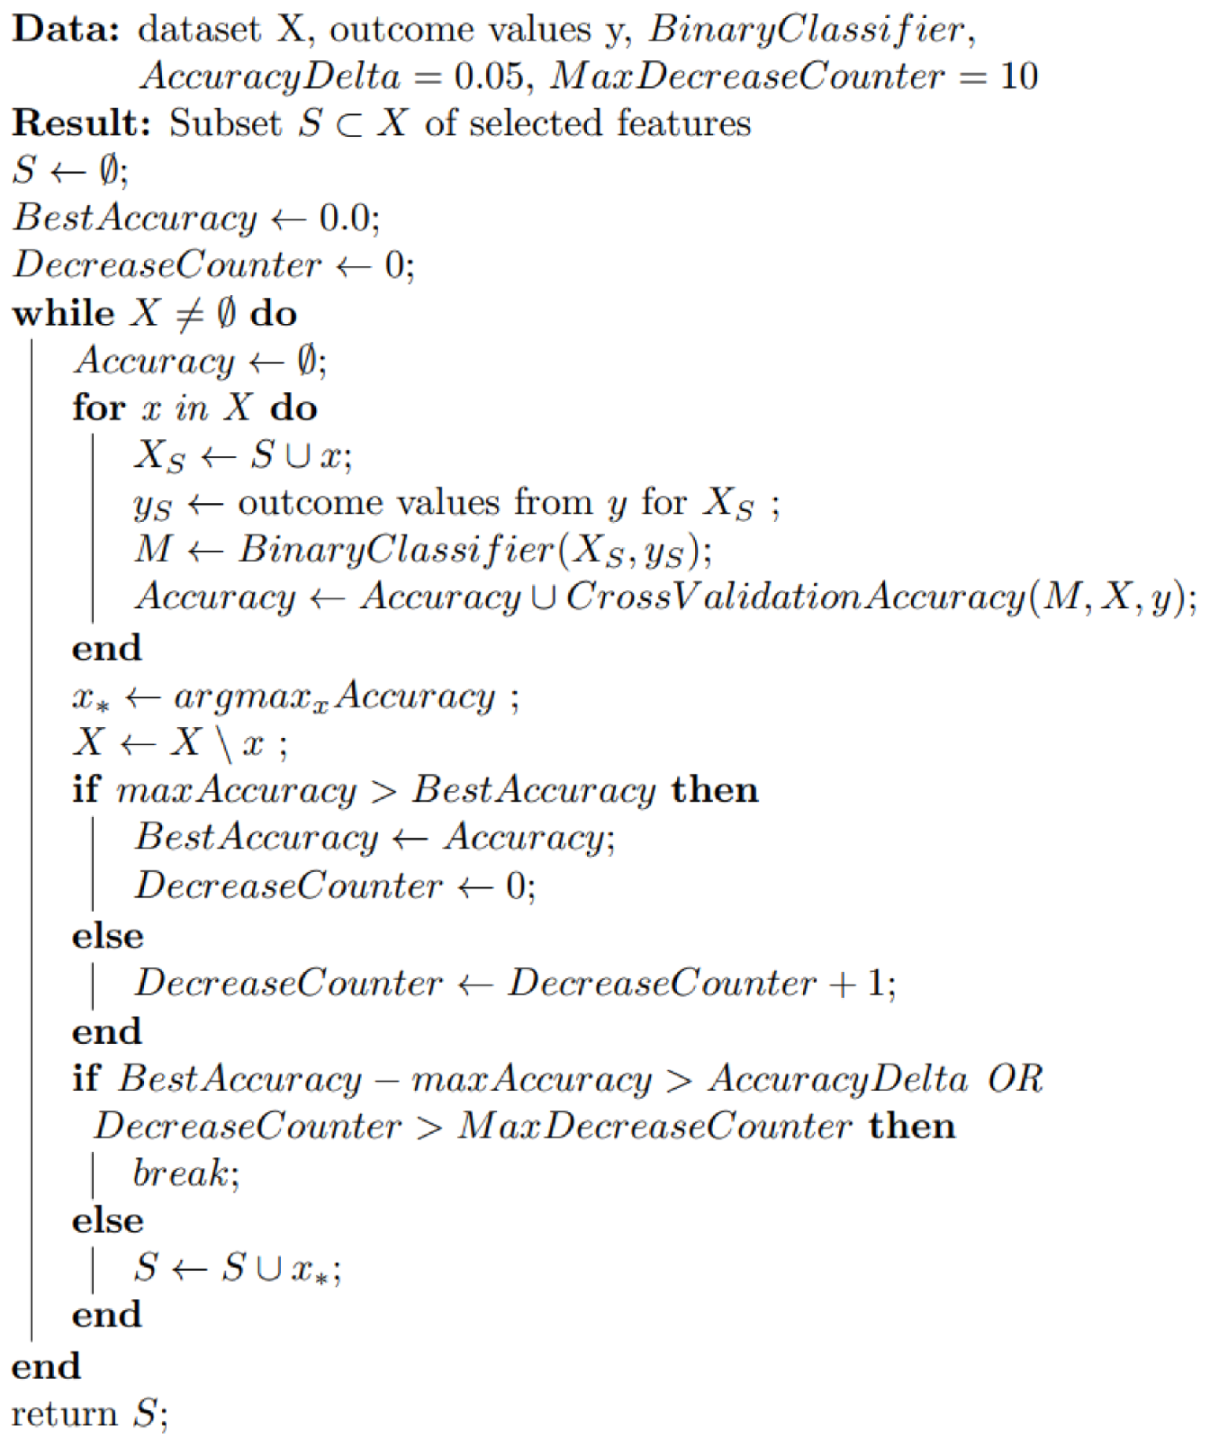
In terms of computational methods, in this paper, we suggest using a new cross-validation-based greedy feature selection algorithm with three different preprocessing strategies. Using this approach, one has the flexibility to incorporate different machine learning models and stopping criteria into the feature selection procedure depending on the properties of the data. We also provided gene importance analysis based on the frequencies of the genes’ appearances in the feature lists from 100 runs of the proposed algorithm. For small datasets, this process is more stable than using feature selection techniques based on a single run.
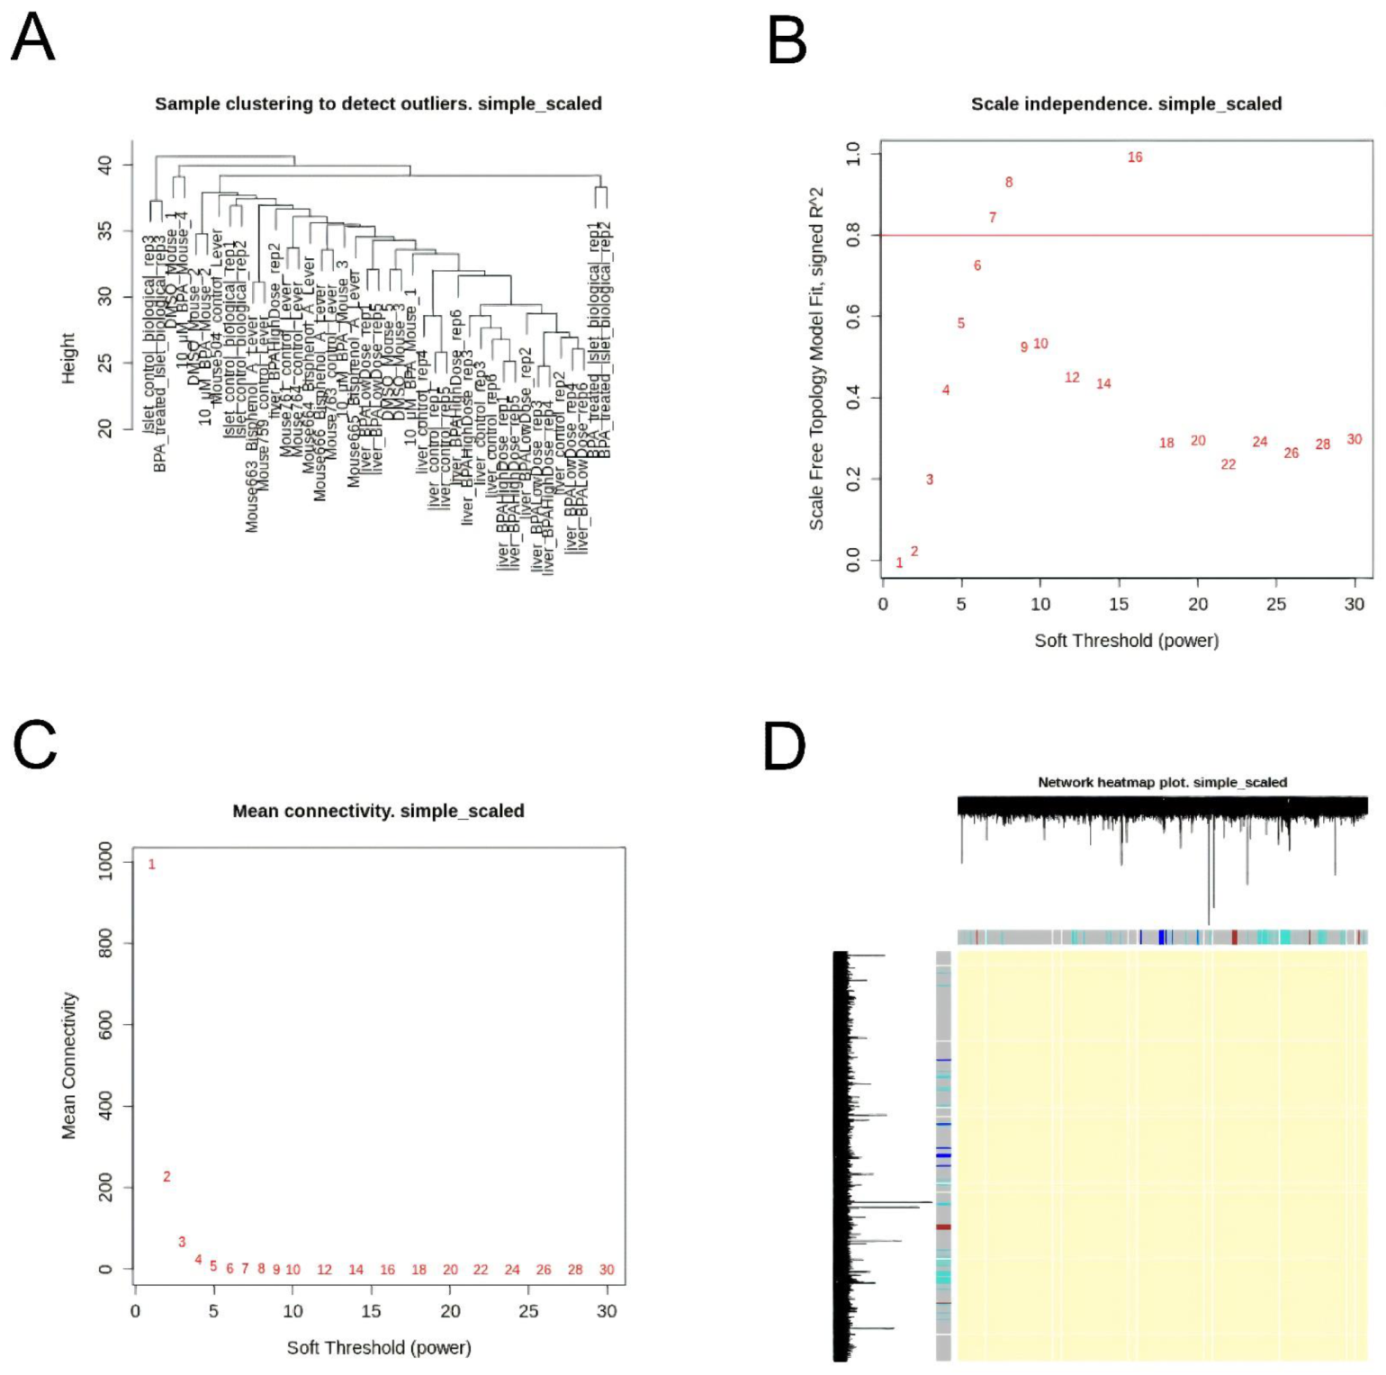
Our results highlight the value of integrating data from multiple datasets for co-analysis, revealing new biological knowledge. However, a key limitation of our study is still a lack of publicly available microarray data after BPA exposure, which restricts our investigation to the baseline machine learning methods. This is also an important constraint for analyzing the differences between the results from datasets without correlated and without co-expressed genes. We used co-expression analysis with the WGCNA package for each GEO dataset, but it should be carefully used for datasets with less than 15 samples [45]. This means that a pre-processing method should be attentively chosen based on the available data.
In summary, we developed a new approach for the meta-analyses of microarray data, which could be very useful for analyzing other datasets relating to any environmental pollutants. The pathways that we have identified align well with the previous evidence for the molecular actions of BPA and prompt further studies into pathways that relate to the regulation of cell survival, DNA repair, apoptosis, and cellular junctions.

4. Materials and Methods

4.1. Dataset Collection of BPA-Exposure-Related Data

We restricted our survey to the datasets devoted to BPA-exposure experiments using male mice. Four publicly available microarray datasets from the GEO database were examined: GSE26728 [21], GSE126297 [22], GSE43977 [43], and GSE44088 [43]. In GSE26728, liver gene expression was measured from CD-1 mice exposed for 28 days to bisphenol A at doses 0 (controls), 50 (TDI or low dose), or 5000 µg/kg/day (NOAEL or high dose) via food spiking [21]. The GSE126297 dataset used pancreatic islets from OF1 male mice after exposure of organisms to 100 μg/kg/day (two injections of 50 μg/kg/day) for four days [22]. The GSE43977 and GSE44088 datasets used hepatic samples from C57BL/6J mice [43] after exposure to ~21.93 mM (5000 ppm) for 7 days and 10 μM for 24 h, respectively. Four datasets have 41 samples in total, 21 control untreated samples and 20 treated samples.
We examined each dataset separately for differential expression analysis. For ML-based analysis, we combined datasets following three different strategies. Below is the detailed description of all pre-processing procedures.

4.1.1. Data Pre-Processing for Differential Expression Analysis of Individual Datasets

In the bioinformatic pipeline, we examined each dataset separately, where datasets themselves were given log2-transformed values. Expression data files were pre-processed using the R limma package (version 3.42.0) [46]. We annotated datasets with Entrez ID and dropped NA values. We defined low-expression genes with a constant threshold for log-transformed probe intensity values and removed them manually from the dataset [47]. We also removed probe replicates using the avereps function and performed quantile normalization using the normalizeBetweenArrays function.

4.1.2. Data Pre-Processing for Machine Learning-Based Analysis for Combined Datasets

In order to analyze combined datasets, we reduced each dataset to the common genes set among all datasets. This left us with four datasets having 6742 genes in each. Then, we scaled intensity values for each gene in each dataset in the range of 0 to 1, following Equation (1).
x s c a l e d = x m i n x m a x x m i n x ,
where x is an intensity value for the specific gene.
Finally, we combined scaled datasets into a single dataset, following three different strategies. The first strategy was not to use any modification. The second and third strategies use two different ways to construct independent feature sets in order to meet the requirement of machine learning algorithms with independence assumptions between the features.
Simple scaled dataset. The first strategy is to combine four datasets without any modifications, resulting in a dataset with a matrix size of 41×6742.
Dataset without correlated genes. In the second strategy, we built a correlation graph. In this graph, vertices correspond to the genes, and edges correspond to the correlated genes with α level of Pearson correlation. Then, we replaced each connectivity component with an averaged value of its vertices. Thus, the new dataset consists of uncorrelated elements, representing genes or averaged groups of genes. We varied α from 0.7 to 0.99 and finally used 0.7 because, for higher levels, most of the genes did not belong to any correlation cluster. This strategy resulted in a dataset with a shape of 41x5704.
Dataset without co-expressed genes. In the third strategy, we used the R package WGCNA (version 1.46) [48] to build co-expressing clustering based on biweight midcorrelation. For a combined scaled dataset, we analyzed genes’ co-expression with the following steps. First, we clustered the samples (in contrast to clustering genes that will be described later) with hclust function to see if there are any potential outliers. Figure 4A shows a sample tree without any outliers.
Then, we built a gene-gene similarity network with soft-threshold power selection using pickSoftThreshold function. Figure 4B,C show soft-threshold power selection. We chose the threshold equal to 7 (this value is the lowest power for which the scale-free topology fit index curve flattens out upon reaching a high value).
In the next step, we built the corresponding gene network and identified modules within each network. Figure 4D shows the heatmap for the gene network. Each row and column of the heatmap corresponds to a single gene. The heatmap can depict adjacencies or topological overlaps, with light colors denoting low adjacency (overlap) and darker colors higher adjacency (overlap). In addition, the gene dendrograms and module colors are plotted along the top and left side of the heatmap. Based on results presented in Figure 4D, one can conclude that genes taken into account do not have strong co-expression.
Finally, we averaged genes among each cluster. In total, 3 clusters with 1094 genes were averaged. This strategy resulted in a dataset with a matrix size of 41×5651. As a result, we have obtained the simple combined dataset, the dataset without correlated genes, and the dataset without co-expressed genes.

4.1.3. Differential Gene Expression Analysis

We performed differential expression analysis using the R package limma (version 3.42.0) [46]. Benjamini–Hochberg correction was applied as multiple testing correction. A gene was declared differentially expressed if an observed expression difference between two experimental conditions was equal or more than 1.5 and statistically significant (adjusted p-value < 0.05).

4.2. Machine Learning-Based Genes Selection

We used machine learning to build binary classification models considering genes as features and then find “important” features in terms of distinguishing BPA-exposed samples from control ones. In particular, we used two different machine learning-based approaches, namely ensemble-based methods and new iterative feature selection procedure.

4.2.1. Ensemble-Based Approach

We used Random Forest and Support Vector Machine (SVM) ensemble methods, with feature bagging, to all three datasets. Random Forest is a widely used classification model; we used it with 1000 Gini impurity-based trees and 100 features in each tree. In order to find the most “important” genes, we used Gini importance, which is computed as the total reduction of Gini impurity brought by that feature. Similar to Random Forest, we built an SVM ensemble with feature bagging. As a feature importance criterion, we used weights, assigned to each feature by the SVM classifier.

4.2.2. Iterative Feature Selection Procedure

We constructed a cross-validation-based greedy feature selection procedure (Figure 5). On each step, this procedure tries to expand a feature set by adding a new feature. It fits a model with different alternatives and selects a feature that is the best in terms of cross-validation accuracy on that step.
An alternative to this idea could be a Recursive Feature Elimination procedure (RFE), which fits a model once and iteratively removes the weakest feature until the specified number of features is reached. The reason why we did not use RFE procedure is its inability to control the fitting process, while our greedy selection algorithm provides us an opportunity to set up useful stopping criteria. We stopped when there was no significant increase in cross-validation accuracy, which helped us overcome overfitting.
Because of the small number of samples in our dataset, we used 50/50 split in cross-validation. This led to an issue of unstable feature selection at each step. In order to reduce this instability, we ran the procedure 100 times and calculated a gene’s appearances in “important genes” lists.
The crucial step of the algorithm is to train a binary classifier, which could be any appropriate classification model. In our study, we focused on strong baseline models. We used Logistic Regression with L1 and L2 penalties for the simple combined dataset and Naive Bayesian classifier for the datasets without correlated or co-expressed genes. Naive Bayesian classifier is known to be a strong baseline for problems with independence assumptions between the features. It assigns a class label y_NB from possible classes Y following maximum a posteriori principle (Equation (2)):
y N B = a r g m a x y Y P y i P x i y ,
under the “naive” assumption that all features are mutually independent (Equation (3)):
P x 1 , x 2 , , x n y = P x 1 y P x 2 y P x n y ,
where xi stands for an intensity value for the specific gene i, y stands for a class label, P x i y stands for a probability of class y for the intensity value xi, P(y) stands for y class probability. Both probabilities P x i y and P(y) are estimated with relative frequencies in the training set.
Logistic Regression is a simple model that assigns class probabilities with sigmoid function of linear combination (Equation (4)):
y L R = a r g m a x y Y σ y w T x ,
where x stands for a vector of all intensity values, w stands for a vector of linear coefficients, y stands for a class label and σ is a sigmoid function.
We used it with ElasticNet regularization, which includes penalties to L1 and L2 norms of weight vector w.

4.3. Genes Selection Validation

In order to prove predictive ability of selected features, we used them in the S classifier, which is known to be a strong model for binary classification. We checked the increase in cross-validation ROC AUC scores for each feature set.

4.4. Gene Lists Analysis

4.4.1. Identification of the Most Important Genes

We calculated the genes’ appearances in feature lists from 100 runs of the algorithm (Figure 5). From these frequencies, we were able to range genes in each dataset in terms of their importance for binary classification.
In order to compare gene lists to each other, we built a summary table using the top 30 genes of each dataset. We also annotated them with corresponding p-values from differential expression analysis.

4.4.2. Annotation and Pathway Analysis

Pathway enrichment analysis was performed in DAVID (Database for Annotation, Visualization and Integrated Discovery) and PANTHER, using Gene Ontology (GO), and Reactome databases (PMID: 22543366; PMID: 30804569; PMID: 31691815). The MetaCore default setting of false discovery rate (FDR) < 0.05 was used as threshold for significance in enrichment analysis.

Author Contributions

Conceptualization, N.L., M.J.W., R.F., O.S. and H.B.S.; methodology, N.L. and M.J.W.; software, N.L., E.K. and E.V.; validation, N.L. and M.J.W.; data curation, E.K. and E.V.; writing—original draft preparation, N.L. and M.J.W.; writing—review and editing, B.K., R.F., O.S., and H.B.S.; visualization, N.L. and M.J.W.; supervision, H.B.S. All authors have read and agreed to the published version of the manuscript.

Funding

Helgi B. Schiöth is supported by the Swedish Research Council, Formas and the Novo Nordisk Foundation. Błażej Kudłak is acknowledging IDUB ‘Excellence Initiative—Research University’ program DEC-1/2020/IDUB/I.3.2 financial support. Ola Spjuth received funding from FORMAS (2018-00924).

Institutional Review Board Statement

Not applicable.

Informed Consent Statement

Not applicable.

Conflicts of Interest

The authors declare no conflict of interest.

References

  1. Cao, H.; Wiemerslage, L.; Marttila, P.S.K.; Williams, M.J.; Schith, H.B. Bis-(2-ethylhexyl) Phthalate Increases Insulin Expression and Lipid Levels in Drosophila melanogaster. Basic Clin. Pharmacol. Toxicol. 2016, 119, 309–316. [Google Scholar] [CrossRef] [PubMed] [Green Version]
  2. Le Magueresse-Battistoni, B.; Multigner, L.; Beausoleil, C.; Rousselle, C. Effects of bisphenol A on metabolism and evidences of a mode of action mediated through endocrine disruption. Mol. Cell. Endocrinol. 2018, 475, 74–91. [Google Scholar] [CrossRef] [PubMed]
  3. Menale, C.; Grandone, A.; Nicolucci, C.; Cirillo, G.; Crispi, S.a. Bisphenol A is associated with insulin resistance and modulates adiponectin and resistin gene expression in obese children. Pediatric Obes. 2017, 12, 380–387. [Google Scholar] [CrossRef] [PubMed]
  4. Williams, M.J.; Wang, Y.; Klockars, A. Exposure to Bisphenol A Affects Lipid Metabolism in Drosophila melanogaster. Basic Clin. Pharmacol. Toxicol. 2014, 114, 414–420. [Google Scholar] [CrossRef]
  5. Almeida, S.; Raposo, A.; Almeida-Gonzlez, M.; Carrascosa, C. Bisphenol A: Food Exposure and Impact on Human Health. Compr. Rev. Food Sci. Food Saf. 2018, 17, 1503–1517. [Google Scholar] [CrossRef] [Green Version]
  6. Geens, T.; Aerts, D.; Berthot, C.; Bourguignon, J.-P.; Goeyens, L.; Lecomte, P.; Maghuin-Rogister, G.; Pironnet, A.-M.; Pussemier, L.; Scippo, M.-L.a. A review of dietary and non-dietary exposure to bisphenol-A. Food Chem. Toxicol. 2012, 50, 3725–3740. [Google Scholar] [CrossRef]
  7. Lee, J.; Choi, K.; Park, J.; Moon, H.-B.; Choi, G.; Lee, J.J.; Suh, E.; Kim, H.-J.; Eun, S.-H.; Kim, G.-H.; et al. Bisphenol A distribution in serum, urine, placenta, breast milk, and umbilical cord serum in a birth panel of mother–neonate pairs. Sci. Total Environ. 2018, 626, 1494–1501. [Google Scholar] [CrossRef]
  8. Vandenberg, L.N.; Hunt, P.A.; Myers, J.P.; vom Saal, F.S. Human exposures to bisphenol A: Mismatches between data and assumptions. Rev. Environ. Health 2013, 28. [Google Scholar] [CrossRef]
  9. Hahladakis, J.N.; Velis, C.A.; Weber, R.; Iacovidou, E.; Purnell, P. An overview of chemical additives present in plastics: Migration, release, fate and environmental impact during their use, disposal and recycling. J. Hazard. Mater. 2018, 344, 179–199. [Google Scholar] [CrossRef]
  10. Huang, R.-P.; Liu, Z.-H.; Yuan, S.-F.; Yin, H.; Dang, Z.; Wu, P.-X. Worldwide human daily intakes of bisphenol A (BPA) estimated from global urinary concentration data (2000–2016) and its risk analysis. Environ. Pollut. 2017, 230, 143–152. [Google Scholar] [CrossRef]
  11. Ikezuki, Y.; Tsutsumi, O.; Takai, Y.; Kamei, Y.; Taketani, Y. Determination of bisphenol A concentrations in human biological fluids reveals significant early prenatal exposure. Hum. Reprod. 2002, 17, 2839–2841. [Google Scholar] [CrossRef] [Green Version]
  12. Koestel, Z.L.; Backus, R.C.; Tsuruta, K.; Spollen, W.G.; Johnson, S.A.; Javurek, A.B.; Ellersieck, M.R.; Wiedmeyer, C.E.; Kannan, K.; Xue, J.; et al. Bisphenol A (BPA) in the serum of pet dogs following short-term consumption of canned dog food and potential health consequences of exposure to BPA. Sci. Total Environ. 2017, 579, 1804–1814. [Google Scholar] [CrossRef]
  13. Fujimoto, V.Y.; Kim, D.; vom Saal, F.S.; Lamb, J.D.; Taylor, J.A.; Bloom, M.S. Serum unconjugated bisphenol A concentrations in women may adversely influence oocyte quality during in vitro fertilization. Fertil. Steril. 2011, 95, 1816–1819. [Google Scholar] [CrossRef]
  14. Hormann, A.M.; vom Saal, F.S.; Nagel, S.C.; Stahlhut, R.W.; Moyer, C.L.; Ellersieck, M.R.; Welshons, W.V.; Toutain, P.-L.; Taylor, J.A. Holding Thermal Receipt Paper and Eating Food after Using Hand Sanitizer Results in High Serum Bioactive and Urine Total Levels of Bisphenol A (BPA). PLoS ONE 2014, 9, e110509. [Google Scholar] [CrossRef]
  15. Liao, C.; Kannan, K. Determination of Free and Conjugated Forms of Bisphenol A in Human Urine and Serum by Liquid Chromatography–Tandem Mass Spectrometry. Environ. Sci. Technol. 2012, 46, 5003–5009. [Google Scholar] [CrossRef]
  16. Salamanca-Fernndez, E.; Rodrguez-Barranco, M.; Petrova, D.; Larraaga, N.; Guevara, M.; Moreno-Iribas, C.; Chirlaque, M.D.; Colorado-Yohar, S.; Arrebola, J.P.; Vela, F.; et al. Bisphenol A exposure and risk of ischemic heart disease in the Spanish European Prospective Investigation into cancer and nutrition study. Chemosphere 2020, 261, 127697. [Google Scholar] [CrossRef]
  17. Vandenberg, L.N.; Chahoud, I.; Heindel, J.J.; Padmanabhan, V.; Paumgartten, F.J.R.; Schoenfelder, G. Urinary, Circulating, and Tissue Biomonitoring Studies Indicate Widespread Exposure to Bisphenol A. Environ. Health Perspect. 2010, 118, 1055–1070. [Google Scholar] [CrossRef] [Green Version]
  18. Ye, X.; Zhou, X.; Hennings, R.; Kramer, J.; Calafat, A.M. Potential External Contamination with Bisphenol A and Other Ubiquitous Organic Environmental Chemicals during Biomonitoring Analysis: An Elusive Laboratory Challenge. Environ. Health Perspect. 2013, 121, 283–286. [Google Scholar] [CrossRef] [Green Version]
  19. Rotimi, O.A.; Olawole, T.D.a. Bisphenol A in Africa: A review of environmental and biological levels. Sci. Total Environ. 2021, 764, 142854. [Google Scholar] [CrossRef]
  20. Mohammed, E.T.; Hashem, K.S.; Ahmed, A.E.; Aly, M.T.; Aleya, L.; Abdel-Daim, M.M. Ginger extract ameliorates bisphenol A (BPA)-induced disruption in thyroid hormones synthesis and metabolism: Involvement of Nrf-2/HO-1 pathway. Sci. Total Environ. 2020, 703, 134664. [Google Scholar] [CrossRef]
  21. Marmugi, A.; Ducheix, S.; Lasserre, F.; Polizzi, A.; Paris, A.; Priymenko, N.; Bertrand-Michel, J.; Pineau, T.; Guillou, H.; Martin, P.G.P.; et al. Low doses of bisphenol a induce gene expression related to lipid synthesis and trigger triglyceride accumulation in adult mouse liver. Hepatology 2012, 55, 395–407. [Google Scholar] [CrossRef]
  22. Martinez-Pinna, J.; Marroqui, L.; Hmadcha, A.; Lopez-Beas, J.; Soriano, S.; Villar-Pazos, S.; Alonso-Magdalena, P.a. Oestrogen receptor $\beta$ mediates the actions of bisphenol-A on ion channel expression in mouse pancreatic beta cells. Diabetologia 2019, 62, 1667–1680. [Google Scholar] [CrossRef] [Green Version]
  23. Rancire, F.; Lyons, J.G.; Loh, V.H.Y.; Botton, J.; Galloway, T.; Wang, T.; Shaw, J.E.; Magliano, D.J. Bisphenol A and the risk of cardiometabolic disorders: A systematic review with meta-analysis of the epidemiological evidence. Environ. Health 2015, 14, 46. [Google Scholar] [CrossRef] [Green Version]
  24. Athar, A.; Fllgrabe, A.; George, N.; Iqbal, H.; Huerta, L.; Ali, A.; Snow, C.; Fonseca, N.A.; Petryszak, R.; Papatheodorou, I.; et al. ArrayExpress update—From bulk to single-cell expression data. Nucleic Acids Res. 2019, 47, D711–D715. [Google Scholar] [CrossRef]
  25. Barrett, T.; Wilhite, S.E.; Ledoux, P.; Evangelista, C.; Kim, I.F.; Tomashevsky, M.; Marshall, K.A.; Phillippy, K.H.; Sherman, P.M.; Holko, M.; et al. NCBI GEO: Archive for functional genomics data sets—update. Nucleic Acids Res. 2012, 41, D991–D995. [Google Scholar] [CrossRef] [Green Version]
  26. Bono, H. All of gene expression (AOE): An integrated index for public gene expression databases. PLoS ONE 2020, 15, e0227076. [Google Scholar] [CrossRef] [Green Version]
  27. Phipson, B.; Lee, S.; Majewski, I.J.; Alexander, W.S.; Smyth, G.K. Robust hyperparameter estimation protects against hypervariable genes and improves power to detect differential expression. Ann. Appl. Stat. 2016, 10. [Google Scholar] [CrossRef]
  28. Karthik, S.; Sudha, M. A Survey on Machine Learning Approaches in Gene Expression Classification in Modelling Computational Diagnostic System for Complex Diseases. Int. J. Eng. Adv. Technol. 2018, 8, 182–191. [Google Scholar]
  29. Jiao, X.; Sherman, B.T.; Huang, D.W.; Stephens, R.; Baseler, M.W.; Lane, H.C.; Lempicki, R.A. DAVID-WS: A stateful web service to facilitate gene/protein list analysis. Bioinformatics 2012, 28, 1805–1806. [Google Scholar] [CrossRef] [Green Version]
  30. Huang, M.; Huang, M.; Li, X.; Liu, S.; Fu, L.; Jiang, X.; Yang, M. Bisphenol A induces apoptosis through GPER-dependent activation of the ROS/Ca2+-ASK1-JNK pathway in human granulosa cell line KGN. Ecotoxicol. Environ. Saf. 2021, 208, 111429. [Google Scholar] [CrossRef]
  31. Pang, Q.; Li, Y.; Meng, L.; Li, G.; Luo, Z.; Fan, R. Neurotoxicity of BPA, BPS, and BPB for the hippocampal cell line (HT-22): An implication for the replacement of BPA in plastics. Chemosphere 2019, 226, 545–552. [Google Scholar] [CrossRef] [PubMed]
  32. Kim, K.; Son, T.G.; Kim, S.J.; Kim, H.S.; Kim, T.S.; Han, S.Y.; Lee, J. Suppressive Effects of Bisphenol A on the Proliferation of Neural Progenitor Cells. J. Toxicol. Environ. Health Part. A 2007, 70, 1288–1295. [Google Scholar] [CrossRef] [PubMed]
  33. Liu, R.; Xing, L.; Kong, D.; Jiang, J.; Shang, L.; Hao, W. Bisphenol A inhibits proliferation and induces apoptosis in micromass cultures of rat embryonic midbrain cells through the JNK, CREB and p53 signaling pathways. Food Chem. Toxicol. 2013, 52, 76–82. [Google Scholar] [CrossRef] [PubMed]
  34. Wu, P.; Cai, J.; Chen, Q.; Han, B.; Meng, X.; Li, Y.; Li, Z.; Wang, R.; Lin, L.; Duan, C.; et al. Lnc-TALC promotes O6-methylguanine-DNA methyltransferase expression via regulating the c-Met pathway by competitively binding with miR-20b-3p. Nat. Commun. 2019, 10, 2045. [Google Scholar] [CrossRef] [PubMed]
  35. Sierant, M.L.; Davey, S.K. Identification and characterization of a novel nuclear structure containing members of the homologous recombination and DNA damage response pathways. Cancer Genet. 2018, 228, 98–109. [Google Scholar] [CrossRef] [PubMed]
  36. Huang, F.-M.; Chang, Y.-C.; Lee, S.-S.; Ho, Y.-C.; Yang, M.-L.; Lin, H.-W.; Kuan, Y.-H. Bisphenol A exhibits cytotoxic or genotoxic potential via oxidative stress-associated mitochondrial apoptotic pathway in murine macrophages. Food Chem. Toxicol. 2018, 122, 215–224. [Google Scholar] [CrossRef] [PubMed]
  37. Dorstyn, L.; Akey, C.W.; Kumar, S. New insights into apoptosome structure and function. Cell Death Differ. 2018, 25, 1194–1208. [Google Scholar] [CrossRef] [PubMed]
  38. Lebeaupin, C.; Blanc, M.; Valle, D.; Keller, H.; Bailly-Maitre, B. BAX inhibitor-1: Between stress and survival. FEBS J. 2020, 287, 1722–1736. [Google Scholar] [CrossRef] [Green Version]
  39. Tian, J.; Ding, Y.; She, R.; Ma, L.; Du, F.; Xia, K.; Chen, L. Histologic study of testis injury after bisphenol A exposure in mice. Toxicol. Ind. Health 2017, 33, 36–45. [Google Scholar] [CrossRef]
  40. Martnez-Pea, A.A.; Rivera-Baos, J.; Mndez-Carrillo, L.L.; Ramrez-Solano, M.I.; Galindo-Bustamante, A.; Pez-Franco, J.C.; Morimoto, S.; Gonzlez-Mariscal, L.; Cruz, M.E.; Mendoza-Rodrguez, C.A. Perinatal administration of bisphenol A alters the expression of tight junction proteins in the uterus and reduces the implantation rate. Reprod. Toxicol. 2017, 69, 106–120. [Google Scholar] [CrossRef]
  41. Andersson, H.; Brittebo, E. Proangiogenic effects of environmentally relevant levels of bisphenol A in human primary endothelial cells. Arch. Toxicol. 2012, 86, 465–474. [Google Scholar] [CrossRef]
  42. Klint, H.; Lejonklou, M.H.; Karimullina, E.; Rnn, M.; Lind, L.; Lind, P.M.; Brittebo, E. Low-dose exposure to bisphenol A in combination with fructose increases expression of genes regulating angiogenesis and vascular tone in juvenile Fischer 344 rat cardiac tissue. Upsala J. Med. Sci. 2017, 122, 20–27. [Google Scholar] [CrossRef] [Green Version]
  43. Melis, J.P.M.; Derks, K.W.J.; Pronk, T.E.; Wackers, P.; Schaap, M.M.; Zwart, E.; van Ijcken, W.F.J.; Jonker, M.J.; Breit, T.M.; Pothof, J.; et al. In vivo murine hepatic microRNA and mRNA expression signatures predicting the (non-)genotoxic carcinogenic potential of chemicals. Arch. Toxicol. 2014, 88, 1023–1034. [Google Scholar] [CrossRef]
  44. Obata, T. Imidaprilat, an angiotensin-converting enzyme inhibitor exerts neuroprotective effect via decreasing dopamine efflux and hydroxyl radical generation induced by bisphenol A and MPP+ in rat striatum. Brain Res. 2006, 1071, 250–253. [Google Scholar] [CrossRef]
  45. Zhang, B.; Horvath, S. A General Framework for Weighted Gene Co-Expression Network Analysis. Stat. Appl. Genet. Mol. Biol. 2005, 4. [Google Scholar] [CrossRef]
  46. Matthew, E.R.; Belinda, P.; Di, W.; Yi, F.H.; Charity, W.L.; Wei, S.; Gordon, K.S. Limma powers differential expression analyses for RNA-sequencing and microarray studies. Nucleic Acids Res. 2015, 43, e47. [Google Scholar] [CrossRef]
  47. Cui, S.; Wu, Q.; West, J.; Bai, J. Machine learning-based microarray analyses indicate low-expression genes might collectively influence PAH disease. PLoS Comput. Biol. 2019, 15, e1007264. [Google Scholar] [CrossRef] [Green Version]
  48. Langfelder, P.; Horvath, S. WGCNA: An R package for weighted correlation network analysis. BMC Bioinform. 2008, 9, 559. [Google Scholar] [CrossRef] [Green Version]
Figure 1. Volcano plots of differential expression analyses, using adjusted p-values (left column) and non-adjusted p-values (right column), for (A) GSE26728, (B) GSE126297, (C) GSE43977, and (D) GSE44088 datasets. Dashed blue lines are used to designate p-value of 0.05, dashed red lines for p-value of 0.1. Only GSE26728 has differentially expressed genes with respect to both adjusted and non-adjusted p-values. Other datasets have differentially expressed genes with respect to non-adjusted p-values only.
Ijms 22 10785 g001
Figure 2. Feature frequencies, obtained by 100 runs of iterative feature selection procedure, for (A) simple scaled dataset, (B) dataset without correlated genes and, (C) dataset without co-expressed genes. There are 4 features for the simple scaled dataset, 6 features for the dataset without correlated genes, and 7 features for dataset without co-expressed genes, which have noticeably higher frequencies than other features.
Ijms 22 10785 g002
Figure 3. Biological pathways for the top 30 genes (Names or proteins in red = top 30 genes). A subset of the genes recovered in our analysis relates to the regulation of cell survival, DNA repair, apoptosis, and cellular junctions. In fact, many of the pathways recovered, including Tnfr2, Hgf-Met, Agtr1a, Bdkrb2, signal through Mapk8 (also known as Jnk1) to regulate cell survival. One of these pathways, Hgf-Met, also functions to regulate another recovered gene, Mgmt, to allow for DNA repair. Two of the recovered genes, Tmbim6 and Bcl2L, inhibit Bax in order to prevent apoptosis, while one gene, Apaf1, is necessary for forming apoptosomes to induce apoptosis. Cellular junctions are also centrally important for cell survival, and four of the genes recovered, F11r, Cldnd1, Ctnd1, and Yes1, function for maintain cellular junctions.
Ijms 22 10785 g003
Figure 4. (A) Sample tree for combined dataset of GSE26728, GSE126297, GSE43977, GSE44088. Scale independence (B) and Mean connectivity (C) for combined dataset of GSE26728, GSE126297, GSE43977, GSE44088. Soft threshold is the lowest power for which the scale-free topology fit index curve flattens out upon reaching a high value. (D) Genes heatmap for combined dataset of GSE26728, GSE126297, GSE43977, GSE44088.
Ijms 22 10785 g004
Figure 5. The algorithm of the cross-validation-based greedy selection procedure. The algorithm takes as inputs the following parameters: dataset X (gene features of each of three datasets, simple scaled, without correlated genes, and without co-expressed), BinaryClassifier (a function of binary classification), AccuracyDelta (the minimum significant difference in the accuracy score), and MaxDecreaseCounter (the maximum number of steps to evaluate in case of accuracy decrease). The iterative feature selection procedure returns a subset of selected features.
Ijms 22 10785 g005
Table 1. Test/train cross-validation accuracy for ensemble models. Random Forest and SVM ensemble models were applied to simple scaled (simple_scaled), without correlated genes (without_correlated), and without co-expressed genes (without_coexpressed) datasets. Both Random Forest and SVM ensemble models failed to generalize on each of the datasets.
ModelSimple_ScaledWithout_CorrelatedWithout_CoexPressed
Random Forest0.54/1.00.53/1.00.54/0.94
SVM ensemble0.52/1.00.53/1.00.54/1.0
Table 2. Test/train cross-validation accuracies of SVM model, trained on all genes and genes selected by the iterative feature selection procedure with Naïve Bayesian classifier or Logistic Regression classifier. SVM model was applied to simple scaled (simple_scaled), without correlated genes (without_correlated), and without co-expressed genes (without_coexpressed) datasets. In contrast to all genes as a feature set, genes selected by the iterative procedure show predictive ability.
Simple_ScaledWithout_CorrelatedWithout_CoexPressed
All genes0.54/1.00.55/1.00.54/1.0
Top genes from Naive Bayesian classifier-0.82/0.90.74/0.84
Top genes from Logistic Regression 0.6/0.73--
Table 3. Test/train cross-validation ROC AUC scores of SVM model, trained on all genes and genes selected by the iterative feature selection procedure with Naïve Bayesian classifier or Logistic Regression classifier. SVM model was applied to simple scaled (simple_scaled), without correlated genes (without_correlated), and without co-expressed genes (without_coexpressed) datasets. In contrast to all genes as a feature set, genes selected by the iterative procedure show predictive ability.
Simple_ScaledWithout_CorrelatedWithout_CoexPressed
All genes0.62/1.00.60/1.00.62/1.0
Top genes from Naive Bayesian classifier-0.93/0.970.85/0.93
Top genes from Logistic Regression0.72/0.83--
Table 4. The most frequent genes within 100 runs of the iterative feature selection procedure on the simple scaled dataset.
Entrez IDGene SymbolGene NameFrequency/100
654810Appbp2osAmyloid beta precursor protein (cytoplasmic tail) binding protein 2, opposite strand33
110213Tmbim6Transmembrane BAX inhibitor motif containing 621
22121Rpl13aRibosomal protein L13A19
11603AgrnAgrin17
Table 5. The most frequent genes within 100 runs of the iterative feature selection procedure on the dataset without correlated genes.
Entrez IDGene SymbolGene NameFrequency/100
12984Csf2rb2Colony stimulating factor 2 receptor, beta 2, low-affinity (granulocyte-macrophage)50
19367Rad9aRAD9 checkpoint clamp component A47
230085Phf24PHD finger protein 2446
15213Hey1Hairy/enhancer-of-split related with YRPW motif 142
72805Zfp839Zinc finger protein 83931
229279Hnrnpa3Heterogeneous nuclear ribonucleoprotein A328
Table 6. The most frequent genes within 100 runs of the iterative feature selection procedure on the dataset without co-expressed.
Entrez IDGene SymbolGene NameFrequency/100
12984Csf2rb2Colony stimulating factor 2 receptor, beta 2, low-affinity (granulocyte-macrophage)42
15213Hey1Hairy/enhancer-of-split related with YRPW motif 141
230085Phf24PHD finger protein 2434
19367Rad9aRAD9 checkpoint clamp component A31
72805Zfp839Zinc finger protein 83926
229279Hnrnpa3Heterogeneous nuclear ribonucleoprotein A325
12593CdylChromodomain protein, Y chromosome-like20
Table 7. Genes common among all important features from three datasets: simple scaled dataset, dataset without correlated genes and dataset without co-expressed genes.
Entrez IDGene SymbolGene NameGO TermsBiological Process
12984Csf2rb2colony stimulating factor 2 receptor, beta 2, low-affinity (granulocyte-macrophage)PC00197 1Transmembrane signal receptor
19367Rad9aRAD9 checkpoint clamp component AGO:0000076DNA replication checkpoint
18441P2ry1purinergic receptor P2Y, G-protein coupled 1GO:0071407 2cellular response to organic cyclic compound
320213Senp5SUMO/sentrin specific peptidase 5GO:0070646Protein modification by small protein removal
22612Yes1YES proto-oncogene 1, Src family tyrosine kinaseGO:0008283Cell population proliferation
268903Nrip1nuclear receptor interacting protein 1GO:0071392cellular response to estradiol stimulus
13642Efnb2ephrin B2GO:0007411Axon guidance
21372Tbl1xtransducin (beta)-like 1 X-linkedGO:0016575Histone deacetylation
56530Cnpy2canopy FGF signaling regulator 2GO:0010988 2Regulation of low-density lipoprotein particle clearance
13885Esdesterase D/formylglutathione hydrolaseGO:0016788Hydrolase activity, acting on ester bonds
13639Efna4ephrin A4GO:0007411Axon guidance
11607Agtr1aangiotensin II receptor, type 1aGO:0006954Inflammatory response
116837Rims1regulating synaptic membrane exocytosis 1GO:0046928Regulation of neurotransmitter secretion
654810Appbp2osamyloid beta precursor protein (cytoplasmic tail) binding protein 2, opposite strandGO:0008017Microtubule binding 2
213773Tbl3transducin (beta)-like 3GO:0000462Maturation of SSU-rRNA from tricistronic rRNA transcript
13170DbpD site albumin promoter binding proteinGO:0000977RNA polymerase II regulatory region sequence-specific DNA binding
140475Bsndbarttin CLCNK type accessory beta subunitGO:0006821Chloride transport
13046Celf1CUGBP, Elav-like family member 1GO:0000380Alternative mRNA splicing, via spliceosome
11656Alas2aminolevulinic acid synthase 2, erythroidPC00216 1Protoporphyrin-IX biosynthesis
12458Ccr6chemokine (C-C motif) receptor 6GO:0006954Inflammatory response
13211Dhx9DEAH (Asp-Glu-Ala-His) box polypeptide 9GO:0050684regulation of mRNA processing
18951Septin5septin 5GO:0061640cytoskeleton-dependent cytokinesis
66860Tanc1tetratricopeptide repeat, ankyrin repeat and coiled-coil containing 1GO:0097062 2Dendritic spine maintenance
75692Nr2c2apnuclear receptor 2C2-associated proteinGO:0006367 2Transcription initiation from RNA polymerase II promoter
1 PANTHER Protein Class 2 GO TERM Molecular Function.
Table 8. Annotation clusters with significantly enriched GO biological processes and pathways for the top 30 genes.
CategoryTermFDR 1Gene symbols
GOTERM_BPRegulation of apoptosis0.04Traf1, Hgf, Bdkrb2, Tmbim6, Apaf1, Rad9a, Mapk8, Agtr1a, Mgmt, Btg1
GOTERM_BPLipid localization0.08Nrip1, Atp9b, Gulp1, Osbpl11
GOTERM_BPNegative regulation of apoptosis0.11Hgf, Bdkrb2, Tmbim6, Mapk8, Agtr1a
GOTERM_BPProteolysis0.13Senp5, Hgf, Hectd1, Adam11, Psmb8, Apaf1, Bace1, C1qb, Ide
1 FDR—false discovery rate.
Publisher’s Note: MDPI stays neutral with regard to jurisdictional claims in published maps and institutional affiliations.

