An In Vitro Comparative Study of the Effects of Tetrabromobisphenol A and Tetrabromobisphenol S on Human Erythrocyte Membranes—Changes in ATP Level, Perturbations in Membrane Fluidity, Alterations in Conformational State and Damage to Proteins

 , , ,
, , ,
Abstract
:1. Introduction
2. Results
2.1. Membrane Fluidity
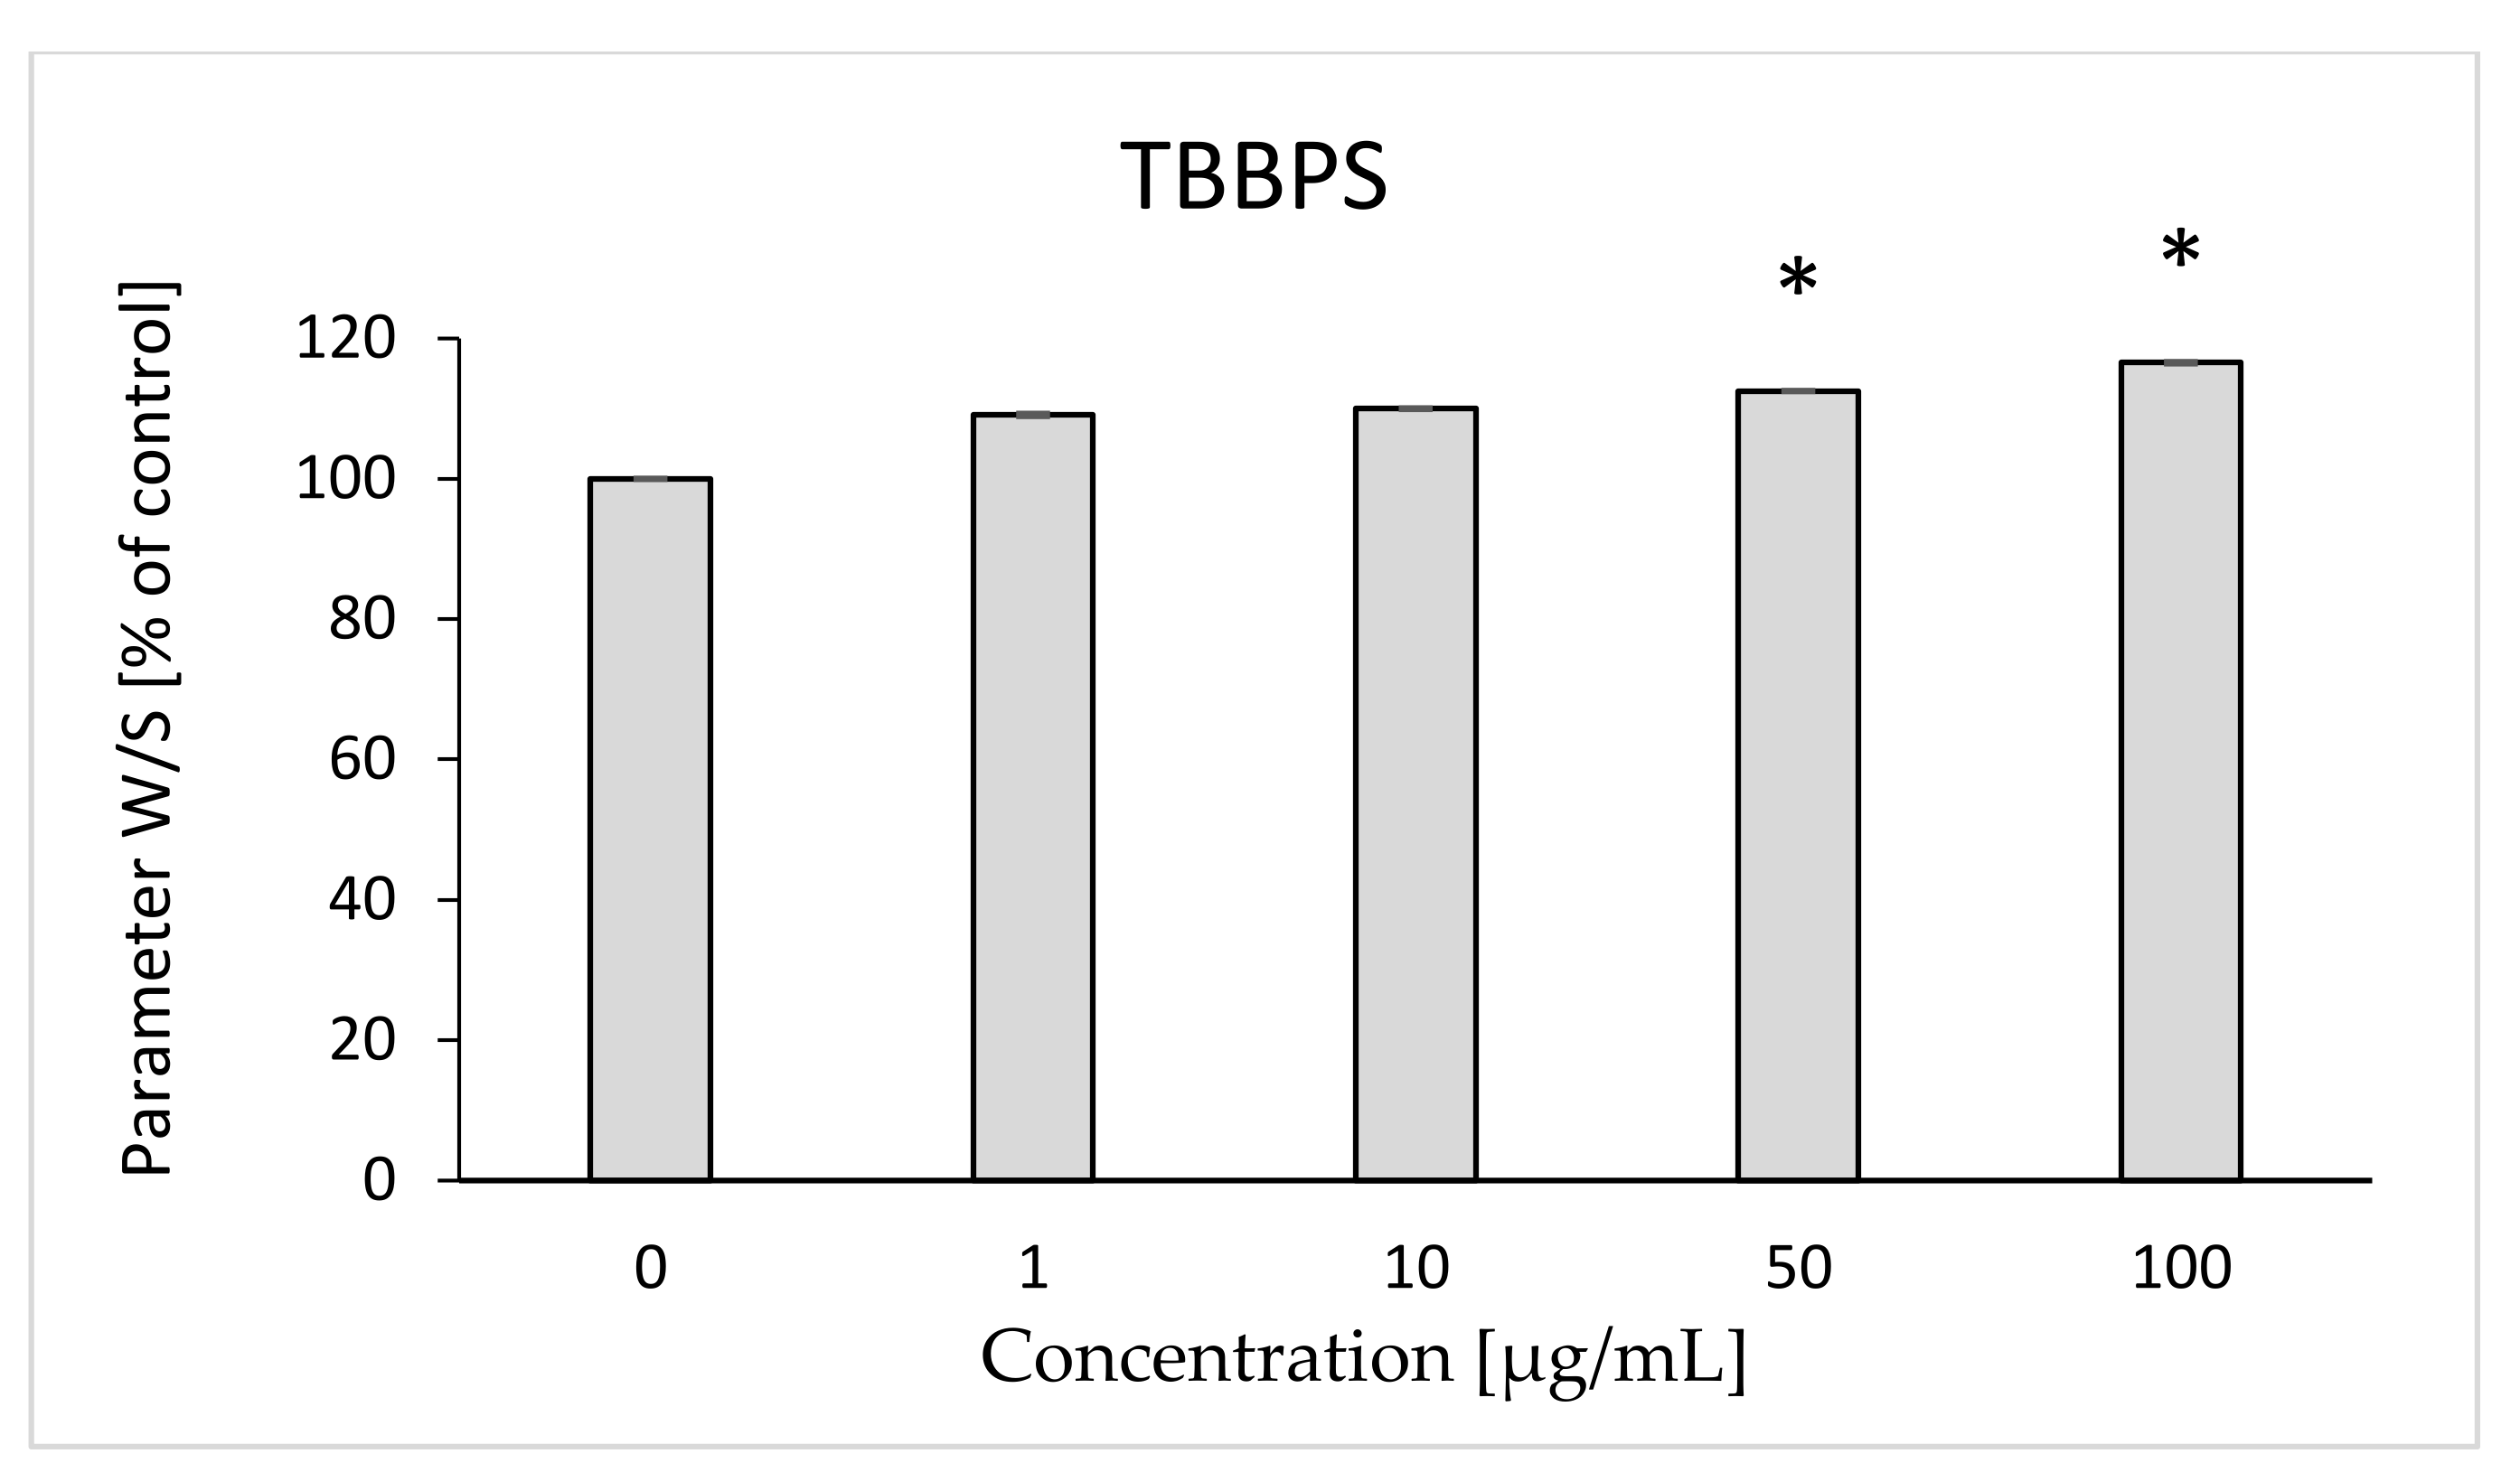
2.2. W/S Ratio
2.3. Internal Viscosity of Erythrocytes
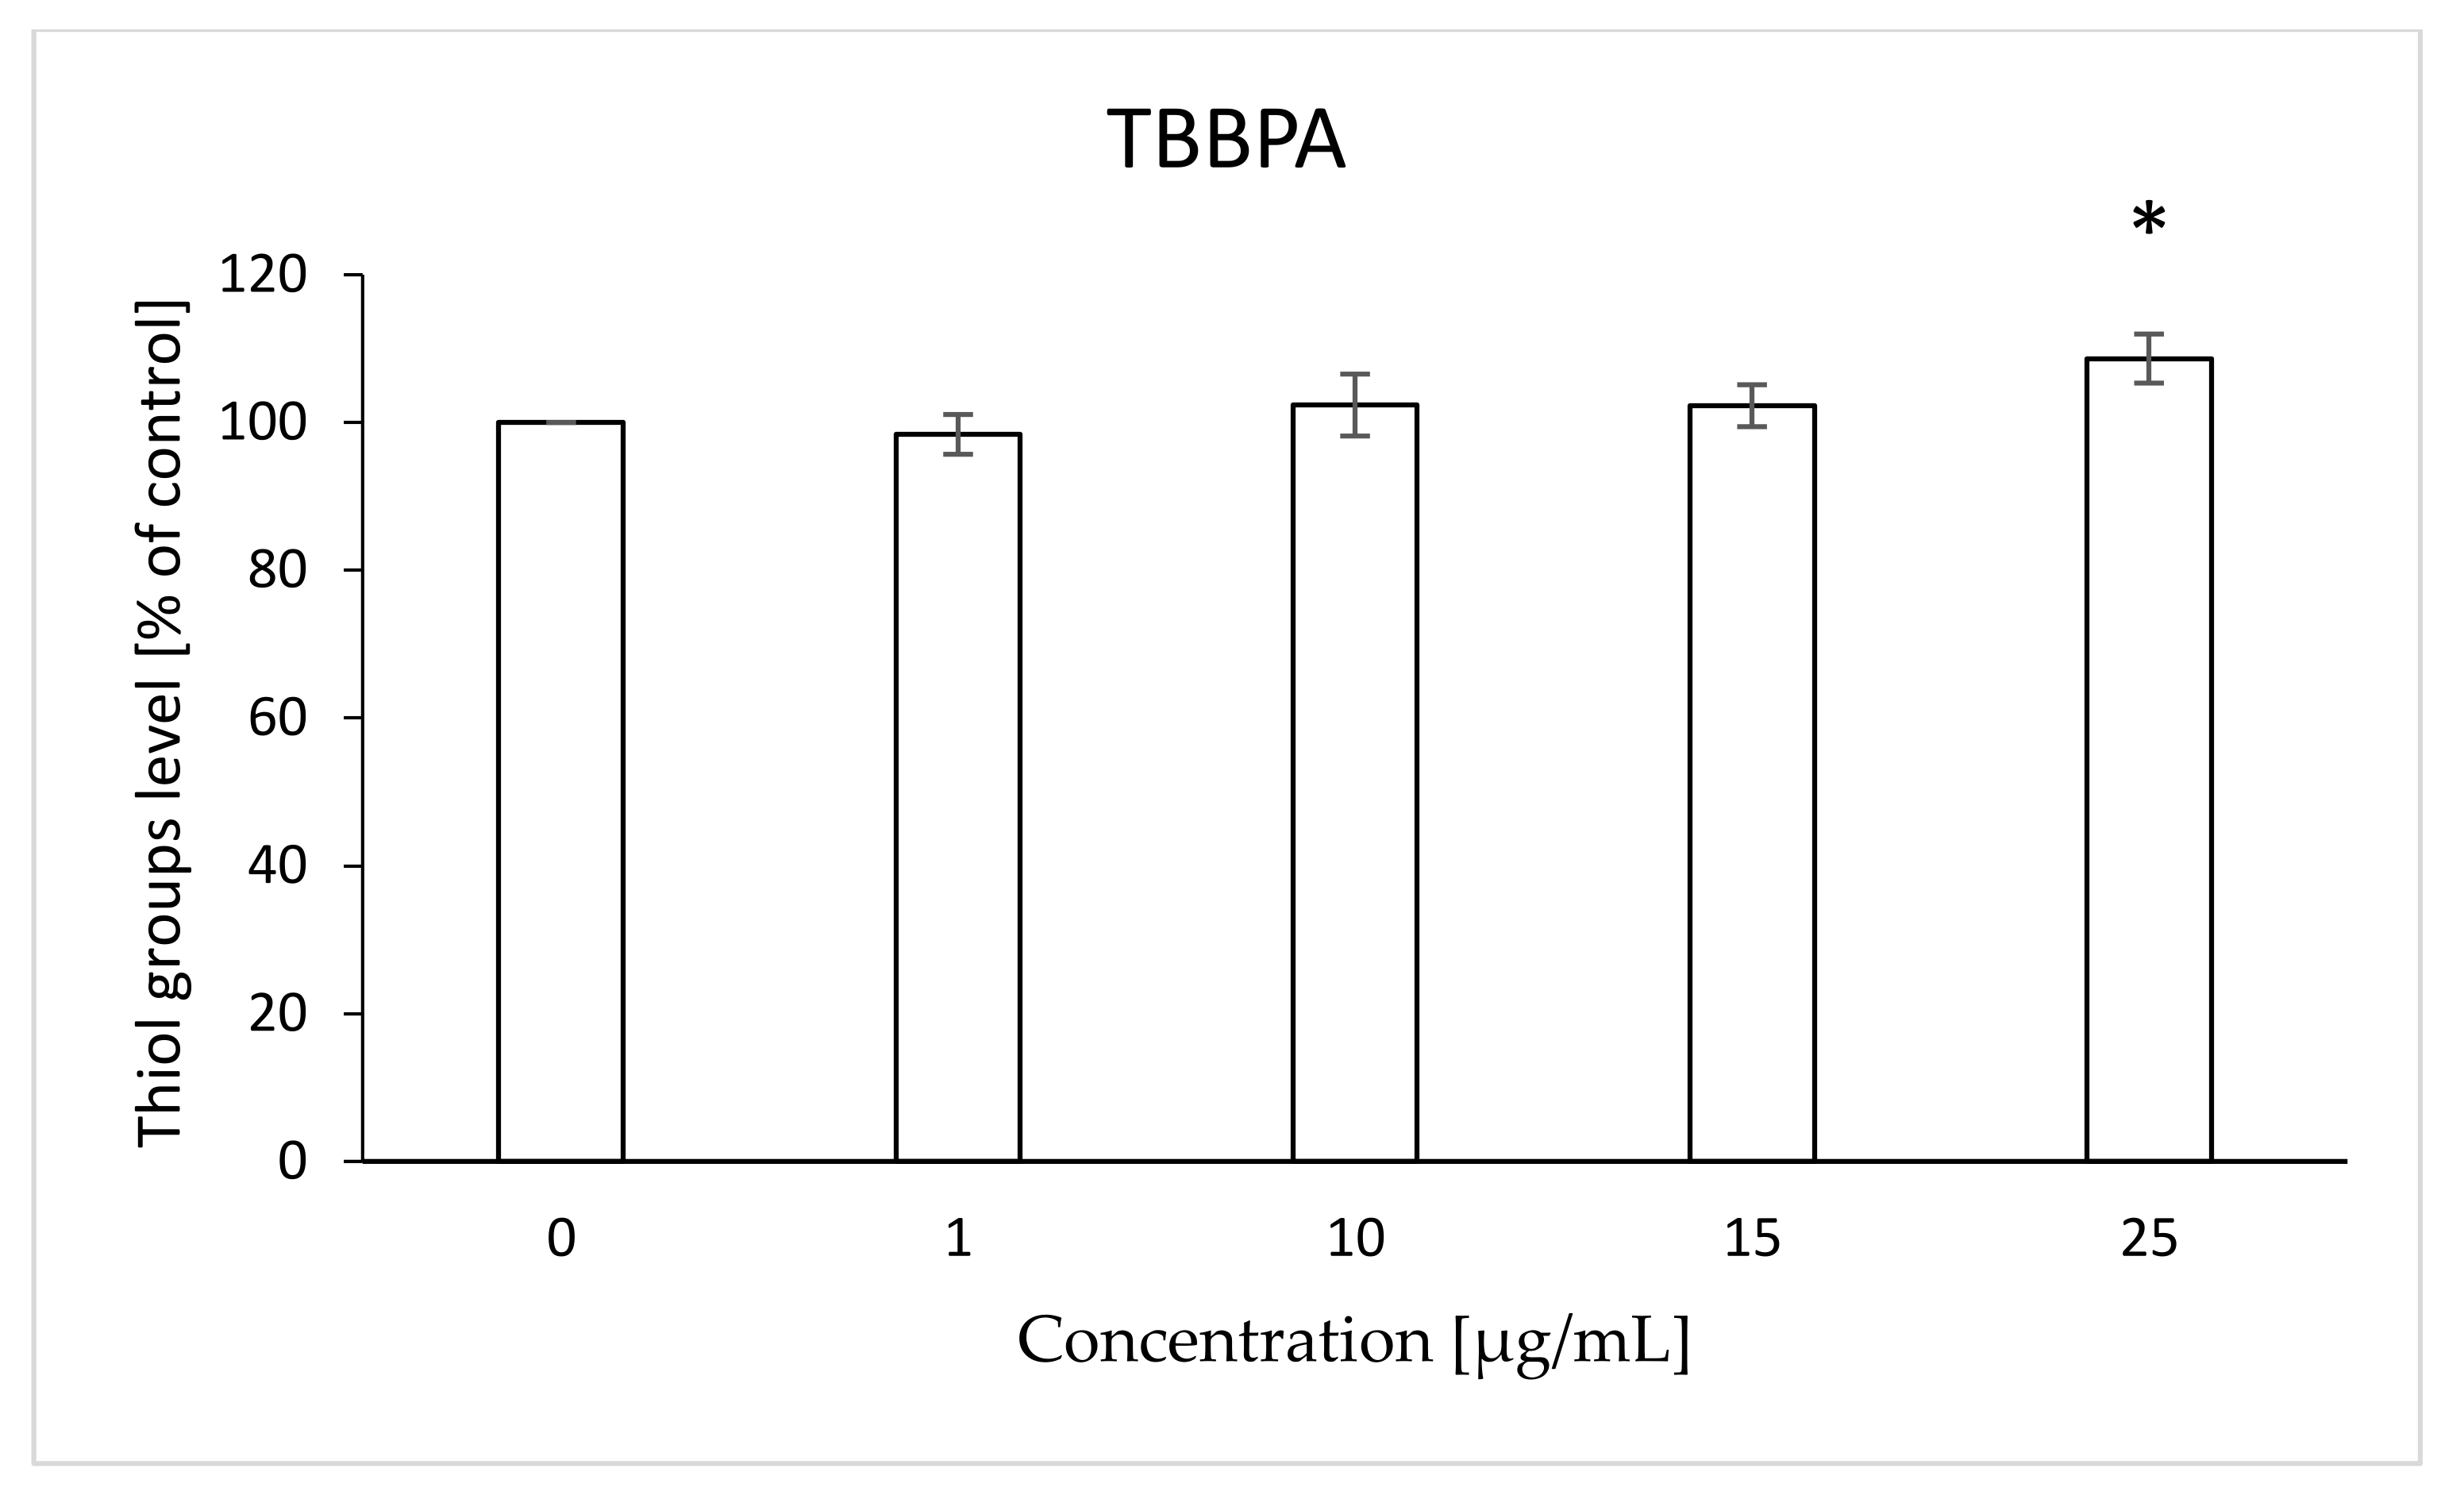
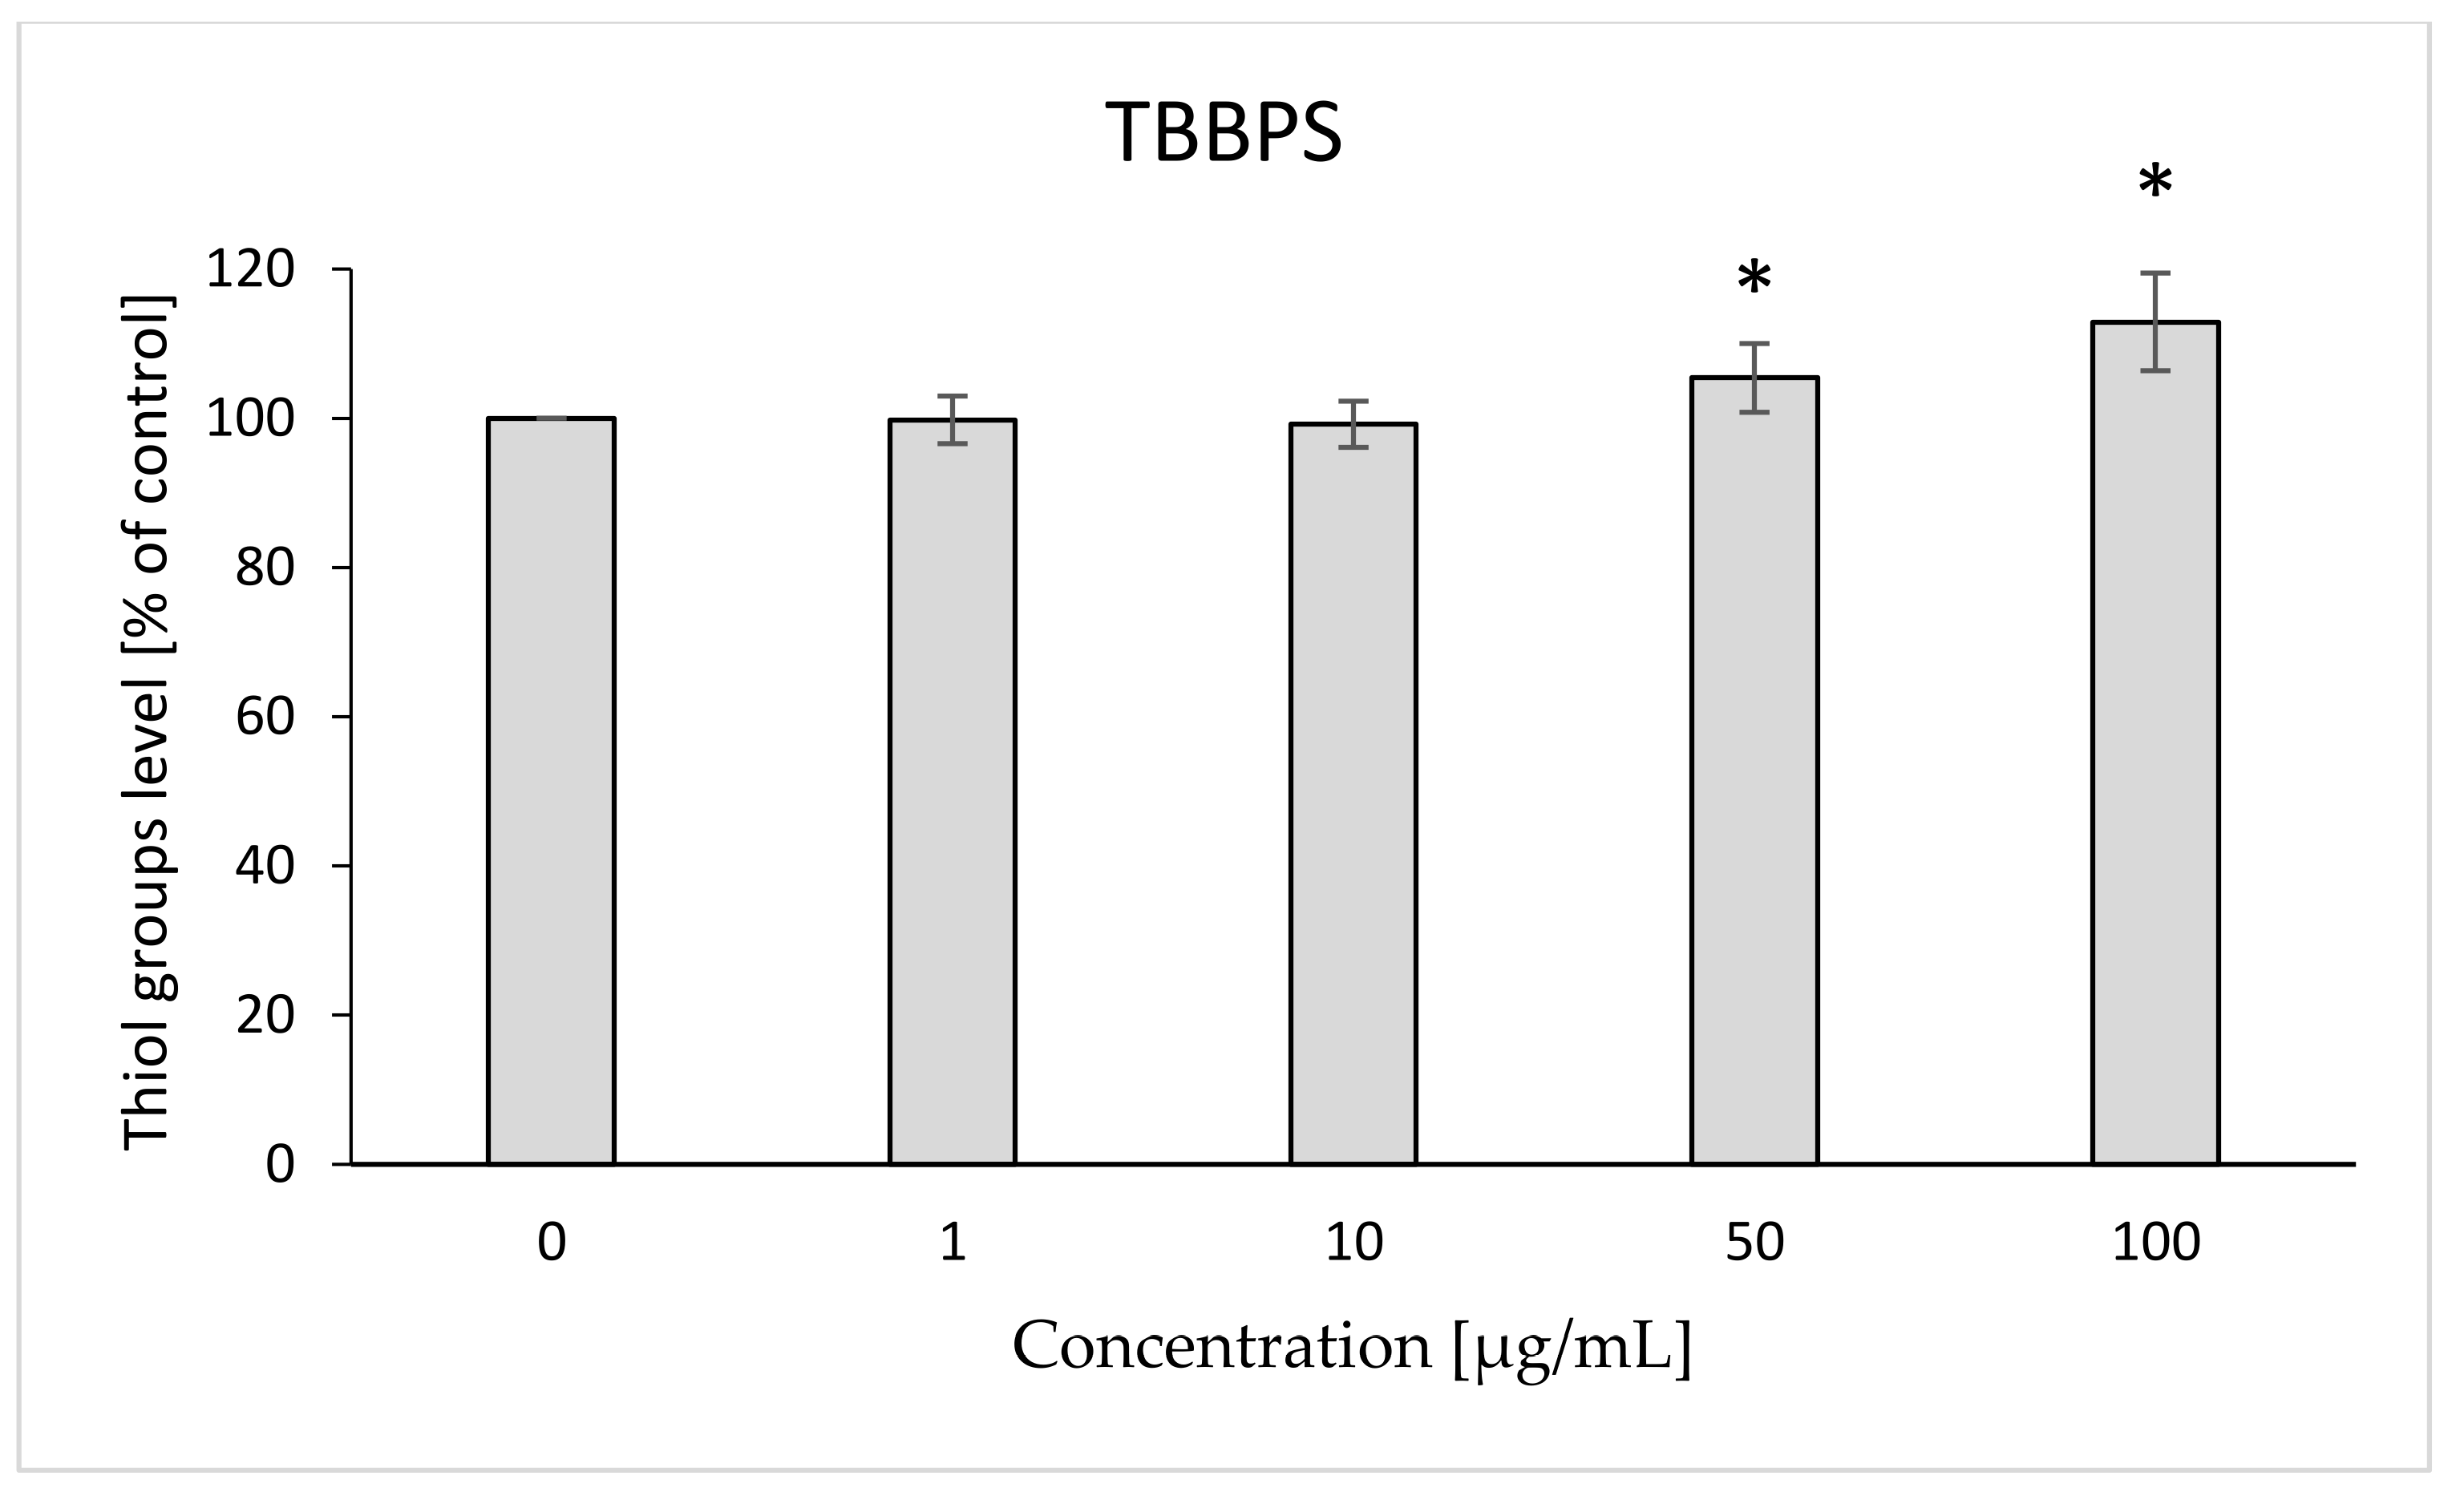
2.4. Thiol Groups
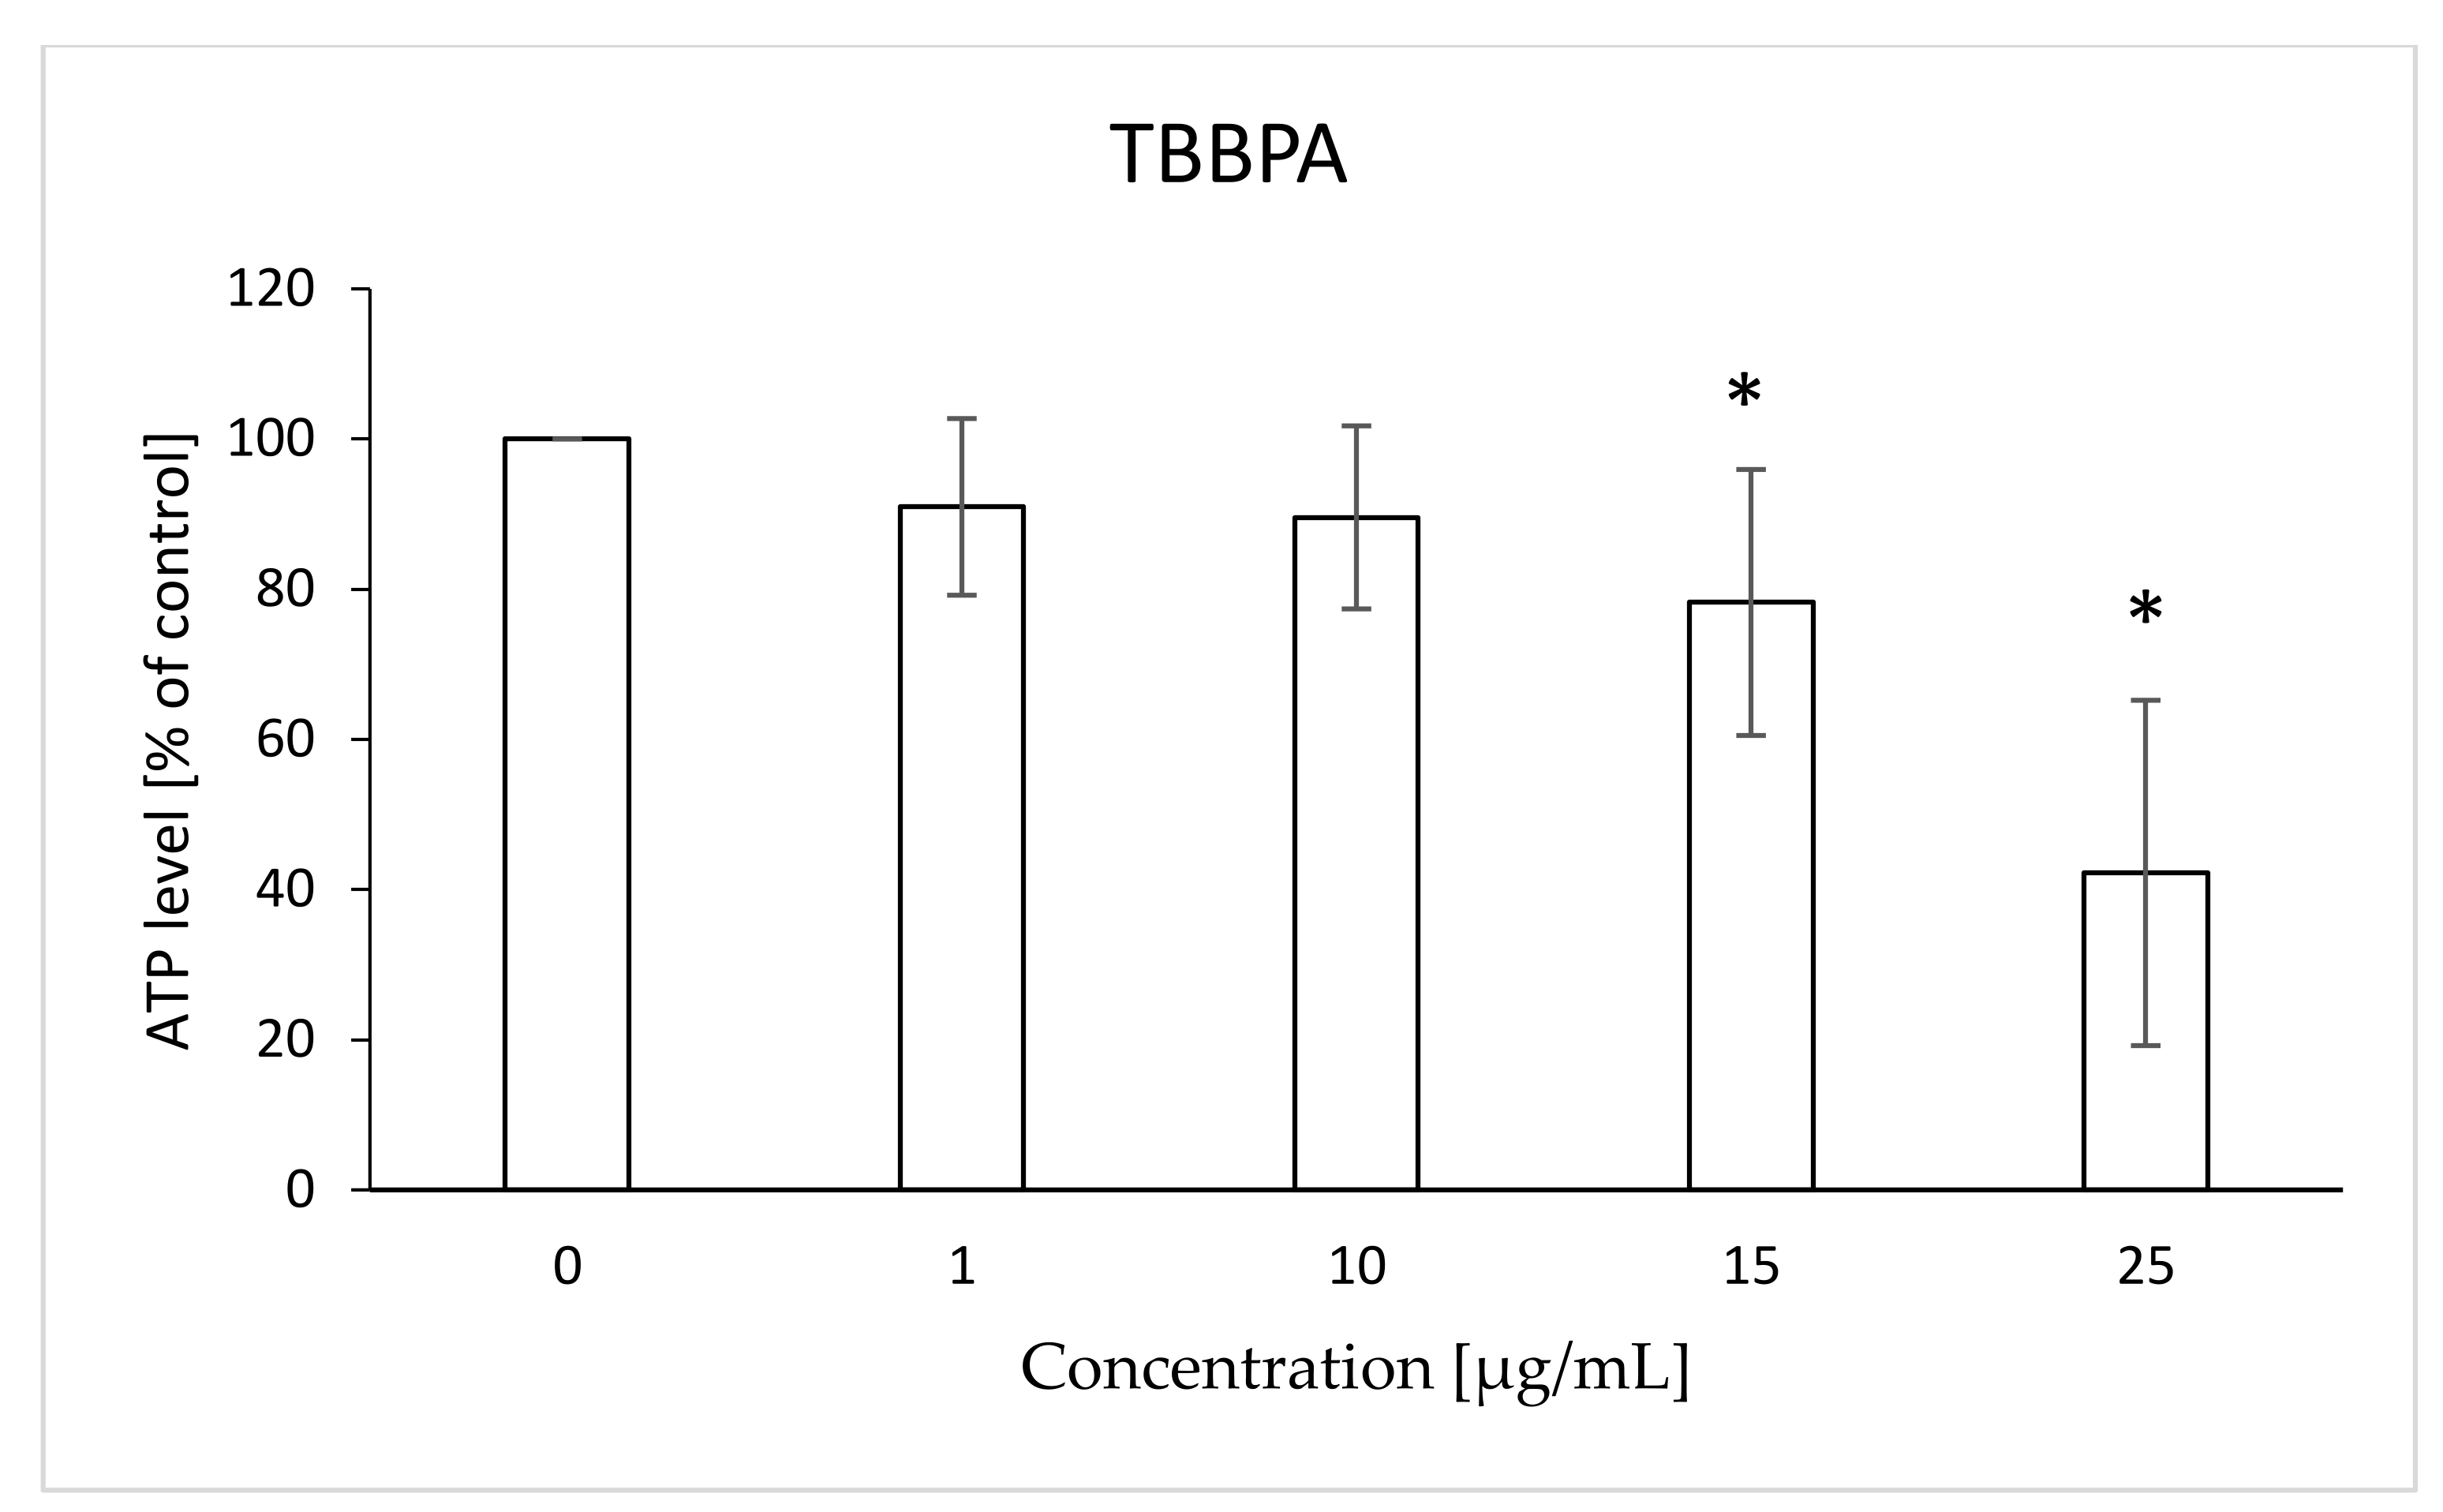
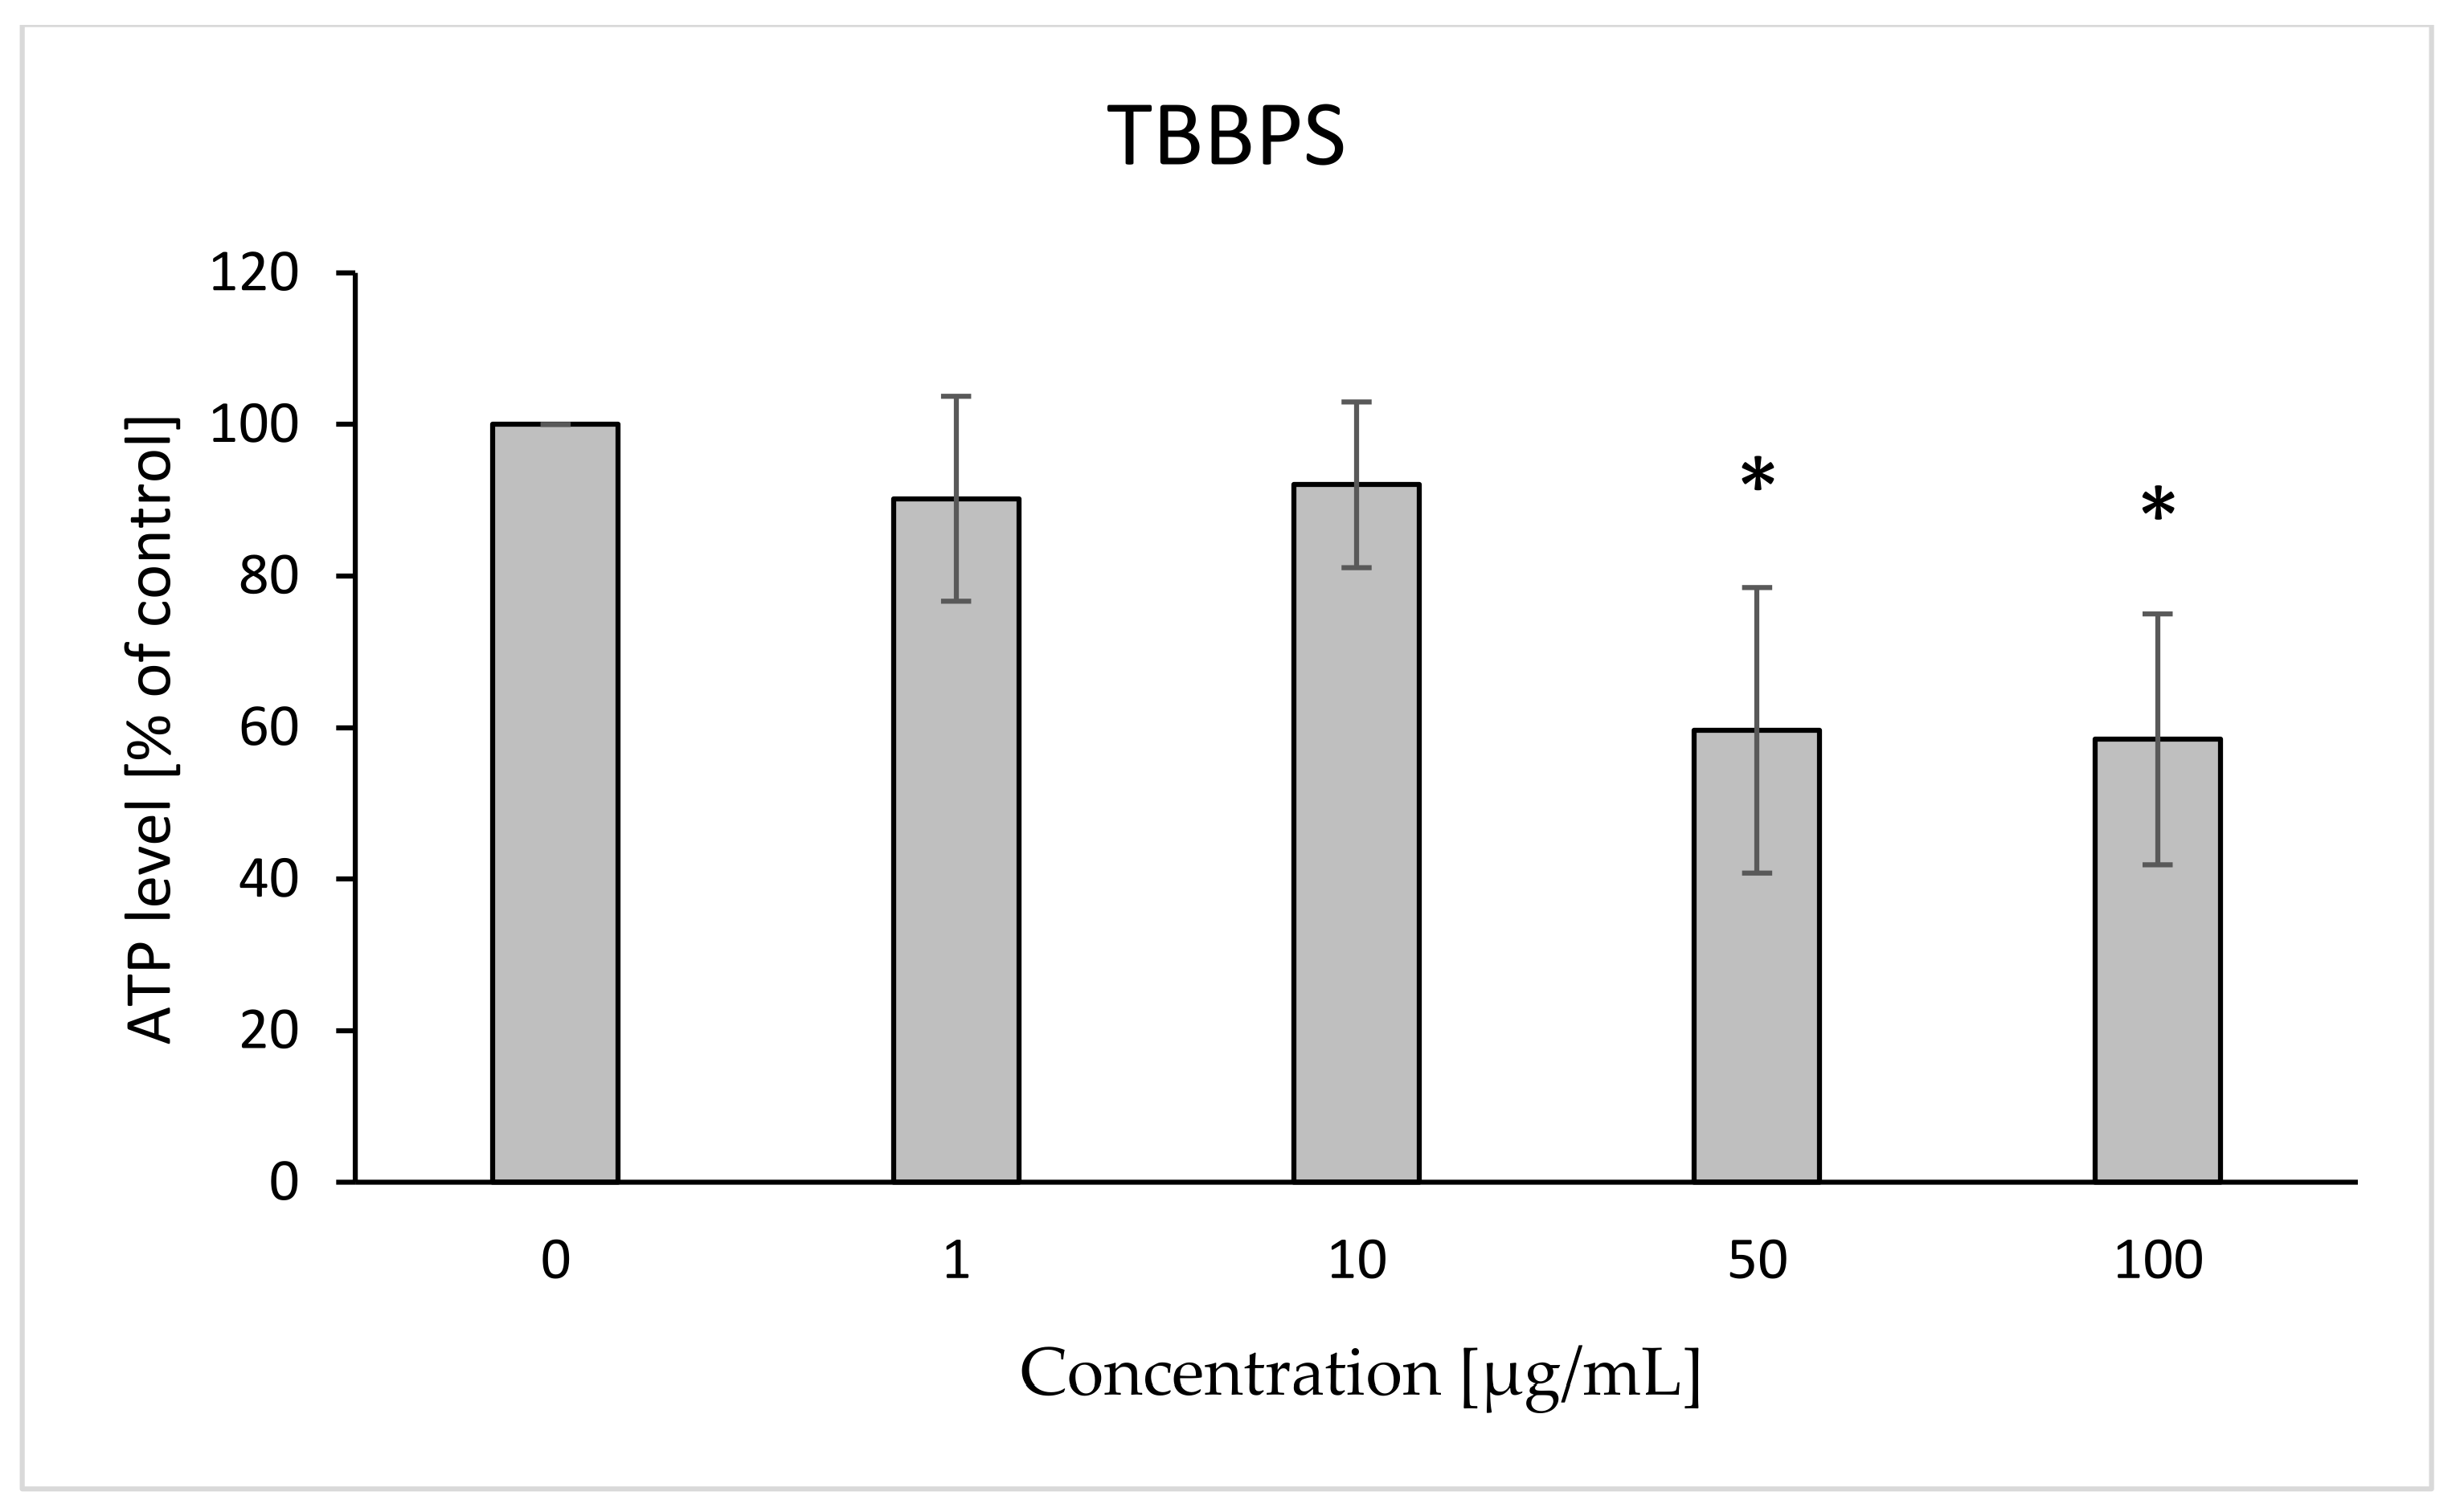
2.5. ATP Level
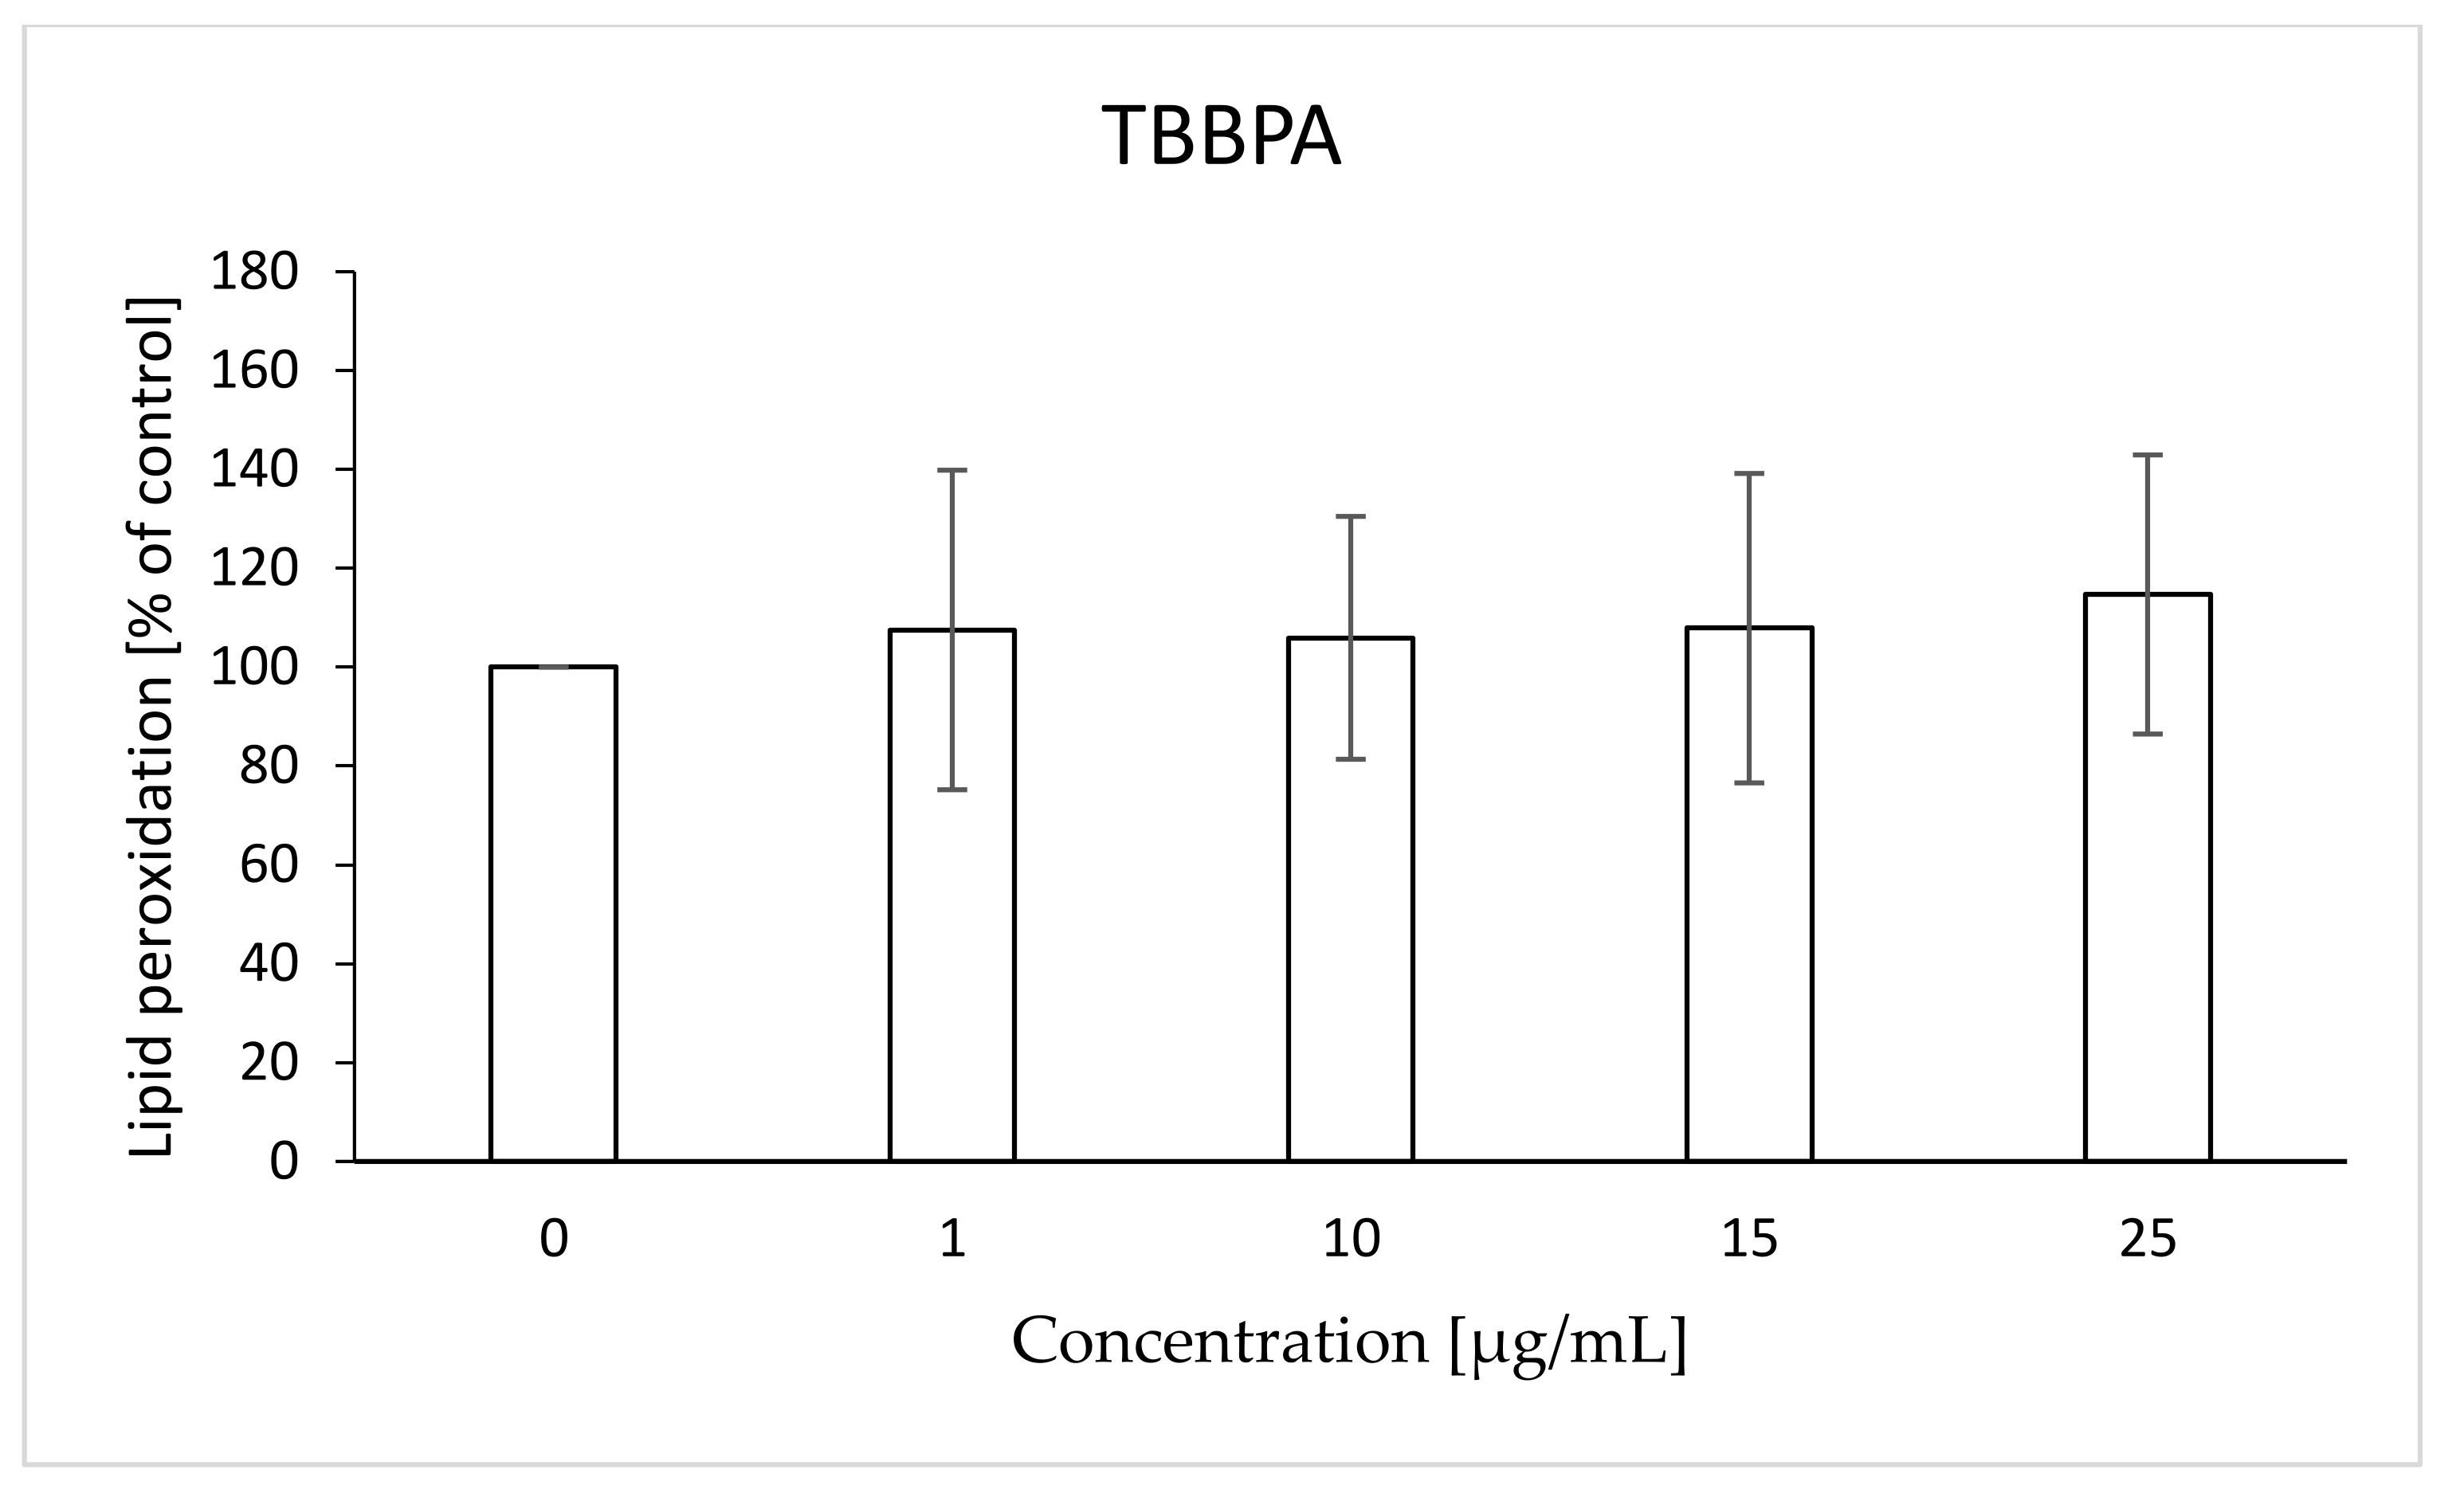
2.6. Lipid Peroxidation
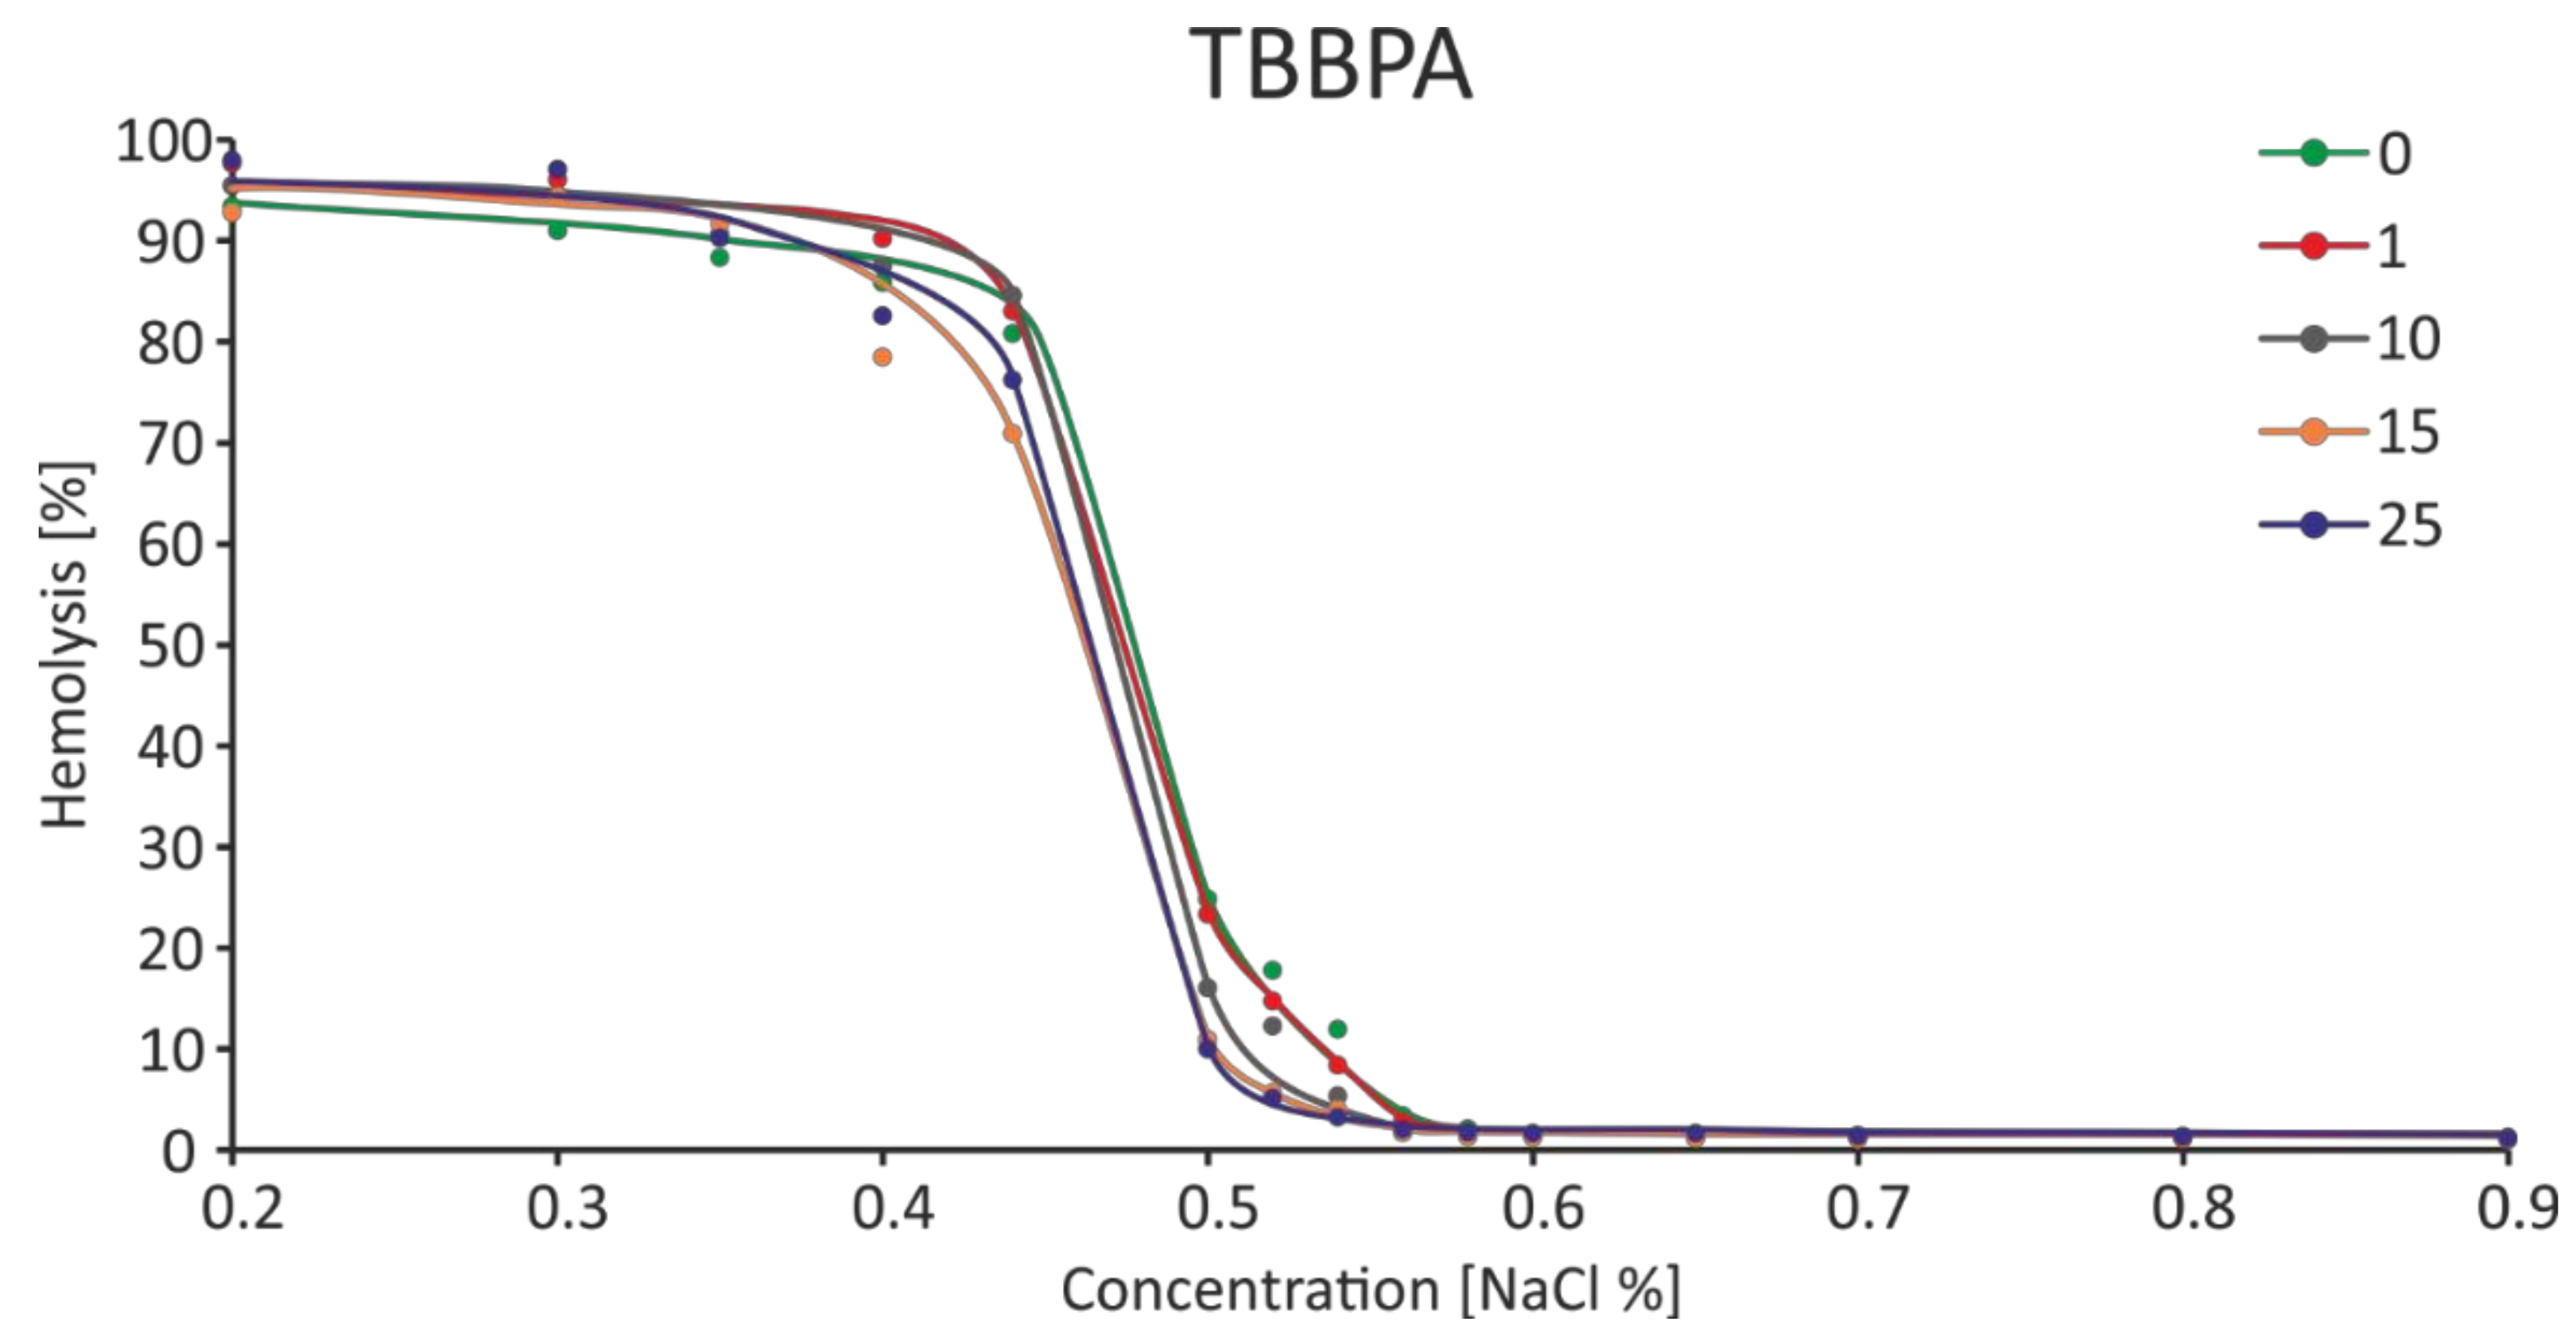
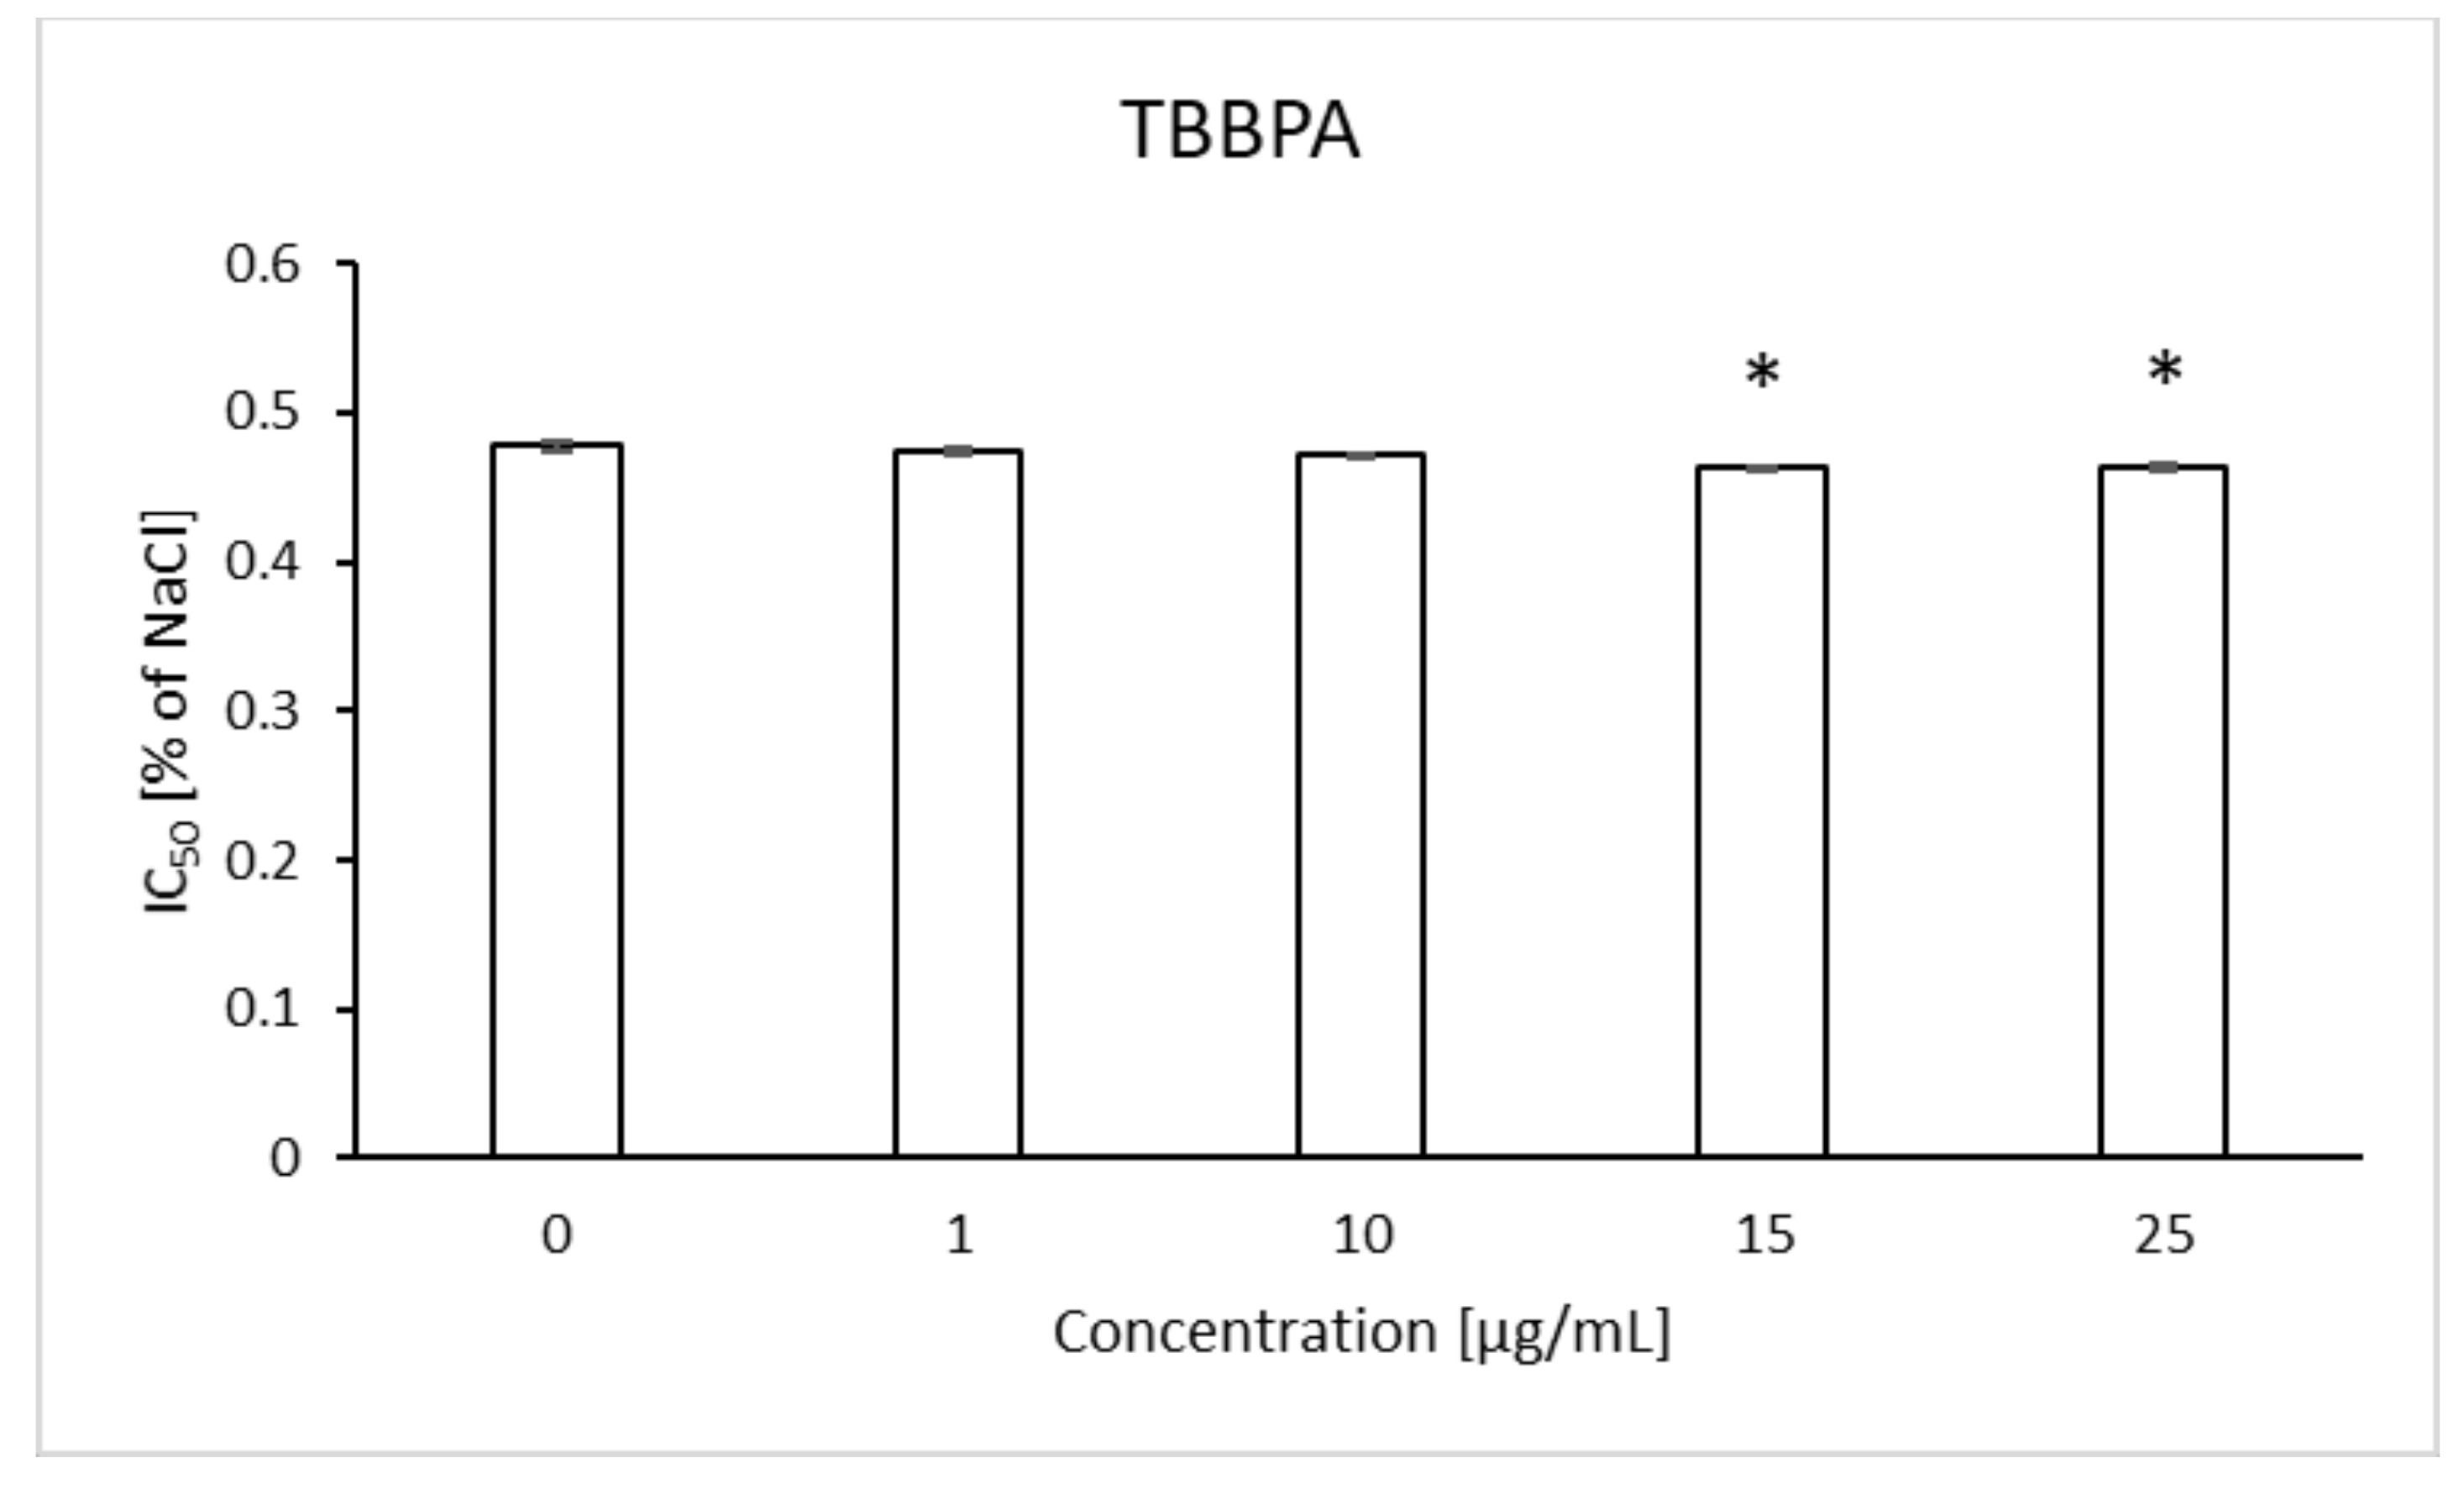
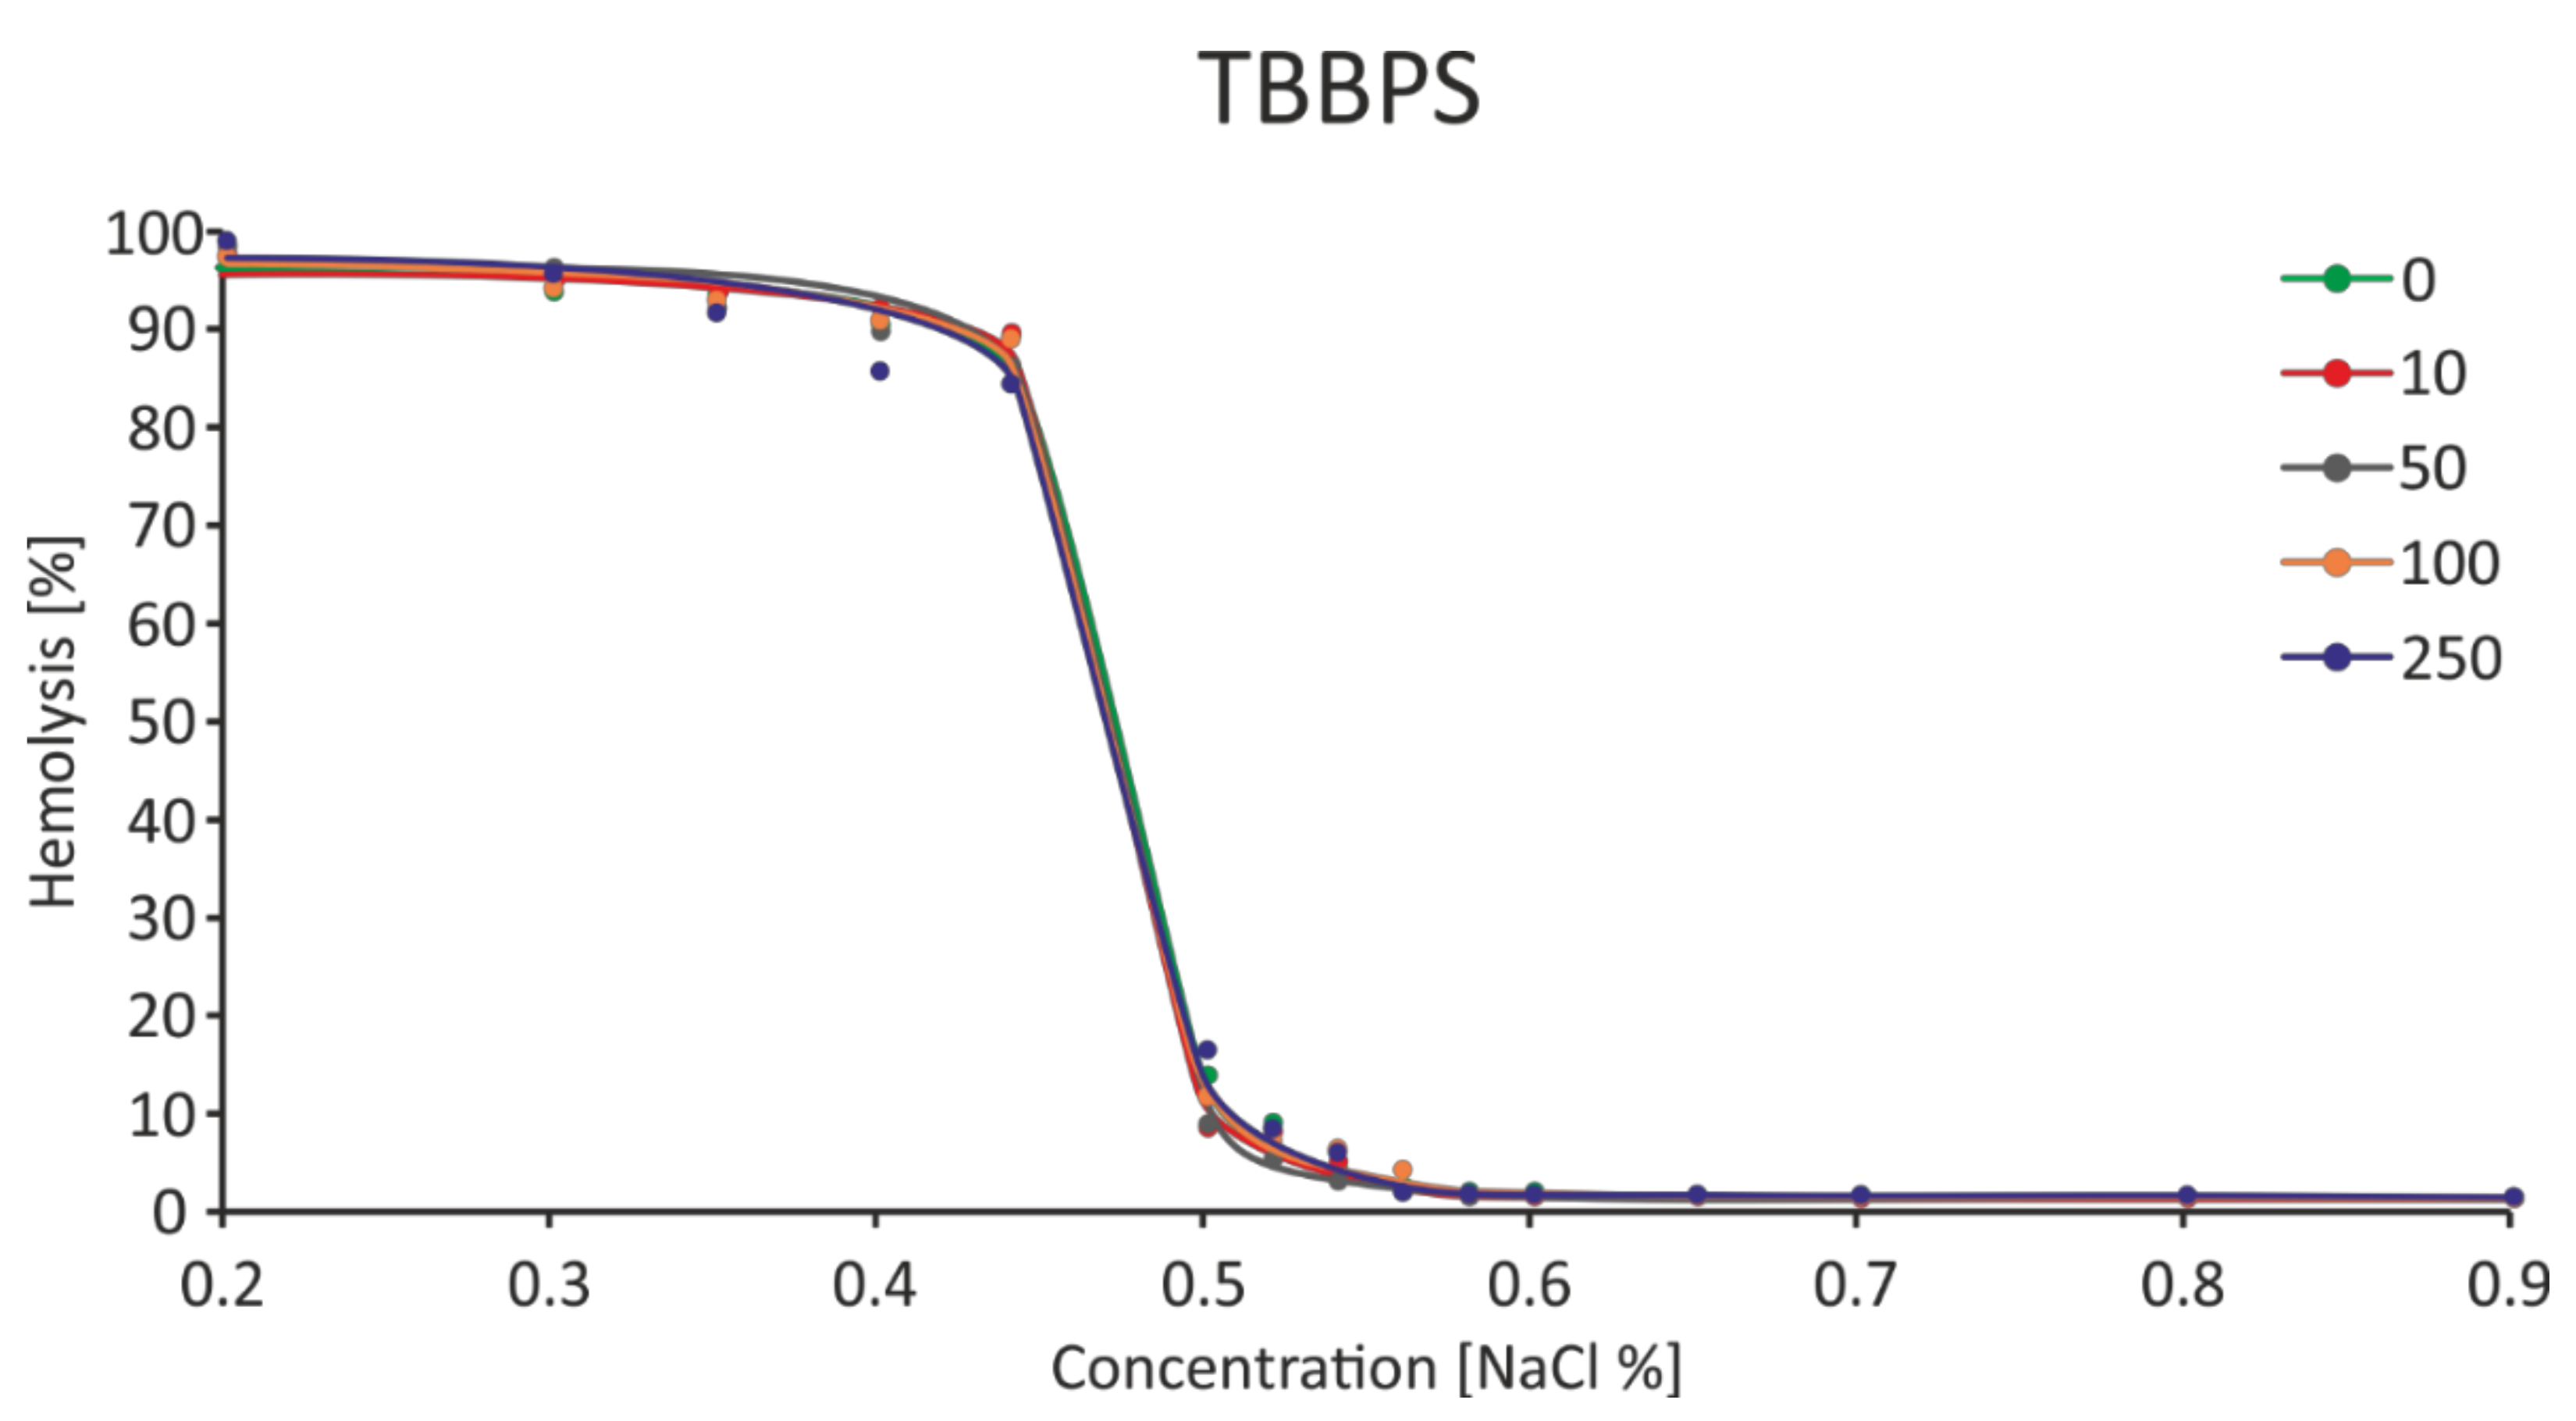
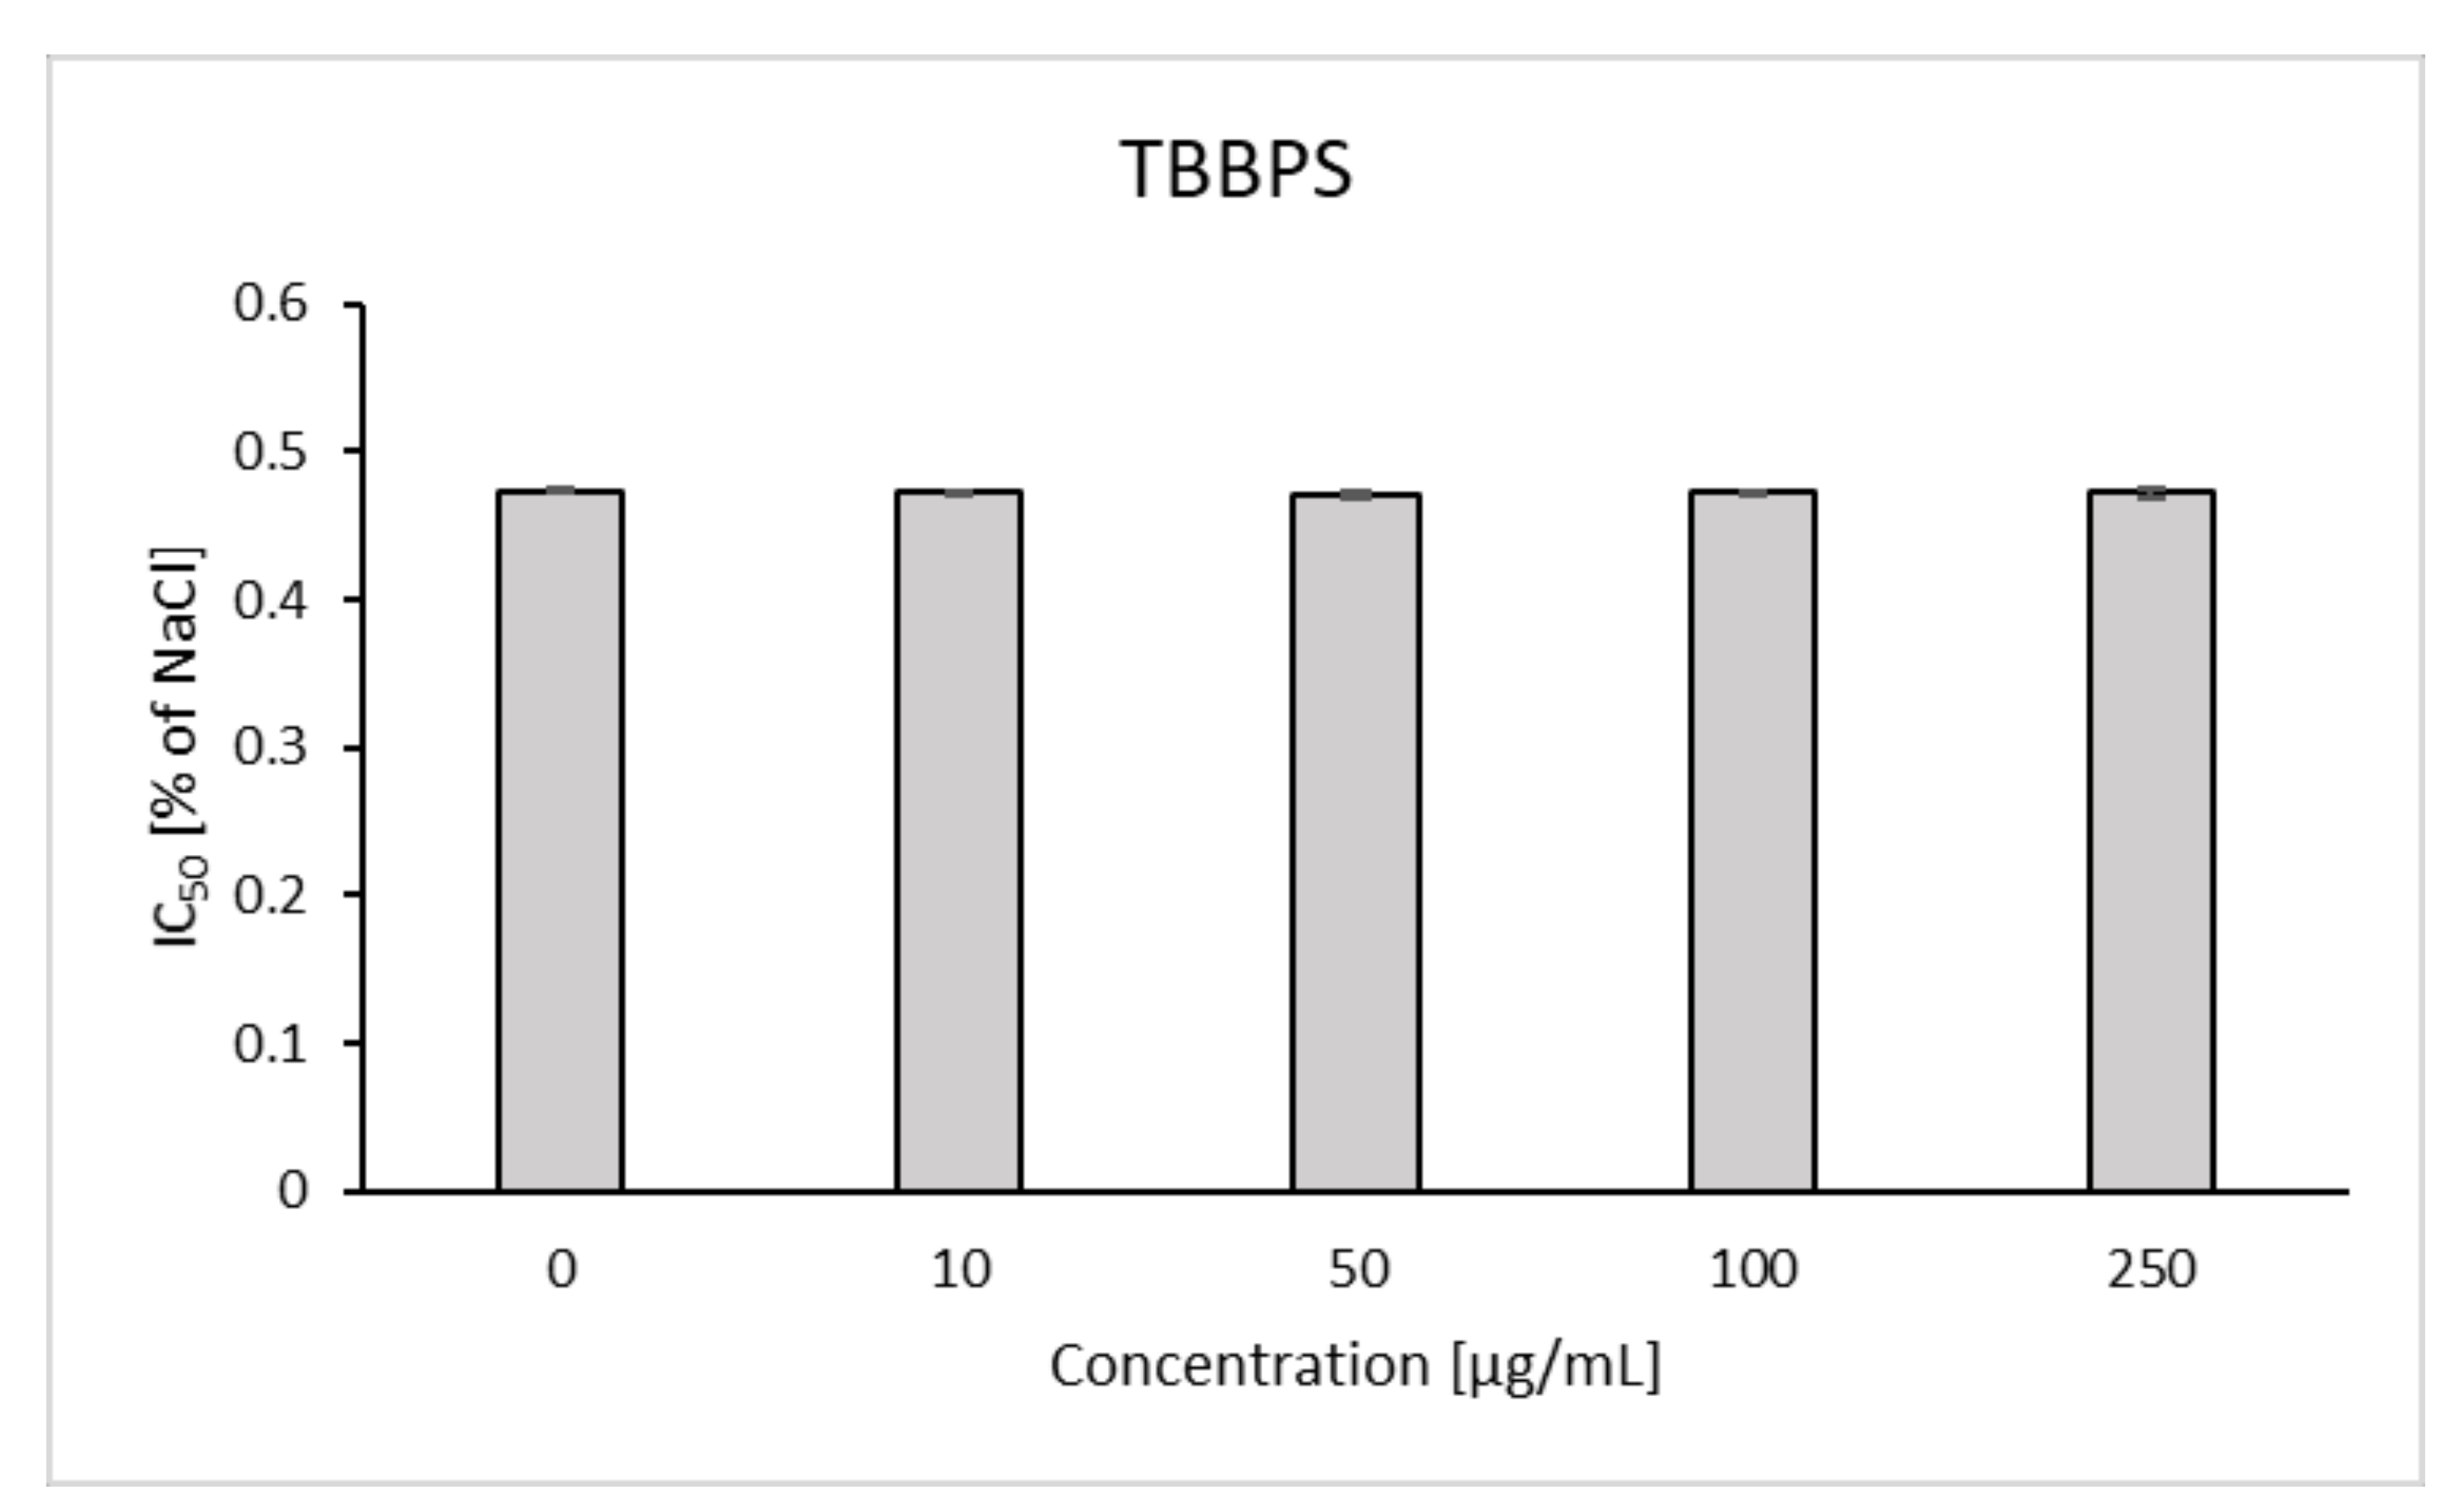
2.7. Osmotic Fragility
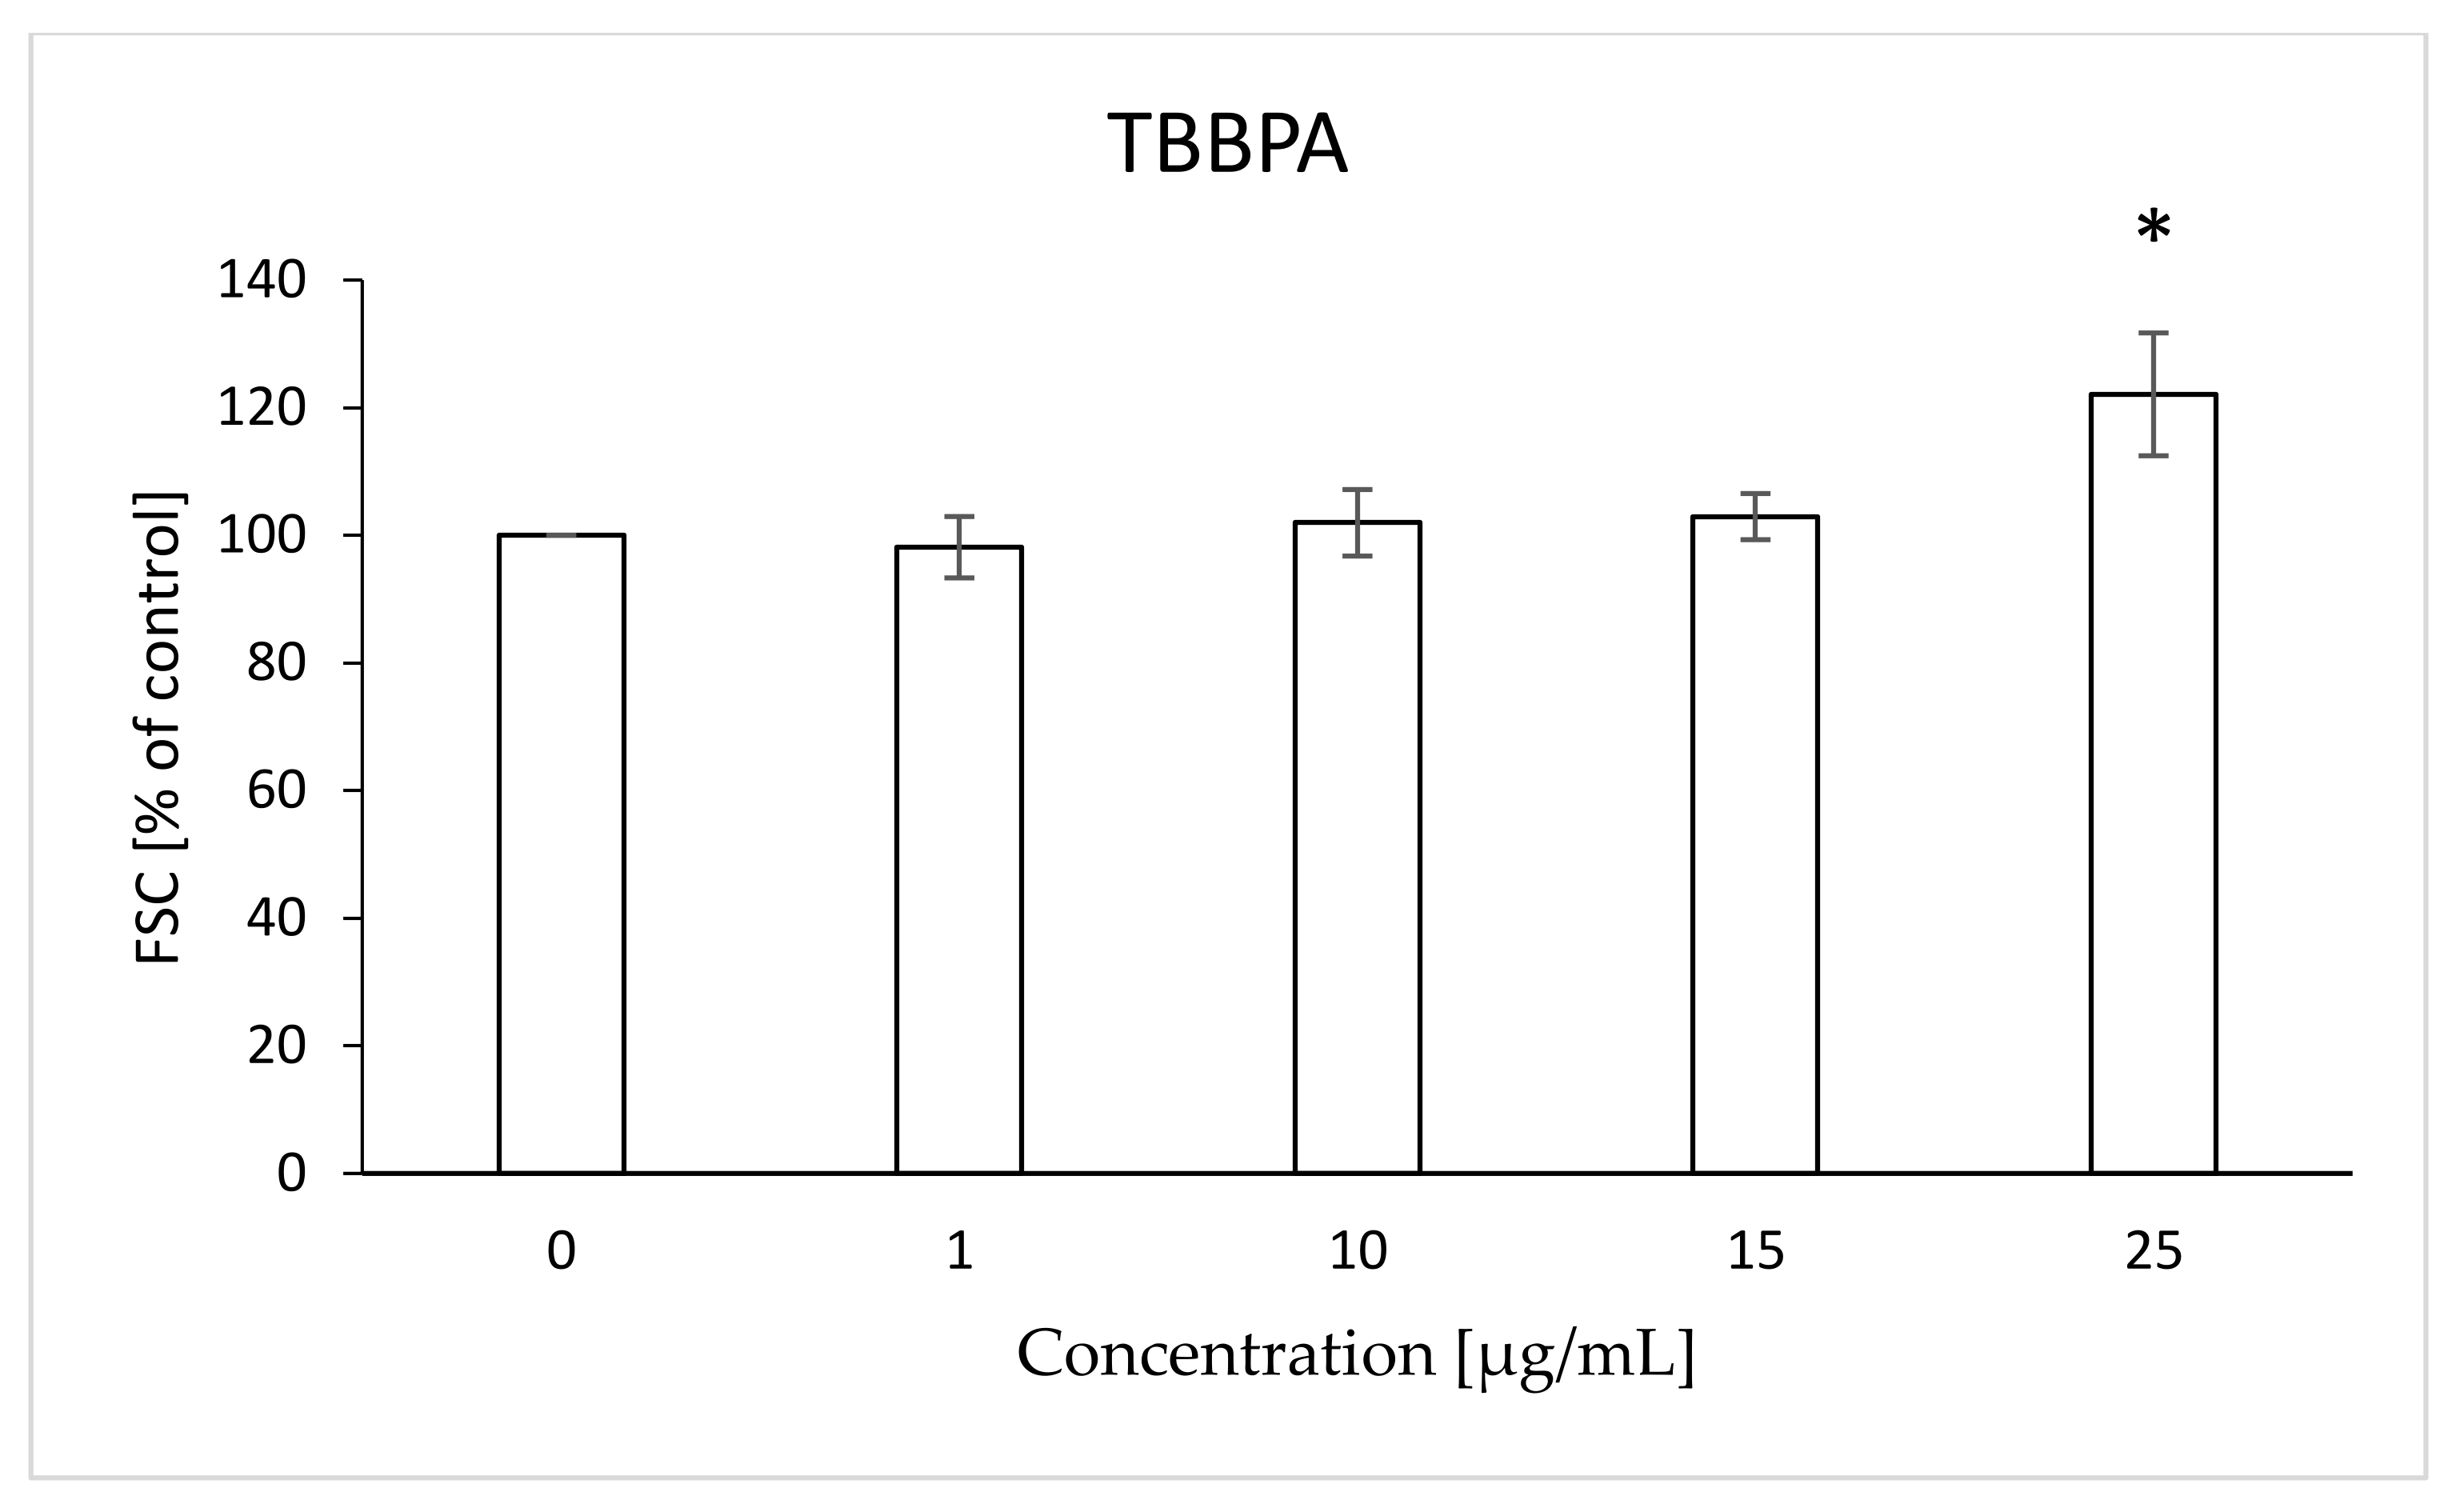
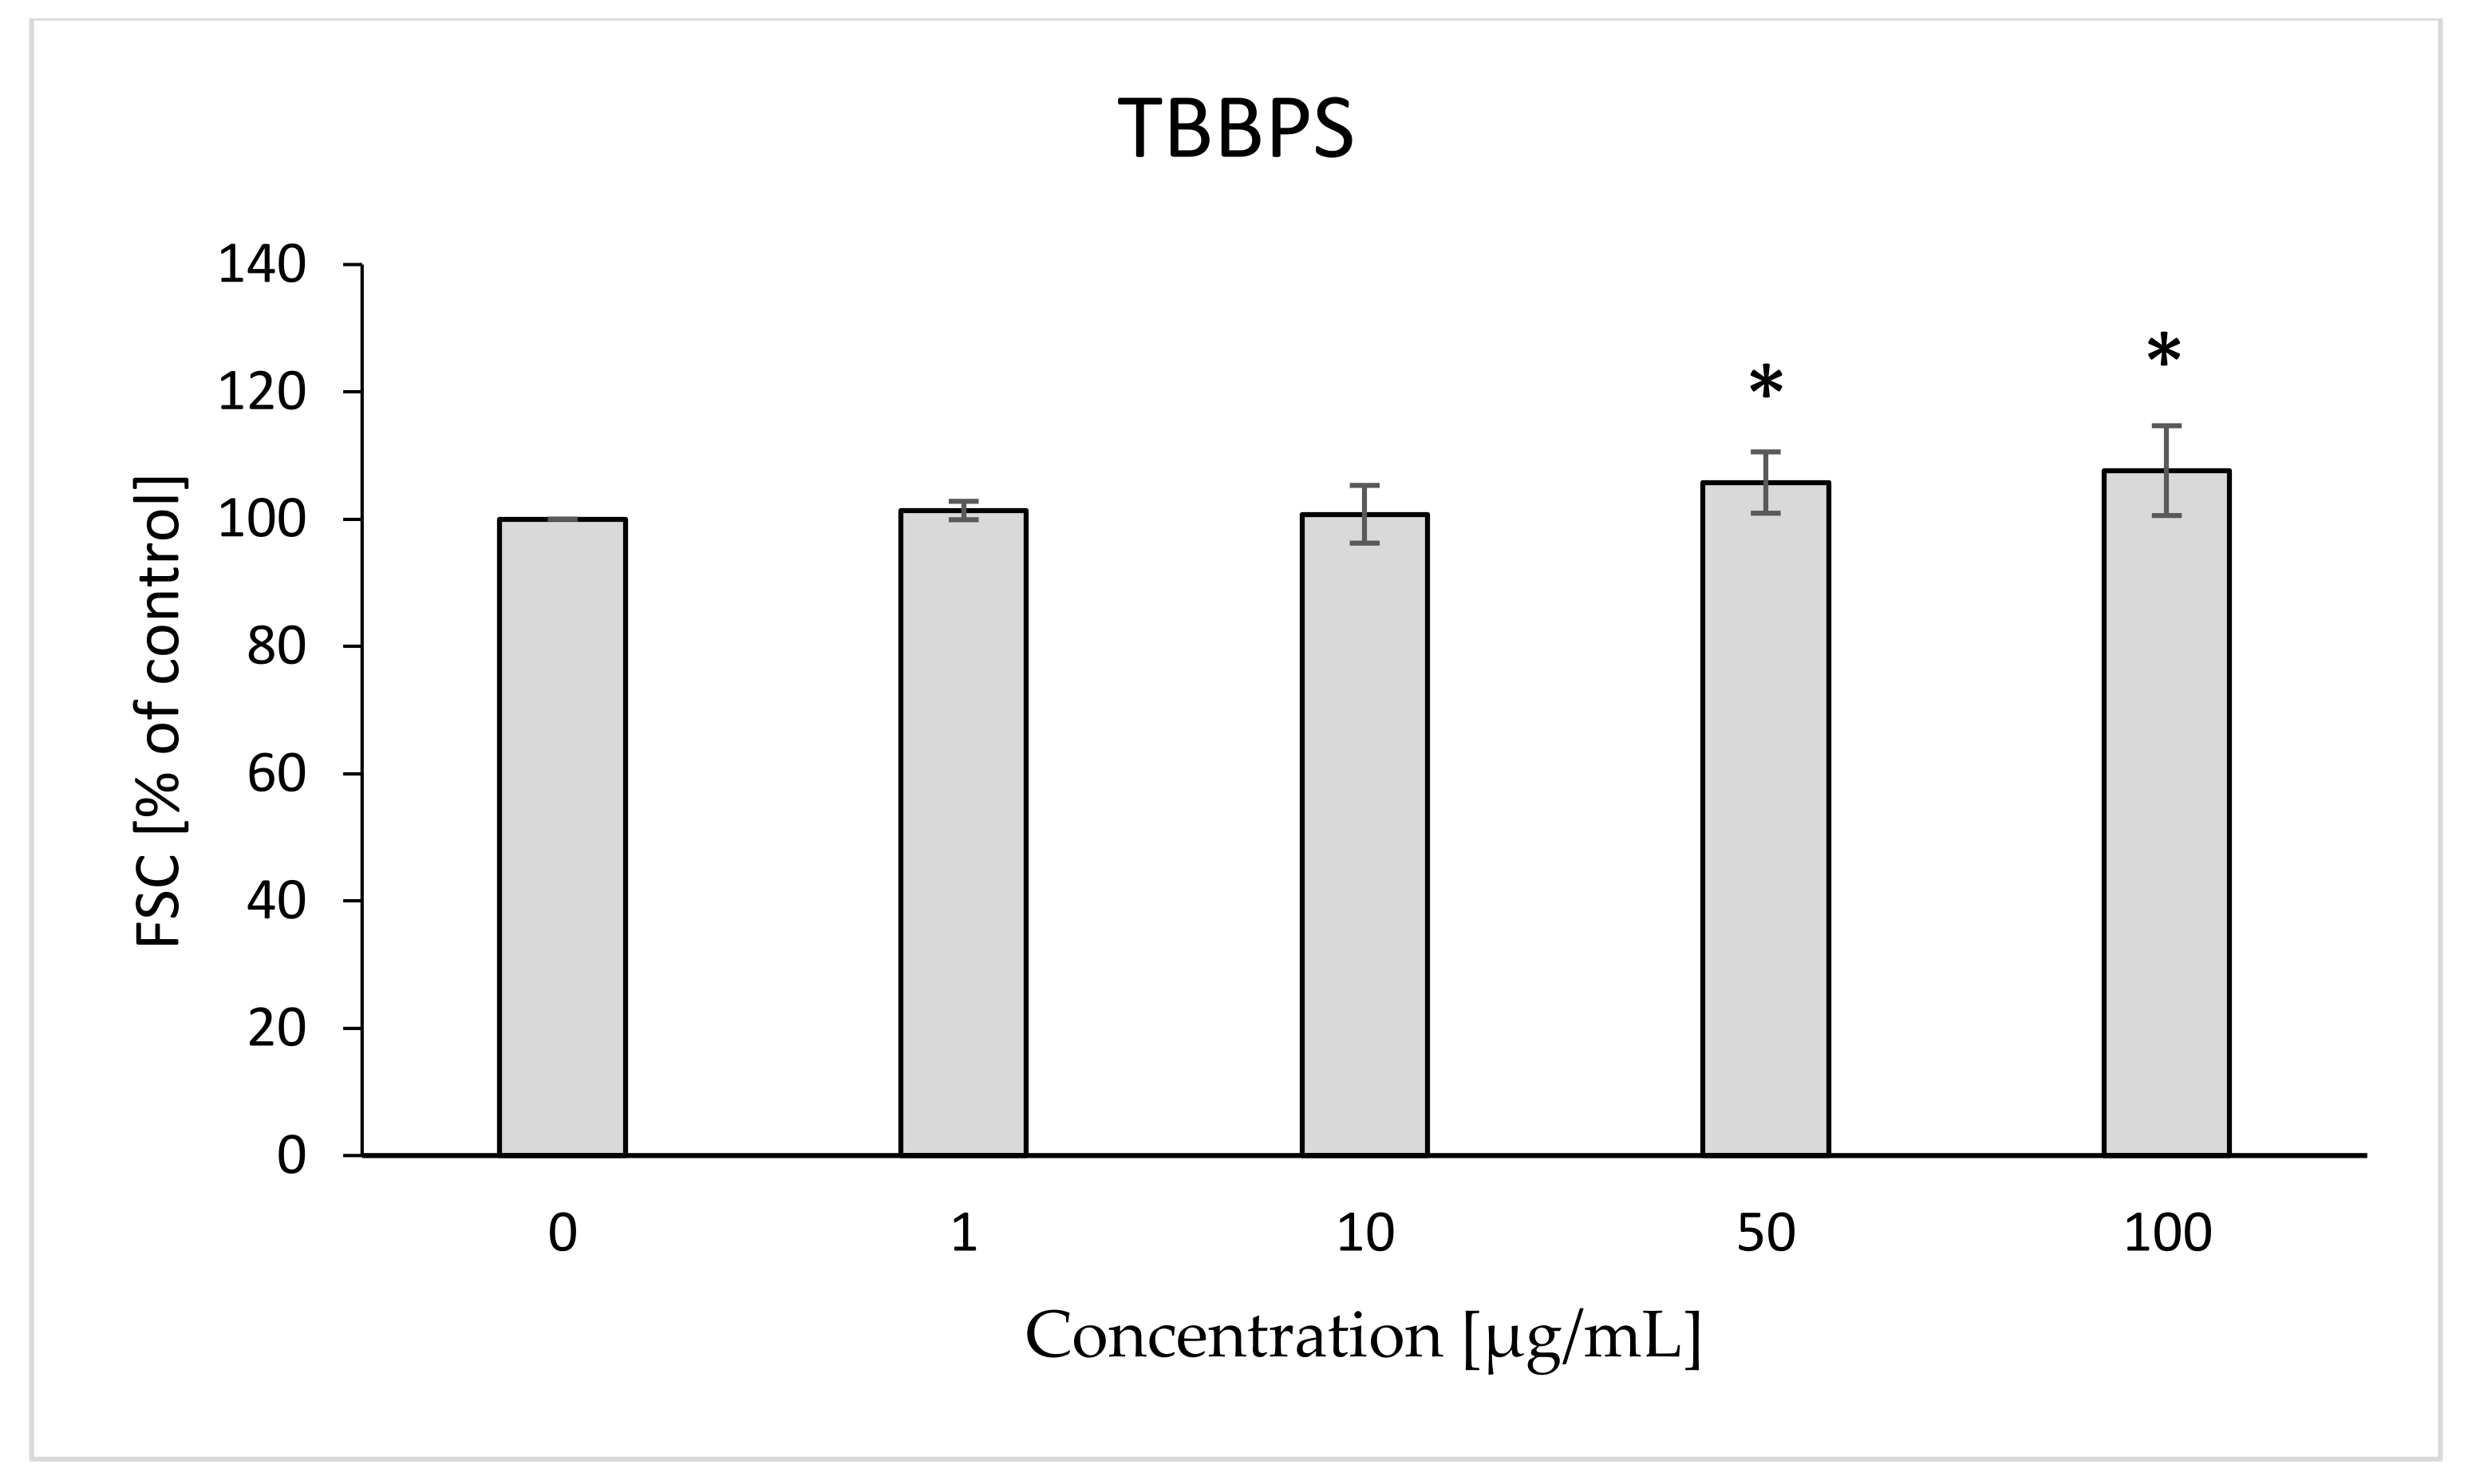
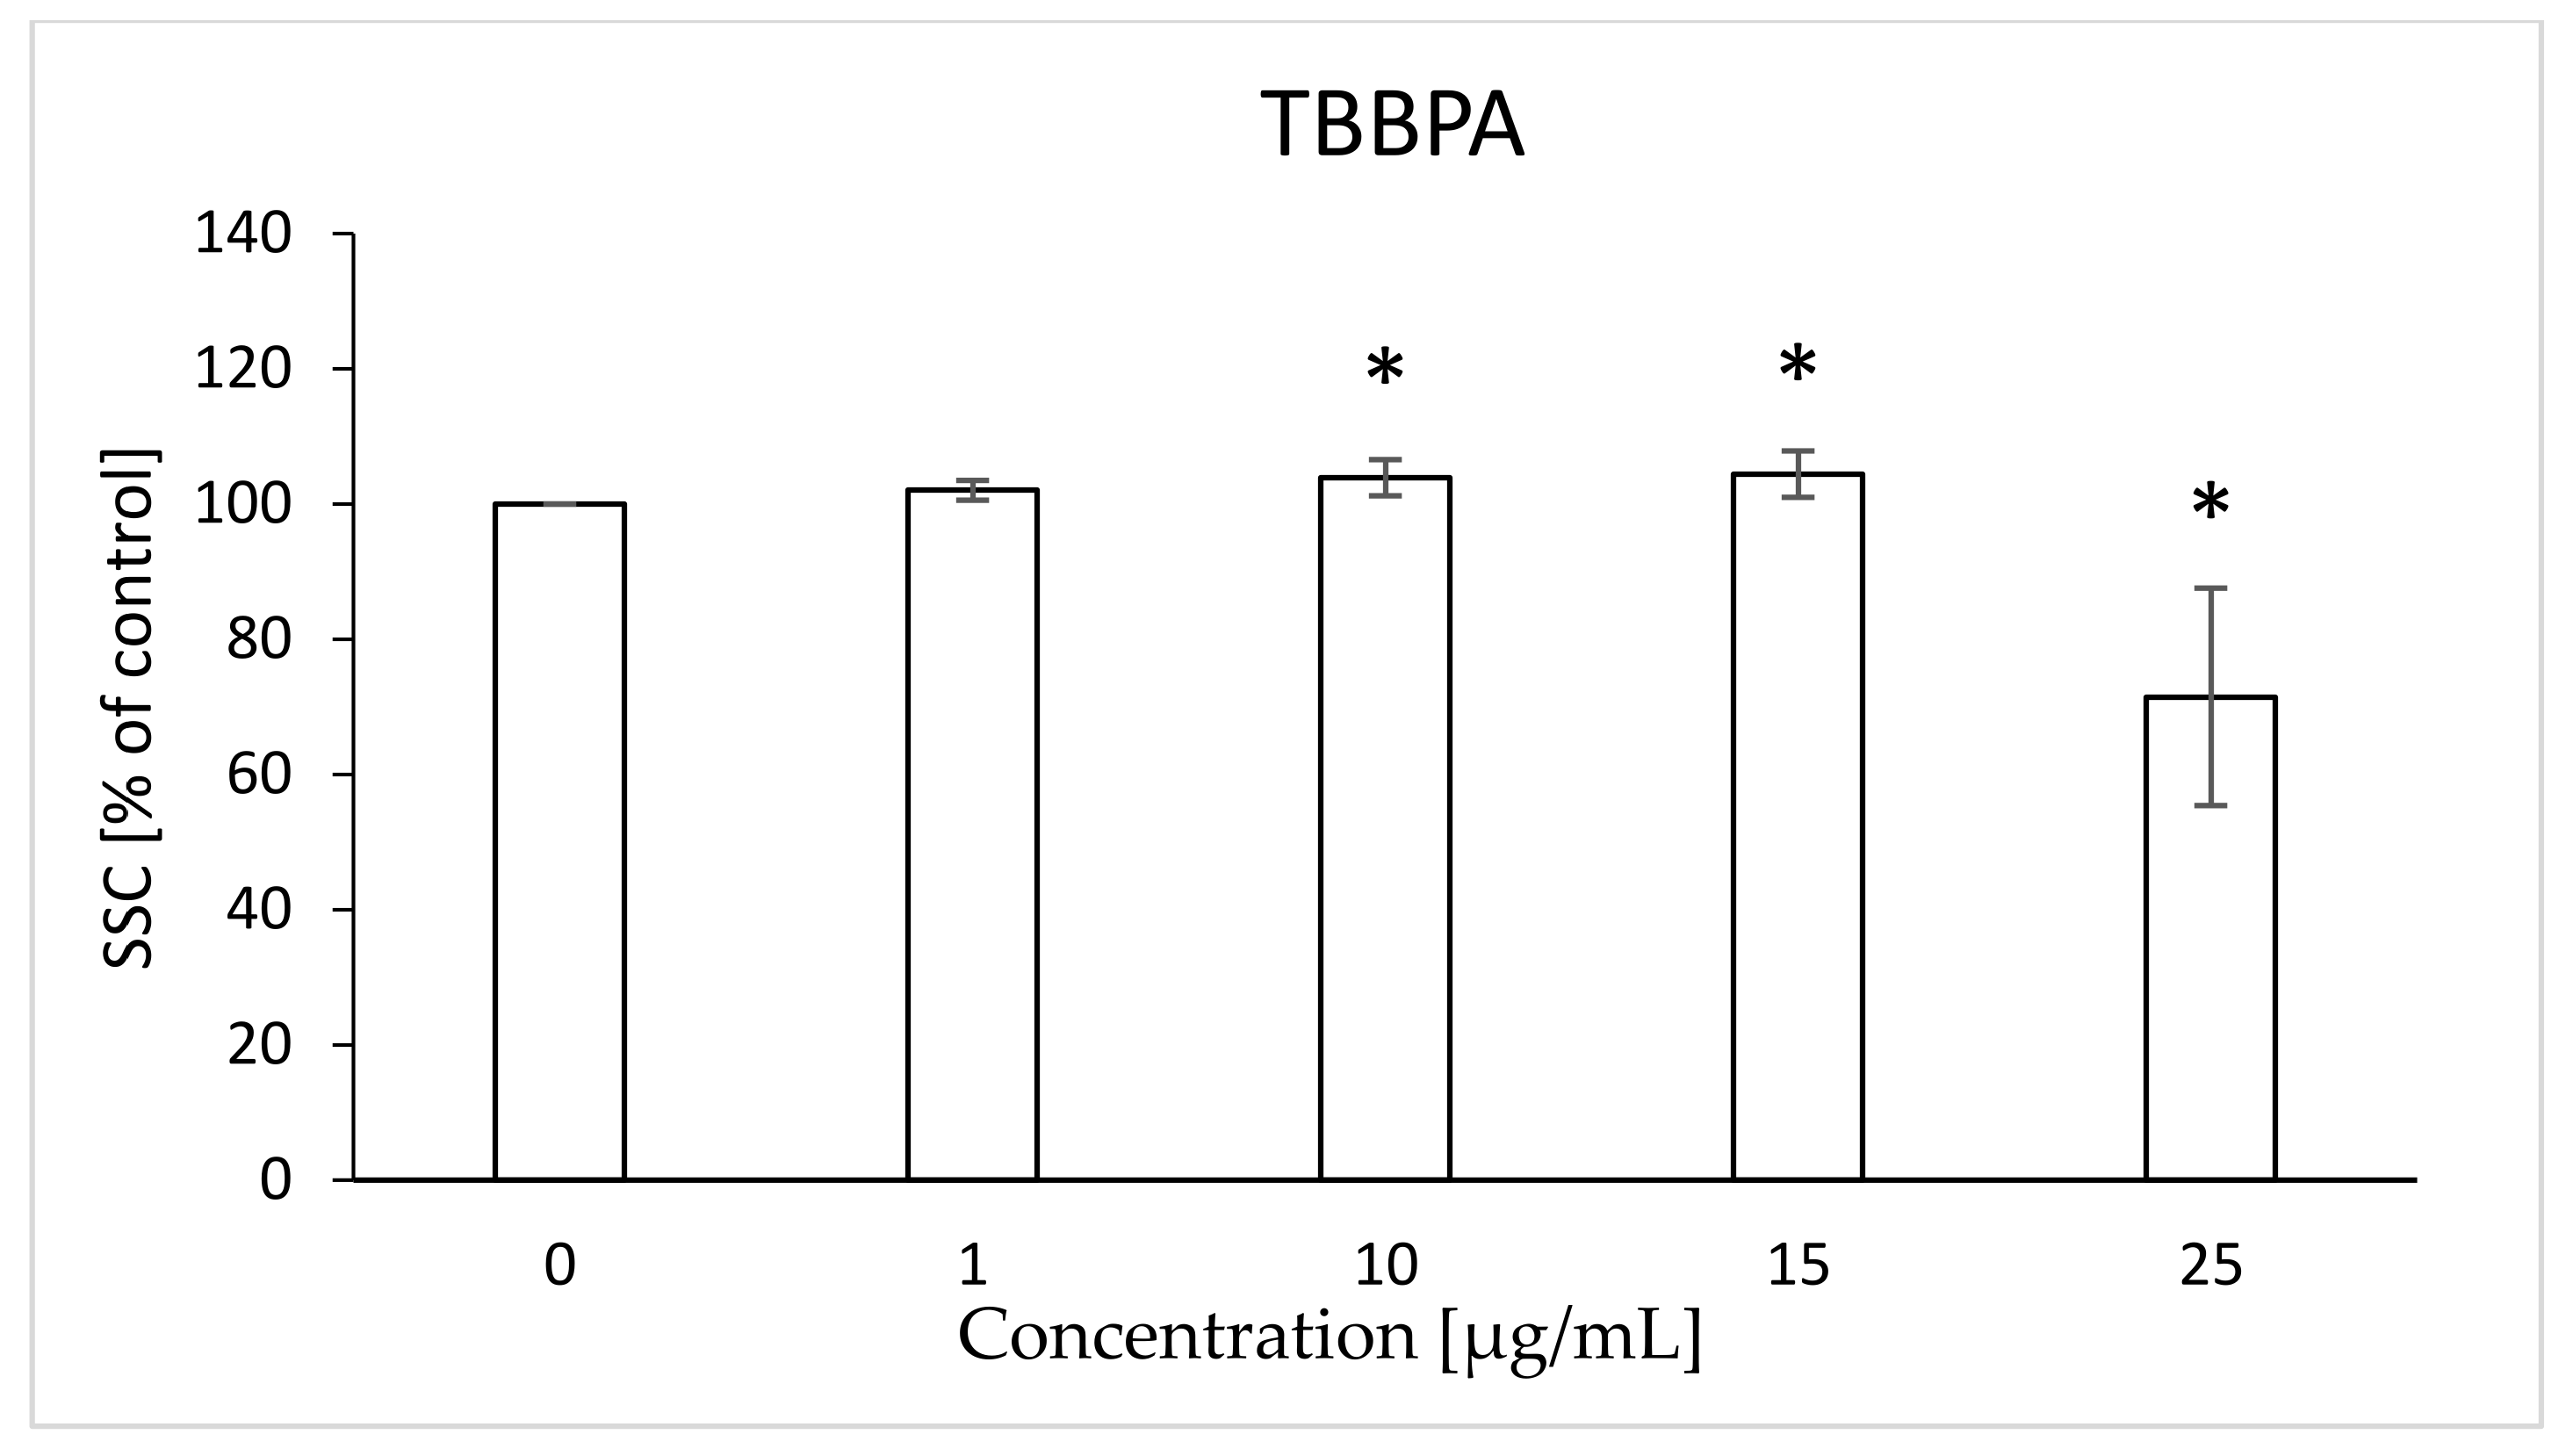
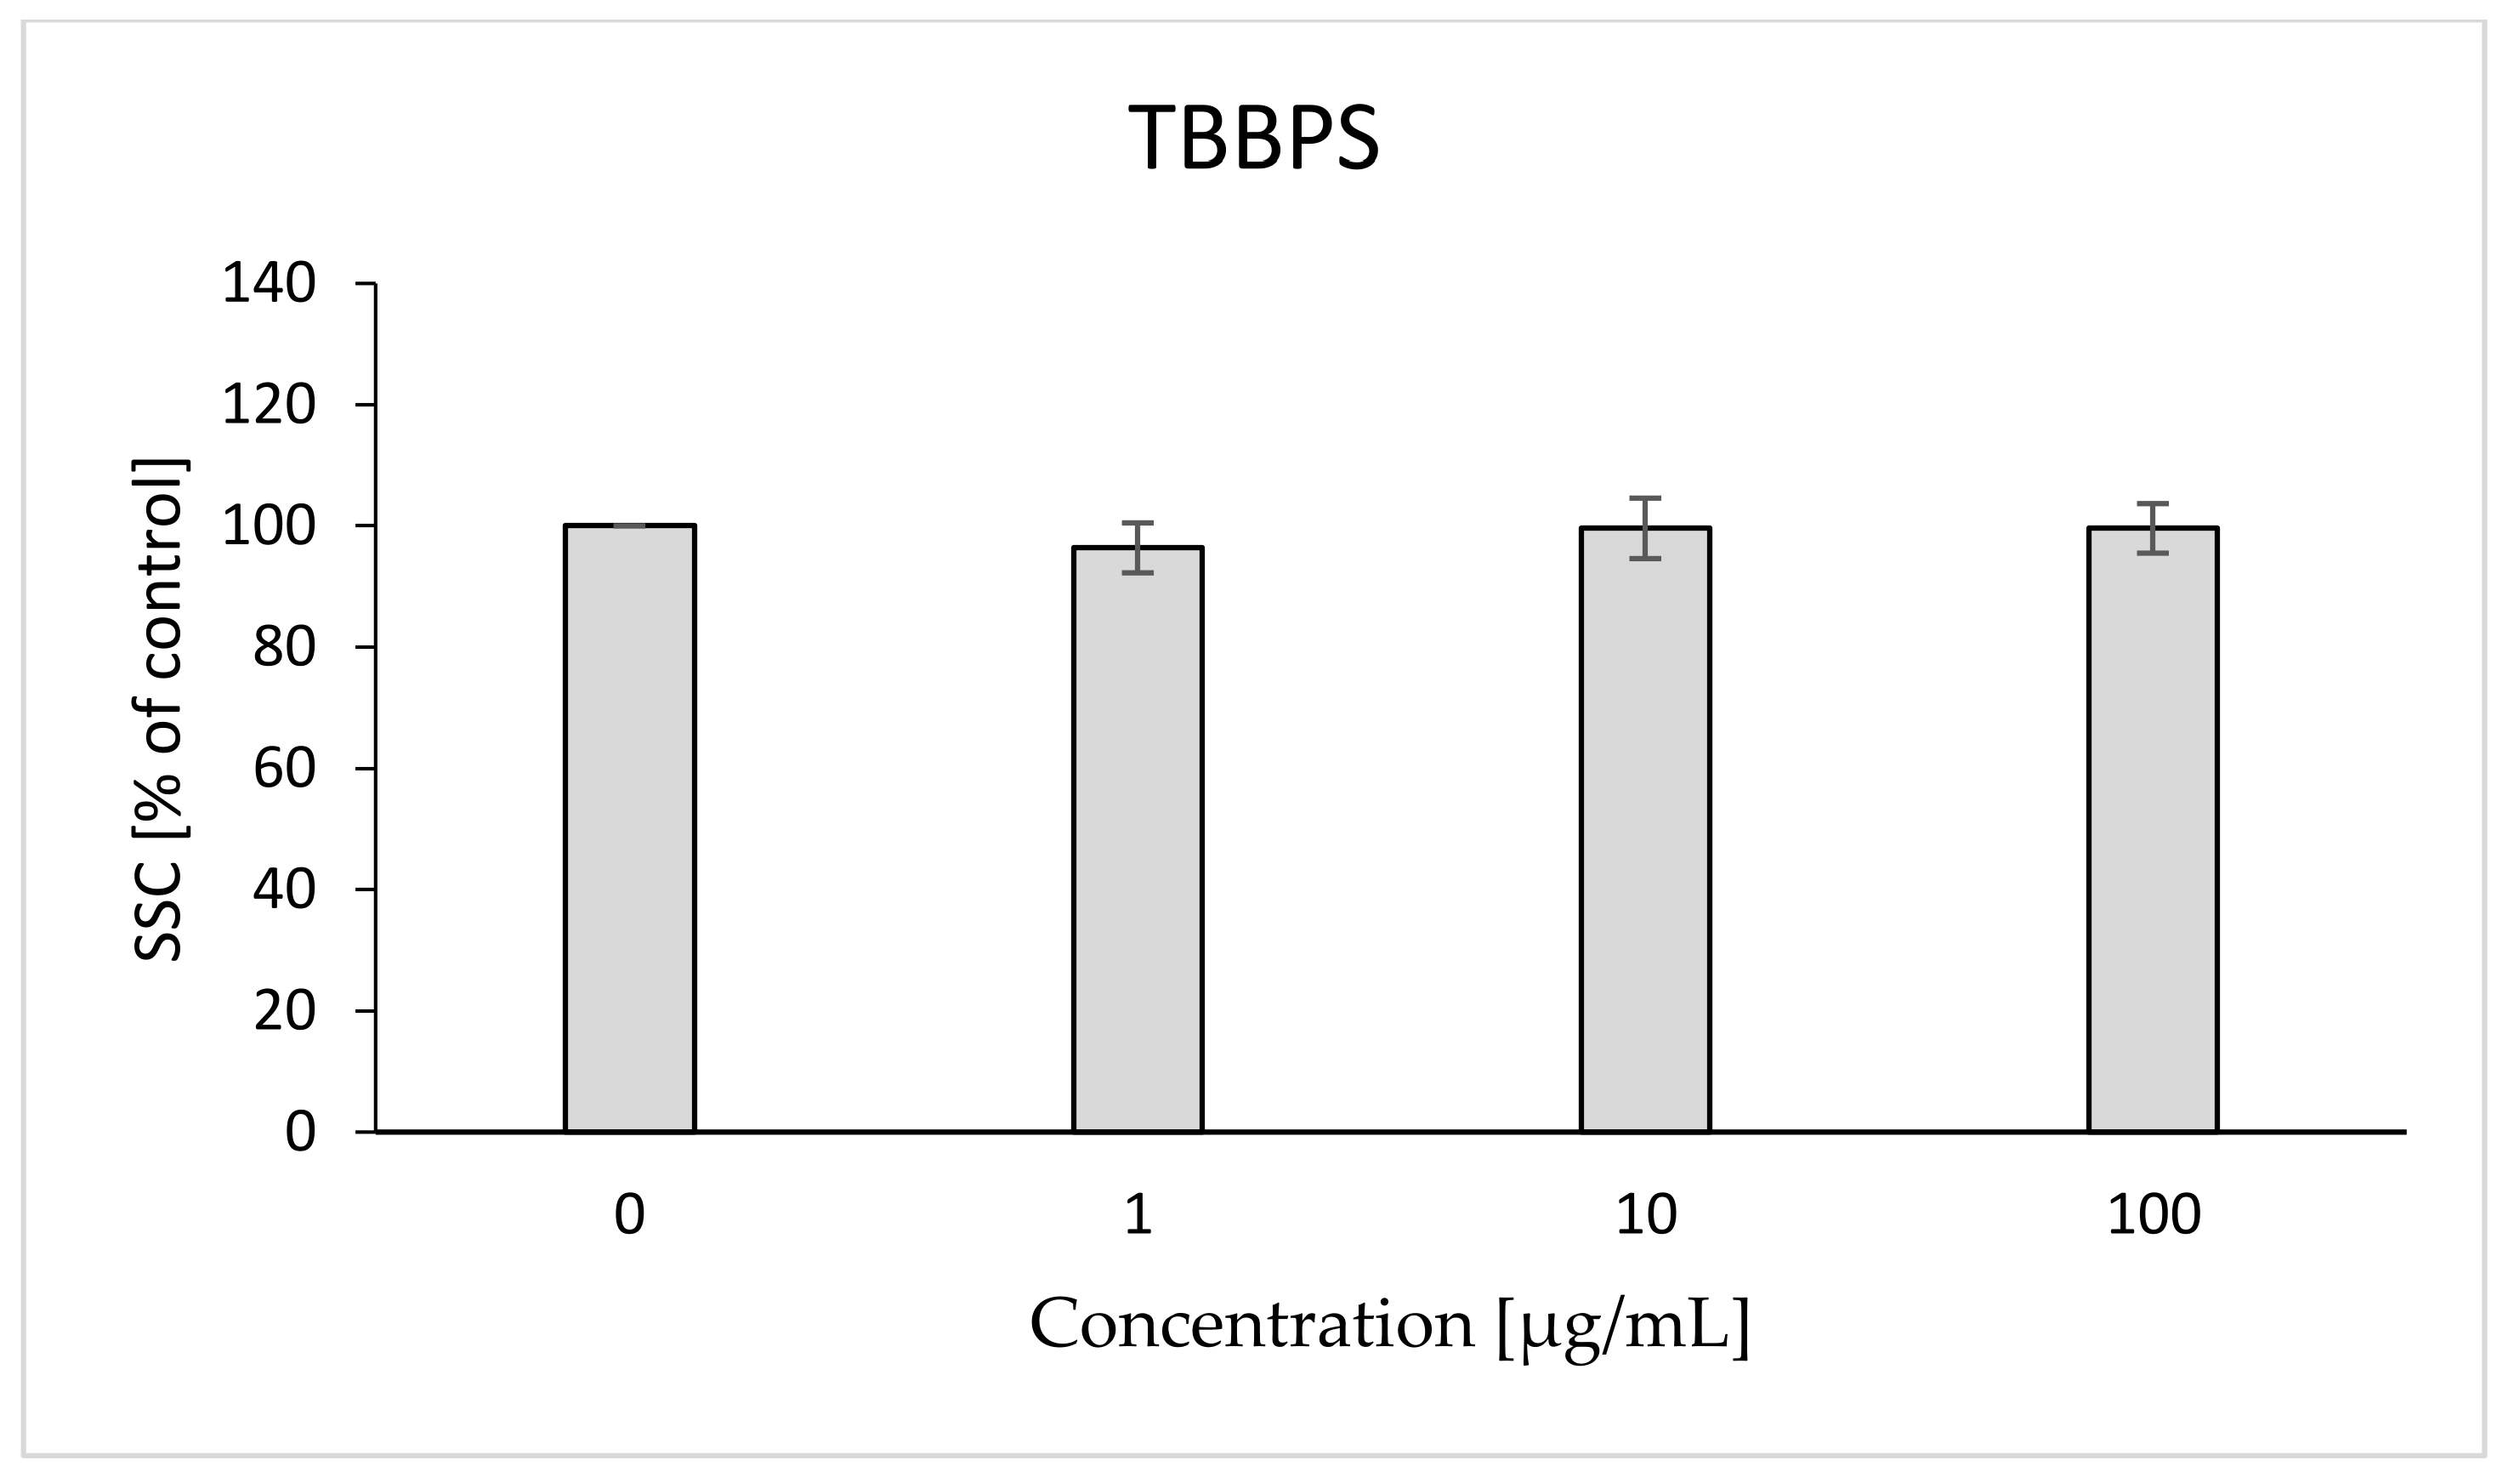
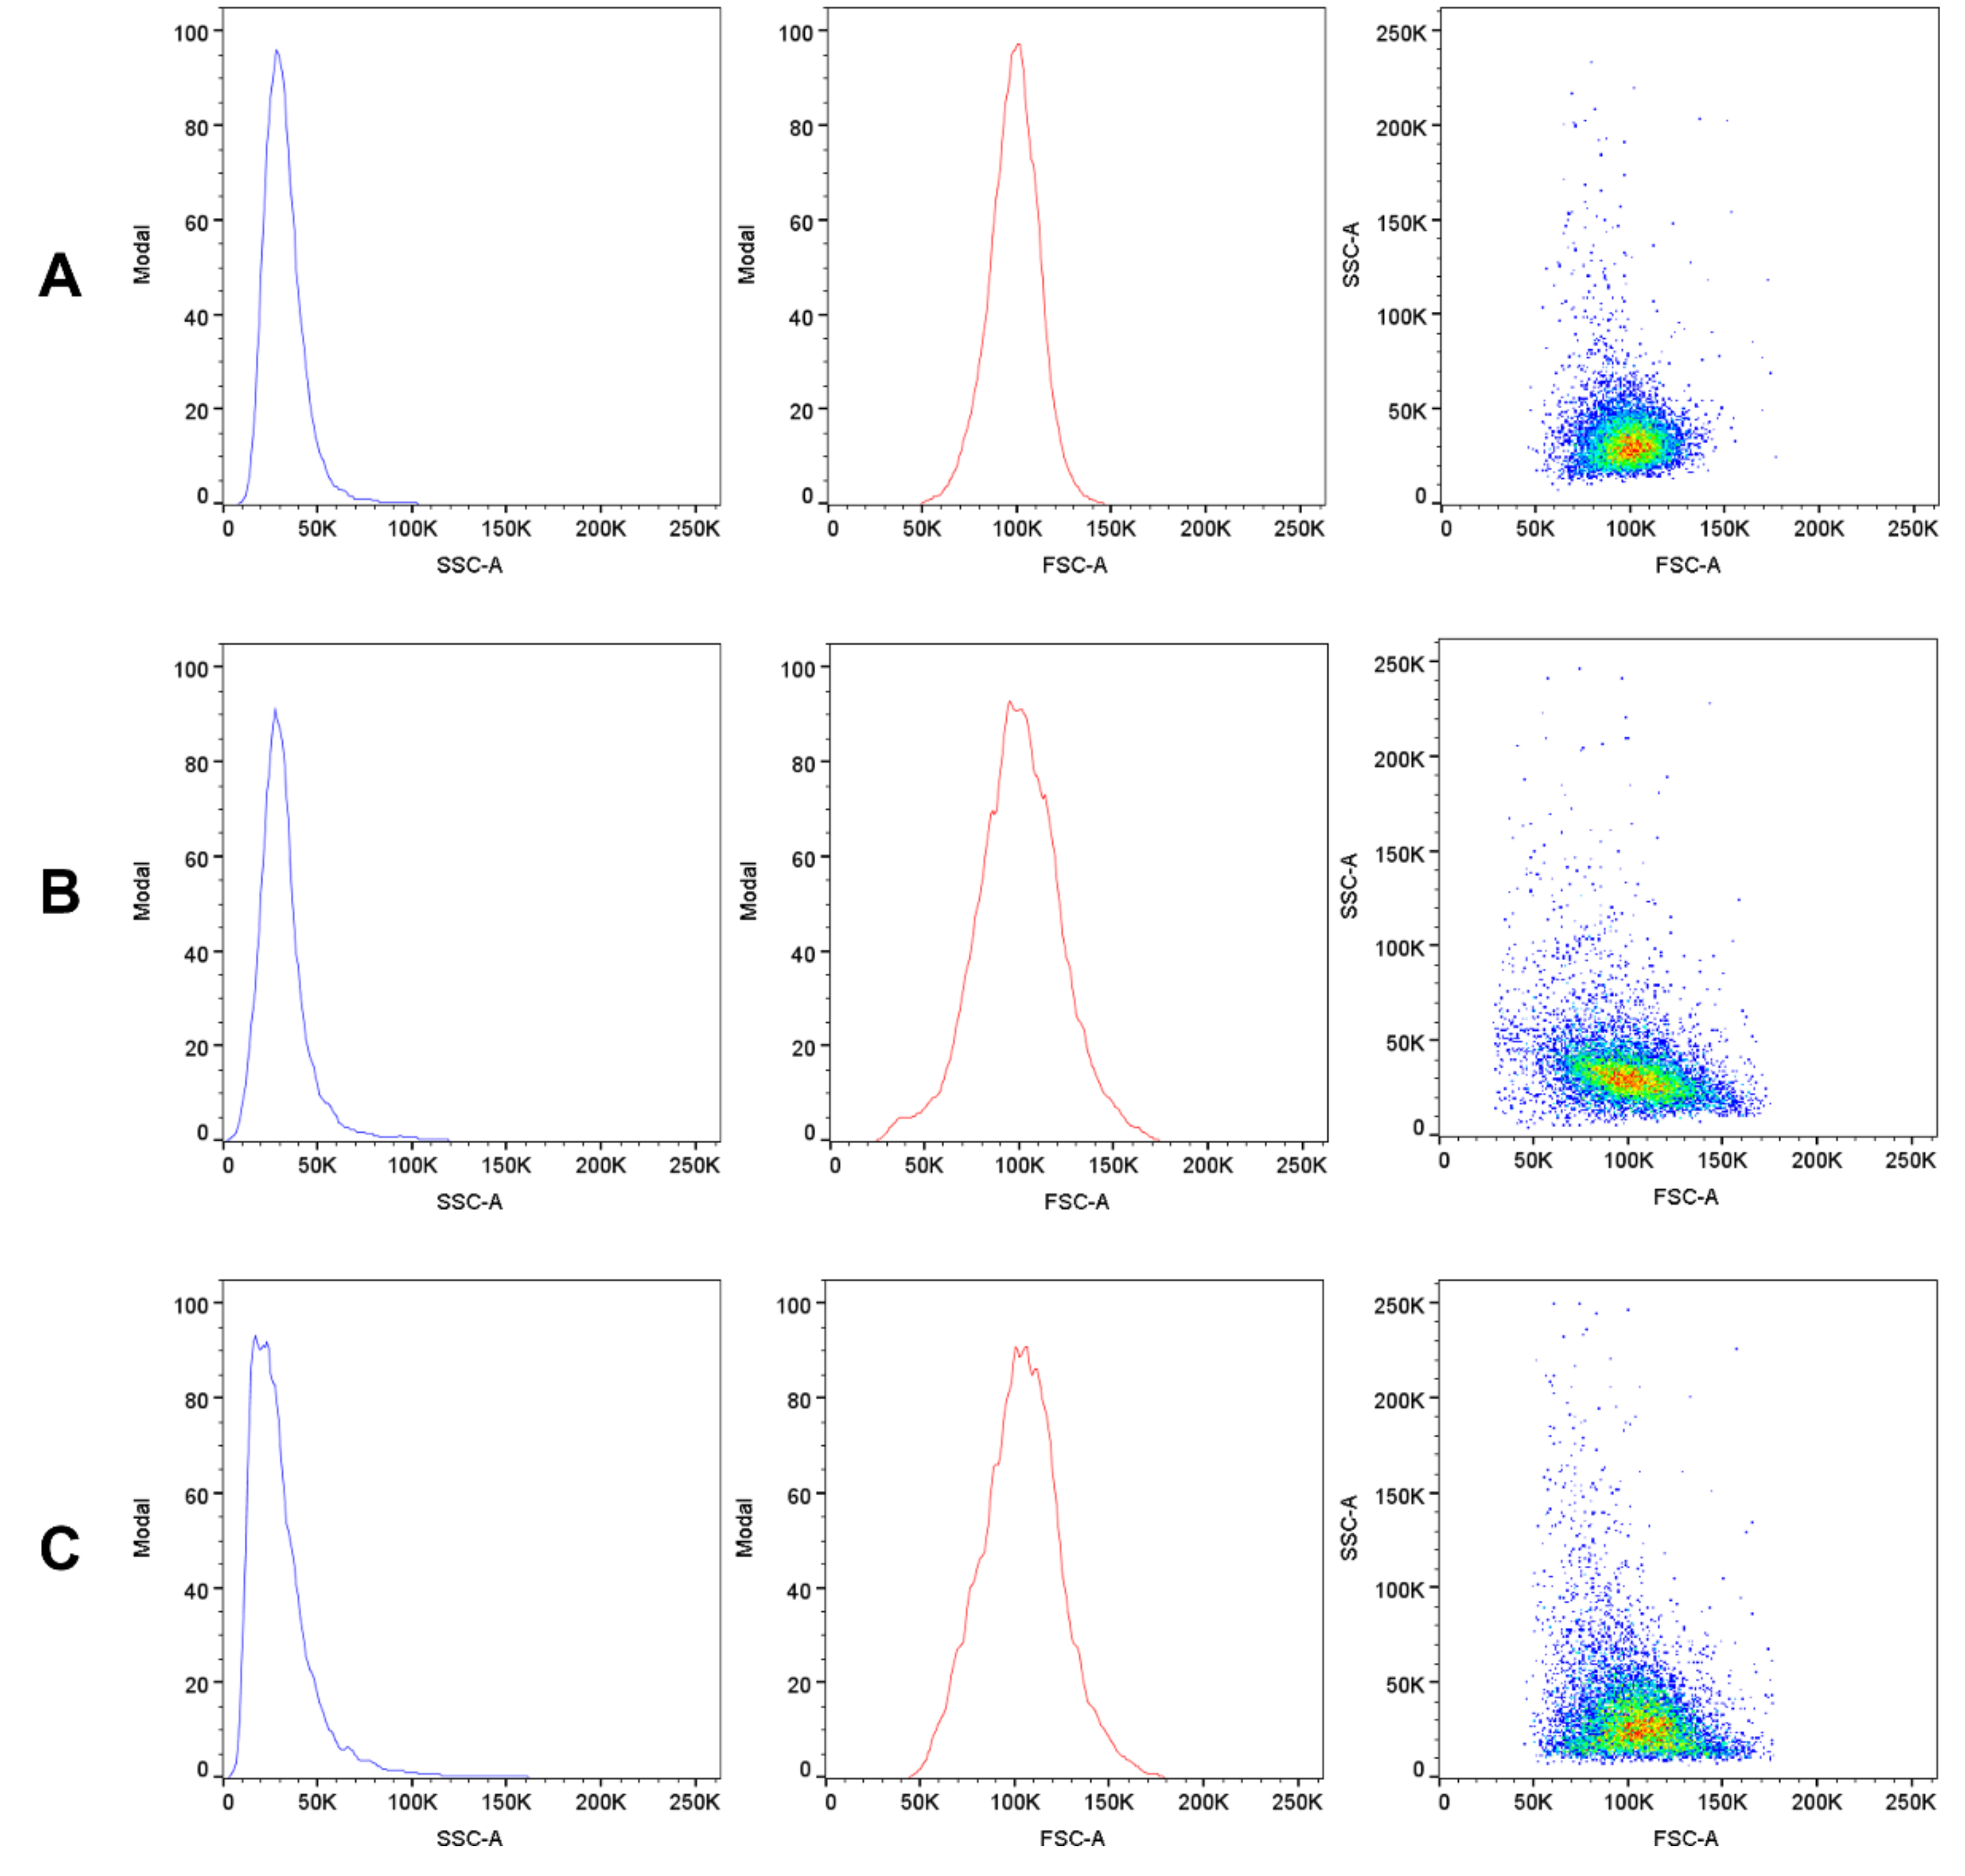
2.8. Morphological Changes of Erythrocytes, FSC and SSC Parameter
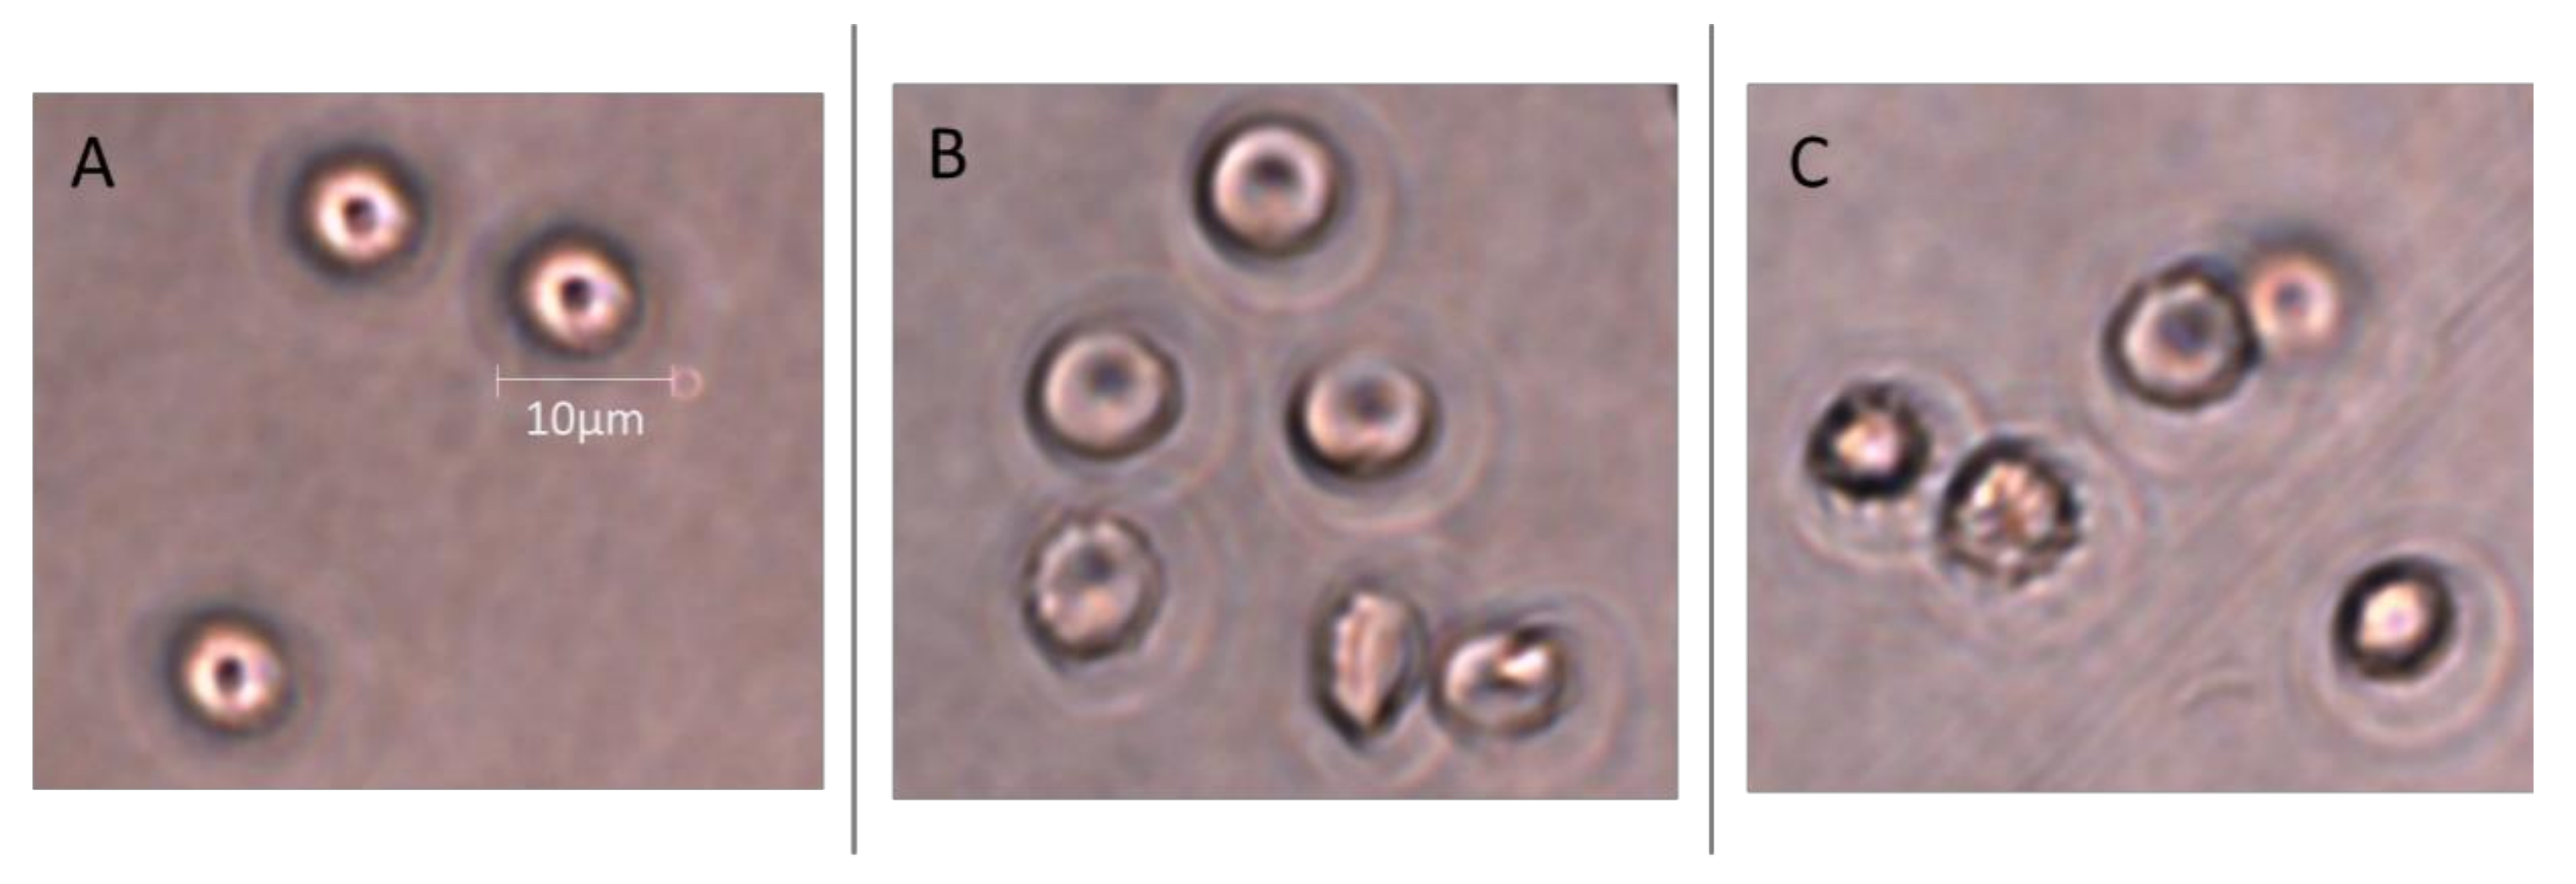
2.9. Microscopic Analysis
3. Discussion
4. Materials and Methods
4.1. Chemicals
4.2. Erythrocyte and Erythrocyte’s Membranes Isolation
4.3. Membrane Fluidity
4.4. W/S Ratio
4.5. Internal Viscosity
4.6. Thiol Groups Level
4.7. ATP Level
4.8. Lipid Peroxidation
4.9. Osmotic Fragility
4.10. Morphological Changes of Erythrocytes (FSC and SSC Parameter)
4.11. Microscopic Analysis
4.12. Statistical Analysis
5. Conclusions
Author Contributions
Funding
Institutional Review Board Statement
Informed Consent Statement
Conflicts of Interest
Abbreviations
| BFRs | brominated flame retardants |
| TBBPA | tetrabromobisphenol A |
| TBBPS | tetrabromobisphenol S |
| ATP | adenosine triphosphate |
| RBCs | erythrocytes |
| FSC | forward scatter channel |
| SSC | side scatter channel |
| EPR | electron paramagnetic resonance |
| ROS | reactive oxygen species |
References
- Zhou, X.; Guo, J.; Zhang, W.; Zhou, P.; Deng, J.; Lin, K. Tetrabromobisphenol A contamination and emission in printed circuit board production and implications for human exposure. J. Hazard. Mater. 2014, 273, 27–35. [Google Scholar] [CrossRef] [PubMed]
- Covaci, A.; Voorspoels, S.; Abdallah, M.A.E.; Geens, T.; Harrad, S.; Law, R.J. Analytical and environmental aspects of the flame retardant tetrabromobisphenol-A and its derivatives. J. Chromatogr. A. 2009, 1216, 346–363. [Google Scholar] [CrossRef]
- Lai, D.Y.; Kacew, S.; Dekant, W. Tetrabromobisphenol A (TBBPA): Possible modes of action of toxicity and carcinogenicity in rodents. Food Chem. Toxicol. 2015, 80, 206–214. [Google Scholar] [CrossRef] [PubMed]
- Tang, J.; Feng, J.; Li, X.; Li, G. Levels of flame retardants HBCD, TBBPA and TBC in surface soils from an industrialized region of East China. Environ. Sci. Proc. Impacts 2014, 16, 1015–1021. [Google Scholar] [CrossRef]
- Gorga, M.; Martínez, E.; Ginebreda, A.; Eljarrat, E.; Barceló, D. Determination of PBDEs, HBB, PBEB, DBDPE, HBCD, TBBPA and related compounds in sewage sludge from Catalonia (Spain). Sci. Total Environ. 2013, 444, 51–59. [Google Scholar] [CrossRef]
- Kowalski, B.; Mazur, M. The simultaneous determination of six flame retardants in water samples using SPE pre-concentration and UHPLC-UV method. Water Air Soil Pollut. 2014, 225, 1–9. [Google Scholar] [CrossRef] [PubMed] [Green Version]
- Xie, Z.; Ebinghaus, R.; Lohmann, R.; Heemken, O.; Caba, A.; Püttmann, W. Trace determination of the flame retardant tetrabromobisphenol A in the atmosphere by gas chromatography–mass spectrometry. Anal. Chim. Acta 2007, 584, 333–342. [Google Scholar] [CrossRef] [Green Version]
- Abdallah, M.A.E.; Harrad, S.; Covaci, A. Hexabromocyclododecanes and tetrabromobisphenol—A in indoor air and dust in Birmingham, UK: Implications for human exposure. Environ. Sci. Technol. 2008, 42, 6855–6861. [Google Scholar] [CrossRef]
- Wang, W.; Abualnaja, K.O.; Asimakopoulos, A.G.; Covaci, A.; Gevao, B.; Johnson-Restrepo, B.; Kumosani, T.A.; Malarvannan, G.; Minh, T.B.; Moon, H.-B.; et al. A comparative assessment of human exposure to tetrabromobisphenol A and eight bisphenols including bisphenol A via indoor dust ingestion in twelve countries. Environ. Int. 2015, 83, 183–191. [Google Scholar] [CrossRef] [PubMed]
- Nakao, T.; Akiyama, E.; Kakutani, H.; Mizuno, A.; Aozasa, O.; Akai, Y.; Ohta, S. Levels of tetrabromobisphenol A, tribromobisphenol A, dibromobisphenol A, monobromobisphenol A, and bisphenol A in Japanese breast milk. Chem. Res. Toxicol. 2015, 28, 722–728. [Google Scholar] [CrossRef]
- Kim, U.J.; Oh, J.E. Tetrabromobisphenol A and hexabromocyclododecane flame retardants in infant–mother paired serum samples, and their relationships with thyroid hormones and environmental factors. Environ. Pollut. 2014, 184, 193–200. [Google Scholar] [CrossRef]
- Dunnick, J.K.; Sanders, J.M.; Kissling, G.E.; Johnson, C.L.; Boyle, M.H.; Elmore, S.A. Environmental chemical exposure may contribute to uterine cancer development: Studies with tetrabromobisphenol A. Toxicol. Pathol. 2015, 43, 464–473. [Google Scholar] [CrossRef] [Green Version]
- McCollum, C.W.; Riu, A. Obesity: An Effect of Environmental Pollutants? In Proceedings of the Endocrine Society’s 94th Annual Meeting and Expo, Houston, TX, USA, 23–26 June 2012. [Google Scholar]
- Barret, J. Warm Reception? Halogenated BPA Flame Retardants and PPARγ Activation. Environ. Health Perspect. 2011, 119, 398. [Google Scholar]
- Qu, G.; Liu, A.; Hu, L.; Liu, S.; Shi, J.; Jiang, G. Recent advances in the analysis of TBBPA/TBBPS, TBBPA/TBBPS derivatives and their transformation products. Trends Anal. Chem. 2016, 83, 14–24. [Google Scholar] [CrossRef]
- Xu, H.; Li, Y.; Lu, J.; Lu, J.; Zhou, L.; Chovelon, J.M.; Ji, Y. Aqueous photodecomposition of the emerging brominated flame retardant tetrabromobisphenol S (TBBPS). Environ. Pollut. 2021, 271, 116406. [Google Scholar] [CrossRef] [PubMed]
- Liu, A.; Shi, J.; Shen, Z.; Lin, Y.; Qu, G.; Zhao, Z.; Jiang, G. Identification of unknown brominated bisphenol s congeners in contaminated soils as the transformation products of tetrabromobisphenol S derivatives. Environ. Sci. Technol. 2018, 52, 10480–10489. [Google Scholar] [CrossRef] [PubMed]
- Li, A.; Zhuang, T.; Shi, W.; Liang, Y.; Liao, C.; Song, M.; Jiang, G. Serum concentration of bisphenol analogues in pregnant women in China. Sci. Total Environ. 2020, 707, 136100. [Google Scholar] [CrossRef]
- Farag, M.R.; Alagawany, M. Erythrocytes as a biological model for screening of xenobiotics toxicity. Chem.-Biol. Interact. 2018, 279, 73–83. [Google Scholar] [CrossRef] [PubMed]
- Duchnowicz, P.; Pilarski, R.; Michałowicz, J.; Bukowska, B. Changes in Human Erythrocyte Membrane Exposed to Aqueous and Ethanolic Extracts from Uncaria tomentosa. Molecules 2021, 26, 3189. [Google Scholar] [CrossRef]
- Maćczak, A.; Duchnowicz, P.; Sicińska, P.; Koter-Michalak, M.; Bukowska, B.; Michałowicz, J. The in vitro comparative study of the effect of BPA, BPS, BPF and BPAF on human erythrocyte membrane; perturbations in membrane fluidity, alterations in conformational state and damage to proteins, changes in ATP level and Na+/K+ ATPase and AChE activities. Food Chem. Toxicol. 2017, 110, 351–359. [Google Scholar] [CrossRef]
- Arosiewicz, M.; Michałowicz, J.; Bukowska, B. In vitro assessment of eryptotic potential of tetrabromobisphenol A and other bromophenolic flame retardants. Chemosphere 2019, 215, 404–412. [Google Scholar] [CrossRef]
- Liguori, I.; Russo, G.; Curcio, F.; Bulli, G.; Aran, L.; Della-Morte, D.; Gargiulo, G.; Testa, G.; Cacciatore, F.; Bonaduce, D.; et al. Oxidative stress, aging, and diseases. Clin. Interv. Aging 2018, 13, 757. [Google Scholar] [CrossRef] [PubMed] [Green Version]
- Krisko, A.; Radman, M. Protein damage, ageing and age-related diseases. Open Biol. 2019, 9, 180249. [Google Scholar] [CrossRef] [Green Version]
- Pocernich, C.B.; Cardin, A.L.; Racine, C.L.; Lauderback, C.M.; Butterfield, D.A. Glutathione elevation and its protective role in acrolein-induced protein damage in synaptosomal membranes: Relevance to brain lipid peroxidation in neurodegenerative disease. Neurochem. Int. 2001, 39, 141–149. [Google Scholar] [CrossRef]
- Jarosiewicz, M.; Miłowska, K.; Krokosz, A.; Bukowska, B. Evaluation of the Effect of Selected Brominated Flame Retardants on Human Serum Albumin and Human Erythrocyte Membrane Proteins. Int. J. Mol. Sci. 2020, 21, 3926. [Google Scholar] [CrossRef] [PubMed]
- Bukowska, B. Toxicity of 2, 4-Dichlorophenoxyacetic Acid-Molecular Mechanisms. Pol. J. Environ. Stud. 2006, 15, 365–374. [Google Scholar]
- Bukowska, B.; Michałowicz, J.; Wojtaszek, A.; Marczak, A. Comparison of the effect of phenoxyherbicides on human erythrocyte membrane (in vitro). Biologia 2011, 66, 379–385. [Google Scholar] [CrossRef]
- Stasiuk, M.; Kijanka, G.M.; Kozubek, A. Transformations of erythrocytes shape and its regulation. Postepy Biochem. 2009, 55, 425–433. [Google Scholar] [PubMed]
- Michałowicz, J. Pentachlorophenol and its derivatives induce oxidative damage and morphological changes in human lymphocytes (in vitro). Arch. Toxicol. 2010, 84, 379–387. [Google Scholar] [CrossRef]
- Sheetz, M.P.; Singer, S.J. Biological membranes as bilayer couples. A molecular mechanism of drug-erythrocyte interactions. Proc. Natl. Acad. Sci. USA 1974, 71, 4457–4461. [Google Scholar] [CrossRef] [Green Version]
- Jarosiewicz, M.; Duchnowicz, P.; Włuka, A.; Bukowska, B. Evaluation of the effect of brominated flame retardants on hemoglobin oxidation and hemolysis in human erythrocytes. Food Chem. Toxicol. 2017, 109, 264–271. [Google Scholar] [CrossRef]
- Dodge, J.T.; Mitchell, C.; Hanahan, D.J. The preparation and chemical characteristics of hemoglobin-free ghosts of human erythrocytes. Arch. Biochem. Biophys. 1963, 100, 119–130. [Google Scholar] [CrossRef]
- Koter, M.; Franiak, I.; Strychalska, K.; Broncel, M.; Chojnowska-Jezierska, J. Damage to the structure of erythrocyte plasma membranes in patients with type-2 hypercholesterolemia. Int. J. Biochem. Cell Biol. 2004, 36, 205–215. [Google Scholar] [CrossRef]
- Morse, P.D. Use of the spin label tempamine for measuring the internal viscosity of red blood cells. Biochem. Biophys. Res. Commun. 1977, 77, 1486–1491. [Google Scholar] [CrossRef]
- Ellman, G. Tissue sulfhydryl groups. Arch. Biochem. Biophys. 1959, 82, 70–77. [Google Scholar] [CrossRef]
- Stanly, P.; Williams, S. Use of the liquid scintillation spectrometer for determining adenosine triphosphate by the luciferase enzyme. Anal. Biochem. 1969, 29, 381–392. [Google Scholar] [CrossRef]
- Stocks, J.; Dormandy, T.L. The autoxidation of human red cell lipids induced by hydrogen peroxide. Br. J. Haematol. 1971, 20, 95–111. [Google Scholar] [CrossRef] [PubMed]
- Dacia, J.V.; Lewis, S.M. Practical Hematology, 5th ed.Churchill Livingston: Edingurgth, UK; London, UK; New York, NY, USA, 1975; pp. 32–34. [Google Scholar]


| Compound | Concentration [µg/mL] | Order Parameter S [%] | Correlation Time τB [%] | Correlation Time τC [%] |
|---|---|---|---|---|
| TBBPA | 0 | 100.00 ± 0.009 | 100.00 ± 0.444 | 100.00 ± 0.476 |
| 1 | 101.86 ± 0.003 * | 103.75 ± 0.691 | 104.92 ± 0.925 | |
| 10 | 103.01 ± 0.002 * | 104.79 ± 0.823 | 103.95 ± 1.021 | |
| 15 | 103.95 ± 0.001 * | 105.24 ± 0.727 | 103.70 ± 1.387 | |
| 25 | 105.45 ± 0.009 * | 105.05 ± 0.740 | 104.32 ± 0.887 | |
| TBBPS | 0 | 100.00 ± 0.009 | 100.00 ± 1.080 | 100.00 ± 1.305 |
| 1 | 102.57 ± 0.010 | 100.47 ± 0.231 | 102.37 ± 0.925 | |
| 10 | 104.45 ± 0.009 * | 100.27 ± 0.433 | 101.32 ± 0.774 | |
| 50 | 105.99 ± 0.008 * | 104.18 ± 0.735 | 104.40 ± 0.455 | |
| 100 | 108.33 ± 0.021 * | 106.93 ± 0.903 | 108.38 ± 1.330 |
| Compound | Concentration [µg/mL] | Internal Viscosity [%] |
|---|---|---|
| TBBPA | 0 | 100.00 ± 0.004 |
| 1 | 103.32 ± 0.004 | |
| 10 | 104.22 ± 0.005 | |
| 15 | 105.19 ± 0.004 | |
| 25 | 106.40 ± 0.004 | |
| TBBPS | 0 | 100.00 ± 0.003 |
| 1 | 99.42 ± 0.004 | |
| 10 | 99.53 ± 0.007 | |
| 50 | 103.37 ± 0.006 | |
| 100 | 107.50 ± 0.007 |
Publisher’s Note: MDPI stays neutral with regard to jurisdictional claims in published maps and institutional affiliations. |
© 2021 by the authors. Licensee MDPI, Basel, Switzerland. This article is an open access article distributed under the terms and conditions of the Creative Commons Attribution (CC BY) license (https://creativecommons.org/licenses/by/4.0/).
Share and Cite
Jarosiewicz, M.; Duchnowicz, P.; Jarosiewicz, P.; Huras, B.; Bukowska, B. An In Vitro Comparative Study of the Effects of Tetrabromobisphenol A and Tetrabromobisphenol S on Human Erythrocyte Membranes—Changes in ATP Level, Perturbations in Membrane Fluidity, Alterations in Conformational State and Damage to Proteins. Int. J. Mol. Sci. 2021, 22, 9443. https://doi.org/10.3390/ijms22179443
Jarosiewicz M, Duchnowicz P, Jarosiewicz P, Huras B, Bukowska B. An In Vitro Comparative Study of the Effects of Tetrabromobisphenol A and Tetrabromobisphenol S on Human Erythrocyte Membranes—Changes in ATP Level, Perturbations in Membrane Fluidity, Alterations in Conformational State and Damage to Proteins. International Journal of Molecular Sciences. 2021; 22(17):9443. https://doi.org/10.3390/ijms22179443
Chicago/Turabian StyleJarosiewicz, Monika, Piotr Duchnowicz, Paweł Jarosiewicz, Bogumiła Huras, and Bożena Bukowska. 2021. "An In Vitro Comparative Study of the Effects of Tetrabromobisphenol A and Tetrabromobisphenol S on Human Erythrocyte Membranes—Changes in ATP Level, Perturbations in Membrane Fluidity, Alterations in Conformational State and Damage to Proteins" International Journal of Molecular Sciences 22, no. 17: 9443. https://doi.org/10.3390/ijms22179443