Article

Determination of Two Differently Manufactured Silicon Dioxide Nanoparticles by Cloud Point Extraction Approach in Intestinal Cells, Intestinal Barriers and Tissues

Division of Applied Food System, Major of Food Science & Technology, Seoul Women’s University, Seoul 01797, Korea
*
Author to whom correspondence should be addressed.
Equally contributed to the work reported.
Int. J. Mol. Sci. 2021, 22(13), 7035; https://doi.org/10.3390/ijms22137035
Submission received: 7 May 2021 / Revised: 20 June 2021 / Accepted: 26 June 2021 / Published: 29 June 2021
(This article belongs to the Special Issue Food Toxicants)

Abstract

:
Food additive amorphous silicon dioxide (SiO2) particles are manufactured by two different methods—precipitated and fumed procedures—which can induce different physicochemical properties and biological fates. In this study, precipitated and fumed SiO2 particles were characterized in terms of constituent particle size, hydrodynamic diameter, zeta potential, surface area, and solubility. Their fates in intestinal cells, intestinal barriers, and tissues after oral administration in rats were determined by optimizing Triton X-114-based cloud point extraction (CPE). The results demonstrate that the constituent particle sizes of precipitated and fumed SiO2 particles were similar, but their aggregate states differed from biofluid types, which also affect dissolution properties. Significantly higher cellular uptake, intestinal transport amount, and tissue accumulation of precipitated SiO2 than of fumed SiO2 was found. The intracellular fates of both types of particles in intestinal cells were primarily particle forms, but slowly decomposed into ions during intestinal transport and after distribution in the liver, and completely dissolved in the bloodstream and kidneys. These findings will provide crucial information for understanding and predicting the potential toxicity of food additive SiO2 after oral intake.

1. Introduction

Amorphous silicon dioxide (SiO2) is widely applied to the food industry as a food additive—for example, as a thickener, anticaking agent, carrier for fragrances and flavors, chillproofing agent in beer, or filter aid [1,2]. As a direct additive, the United States Food and Drug Administration regulates that the level of SiO2 cannot exceed 2% by weight of the food, whereas it can be added in the amount necessary to obtain its intended functionality as an indirect additive [3]. It is registered as food additive E551 in the European Union, and its maximum levels in dried, powdered foods and tablet foods are authorized at 10 g/kg and quantum satis level, respectively [4]. An acceptable daily intake for SiO2 is not currently specified [5,6]. Until now, food additive SiO2 has been used for a long time without any adverse effects on human health at its levels of usage. However, the European Food Safety Authority (EFSA) suggests re-evaluating the toxicity of E551, due to the presence of nanosized SiO2. A nanomaterial is defined as a material with more than 50% of its particles having at least one external dimension in the size range of 1–100 nm, based on number size distribution [7]. The EFSA report and other studies demonstrated that nanoparticles (NPs) of less than 100 nm were present in E551, although the amounts of NPs differed between the materials tested and analytical methods [8,9,10]. Recently, it was reported that E551 can be considered to be a food additive intentionally produced to nanosized materials [11]. However, current specifications do not include the particle size distribution nor the percentage of NPs in SiO2 [3,8].
Concerns about the potential toxicity of SiO2 have been raised because some in vitro studies have suggested that SiO2 NPs can cause inflammatory responses of the intestinal wall [12,13] and affect small intestinal function [14]. Neurotoxicity of SiO2 NPs was also reported in neuronal cells and zebrafish [15,16,17]. However, there is no evidence that these toxicological findings are comparable to in vivo animal models and humans. Indeed, the no-observed-adverse-effect level (NOAEL) of SiO2 NPs was reported to be more than 2000 mg/kg [18]. Meanwhile, SiO2 is known to not be rapidly decomposed into Si ions under acidic or biological conditions [19]; it undergoes in vitro and in vivo gradual degradation, forming silicic acid (ortho-, meta-, di-, and trisilicates) via hydrolysis [20,21]. Therefore, the determination of the fates of food additive SiO2 in commercial products and biological systems is of importance, and can provide information about the presence and amount of NPs, aggregates, or dissolved forms, contributing to the understanding of its potential toxicity.
Another factor to be considered is that the physicochemical properties and biological responses of SiO2 can be also influenced by the manufacturing method. Indeed, commercially available food additive SiO2 is manufactured by two different methods: One is precipitated SiO2, produced by the reaction of metal silicate solutions and sulfuric acid, resulting in white precipitates [22]. The other is fumed SiO2—also known as pyrogenic SiO2—which is produced by the flame pyrolysis of silicon tetrachloride (SiCl4), or from quartz sand vaporized in an electric arc at 3000 °C [23,24]. It was reported that the dissolution and physicochemical properties of SiO2 NPs differ between the two manufacturing methods [25,26]. Hence, the fates of precipitated and fumed SiO2 NPs in the body, which have not been clearly demonstrated yet, might be also different.
In the present study, we developed a cloud point extraction (CPE) approach to separate SiO2 NPs captured in Triton X-114 (TX-114)-based micelles from biomatrices. TX-114 is a cost-effective surfactant, and forms micelles at room temperature. CPE methods using TX-114, ethylenediaminetetraacetic acid, or 8-hydroxyquinoline were used to analyze trace NPs under aqueous conditions or minerals in tissues, resulting in their separation in the precipitated, surfactant-rich phase [27,28]. In this case, pretreatments to digest organic matrices were essentially required prior to CPE application. However, pretreatment with acids at high temperatures can decompose or dissolve NPs into small molecules or ions, thereby inhibiting NP detection as an intact particle form. No attempt has been made to detect SiO2 NPs in complex biosystems using a CPE approach. Optimization of the CPE method depending on matrix type, such as cell and tissue matrices, was carried out in order to determine the fates of SiO2 NPs in intestinal cells, intestinal barriers, and tissues after oral administration in rats. Two differently manufactured food additive SiO2 NPs—precipitated and fumed types—were used to investigate the effects of the manufacturing method on the particles’ fates in biological systems.

2. Results

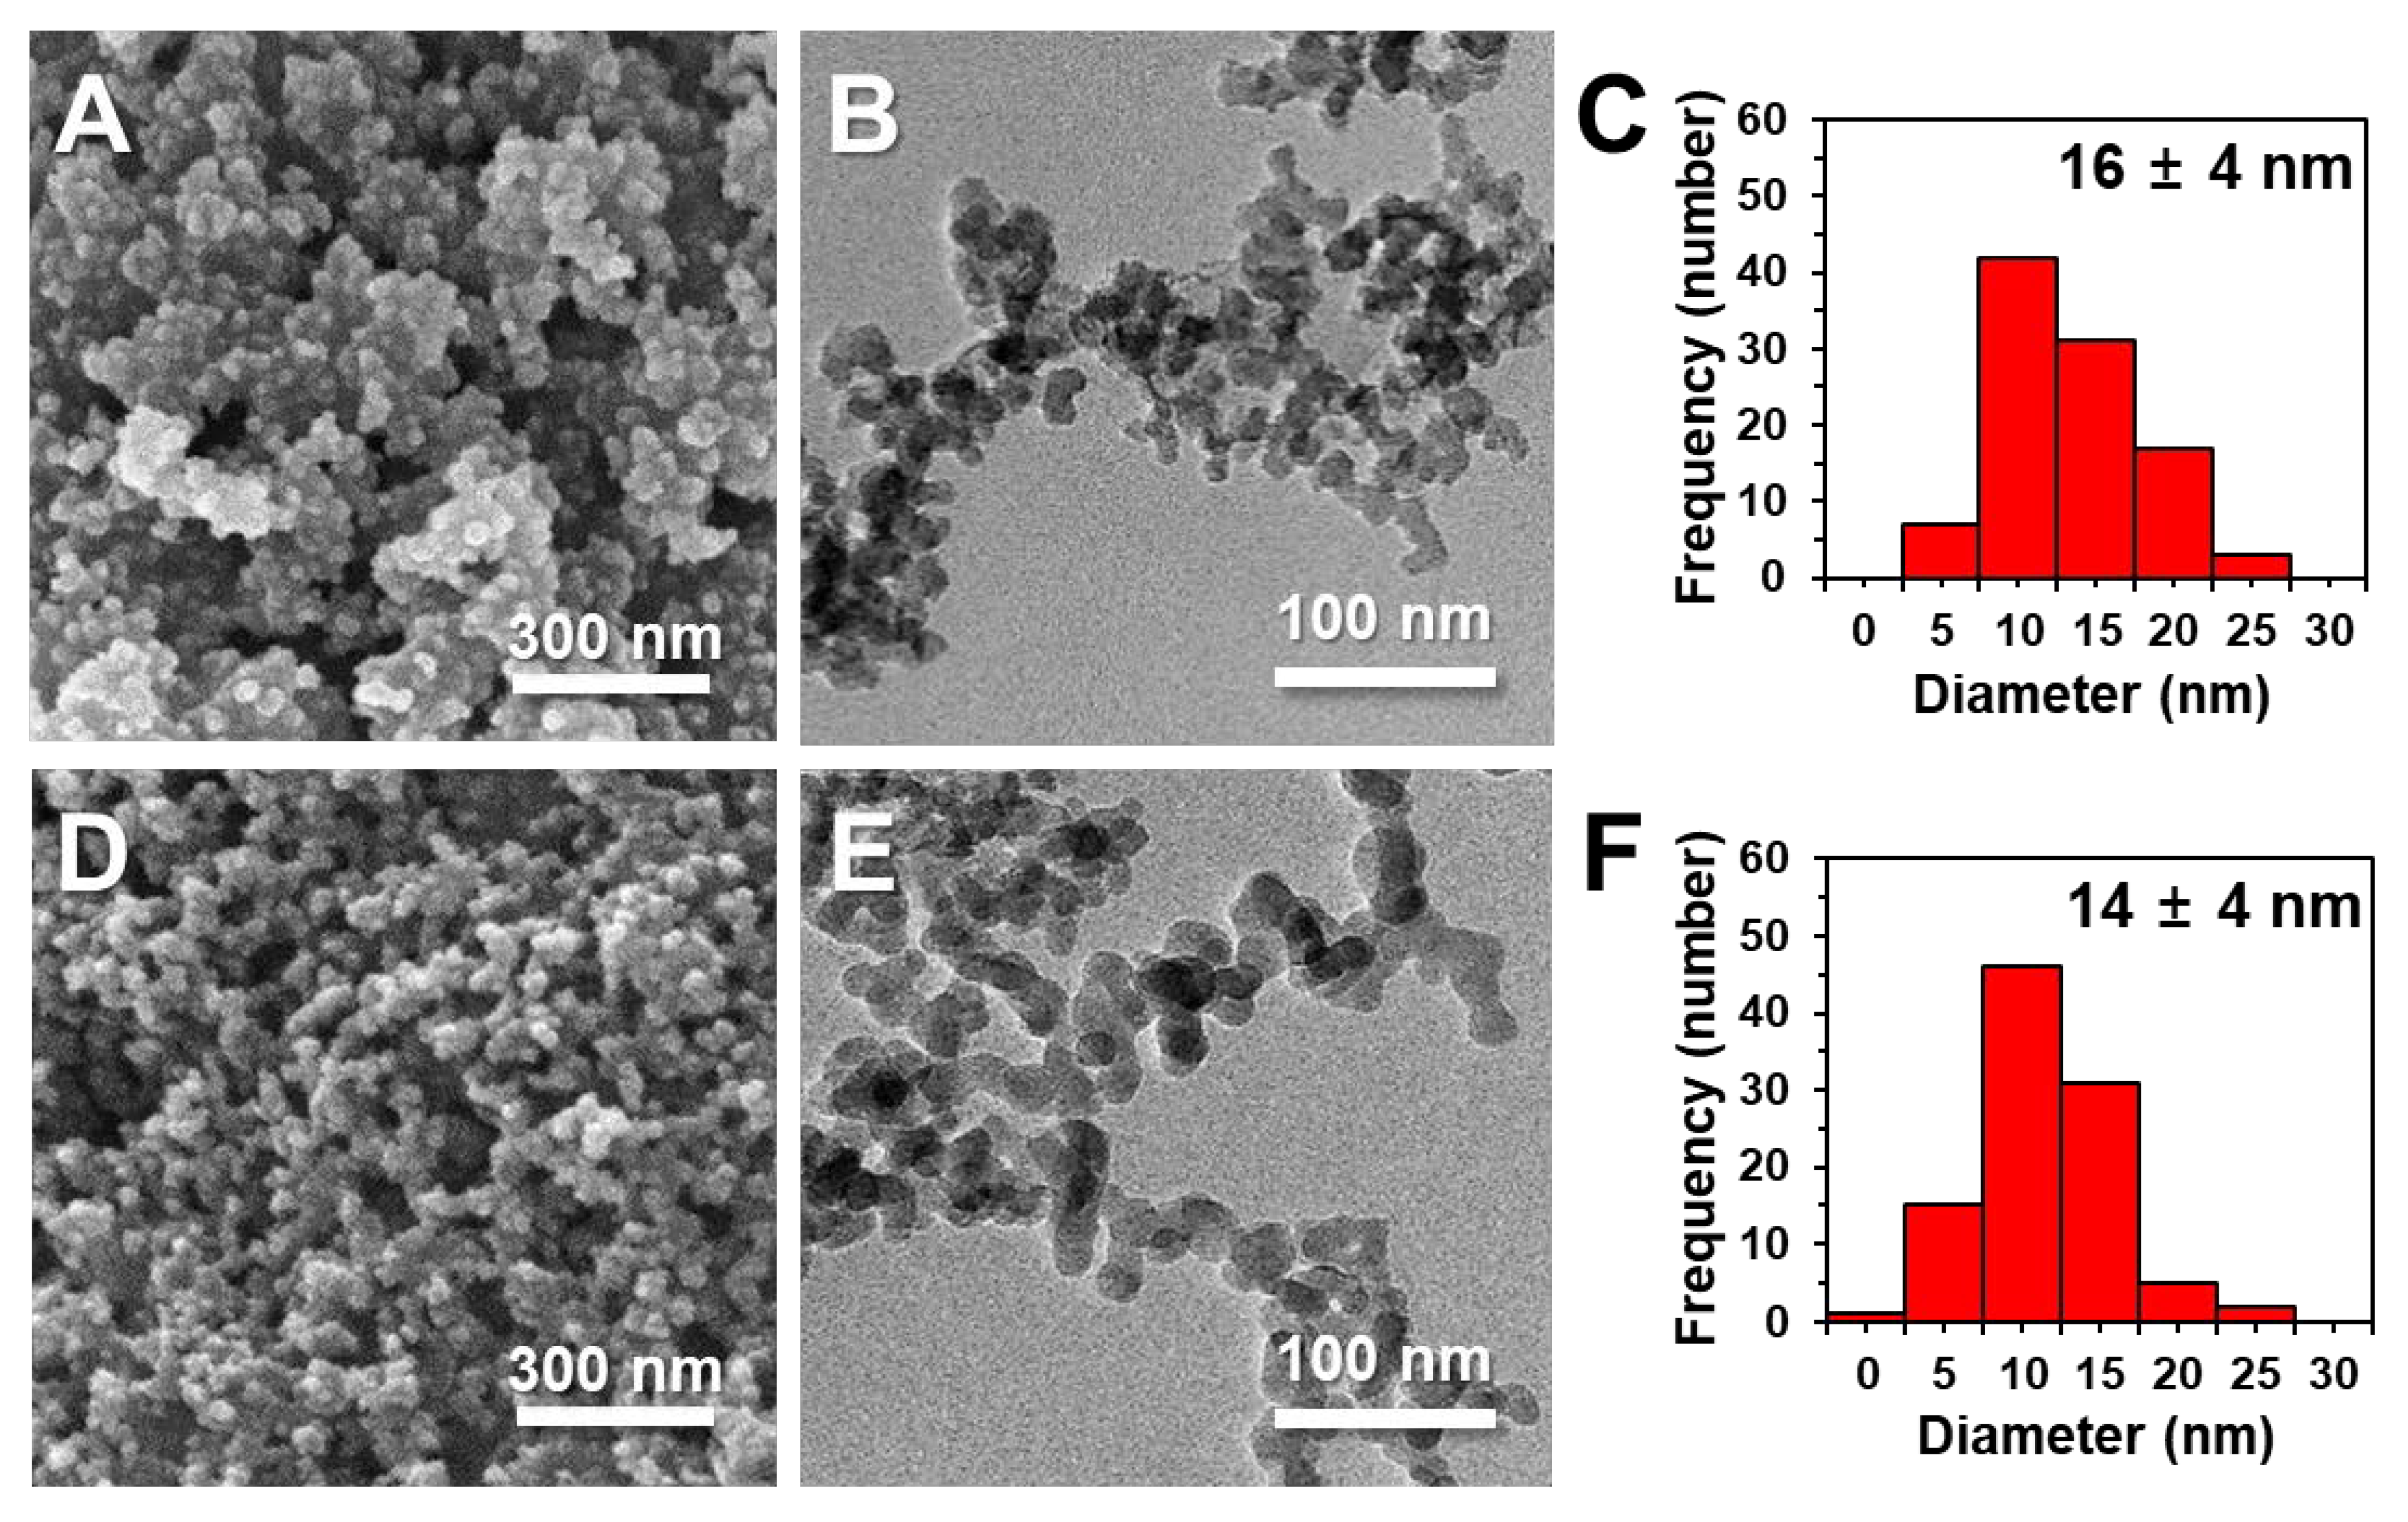
2.1. Characterization

The constituent particle sizes and size distributions of two differently manufactured SiO2 particles were measured via scanning electron microscopy (SEM) and transmission electron microscopy (TEM). Figure 1 demonstrates that the constituent particle sizes of precipitated and fumed SiO2 particles were 16 ± 4 and 14 ± 4 nm, respectively, with round shapes. No significant difference in average size between the two particles was found (p > 0.05). The dynamic light scattering (DLS) results in distilled water (DW) show that the particle fraction of fumed SiO2 was smaller (43% smaller than 100 nm) than that of precipitated SiO2 (96% larger than 200 nm), based on number % (Table 1). The Z-average diameters of precipitated SiO2 (375 ± 1 nm) were larger than those of fumed SiO2 (156 ± 1 nm), indicating that the former was more aggregated than the latter in DW. On the other hand, the specific surface areas of precipitated and fumed SiO2 particles, as measured by the Brunauer–Emmett–Teller (BET) method, were 167 ± 1 and 177 ± 1 m2/g, respectively (Table 1). The zeta potential values of both SiO2 particles as a function of pH are presented in Figure S1A, showing more negative charges for precipitated SiO2 than for fumed SiO2, at pH levels ranging from 2 to 5. The isoelectric points (IEPs) of precipitated SiO2 and fumed SiO2 were pH 1.53 and 1.92, respectively. The hydrodynamic diameters of SiO2 particles were also measured as a function of pH, showing high aggregation of both particles at low pH (below 3.0) (Figure S1B). Smaller hydrodynamic diameters were also found for fumed SiO2 than those for precipitated SiO2 at pH 2.0–7.4 (Figure S1B).

2.2. Method Validation and Quantitative Analysis in Cells or Tissue Matrices
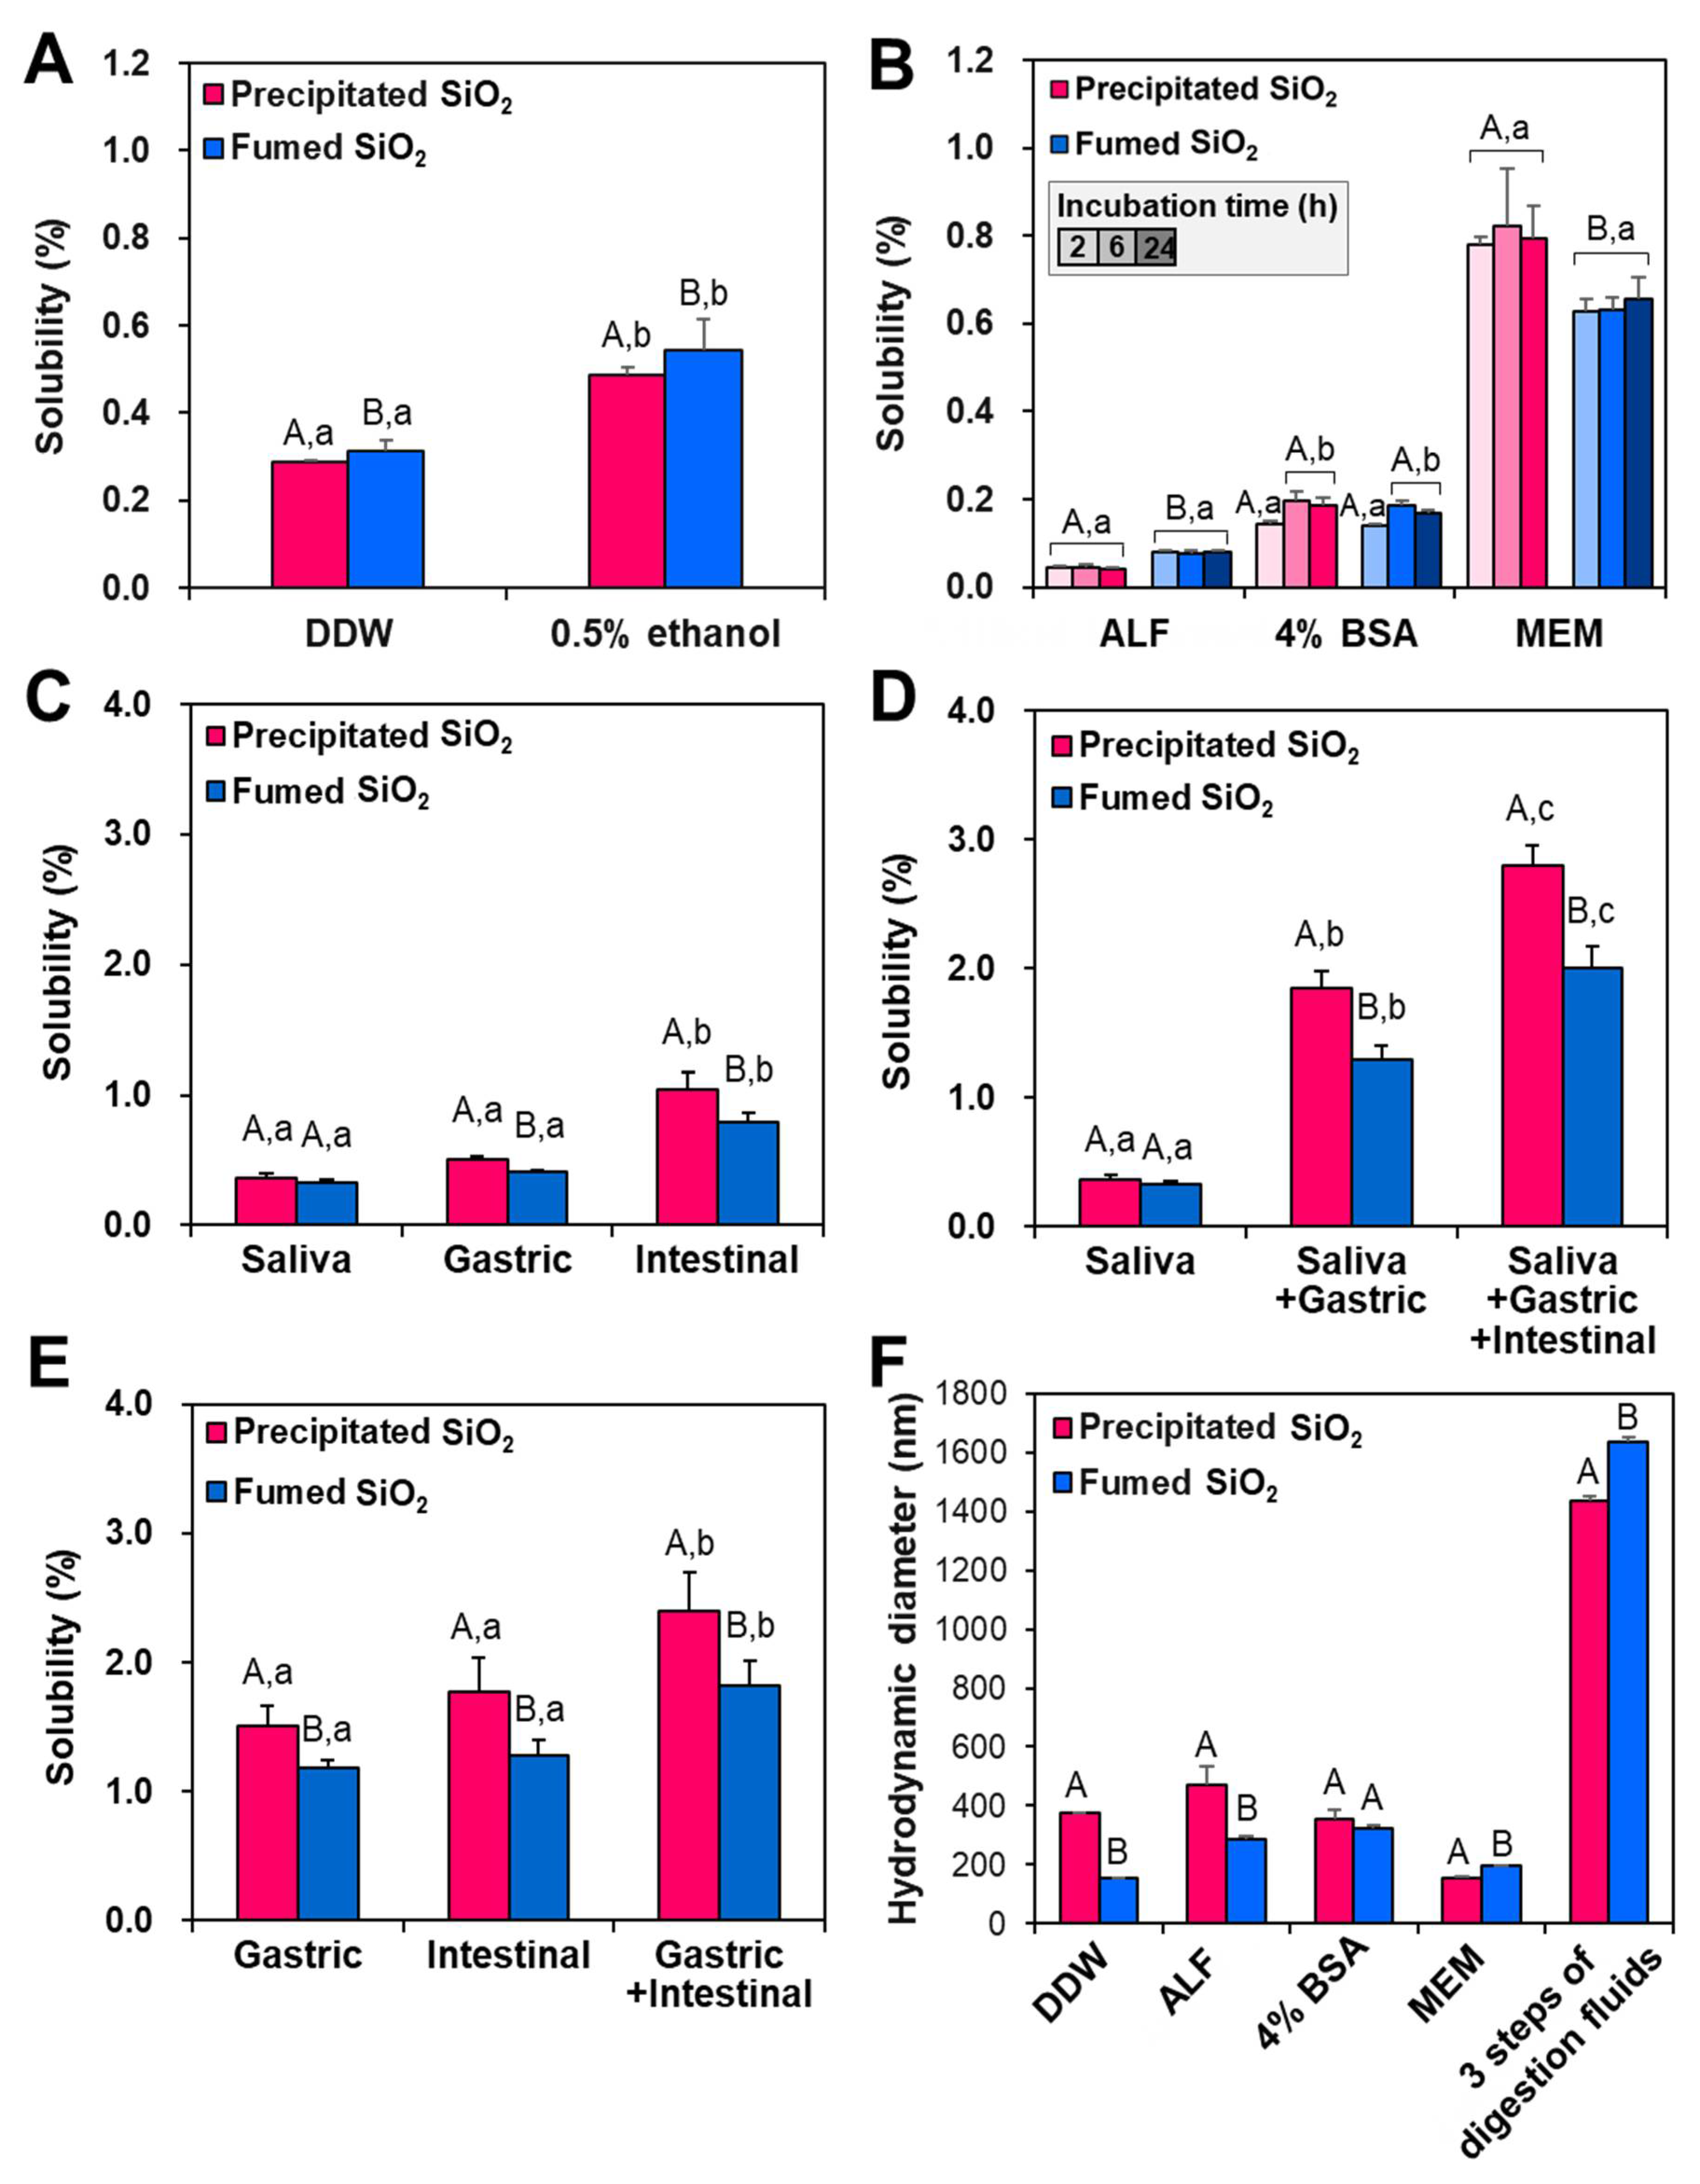
The accuracy and precision of the analytical procedure for SiO2 were explored using Si standard solution, precipitated SiO2, fumed SiO2, and SiO2 spiked with human intestinal Caco-2 cells or liver tissue, after predigestion with nitric acid (HNO3)/hydrofluoric acid (HF) in a microwave digestion system, followed by inductively coupled plasma atomic emission spectroscopy (ICP-AES) analysis. Indeed, HF is effective at dissolving SiO2 into Si ions [29], while HNO3 is widely applied to digest organic matrices [10,29]. Table 2 shows that the recoveries (%) of Si standard solution, pristine food additive SiO2, and SiO2 in spiked cells or liver tissues ranged from 96.1 to 105.0%, with repeatability (relative standard deviation, RSD%) of 1.54–5.12%. The limit of detection (LOD) and limit of quantification (LOQ) values of SiO2 in cells or tissue matrices were highly sensitive, showing 0.36–0.52 SiO2 μg/g of matrix and 1.08–1.58 SiO2 μg/g of matrix, respectively. The root-mean-square error (RMSE) values were also small, indicating good quality of the quantitative results obtained.

2.3. Solubility

The dissolution properties of both types of SiO2 particles were evaluated in distilled and deionized water (DDW) and 0.5% ethanol solution according to Organization for Economic Co-operation and Development (OECD) test guideline (TG) 105 [30]. The solubility of precipitated and fumed SiO2 particles in DDW was 0.29 and 0.31%, respectively, and slightly increased in 0.5% ethanol solution (0.49 and 0.54% for the former and the latter, respectively) (Figure 2A). Extremely low dissolutions (< 0.1%) of both particles were found in artificial lysosomal fluid (ALF), with the same tendency obtained in DDW and ethanol, and the solubility did not increase even after 24 h (Figure 2B). The solubility of fumed SiO2 was significantly higher than that of precipitated SiO2 in DDW (Figure 2A), 0.5% ethanol solution (Figure 2A), and ALF (Figure 2B). On the other hand, the solubility of both particles was ~0.19% at 6–24 h in 4% bovine serum albumin (BSA) solution, without significant differences between the two types of particles (p > 0.05) (Figure 2B). The solubility of precipitated SiO2 and fumed SiO2 increased to ~0.81 and ~0.65%, respectively, in minimum essential medium (MEM), showing significantly higher solubility for the former than the latter (p < 0.05) (Figure 2B). Low solubility of SiO2 particles was also measured in in vitro digestion fluids—such as saliva, gastric fluids, and intestinal fluids—and the highest solubility was found in the intestinal fluid, compared with saliva or gastric fluid (Figure 2C). When three consecutive steps of digestion fluids, such as saliva followed by gastric and intestinal fluids, were applied, the solubility of precipitated SiO2 and fumed SiO2 was 2.8 and 2.0%, respectively, with significant difference (p < 0.05) (Figure 2D). The same tendency was also obtained using ex vivo rat-extracted gastrointestinal (GI) fluids, showing 2.4 and 1.8% solubility for precipitated SiO2 and fumed SiO2, respectively (Figure 2E).
The hydrodynamic diameters of SiO2 particles were also checked in DDW, ALF, 4% BSA solution, MEM, and three consecutive steps of in vitro digestion solutions, where their solubility was evaluated. Figure 2F shows that the hydrodynamic diameters of precipitated SiO2 were significantly larger than those of fumed SiO2 in DDW and ALF, whereas fumed SiO2 had statistically larger hydrodynamic diameters than precipitated SiO2 in MEM and the three consecutive steps of digestion solutions. No statistical difference in the hydrodynamic diameters between the two types of particles was found in 4% BSA solution (p > 0.05). The smallest and largest hydrodynamic diameters of SiO2 particles were measured in MEM and the three steps of digestion fluids, respectively.

2.4. Optimization of CPE for SiO2

The CPE for two differently manufactured types of SiO2 particles was optimized using TX-114 at pH 3.0. The micelle formation of particles in TX-114 easily occurs at the IEP, but a slightly greater pH than the IEPs (1.53 and 1.92 for precipitated SiO2 and fumed SiO2, respectively, Figure S1) was chosen. Indeed, the addition of sodium chloride (NaCl) during the CPE process at a pH higher than the IEP elevates the zeta potential values of NPs [31], which reduces the electrostatic repulsion between negatively charged NPs in TX-114-based micelles, thereby resulting in a net zero interaction and enhancing phase separation [31,32]. Hence, the particles as intact forms are precipitated in TX-114-based micelles, and Si ions released from the particles are present in the supernatants after centrifugation. As shown in Figure 3A, the hydrodynamic diameters of two differently manufactured SiO2 types in TX-114-rich precipitates obtained via CPE were similar to those of pristine SiO2, without significant differences (p > 0.05). This result was obtained after the digestion of organic matrices with HNO3 and 1 mL of hydrogen peroxide (H2O2). The ICP-AES analysis shows that the recoveries (%) as intact particle forms were 96.3 and 92.2% for precipitated SiO2 and fumed SiO2, respectively (Figure 3B). Meanwhile, the concentrations of Si ions released from the particles during the CPE procedure, found in the supernatants, were extremely low, showing 0.9 and 0.6% for precipitated SiO2 and fumed SiO2, respectively. Total detected Si levels in the precipitates and supernatants by CPE were 96.9 and 92.8% for precipitated SiO2 and fumed SiO2, respectively.
The CPE was also optimized with SiO2-spiked Caco-2 cells or liver tissue. In this case, we focused on the effect of ultrasonic homogenization—which was used to lyse the cells or tissues—on the inert size distribution of NPs. Figure 4 demonstrates that the recoveries (%) of both SiO2 particle forms, obtained via CPE in Caco-2 cells or liver tissue, ranged from 91.6 to 97.8%, although 1.5–6.7% of Si ions were found to be released from the particles after the CPE and lysis procedure. Slightly higher Si releases from the particles in SiO2-spiked liver cells than those in SiO2-spiked Caco-2 cells were also observed after CPE and lysis.

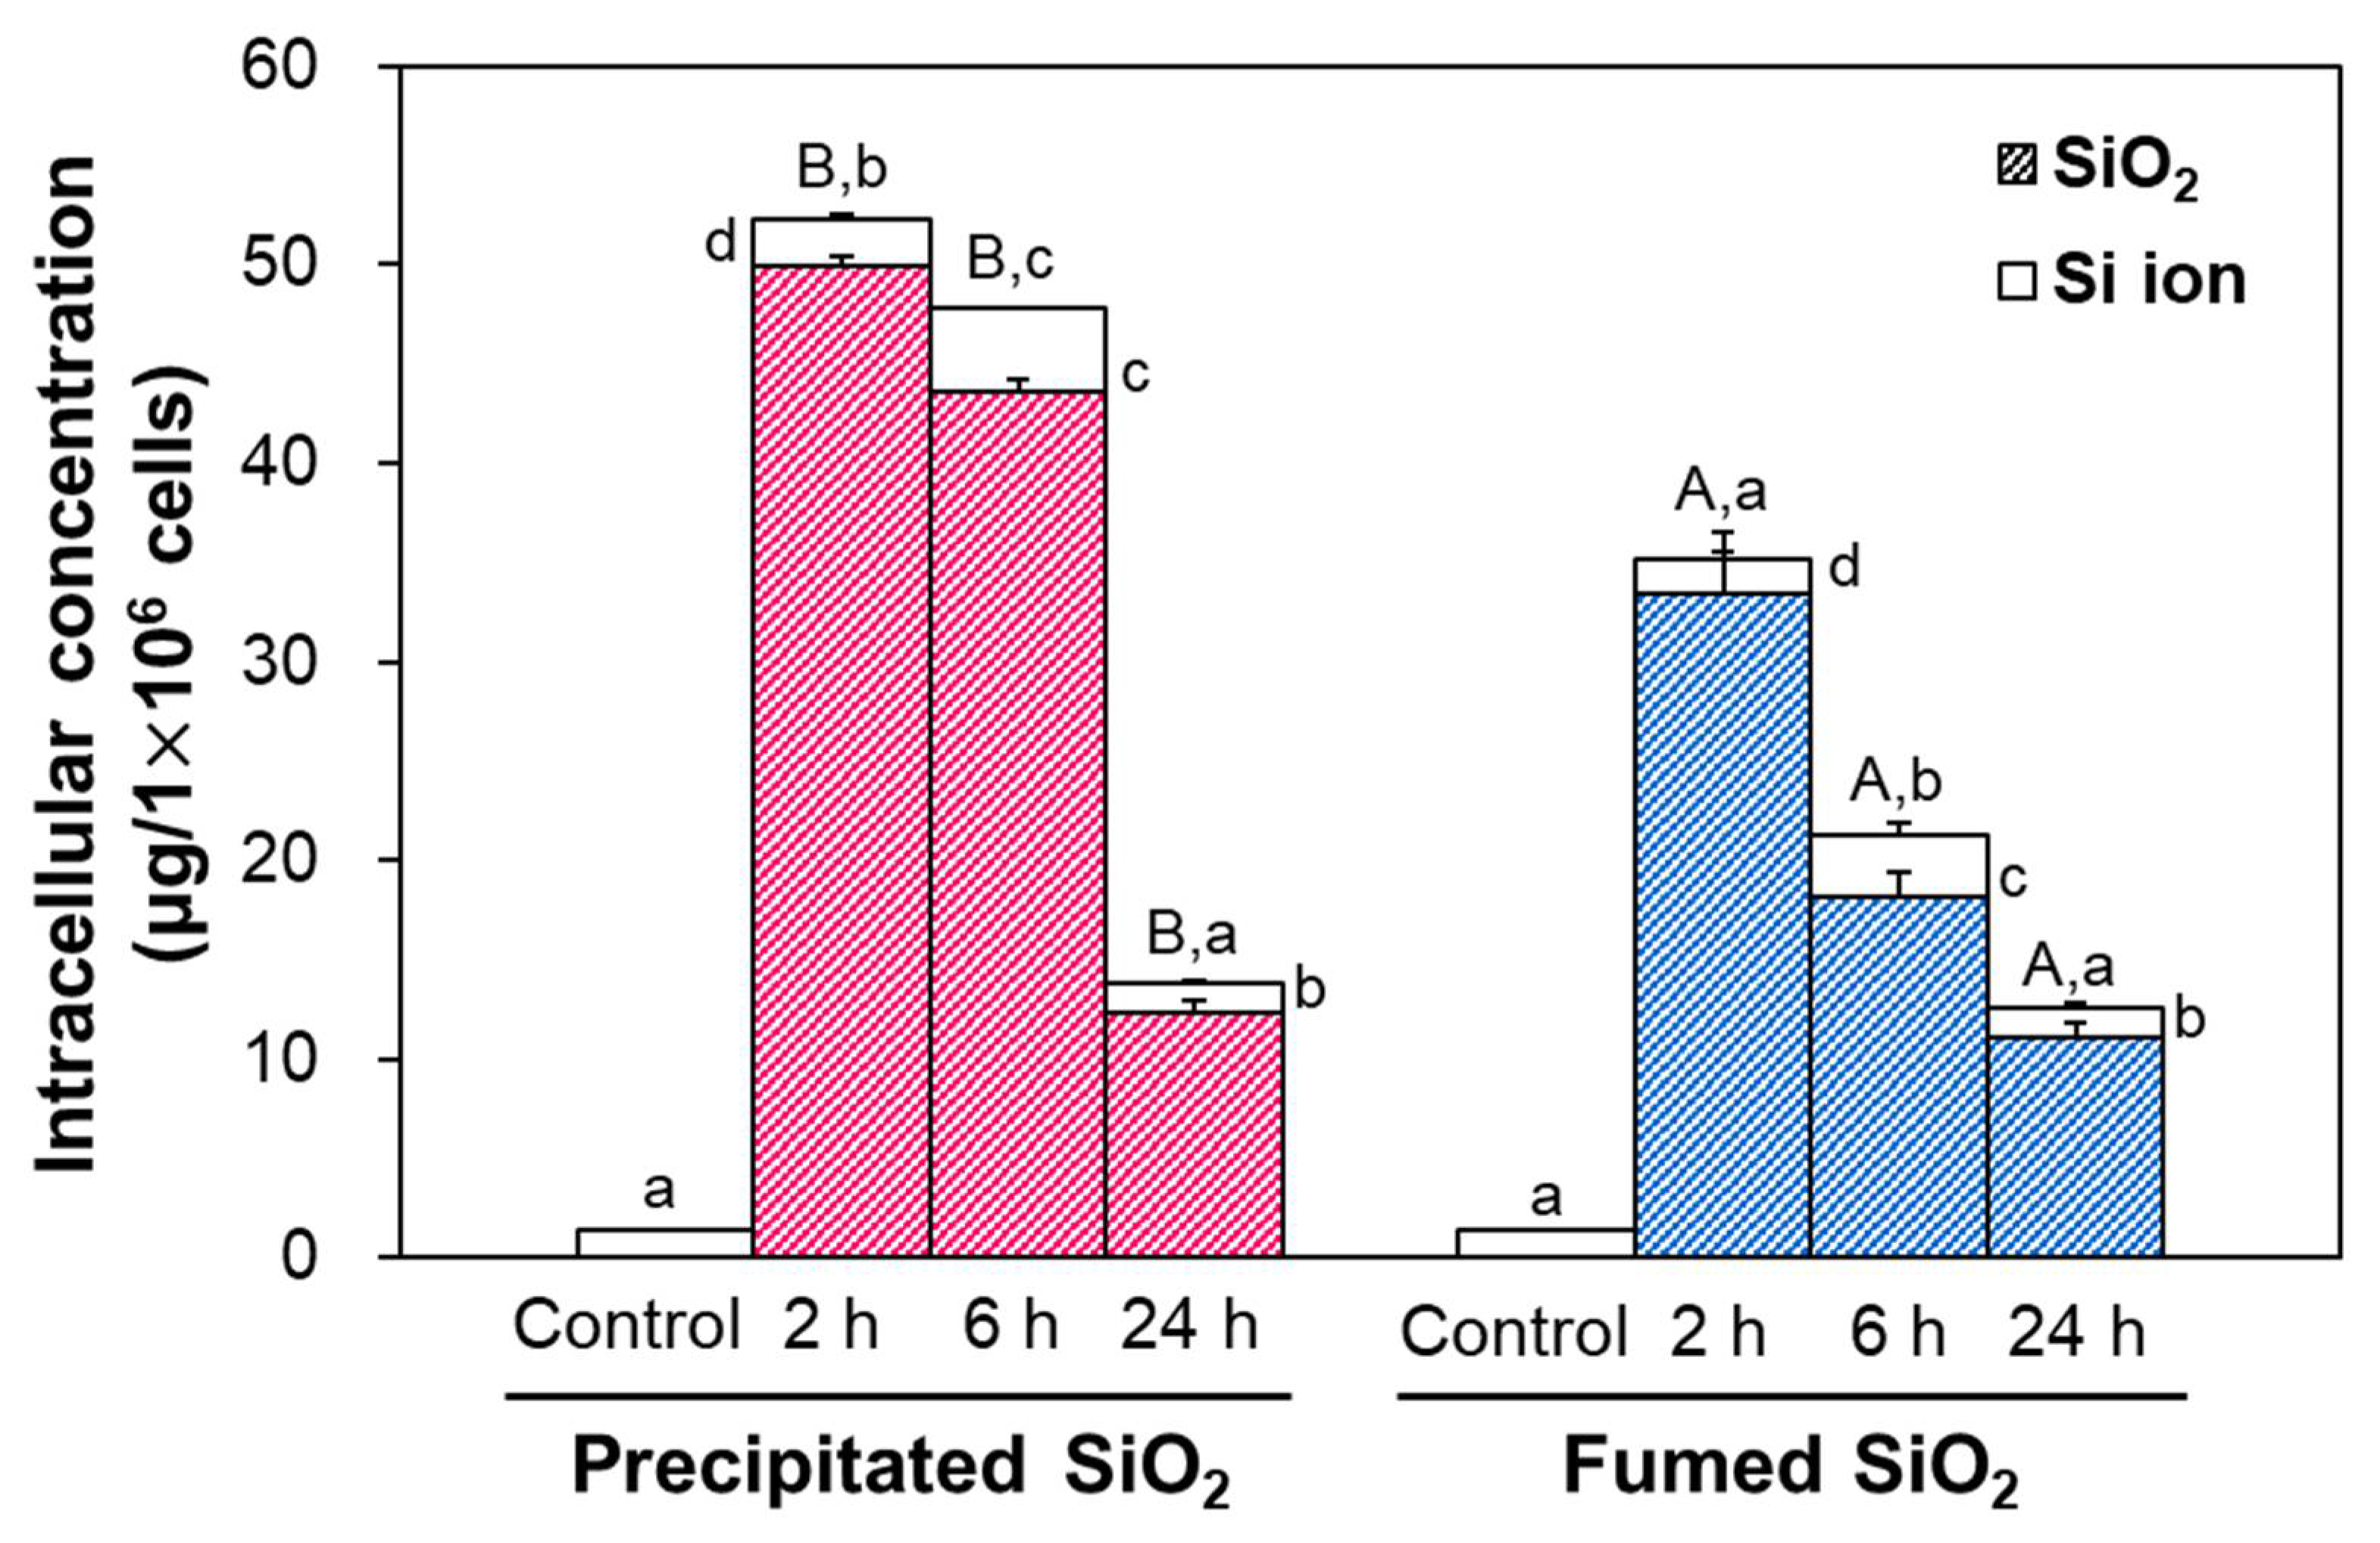
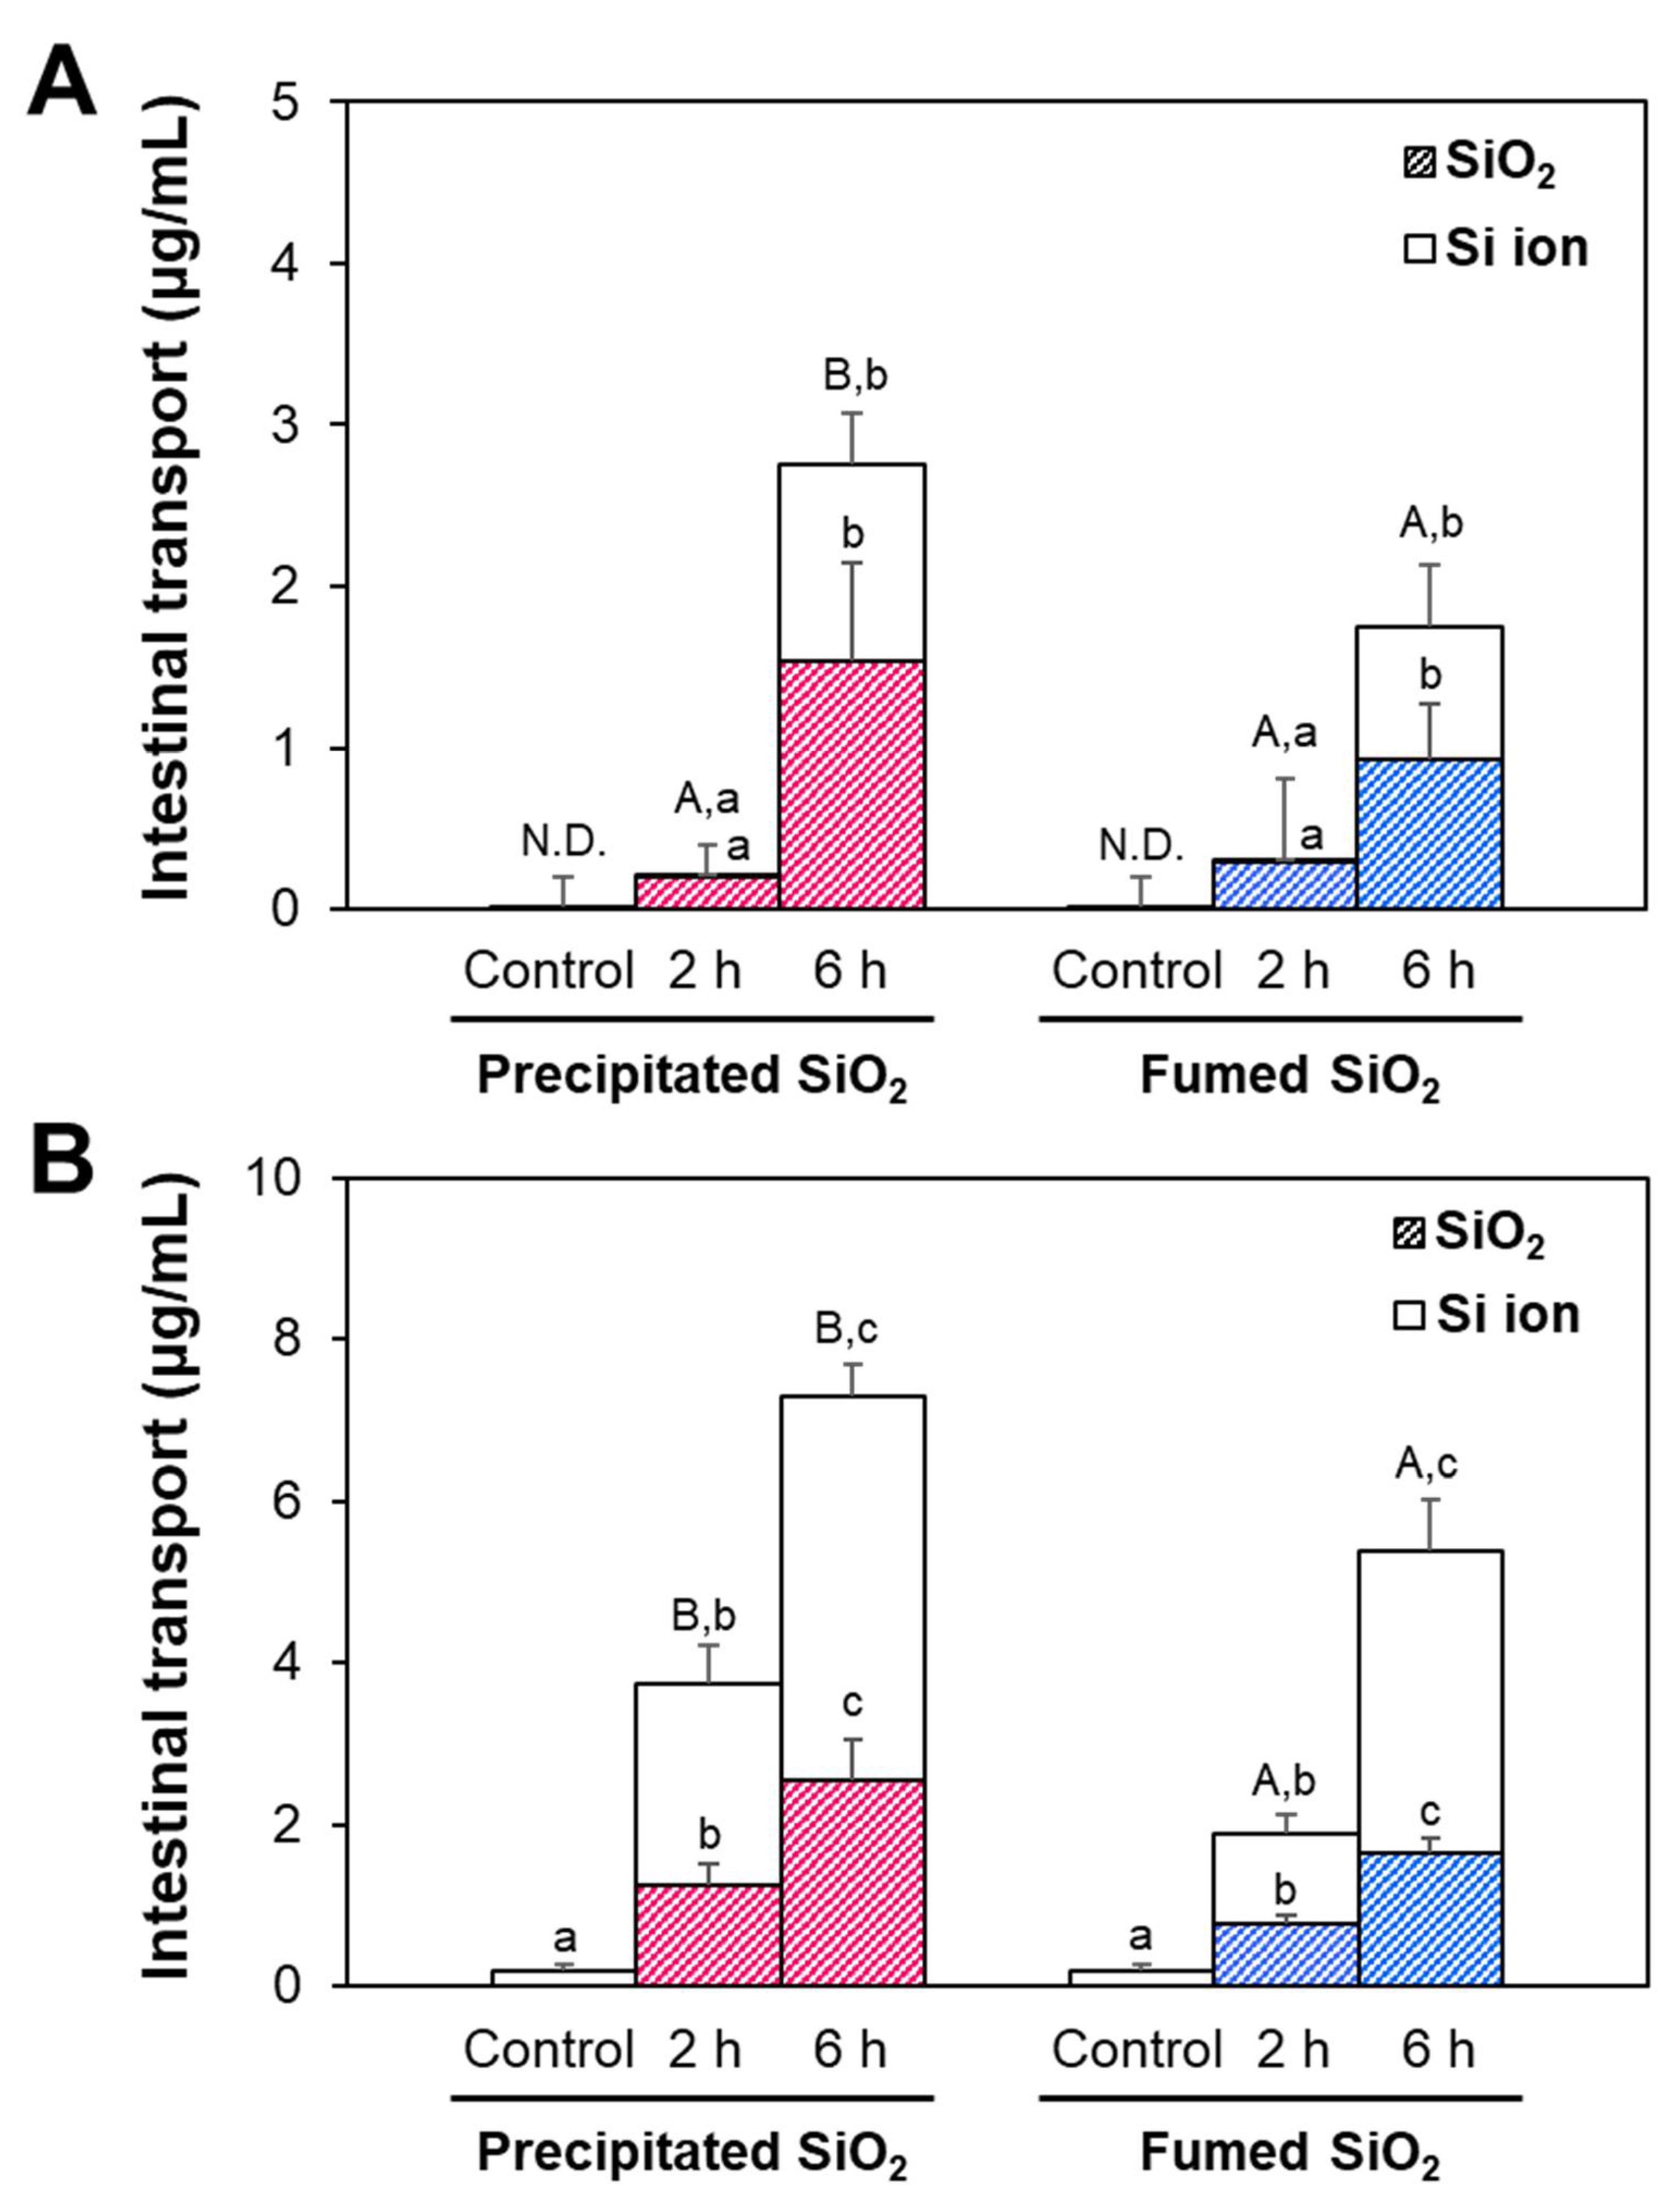
2.5. Intracellular Uptake and Intestinal Transport Fates of SiO2 Particles

The uptake and intracellular fates of two differently manufactured types of SiO2 particles were evaluated in Caco-2 cells after incubation for 2, 6, and 24 h, and determined by applying the optimized CPE. The highest uptake amounts of the two differently manufactured SiO2 particle types were detected at 2 h post-incubation, and decreased with incubation time (Figure 5). Significant differences in uptake amount between precipitated SiO2 and fumed SiO2 were found, showing higher uptake of the former than the latter (p < 0.05). SiO2 particles inside cells were determined via CPE to be primarily present in particle form, regardless of incubation time or manufactured type. About 95% of both types of SiO2 was found in particle form at 2 h, and this figure decreased to ~88% at 24 h, without significant differences between the manufactured types (p > 0.05), whereas the proportion of Si ions increased as incubation time increased.
The intestinal transports and fates of SiO2 particles were evaluated using in vitro 2D Caco-2 monolayer and 3D follicle-associated epithelial (FAE) models. Caco-2 monolayer and FAE models represent the intestinal tight junction barrier and microfold (M) cells in Peyer’s patches, respectively. The permeability of Lucifer yellow—a fluorescent dye that is only transported paracelluarly—was 2.3 and 2.4% in Caco-2 monolayer and FAE models, respectively, indicating well-established intestinal barriers [33,34]. The results show that the two types of particles were determined to be transported through both Caco-2 monolayer and M cells, but more massive transports by M cells were found (Figure 6). Total transported amounts of both kinds of SiO2 particles increased as incubation time increased, and significantly higher transport of precipitated SiO2 compared with fumed SiO2 was found in both models. Transport amounts (%) of precipitated SiO2 and fumed SiO2 at 6 h were ~1.0 and ~0.7% by Caco-2 monolayers, and ~2.1 and ~1.5% by the FAE model, respectively. It is worth noting that the recoveries (%) of SiO2 particles in both apical and basolateral sides ranged from 98.7 to 101.6% in all cases, supporting the accuracy of the analyzed transport levels (Table S1).
When the fate of SiO2 was determined by CPE, most SiO2 particles were present as particle forms at 2 h, and the portion of Si ions increased up to ~49% at 6 h in a Caco-2 monolayer model, regardless of manufactured type. On the other hand, ~65% of Si ions from precipitated SiO2 and fumed SiO2 were found at 2 and 6 h in an FAE model.

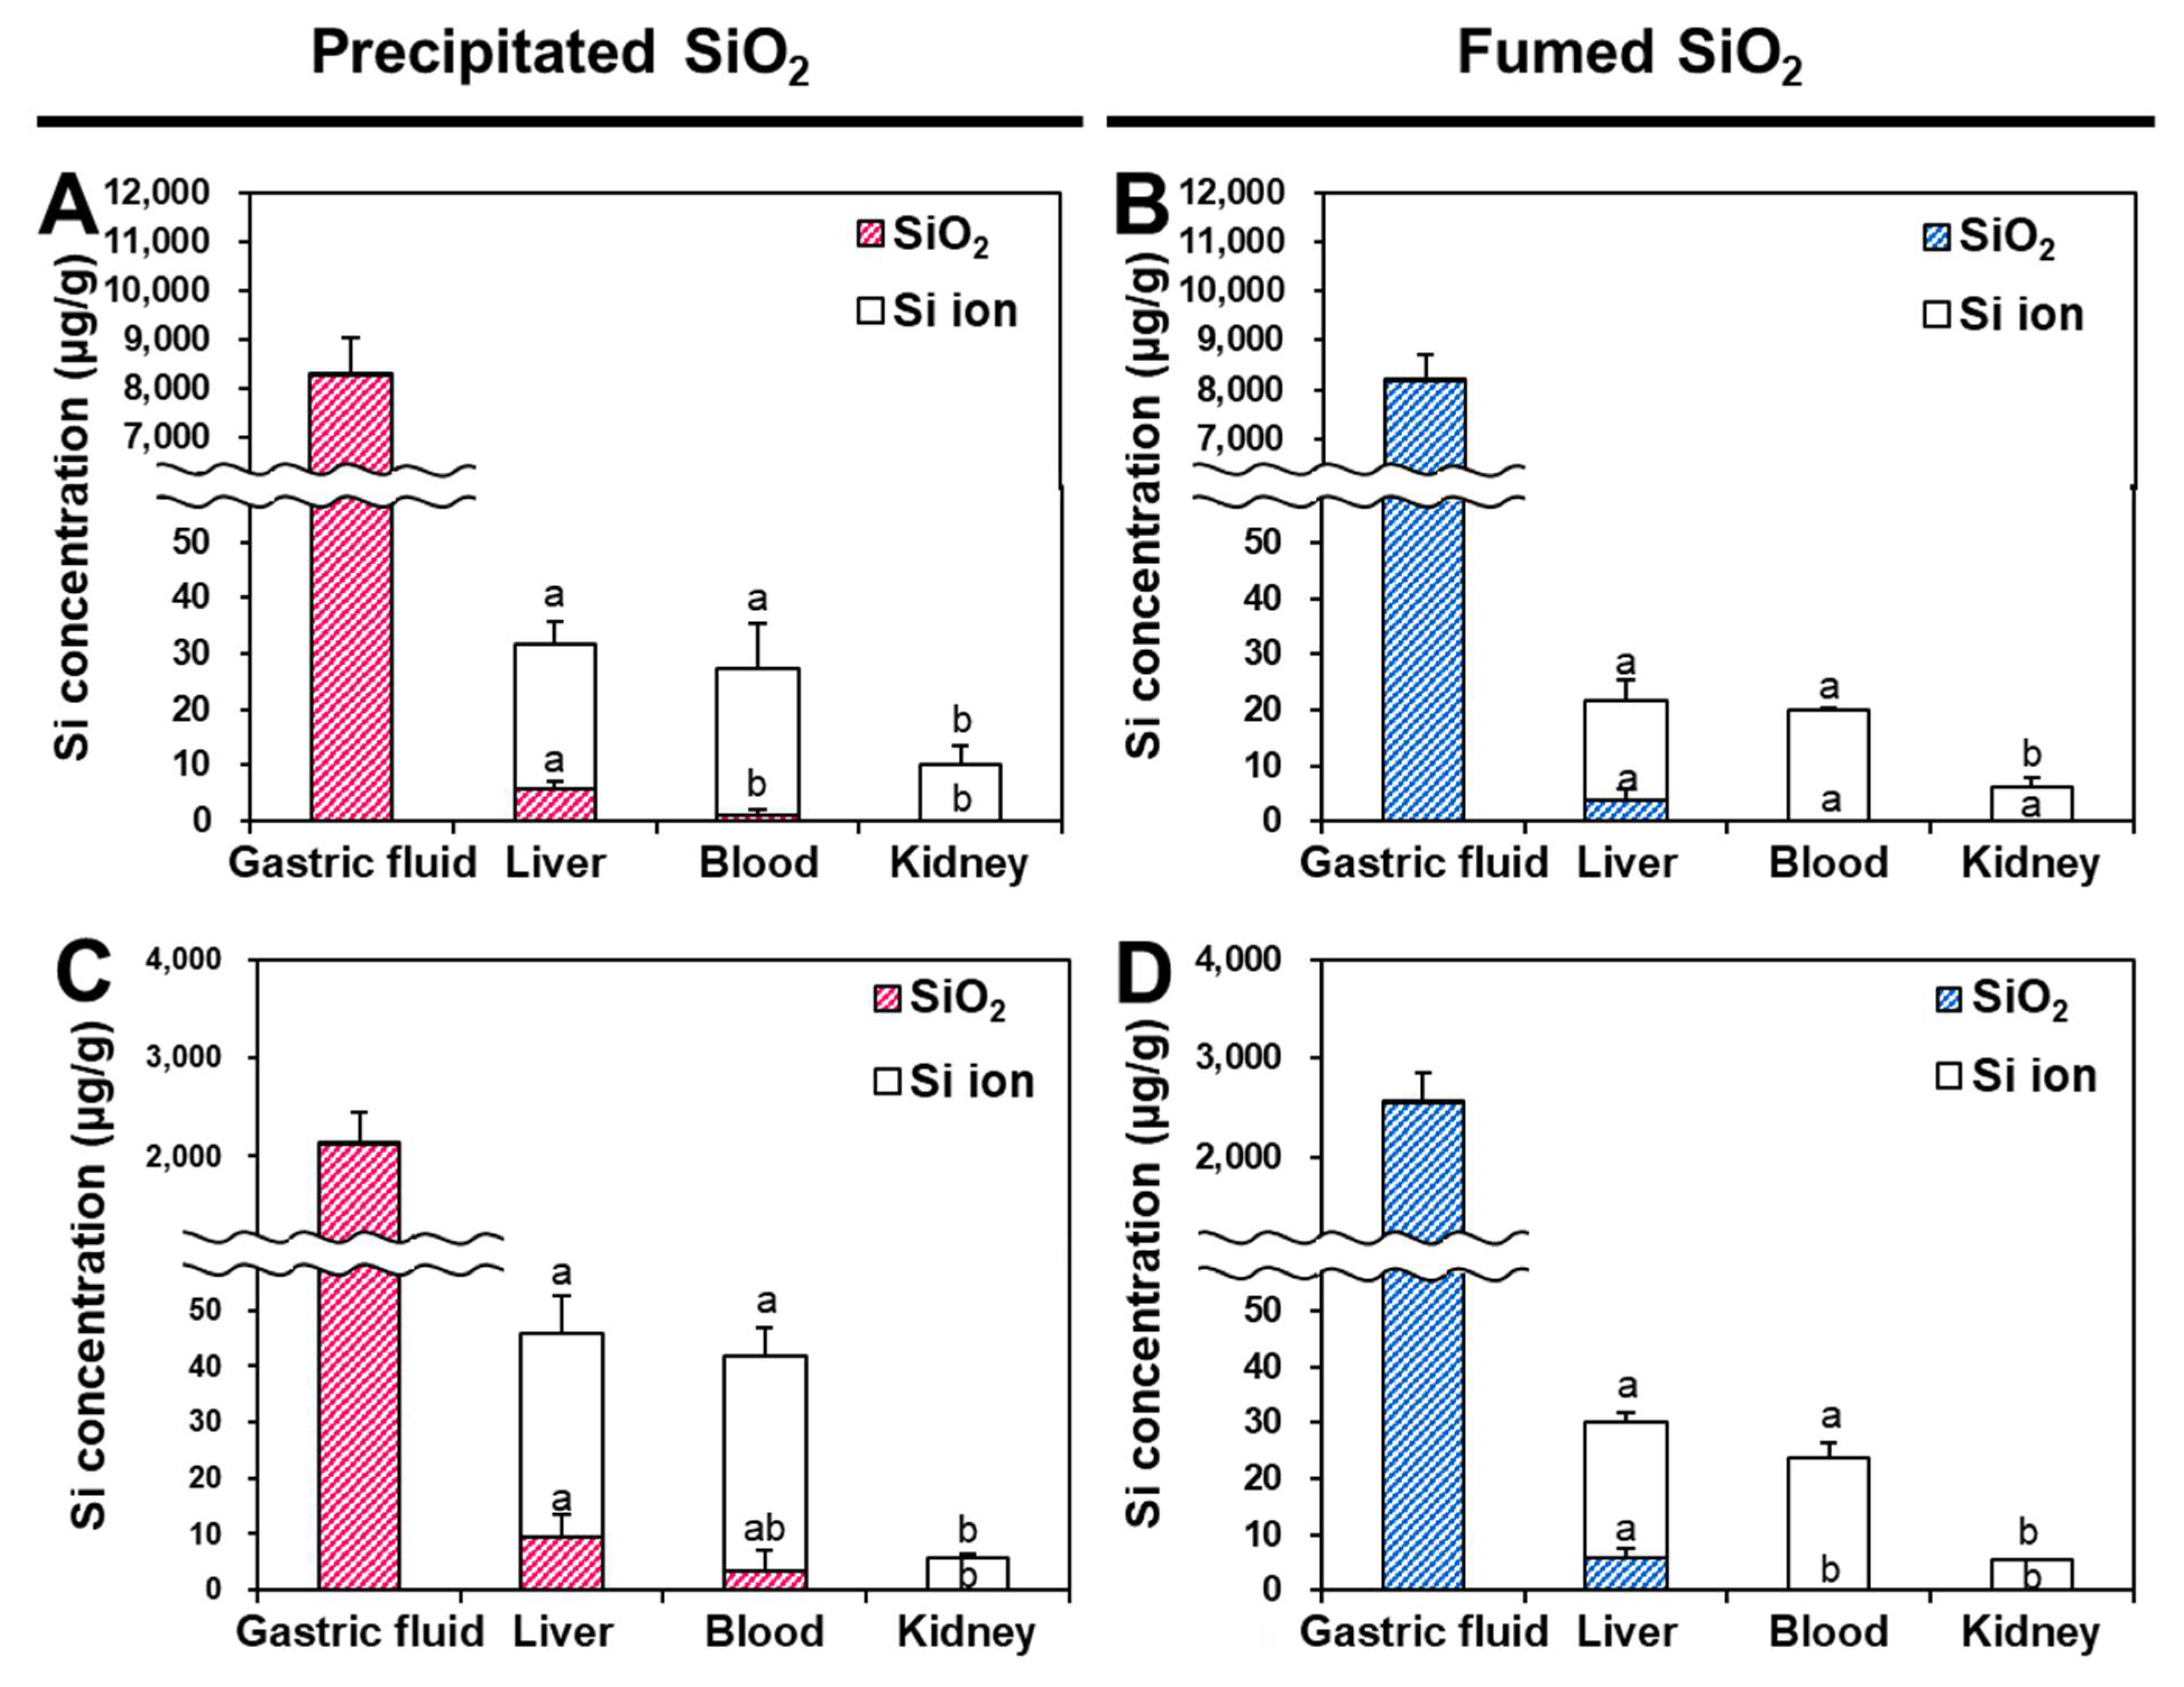
2.6. Oral Distribution and Fates of SiO2 Particles in Tissues

The distribution and fates of SiO2 particles were evaluated after a single-dose oral administration (300 or 2000 mg/kg) in rats. The doses were chosen based on the previous report, showing that the NOAEL of SiO2 NPs was more than 2000 mg/kg [18]. Two different doses (300 and 2000 mg/kg) were used to investigate whether the dose affects the oral particle/ionic forms of SiO2 particles. The timepoints for tissue distribution after oral administration of 300 or 2000 mg/kg were set at 2 and 10 h, based on our previous research [35,36]. The CPE model developed was applied to the gastric fluid, liver, blood, and kidneys after oral administration in rats, and Si levels were analyzed in the precipitates and supernatants via CPE. As shown in Figure 7, extremely low amounts (less than 0.2%) of SiO2 particles were dissolved in the gastric fluid, with no significant differences between administered doses or manufactured type (p > 0.05). When SiO2 particles were distributed in the liver through intestinal and hepatic portal vein transport, the majority of the fates (~81%) of precipitated SiO2 and fumed SiO2 were ionic forms, regardless of manufactured type. Moreover, particulate forms were detected in the liver in a dose-dependent manner, based on more particle forms being detected at 2000 mg/kg than at 300 mg/kg. When SiO2 particles were absorbed into the bloodstream, greater proportions of both types of SiO2 were present as ionic forms, and then completely dissolved into Si ions in the kidneys. A slightly greater proportion of particulate forms of precipitated SiO2 compared with fumed SiO2 was found in the blood. Almost 100% of fumed SiO2 was present in ionic forms after entering systemic circulation and distribution in the kidneys.

3. Discussion

The biological fate and toxicity of NPs can differ according to their physicochemical properties, which are mainly related to different manufacturing methods. The results of physicochemical characterization of the most widely applied food additive SiO2 particles—precipitated, and fumed forms—demonstrate different characteristics; the constituent particle sizes of precipitated SiO2 and fumed SiO2 were similar, with no significant difference (p > 0.05, Figure 1), but present as aggregates, as shown in the SEM/TEM images (Figure 1) and DLS results (Table 1). The hydrodynamic diameters of fumed SiO2 in DW were much smaller than those of precipitated SiO2, as indicated by the high proportion of the fraction less than 100 nm and small Z-average size, contributing to high BET surface area for fumed SiO2 (Table 1). The zeta potential values of both particles were negative, but slightly more negative charge was found for precipitated SiO2 compared with fumed SiO2, leading to a lower IEP for the former (pH 1.53) than for the latter (pH 1.92) (Figure S1).
The solubility of SiO2 particles differed based on their manufacturing method and fluid type. Fumed SiO2 had significantly higher dissolution properties in DDW, 0.5% ethanol, and ALF than did precipitated SiO2, and the solubility increased in the order of ALF < 4% BSA solution < DDW < 0.5% ethanol < MEM < digestion fluids, in all cases (Figure 2). On the other hand, the solubility of precipitated SiO2 was higher than that of fumed SiO2 in MEM, in vitro digestion fluids, and ex vivo rat-extracted GI fluids (Figure 2B–E). This discrepancy can be explained by the DLS results obtained in each fluid tested, showing larger hydrodynamic diameters of precipitated SiO2 in DDW and ALF, but smaller diameters in MEM and the three steps of digestion solutions, compared to fumed SiO2 (Figure 2F). Hence, aggregation of SiO2 under test conditions can result in low solubility, related to its small specific surface area and low reactivity. The different solubility depending on fluid type can be explained by several factors; interaction between SiO2 and various components of MEM—such as 10% fetal bovine serum (FBS), amino acids, vitamins, and salts—can increase the solubility to some extent, as observed by high dissolution in MEM (Figure 2B). Indeed, the role of cell culture medium as a dispersant of NPs has been well reported [37,38], which is consistent with the smallest hydrodynamic diameters of SiO2 particles being observed in MEM (Figure 2F). The effect of 4% BSA—which reflects albumin level in the plasma [39]—on solubility seems to be minor when the solubility between DDW and 4% BSA solution is compared (Figure 2A,B). It is interesting to note that the highest solubility of SiO2 particles was found in the three consecutive steps of digestion fluids, where their high aggregation was found (Figure 2D–F); this result may be related to the effect of pH, as demonstrated by the high aggregation of SiO2 particles at acidic pH due to their IEPs at low pH (Figure S1A). It was demonstrated that electrostatic repulsive forces between SiO2 particles are minimized, whereas van der Waals attractive forces increase, at the IEP—inducing aggregation [40], which is also seen in Figure S1B. High dissolution properties of SiO2 under alkaline conditions, as observed in intestinal fluid (Figure 2C), can contribute to its high solubility in three steps of digestion fluids, where duodenal and bile conditions are reflected (~pH 8.2, Table S3) [41]. Meanwhile, the higher solubility of precipitated SiO2 particles than of fumed SiO2 particles is in good agreement with the report demonstrating that precipitated SiO2 has more silanol groups (Si-OH) per unit surface than fumed SiO2, resulting in high solubility [26]. It is worth noting that the solubility in an in vitro three consecutive steps of digestion model (Figure 2D) was highly correlated with ex vivo results obtained using rat-extracted GI fluids, showing about 2.4 and 1.8% solubility for precipitated SiO2 and fumed SiO2, respectively (Figure E). These results suggest that most SiO2 particles are not dissolved, and present as particle forms under GI conditions.
All validation parameters of quantitative analytical methods for SiO2 particles in biomatrices—such as linearity, low RMSE, high recovery (%), low repeatability (RSD %), and sensitive LOD and LOQ values—reveal the accuracy and precision of the quantitative methods, including digestion procedure and ICP-AES analysis (Table 2). This is also supported by the high recoveries (93–102%) of total Si levels from Si ions and SiO2 particles obtained via CPE (Figure 3 and Figure 4). The reliability of the CPE to detect intact SiO2 was confirmed by the statistically similar hydrodynamic diameters of pristine SiO2 before and after CPE (Figure 3A), and by the high recoveries (92–96%) as particle forms in TX-114-based precipitates obtained via CPE (Figure 3B). The recoveries of SiO2 particles in the precipitates obtained by CPE ranged from 92 to 98% in SiO2-spiked biomatrices (Caco-2 cells and rat liver) (Figure 4), supporting the efficacy of the CPE method. Slightly increased levels of Si ions (3.7–6.7%) were detected in SiO2-spiked liver (Figure 4B), probably resulting from the ultrasonic homogenization process for tissue lysis prior to CPE application. Hence, the tissue fates of SiO2 after oral administration were evaluated considering the proportions of Si ions versus SiO2 in SiO2-spiked liver, obtained via CPE (Figure 4B).
The intracellular fates of precipitated SiO2 and fumed SiO2 in Caco-2 cells, determined by CPE, were mainly particle forms, even after 24 h of incubation, but ~95% of particle forms at 2 h decreased to ~89% at 24 h, without significant differences between the manufactured types (p > 0.05, Figure 5), suggesting slow decomposition of SiO2 inside cells. The uptake amounts of both particles decreased as incubation time increased, implying possible exocytosis or excretion of the decomposed particles. Meanwhile, the uptake amounts of precipitated SiO2 were significantly higher than those of fumed SiO2 at 2–24 h, which seems to be associated with the smaller hydrodynamic diameters of the former than the latter in the three steps of in vitro digestion solutions (Figure 2F). Indeed, intracellular organelles such as endosomes and lysosomes have acidic pH and many enzymes for the degradation of molecules [42,43]. This result suggests that small particles can be more easily and massively taken up by cells [44]. Indeed, energy-dependent endocytosis of SiO2 particles has been well reported [45]. The intestinal transport amounts of precipitated SiO2 through the Caco-2 monolayer and M cells were also significantly higher than those of fumed SiO2 (Figure 6), indicating efficient intestinal transport of SiO2 with small hydrodynamic diameters. Total transport (%) of precipitated SiO2 and fumed SiO2 by both the Caco-2 monolayer and FAE models at 6 h was ~3.0 and ~2.2%, respectively (Table S1), which is in good agreement with our in vivo oral absorption [46]. It should be noted that energy-dependent transport of SiO2 particles through intestinal barriers has been demonstrated [8,46]. However, intestinal transport fates of SiO2 were different depending on the types of intestinal transport models. The two differently manufactured particle types were mainly present as particles at 2 h, and ~51% particle forms were found at 6 h in a Caco-2 monolayer model (Figure 6A), indicating slow dissolution during transportation through intestinal tight junction barriers. Conversely, about 63% and 67% of Si ions were detected at 2 and 6 h, respectively, in the FAE model (Figure 6B), implying relatively fast dissolution of SiO2 during intestinal transport via M cells. This may be related to the role of lymphocyte Raji B cells in the FAE model, which are involved in the immune system [47].
After oral administration of two SiO2 particles in rats, significantly higher amounts of precipitated SiO2 were found in all organs analyzed, compared with those of fumed SiO2 (Figure 7), which is consistent with the cellular uptake (Figure 5) and intestinal transport (Figure 6) amounts. Both types of particles were not dissolved in the gastric fluid, but ~81% of ionized forms were detected in the liver regardless of administered doses, indicating that the majority of the oral fates of both SiO2 types were ionic forms in the liver. On the other hand, about 4 and 7% particle forms of precipitated SiO2 were found in the blood at 300 and 2000 mg/kg (Figure 7A–C), respectively, whereas less than 1% of particles remained intact in the blood after the oral administration of fumed SiO2, regardless of the administered dose (Figure 7B–D). No particle forms were detected in the kidneys in all cases. Taken together, SiO2 particles were present as intact particle forms in the stomach, and slowly dissolved into Si ions during intestinal cellular uptake and transport. They were then more decomposed after distribution in the liver and entering the circulation system, and finally excreted as Si ions in the kidneys. Indeed, SiO2 undergoes hydrolysis to form silicic acid, and in vivo biodegradation of SiO2 to silicic acid was demonstrated [20,36]. The metabolic pathway involved in the degradation or decomposition of SiO2 particles in the tissues and cells remains to be elucidated in the near future.

4. Materials and Methods

4.1. Materials

Food additive precipitated SiO2 (SIPERNAT 22S) and fumed SiO2 (AEROSIL 200F) particles were purchased from Evonik Industries AG (Essen, Germany). Stock solutions (1 mg/mL) of SiO2 particles were prepared in DW, stirred for 30 min, sonicated for 15 min, and then diluted (100 μg/mL) just prior to all experiments.
TX-114, calcium chloride dihydrate (CaCl2·2H2O), formaldehyde, citric acid, glycerin, sodium citrate dihydrate, sodium tartrate dihydrate, sodium lactate, sodium pyruvate, glycine, potassium thiocyanate (KSCN), sodium bicarbonate (NaHCO3), urea, α-amylase, uric acid, mucin, D-(+)-glucose, glucuronic acid, glucosamine hydrochloride, BSA, pepsin, pancreatin, lipase, bile, Lucifer yellow CH, and Si standard solution were provided by Sigma-Aldrich (St. Louis, MO, USA). Nitric acid (HNO3), hydrogen peroxide (H2O2), hydrogen fluoride (HF), sodium chloride (NaCl), sodium hydroxide (NaOH), sodium phosphate (NaHPO4), potassium chloride (KCl), potassium dihydrogen phosphate (KH2PO4), ethyl alcohol, and hydrochloride (HCl) were supplied by Samchun Pure Chemical Co., Ltd. (Pyeongtaek, Gyeonggi-do, Korea). Sodium sulfate (Na2SO4), magnesium chloride hexahydrate (MgCl2·6H2O), and sodium dihydrogen phosphate dihydrate (NaH2PO4·2H2O) were acquired from Junsei Chemical Co., Ltd. (Tokyo, Japan). Conical-bottomed glass centrifuge tubes (15 mL) were obtained from Daeyoung Science (Seoul, Korea). MEM, Roswell Park Memorial Institute (RPMI) 1640 medium, Dulbecco’s modified Eagle’s medium (DMEM), heat-inactivated FBS, penicillin, streptomycin, Hanks’ balanced salt solution (HBSS), and Dulbecco’s phosphate-buffered saline (DPBS) were purchased from Welgene Inc. (Gyeongsangbuk-do, Korea). Matrigel® and Transwell® polycarbonate inserts were supplied by Corning Inc. (Corning, NY, USA) and SPL Life Science Co., Ltd. (Pocheon, Gyeonggi-do, Korea), respectively.

4.2. Cell Culture

Human intestinal epithelial Caco-2 cells and non-adherent human Burkitt lymphoma Raji B cells were supplied by Korean Cell Line Bank (Seoul, Korea). Caco-2 cells and Raji B cells were cultured in MEM and RPMI 1640 medium, respectively, containing 10% FBS, 100 units/mL of penicillin, and 100 μg/mL of streptomycin under 5% CO2 atmosphere at 37 °C.

4.3. Animals

Seven-week-old female Sprague Dawley (SD) rats weighing around 130–170 g were purchased from Koatech Co. (Pyeongtaek, Gyeonggi-do, Korea). The animals were housed in plastic laboratory animal cages in a ventilated room, maintained at 20 ± 2 °C and 60% ± 10% relative humidity with a 12 h light/dark cycle. Water and commercial laboratory complete food for rats were available ad libitum. The animals were environmentally acclimated for 7 days before experimental treatments. All animal experiments were performed in accordance with the guidelines established by the Animal and Ethics Review Committee of Seoul Women’s University (SWU IACUC-2020A-8).

4.4. Characterization

Constituent particle sizes and morphologies of SiO2 particles were determined via field emission (FE)-SEM (JSM-7100F, JEOL, Tokyo, Japan) and high-resolution TEM (JEM-2100F, JEOL). For FE-SEM analysis, the samples were prepared by dropping 20 μL of SiO2 stock solutions (0.1 mg/mL) onto a mount (Specimen Mount, JEOL, Tokyo, Japan) with a carbon tape (5 mm × 5 mm; E-SONG EMC, Seoul, Korea), and then dried at room temperature. The sample surface was then coated with Pt/Pd via a sputtering process for 30 s. FE-SEM images were obtained at an acceleration voltage of 15 kV. For TEM analysis, the suspensions (0.1 mg/mL) of SiO2 particles were prepared in ethanol and sonicated for 15 min. Then, 5 μL of the suspensions were dropped on a 200-mesh, carbon-coated copper grid (PELCO® TEM Grids, Ted Pella Inc., Redding, CA, USA) and dried at room temperature. TEM images were obtained at an accelerating voltage of 200 kV. The average particle sizes and size distributions of SiO2 particles in the FE-SEM and TEM images were analyzed using ImageJ software (version 1.53a, National Institutes of Health, Bethesda, MD, USA).
Hydrodynamic diameters and zeta potentials of SiO2 particles were measured via DLS and electrophoretic light scattering (ELS), respectively, using a Zetasizer Nano system (Malvern Instruments, Worcestershire, UK). For DLS and ELS analysis, 1 mL of SiO2 stock suspensions (1 mg/mL) was placed in disposable plastic cuvettes and measured at room temperature.
The specific surface area was determined via the BET method, using N2 gas adsorption–desorption isotherms (at 77 K) of the particles. The moisture in the particles was removed by drying at 100 °C for 2 h prior to analysis, and then measured with a surface area analyzer (TriStar II 3020, Micromeritics, Norcross, GA, USA).

4.5. Digestion of Organic Matrices, Microwave Digestion, and ICP-AES Analysis

SiO2 particles were quantified by measuring total Si contents using ICP-AES (JY2000 Ultrace, HORIBA Jobin Yvon, Longjumeau, France), with Si standard solutions of different concentrations. To digest organic materials in the supernatants after solubility or CPE experiments, digestion was performed with 10 mL of ultrapure HNO3 and 1 mL of H2O2 at 180 °C until the solution was colorless and completely evaporated. The same digestion procedure was applied to measure the hydrodynamic diameters of SiO2 in the precipitates via CPE. For quantitative analysis of the precipitates containing SiO2 via CPE, the samples were transferred to perfluoroalkoxy microwave digestion vessels, and 6 mL of 70% HNO3 and 1 mL of 40% HF were added. The samples were digested for 55 min at 1600 W in a microwave digestion system (ETHOS EASY, Milestone Srl, Sorisole, Italy), by irradiation at 120, 160, and 210 °C for 15, 10, and 30 min, respectively, followed by holding for 1 min. After digestion, all samples were diluted to appropriate volumes with DDW, shaken manually, and analyzed via ICP-AES with a radiofrequency power of 1000 W and an argon flow rate of 0.02 mL/min in the nebulizer. Method blanks were determined by performing the same procedure in the absence of Si samples.

4.6. Validation of Quantitative Analytical Method

The method for quantitative analysis was validated by evaluating the LOD, LOQ, linearity, recovery (%), accuracy, precision, and matrix effects according to the International Conference on Harmonization (ICH, Q2B) guidance [48]. All validation parameters were evaluated with Si standard solution, precipitated and fumed SiO2, and SiO2-spiked matrices (cells and liver), at SiO2 concentrations of 0, 2.5, 5, 25, and 50 μg/g (corresponding to Si concentrations of 0, 1.2, 2.3, 12, and 23 μg/g, respectively). The LOD and LOQ were calculated according to the following equations: LOD = 3.3 × σ/S; and LOQ = 10 × σ/S (σ: standard deviation of the response; S: slope of the calibration curve). The linearity of the quantification was evaluated as a coefficient of determination values (R2). The accuracy was evaluated by the recovery (%) of known added SiO2 at different concentrations. The precision was determined by repeatability and expressed as RSD% from measurements of five replicates [49]. Uncertainty of the obtained calibration curves was validated by calculating RMSE values [50].

4.7. In Vitro Dissolution Properties of SiO2

The solubility of SiO2 particles in water was evaluated according to the flask method of OECD TG 105 water solubility [30]. SiO2 particles (50 g/L) were dispersed in DDW and preincubated with shaking at 30 °C for 24 h to achieve the saturation equilibrium, followed by shaking at 20 °C for 24, 48, and 72 h. The supernatants were then collected via ultracentrifugation (16,000× g) for 15 min, filtered through a syringe filter (pore size 0.22 μm), and quantitative analysis of the dissolved Si from SiO2 was performed using ICP-AES (JY2000 Ultrace, HORIBA Jobin Yvon). If the differences in Si concentrations measured in the samples at 20 °C for 24, 48, and 72 h were less than 15%, the concentrations were used for the solubility values.
The solubility of SiO2 was investigated in ALF, the composition of which is summarized in Table S2 [51]. SiO2 particles (1 mg/mL) were dispersed in ALF and incubated for designated times (2, 6, and 24 h) at 37 °C. The solubility of SiO2 was also assessed in the presence of 4% BSA and MEM under the same conditions. After incubation, the samples were centrifuged at 16,000× g for 15 min, and the supernatants were subjected to ICP-AES analysis.
The solubility of SiO2 was also evaluated in an in vitro three steps of digestion model consisting of simulated saliva, gastric fluids, and intestinal fluids, as described by Peters et al. (Table S3) [9]. All simulated digestion fluids were prepared on the day of the experiment, and the fluids were preheated to 37 °C for at least 2 h. For dissolution experiments in each digestion fluid, SiO2 particles (1 mg/mL) were dispersed in simulated saliva, gastric fluids, and intestinal fluids, and incubated for 5 min, 2 h, and 2 h, respectively, on a head-over-head rotator at 37 °C. For consecutive digestion experiments, SiO2 particles (1 mg/mL) were dispersed in simulated saliva (6 mL) for 5 min at 37 °C, followed by sequential gastric digestion for 2 h at 37 °C by the addition of gastric fluid (12 mL). Then, intestinal digestion was further performed for 2 h at 37 °C by the addition of duodenal (12 mL) and bile (6 mL) fluids to the suspensions. After each digestion step, the samples were centrifuged at 16,000× g for 15 min, and the Si contents in the supernatants were measured using ICP-AES (JY2000 Ultrace, HORIBA Jobin Yvon).

4.8. Ex Vivo Dissolution Properties of SiO2 in Rat-Extracted GI Fluids

Rat gastric and intestinal fluids were prepared as described by Lee et al. [52]. Briefly, the stomachs and small intestines of rats were collected and washed with saline, and then the gastric and intestinal fluids were extracted. The supernatants of the gastric and intestinal fluids were obtained by centrifugation at 16,000× g for 15 min at 4 °C, and were used for ex vivo solubility experiments. Ex vivo digestion was performed in the same manner as described in the in vitro three steps of digestion model (2:3 v/v gastric:intestinal). For solubility in each digestion fluid, SiO2 particles (1 mg/mL) were dispersed in the rat-extracted gastric and intestinal fluids, respectively, and incubated for 2 h at 37 °C. For consecutive digestion experiments, SiO2 particles were dispersed in the gastric fluid (0.5 mL) at a concentration of 1 mg/mL and incubated for 2 h at 37 °C. The suspensions were then combined with the intestinal fluid (0.75 mL) and incubated for a further 2 h at 37 °C. After each digestion step, the samples were centrifuged at 16,000× g for 15 min, and Si concentrations in the supernatants were analyzed using ICP-AES (JY2000 Ultrace, HORIBA Jobin Yvon).

4.9. Optimization of CPE for SiO2

The CPE method for SiO2 was established with the stock solutions of food additive SiO2 (100 μg/mL), in the absence of matrices. The SiO2 solutions (7 mL) were added to conical-bottomed glass centrifuge tubes, and the pH was adjusted to 3.0 with diluted HNO3. Then, 0.5 mL of 5% (w/v) TX-114 and 0.75 mL of 0.2 M NaCl were added to the samples. After dilution to 10 mL with DDW, the mixtures were incubated for 30 min at 45 °C and then centrifuged for 5 min at 2500× g at 25 °C to facilitate phase separation. The precipitates of SiO2 particles in the TX-114-rich phase and the supernatants of the upper aqueous phase were collected for Si quantification via ICP-AES (JY2000 Ultrace, HORIBA Jobin Yvon). The recoveries (%) of SiO2 particles in intact particle forms in the precipitated TX-114-rich phase were checked.
The CPE method for SiO2 particles in cells was optimized using SiO2-spiked Caco-2 cells. Briefly, the cells (1 × 10⁶ cells) were resuspended in 1 mL of DDW and transferred to conical-bottomed glass centrifuge tubes. Then, 1 mL of SiO2 stock solution (100 μg/mL) was added to the cell suspension. The prepared SiO2-spiked cells were sonicated four times for 10 s at 150 W on ice using an ultrasonic homogenizer (Sonics & Materials Inc., Newtown, CT, USA). After dilution to 7 mL with DDW, the same CPE procedure for food additive SiO2 was applied, as described above.
The CPE method for SiO2 particles in tissues was optimized using SiO2-spiked rat liver. The rat liver was collected and chopped with scissors, and 0.1 g of the chopped tissues was transferred to conical-bottomed glass centrifuge tubes. After adding 1 mL of SiO2 stock solution (100 μg/mL) to the chopped tissues, the volume was adjusted to 7 mL with DDW. The SiO2-spiked tissues were homogenized on ice using an ultrasound homogenizer (Sonics & Materials Inc.), and the same CPE procedure applied to food additive SiO2 was performed, as described above.

4.10. Cellular Uptake and Intracellular Fates of SiO2

The cells were plated at a density of 1 × 10⁶ cells/well and incubated with SiO2 particles (500 μg/mL) for 2, 6, and 24 h. After incubation, the cells were washed three times with DPBS and harvested with a scraper. Then, the cells were centrifuged for 1 min at 3000 rpm at 4 °C, and resuspended in 1 mL of DDW to determine the intracellular fate of SiO2 via CPE. Briefly, the suspended cells (1 mL) were added to conical-bottomed glass centrifuge tubes and lysed as described in Section 4.9. Then, the volume was adjusted to 7 mL with DDW, and the same CPE procedure for SiO2 was applied (see Section 4.9). Cells in the absence of SiO2 particles were used as controls. Si concentrations in the precipitates and supernatants, as measured by CPE, were analyzed using ICP-AES (JY2000 Ultrace, HORIBA Jobin Yvon).

4.11. Intestinal Transport and Fates of SiO2

A Caco-2 monoculture model was used to evaluate the transport of particles through the intestinal epithelial tight junction barrier. After Matrigel® diluted in serum-free DMEM was coated on a Transwell® insert for 1 h, the supernatants were removed, and the inserts were washed with serum-free DMEM. Caco-2 cells (4.5 × 10⁵ cells/well) were seeded on the upper insert and grown for 21 days until the transepithelial electrical resistance (TEER) value reached more than 300 Ω cm2. Then, the apical medium of the monolayers was replaced by medium containing SiO2 particles (500 μg/mL), and incubation was continued for 2 and 6 h. The pH of the apical and basolateral media was 7.4.
The FAE model, mimicking the M cells of Peyer’s patches in the intestinal epithelium, was prepared as previously described [53,54]. Briefly, Caco-2 cells (1 × 10⁶ cells/well) were seeded on the upper insert and grown for 14 days. Raji B cells (1 × 10⁶ cells/well) in DMEM were added to the basolateral inserts and co-cultured for 5 days (150–200 Ω cm2). Then, the apical medium of the monolayers was replaced by medium containing SiO2 particles (500 μg/mL), and incubation was continued for 2 and 6 h. The CPE method was applied by adding 1 mL of apical and basolateral solutions to conical-bottomed glass centrifuge tubes and diluting to 7 mL with DDW. The same CPE procedure for SiO2 was applied (see Section 4.9). Si quantifications in the precipitates and supernatants, obtained via CPE, were performed using ICP-AES (JY2000 Ultrace, HORIBA Jobin Yvon).
The permeability of Lucifer yellow, a marker of tight junction integrity, was checked as described previously [55,56]. The apical and basolateral sides of the Caco-2 monolayer and FAE models were washed with HBSS, and then the apical media were replaced with Lucifer yellow solution (300 μg/mL in HBSS). After incubation for 1 h at 37 °C, the apical and basolateral media were collected, and fluorescence was measured with a fluorescence microplate reader at excitation and emission wavelengths of 430 nm and 540 nm, respectively. The permeability (%) was calculated according to the following formula:
P e r m e a b i l i t y   ( % ) = ( a p i c a l   m e d i u m b l a n k ) / ( b a s o l a t e r a l   m e d i a m b a l n k ) × 100

4.12. In Vivo Oral Distribution and Fate Determination of SiO2 in Tissues

Two groups of eight-week-old female SD rats (n = 4 per group) received a single dose of 300 or 2000 mg/kg of SiO2 particles by oral gavage, and one additional group of three rats received an equivalent volume of DW as controls. One gender (female) was used based on our previous research, showing no effect of gender on tissue distribution [36]. Tissue samples of blood, gastric fluid, kidneys, and liver were collected at time to peak concentration (300 mg/kg, 2 h; 2000 mg/kg, 10 h) after euthanasia by CO2 [35,57]. The tissue samples were stored at −80 °C until analysis.
The kidney and liver tissues were chopped with scissors. Then, 0.1 g of the chopped tissues was transferred to conical-bottomed glass centrifuge tubes and homogenized (Sonics & Materials Inc.) on ice in 7 mL of DDW. The biofluids (0.1 g), such as blood and gastric fluid, were directly transferred to conical-bottomed glass centrifuge tubes, and the volume was adjusted to 7 mL with DDW. The same CPE procedure for food additive SiO2 was applied (see Section 4.9). Si levels in the precipitates and supernatants, as obtained via CPE, were analyzed by ICP-AES (JY2000 Ultrace, HORIBA Jobin Yvon).

4.13. Statistical Analysis

Results were presented as means ± standard deviations. One-way analysis of variance with Tukey’s test was performed using the SAS Ver.9.4 (SAS Institute Inc., Cary, NC, USA) to determine the significances of intergroup differences. Statistical significance was accepted for p values of <0.05.

5. Conclusions

The constituent particle sizes of precipitated SiO2 and fumed SiO2 particles were similar, but different levels of solubility were found depending on the hydrodynamic diameters and aggregate states in the biofluid type. TX-114-based CPE for SiO2 was developed and optimized in intestinal cells and rat liver for its fate determination. The results show that the majority of the fates of SiO2 inside intestinal cells were particle forms, but slowly decomposed into ions during intestinal transport through the Caco-2 monolayer and M cells, regardless of manufactured type. Most SiO2 particles remained intact in the stomach, but ionic forms were primarily found in the liver and blood, and completely dissolved into ions in the kidneys. These findings will provide crucial information for understanding and predicting the potential toxicity of food additive SiO2 after oral intake. Further study is required in order to elucidate the metabolic pathway involved in the degradation or decomposition of SiO2 particles in the tissues.

Supplementary Materials

The following are available online at https://www.mdpi.com/article/10.3390/ijms22137035/s1.

Author Contributions

Methodology, validation, formal analysis, investigation, data curation, N.-K.Y.; methodology, validation, formal analysis, investigation, Y.-R.J.; conceptualization, writing—original draft preparation, supervision, project administration, funding acquisition, S.-J.C. All authors have read and agreed to the published version of the manuscript.

Funding

This research was funded by a grant (20182MFDS404) from the Ministry of Food and Drug Safety in 2021, by a National Research Foundation of Korea (NRF) grant funded by the Korean government (MIST) (No. 2021R1A2C2007192), and partly by a research grant from Seoul Women’s University (2021-0164).

Institutional Review Board Statement

The study was conducted in accordance with the guidelines issued by the Animal and Ethics Review Committee of Seoul Women’s University (IACUC-2020A-8).

Data Availability Statement

The data presented in this study are available in the article and Supplementary Materials.

Conflicts of Interest

The authors declare no conflict of interest.

References

  1. Dekkers, S.; Krystek, P.; Peters, R.J.; Lankveld, D.P.; Bokkers, B.G.; van Hoeven-Arentzen, P.H.; Bouwmeester, H.; Oomen, A.G. Presence and risks of nanosilica in food products. Nanotoxicology 2011, 5, 393–405. [Google Scholar] [CrossRef]
  2. Fruijtier-Polloth, C. The safety of nanostructured synthetic amorphous silica (SAS) as a food additive (E 551). Arch. Toxicol. 2016, 90, 2885–2916. [Google Scholar] [CrossRef] [PubMed] [Green Version]
  3. U.S. Food and Drug Administration (FDA). CFR—Code of Federal Regulations Title 21. Available online: https://www.accessdata.fda.gov/scripts/cdrh/cfdocs/cfcfr/CFRSearch.cfm?fr=172.480 (accessed on 1 April 2020).
  4. European Commision (EC). Commission Regulation (EU) No 1129/2011 of 11 November 2011 Amending Annex II to Regulation (EC) No 1333/2008 of the European Parliament and of the Council by Establishing a Union List of Food Additives (Text with EEA Relevance). Available online: http://data.europa.eu/eli/reg/2011/1129/oj (accessed on 25 October 2017).
  5. Joint FAO/WHO Expert Committee on Food Additives (JECFA). Residue Monograph Prepared by the Meeting of the Joint FAO/WHO Expert Committee on Food Additives (JECFA), 84th Meeting 2017, Silicon Dioxide, Amorphous. Available online: http://www.fao.org/3/CA3117EN/ca3117en.pdf (accessed on 29 June 2021).
  6. Hempt, C.; Kaiser, J.P.; Scholder, O.; Buerki-Thurnherr, T.; Hofmann, H.; Rippl, A.; Schuster, T.B.; Wick, P.; Hirsch, C. The impact of synthetic amorphous silica (E 551) on differentiated Caco-2 cells, a model for the human intestinal epithelium. Toxicol. In Vitro 2020, 67, 104903. [Google Scholar] [CrossRef]
  7. European Commision (EC). Commission recommendation on the definition of nanomaterial (2011/696/EU). OJEU 2011, L275, 38–40. [Google Scholar]
  8. Younes, M.; Aggett, P.; Aguilar, F.; Crebelli, R.; Dusemund, B.; Filipič, M.; Frutos, M.J.; Galtier, P.; Gott, D.; Gundert-Remy, U.; et al. Re-evaluation of silicon dioxide (E 551) as a food additive. EFSA J. 2018, 16, e5088. [Google Scholar]
  9. Peters, R.; Kramer, E.; Oomen, A.G.; Rivera, Z.E.; Oegema, G.; Tromp, P.C.; Fokkink, R.; Rietveld, A.; Marvin, H.J.; Weigel, S.; et al. Presence of nano-sized silica during in vitro digestion of foods containing silica as a food additive. ACS Nano 2012, 6, 2441–2451. [Google Scholar] [CrossRef] [PubMed]
  10. Yu, J.; Kim, Y.H.; Kim, H.M.; Oh, J.M.; Kim, Y.R.; Choi, S.J. Determination of the fate and biological responses of food additive silica particles in commercial foods. Food Chem. 2020, 331, 127304. [Google Scholar] [CrossRef]
  11. Agence Nationale de Sécurité Sanitaire de L’alimentation, de L’environnement et du Travail (ANSES). Nanomatériaux dans les Produits Destinés à L’alimentation. Available online: https://www.anses.fr/fr/system/files/ERCA2016SA0226Ra.pdf (accessed on 29 June 2021).
  12. Tada-Oikawa, S.; Eguchi, M.; Yasuda, M.; Izuoka, K.; Ikegami, A.; Vranic, S.; Boland, S.; Tran, L.; Ichihara, G.; Ichihara, S. Functionalized surface-charged SiO2 nanoparticles induce pro-inflammatory responses, but are not lethal to Caco-2 Cells. Chem. Res. Toxicol. 2020, 33, 1226–1236. [Google Scholar] [CrossRef]
  13. Tarantini, A.; Lanceleur, R.; Mourot, A.; Lavault, M.T.; Casterou, G.; Jarry, G.; Hogeveen, K.; Fessard, V. Toxicity, genotoxicity and proinflammatory effects of amorphous nanosilica in the human intestinal Caco-2 cell line. Toxicol. In Vitro 2015, 29, 398–407. [Google Scholar] [CrossRef]
  14. Guo, Z.; Martucci, N.J.; Liu, Y.; Yoo, E.; Tako, E.; Mahler, G.J. Silicon dioxide nanoparticle exposure affects small intestine function in an in vitro model. Nanotoxicology 2018, 12, 485–508. [Google Scholar] [CrossRef]
  15. Wang, F.; Jiao, C.; Liu, J.; Yuan, H.; Lan, M.; Gao, F. Oxidative mechanisms contribute to nanosize silican dioxide-induced developmental neurotoxicity in PC12 cells. Toxicol. In Vitro 2011, 25, 1548–1556. [Google Scholar] [CrossRef]
  16. Du, Q.; Ge, D.; Mirshafiee, V.; Chen, C.; Li, M.; Xue, C.; Ma, X.; Sun, B. Assessment of neurotoxicity induced by different-sized Stober silica nanoparticles: Induction of pyroptosis in microglia. Nanoscale 2019, 11, 12965–12972. [Google Scholar] [CrossRef] [PubMed]
  17. Li, X.; Liu, B.; Li, X.L.; Li, Y.X.; Sun, M.Z.; Chen, D.Y.; Zhao, X.; Feng, X.Z. SiO2 nanoparticles change colour preference and cause Parkinson’s-like behaviour in zebrafish. Sci. Rep. UK 2014, 4, 3810. [Google Scholar] [CrossRef] [Green Version]
  18. Kim, Y.-R.; Lee, S.-Y.; Lee, E.J.; Park, S.H.; Seong, N.-W.; Seo, H.-S.; Shin, S.-S.; Kim, S.-J.; Meang, E.-H.; Park, M.-K.; et al. Toxicity of colloidal silica nanoparticles administered orally for 90 days in rats. Int. J. Nanomed. 2014, 9, 67–78. [Google Scholar]
  19. Crundwell, F.K. On the mechanism of the dissolution of quartz and silica in aqueous solutions. ACS Omega 2017, 2, 1116–1127. [Google Scholar] [CrossRef]
  20. Finnie, K.S.; Waller, D.J.; Perret, F.L.; Krause-Heuer, A.M.; Lin, H.Q.; Hanna, J.V.; Barbé, C.J. Biodegradability of sol–gel silica microparticles for drug delivery. J. Sol-Gel Sci. Technol. 2008, 49, 12–18. [Google Scholar] [CrossRef]
  21. Galagudza, M.; Korolev, D.; Postnov, V.; Naumisheva, E.; Grigorova, Y.; Uskov, I.; Shlyakhto, E. Passive targeting of ischemic-reperfused myocardium with adenosine-loaded silica nanoparticles. Int. J. Nanomed. 2012, 7, 1671–1678. [Google Scholar] [CrossRef] [PubMed] [Green Version]
  22. Flörke, O.W.; Graetsch, H.A.; Brunk, F.; Benda, L.; Paschen, S.; Bergna, H.E.; Roberts, W.O.; Welsh, W.A.; Libanati, C.; Ettlinger, M.; et al. Silica. In Ullmann’s Encyclopedia of Industrial, Chemistry, 7th ed.; Wiley-VCH: Weinhein, Germany, 2008; Volume 32, pp. 421–507. [Google Scholar]
  23. Garrett, P.R. Defoaming: Theory and Industrial Applications; CRC Press: Boca Raton, FL, USA, 1992; pp. 239–240. [Google Scholar]
  24. Maharana, S.M.; Pandit, M.K.; Pradhan, A.K. Effect of chemical treatment and fumed silica coating on tensile and thermogravimetric properties of jute yarn. Mater. Today Proc. 2020, 27, 2693–2698. [Google Scholar] [CrossRef]
  25. Wiemann, M.; Vennemann, A.; Stintz, M.; Retamal Marin, R.R.; Babick, F.; Lindner, G.G.; Schuster, T.B.; Brinkmann, U.; Krueger, N. Effects of ultrasonic dispersion energy on the preparation of amorphous SiO2 nanomaterials for in vitro toxicity testing. Nanomaterials 2018, 9, 11. [Google Scholar] [CrossRef] [PubMed] [Green Version]
  26. Organisation for Economic Co-operation and Development (OECD). Silicon Dioxide: Summary of the Dossier. Series on the Safety of Manufactured Nanomaterials No. 71. Available online: https://www.oecd.org/officialdocuments/publicdisplaydocumentpdf/?cote=env/jm%20/mono(2016)23&doclanguage=en (accessed on 29 June 2021).
  27. Azizi, N.A.M.; Rahim, N.Y.; Raoov, M.; Asman, S. Optimisation and evaluation of zinc in food samples by cloud point extraction and spectrophotometric detection. Sci. Res. J. 2019, 16, 41. [Google Scholar] [CrossRef]
  28. Tabrizi, A.B. Cloud point extraction and spectrofluorimetric determination of aluminium and zinc in foodstuffs and water samples. Food Chem. 2007, 100, 1698–1703. [Google Scholar] [CrossRef]
  29. Hu, Z.; Qi, L. Sample digestion methods. Reference Module in Earth Systems and Environmental Sciences. Treatise Geochem. Sec. 2014, 15, 87–109. [Google Scholar]
  30. OECD. OECD Guideline for the Testing of Chemicals, Water Solubility. Available online: https://www.oecd-ilibrary.org/environment/test-no-105-water-solubility_9789264069589-en (accessed on 29 June 2021).
  31. Liu, J.-F.; Liu, R.; Yin, Y.-G.; Jiang, G.-B. Triton X-114 based cloud point extraction: A thermoreversible approach for separation/concentration and dispersion of nanomaterials in the aqueous phase. Chem. Commun. 2009, 12, 1514–1516. [Google Scholar] [CrossRef]
  32. Bian, S.-W.; Mudunkotuwa, I.A.; Rupasinghe, T.; Grassian, V.H. Aggregation and dissolution of 4 nm ZnO nanoparticles in aqueous environments: Influence of pH, ionic strength, size, and adsorption of humic acid. Langmuir 2011, 27, 6059–6068. [Google Scholar] [CrossRef] [PubMed]
  33. Santbergen, M.J.C.; van der Zande, M.; Gerssen, A.; Bouwmeester, H.; Nielen, M.W.F. Dynamic in vitro intestinal barrier model coupled to chip-based liquid chromatography mass spectrometry for oral bioavailability studies. Anal. Bioanal. Chem. 2020, 412, 1111–1122. [Google Scholar] [CrossRef] [Green Version]
  34. Sigma-Aldrich. Product Information. Available online: https://www.sigmaaldrich.com/deepweb/assets/sigmaaldrich/product/documents/468/749/mtox1002pc24bul.pdf (accessed on 29 June 2021).
  35. Paek, H.-J.; Chung, H.-E.; Lee, J.-A.; Kim, M.-K.; Lee, Y.-J.; Kim, M.-S.; Kim, S.-H.; Maeng, E.-H.; Lee, J.K.; Jeong, J.; et al. Quantitative determination of silica nanoparticles in biological matrices and their pharmacokinetics and toxicokinetics in rats. Sci. Adv. Mater. 2014, 6, 1605–1610. [Google Scholar] [CrossRef]
  36. Lee, J.A.; Kim, M.K.; Paek, H.J.; Kim, Y.R.; Kim, M.K.; Lee, J.K.; Jeong, J.; Choi, S.J. Tissue distribution and excretion kinetics of orally administered silica nanoparticles in rats. Int. J. Nanomed. 2014, 9, 251–260. [Google Scholar]
  37. Jo, M.-R.; Chung, H.-E.; Kim, H.-J.; Bae, S.-H.; Go, M.-R.; Yu, J.; Choi, S.-J. Effects of zinc oxide nanoparticle dispersants on cytotoxicity and cellular uptake. Mol. Cell Toxicol. 2016, 12, 281–288. [Google Scholar] [CrossRef]
  38. Vranic, S.; Gosens, I.; Jacobsen, N.R.; Jensen, K.A.; Bokkers, B.; Kermanizadeh, A.; Stone, V.; Baeza-Squiban, A.; Cassee, F.R.; Tran, L.; et al. Impact of serum as a dispersion agent for in vitro and in vivo toxicological assessments of TiO2 nanoparticles. Arch. Toxicol. 2017, 91, 353–363. [Google Scholar] [CrossRef]
  39. Barbosa, L.R.; Ortore, M.G.; Spinozzi, F.; Mariani, P.; Bernstorff, S.; Itri, R. The importance of protein-protein interactions on the pH-induced conformational changes of bovine serum albumin: A small-angle X-ray scattering study. Biophys. J. 2010, 98, 147–157. [Google Scholar] [CrossRef]
  40. Sogaard, C.; Funehag, J.; Abbas, Z. Silica sol as grouting material: A physio-chemical analysis. Nano Converg. 2018, 5, 6. [Google Scholar] [CrossRef] [PubMed] [Green Version]
  41. Scientific Committee on Consumer Safety (SCCS). Opinion on Solubility of Synthetic Amorphous Silica (SAS). Available online: https://ec.europa.eu/health/sites/default/files/scientific_committees/consumer_safety/docs/sccs_o_228.pdf (accessed on 29 June 2021).
  42. Cappel, C.; Gonzalez, A.C.; Damme, M. Quantification and characterization of the 5’exonuclease activity of the lysosomal nuclease PLD3 by a novel cell-based assay. J. Biol. Chem. 2020, 296, 100152. [Google Scholar] [CrossRef]
  43. Hu, Y.B.; Dammer, E.B.; Ren, R.J.; Wang, G. The endosomal-lysosomal system: From acidification and cargo sorting to neurodegeneration. Transl. Neurodegener. 2015, 4, 18. [Google Scholar] [CrossRef] [Green Version]
  44. Singh, R.; Lillard, J.W., Jr. Nanoparticle-based targeted drug delivery. Exp. Mol. Pathol. 2009, 86, 215–223. [Google Scholar] [CrossRef] [PubMed] [Green Version]
  45. Hu, L.; Mao, Z.; Zhang, Y.; Gao, C. Influences of size of silica particles on the cellular endocytosis, exocytosis and cell activity of HepG2 cells. J. Nanosci. Lett. 2011, 1, 1–16. [Google Scholar]
  46. Lee, J.-A.; Kim, M.-K.; Song, J.-H.; Jo, M.-R.; Yu, J.; Kim, K.-M.; Kim, Y.-R.; Oh, J.-M.; Choi, S.-J. Biokinetics of food additive silica nanoparticles and their interactions with food components. Colloid. Surface. B Biointerfaces 2017, 150, 384–392. [Google Scholar] [CrossRef] [PubMed]
  47. Chattopadhyay, S.; Dash, S.K.; Tripathy, S.; Das, B.; Mandal, D.; Pramanik, P.; Roy, S. Toxicity of cobalt oxide nanoparticles to normal cells; an in vitro and in vivo study. Chem. Biol. Interact. 2015, 226, 58–71. [Google Scholar] [CrossRef]
  48. International Conference on Harmonisation of Technical Requirements for Registration of Pharmaceuticals for Human Use (ICH). Guidance for Industry Q2B Validation of Analytical Procedures: Methodology. Available online: https://www.fda.gov/media/71725/download (accessed on 29 June 2021).
  49. Linsinger, T.P.; Peters, R.; Weigel, S. International interlaboratory study for sizing and quantification of Ag nanoparticles in food simulants by single-particle ICPMS. Anal. Bioanal. Chem. 2014, 406, 3835–3843. [Google Scholar] [CrossRef]
  50. Sáiz-Abajo, M.-J.; González-Sáiz, J.M.; Pizarro, C. Prediction of organic acids and other quality parameters of wine vinegar by near-infrared spectroscopy. A feasibility study. Food Chem. 2006, 99, 615–621. [Google Scholar] [CrossRef]
  51. Geitner, N.K.; Ogilvie Hendren, C.; Cornelis, G.; Kaegi, R.; Lead, J.R.; Lowry, G.V.; Lynch, I.; Nowack, B.; Petersen, E.; Bernhardt, E.; et al. Harmonizing across environmental nanomaterial testing media for increased comparability of nanomaterial datasets. Environ. Sci. Nano 2020, 7, 13–36. [Google Scholar] [CrossRef] [Green Version]
  52. Lee, J.-A.; Kim, M.-K.; Kim, H.-M.; Lee, J.K.; Jeong, J.; Kim, Y.-R.; Oh, J.-M.; Choi, S.-J. The fate of calcium carbonate nanoparticles administered by oral route: Absorption and their interaction with biological matrices. Int. J. Nanomed. 2015, 10, 2273–2293. [Google Scholar]
  53. des Rieux, A.; Fievez, V.; Theate, I.; Mast, J.; Preat, V.; Schneider, Y.J. An improved in vitro model of human intestinal follicle-associated epithelium to study nanoparticle transport by M cells. Eur. J. Pharm. Sci. 2007, 30, 380–391. [Google Scholar] [CrossRef] [PubMed]
  54. Jeon, Y.-R.; Yu, J.; Choi, S.-J. Fate Determination of ZnO in Commercial Foods and Human Intestinal Cells. Int. J. Mol. Sci. 2020, 21, 433. [Google Scholar] [CrossRef] [PubMed] [Green Version]
  55. Silva, C.M.; Veiga, F.; Ribeiro, A.J.; Zerrouk, N.; Arnaud, P. Effect of chitosan-coated alginate microspheres on the permeability of Caco-2 cell monolayers. Drug Dev. Ind. Pharm. 2006, 32, 1079–1088. [Google Scholar] [CrossRef] [PubMed]
  56. Satsu, H.; Yokoyama, T.; Ogawa, N.; Fujiwara-Hatano, Y.; Shimizu, M. The changes in the neuronal PC12 and the intestinal epithelial Caco-2 cells during the coculture. The functional analysis using an in vitro coculture system. Cytotechnology 2001, 35, 73–79. [Google Scholar] [CrossRef]
  57. Jeon, Y.R. Fate Determination of Food Additive Zinc Oxide and Silicon Dioxide Nanoparticles in Commercial Foods and Biological Matrices by Optimizing Cloud Point Extraction Approach. Master’s Thesis, Seoul Women’s University, Seoul, Korea, 19 February 2021. [Google Scholar]
Figure 1. (A,D) Scanning electron microscopy (SEM), (B,E) transmission electron microscopy (TEM), and (C,F) size distribution of (AC) precipitated SiO2 and (DF) fumed SiO2. Size distributions were obtained by randomly selecting at least 100 particles from the TEM images.
Ijms 22 07035 g001
Figure 2. Dissolution properties of precipitated SiO2 and fumed SiO2 in (A) distilled and deionized water (DDW) and 0.5% ethanol; (B) artificial lysosomal fluid (ALF), 4% bovine serum albumin (BSA) solution, and minimum essential medium (MEM); (C,D) in vitro digestion fluids; and (E) ex vivo rat-extracted gastrointestinal (GI) fluids. (F) Hydrodynamic diameters of precipitated SiO2 and fumed SiO2 in DDW, ALF, 4% BSA solution, MEM, and three consecutive steps of in vitro digestion fluids. Different uppercase letters (A,B) indicate significant differences between precipitated SiO2 and fumed SiO2 under the same conditions (p < 0.05). Different lowercase letters (a,b,c) indicate significant differences between experimental conditions (p < 0.05).
Ijms 22 07035 g002
Figure 3. (A) Hydrodynamic diameters of food additive SiO2 before and after cloud point extraction (CPE). (B) Recoveries (%) of SiO2 particles, Si ions, and total Si levels, obtained via CPE. No significant differences between before and after CPE were found (p > 0.05).
Ijms 22 07035 g003
Figure 4. Recoveries (%) of SiO2 particles, Si ions, and total Si levels in (A) SiO2-spiked Caco-2 cells and (B) SiO2-spiked liver, obtained via cloud point extraction (CPE).
Ijms 22 07035 g004
Figure 5. Intracellular uptakes and fates of SiO2 in Caco-2 cells, obtained via cloud point extraction (CPE). Different uppercase letters (A,B) indicate significant differences in total intracellular Si levels between precipitated SiO2 and fumed SiO2 (p < 0.05). Different lowercase letters (a,b,c,d) indicate significant differences between different incubation times (p < 0.05).
Ijms 22 07035 g005
Figure 6. Intestinal transports and fates of SiO2 using (A) in vitro Caco-2 monolayer and (B) follicle-associated epithelium (FAE) models, obtained via cloud point extraction (CPE). Different uppercase letters (A,B) indicate significant differences in total Si transport levels between precipitated SiO2 and fumed SiO2 (p < 0.05). Different lowercase letters (a,b,c) indicate significant differences between different incubation times (p < 0.05). ND: not detectable.
Ijms 22 07035 g006
Figure 7. Tissue distribution and fates of (A,C) precipitated SiO2 and (B,D) fumed SiO2 in rats after single-dose oral administration of (A,B) 300 mg/kg or (C,D) 2000 mg/kg, obtained via cloud point extraction (CPE). Different lowercase letters (a,b) indicate significant differences between tissues (liver, blood, and kidney) (p < 0.05).
Ijms 22 07035 g007
Table 1. Particle fractions, hydrodynamic diameters, and specific surface areas 1 of precipitated SiO2 and fumed SiO2.
SamplesFraction (Number %)Fraction (Mass %)Z-Average Diameter
(nm)
BET
(m2/g)
<100 nm100–200 nm>200 nm<100 nm100–200 nm>200 nm
Precipitated SiO20 ± 0 a4 ± 1 a96 ± 1 a0 ± 0 a1 ± 0 a99 ± 0 a375 ± 1 a167 ± 1 a
Fumed SiO243 ± 2 b54 ± 2 b3 ± 0 b15 ± 1 b62 ± 2 b23 ± 1 b156 ± 1 b177 ± 1 b
1 Specific surface areas, as measured by the Brunauer–Emmett–Teller (BET) method. Different lowercase letters (a,b) indicate significant differences between precipitated SiO2 and fumed SiO2 (p < 0.05).
Table 2. Validation parameters of the quantitative analytical method for SiO2 particles.
SamplesLinearity (R2)RMSERecovery (%)Repeatability (RSD%)LOD (μg/g of Matrix)LOQ (μg/g of Matrix)
Si standard solution0.99990.036396.1 ± 2.71.95
Precipitated SiO2
Pristine0.99990.331898.0 ± 6.41.54
Cell0.99980.245199.2 ± 1.52.940.501.55
Liver1.00000.156597.3 ± 0.83.550.361.08
Fumed SiO2
Pristine0.99990.3987103.3 ± 6.45.12
Cell0.99990.301599.8 ± 5.23.410.371.15
Liver0.99970.4520105.0 ± 4.53.390.521.58
RMSE: root-mean-square error; RSD: relative standard deviation; LOD: limit of detection; LOQ: limit of quantification.
Publisher’s Note: MDPI stays neutral with regard to jurisdictional claims in published maps and institutional affiliations.

