
Genetic Ancestry Inference and Its Application for the Genetic Mapping of Human Diseases

 , , and
Abstract
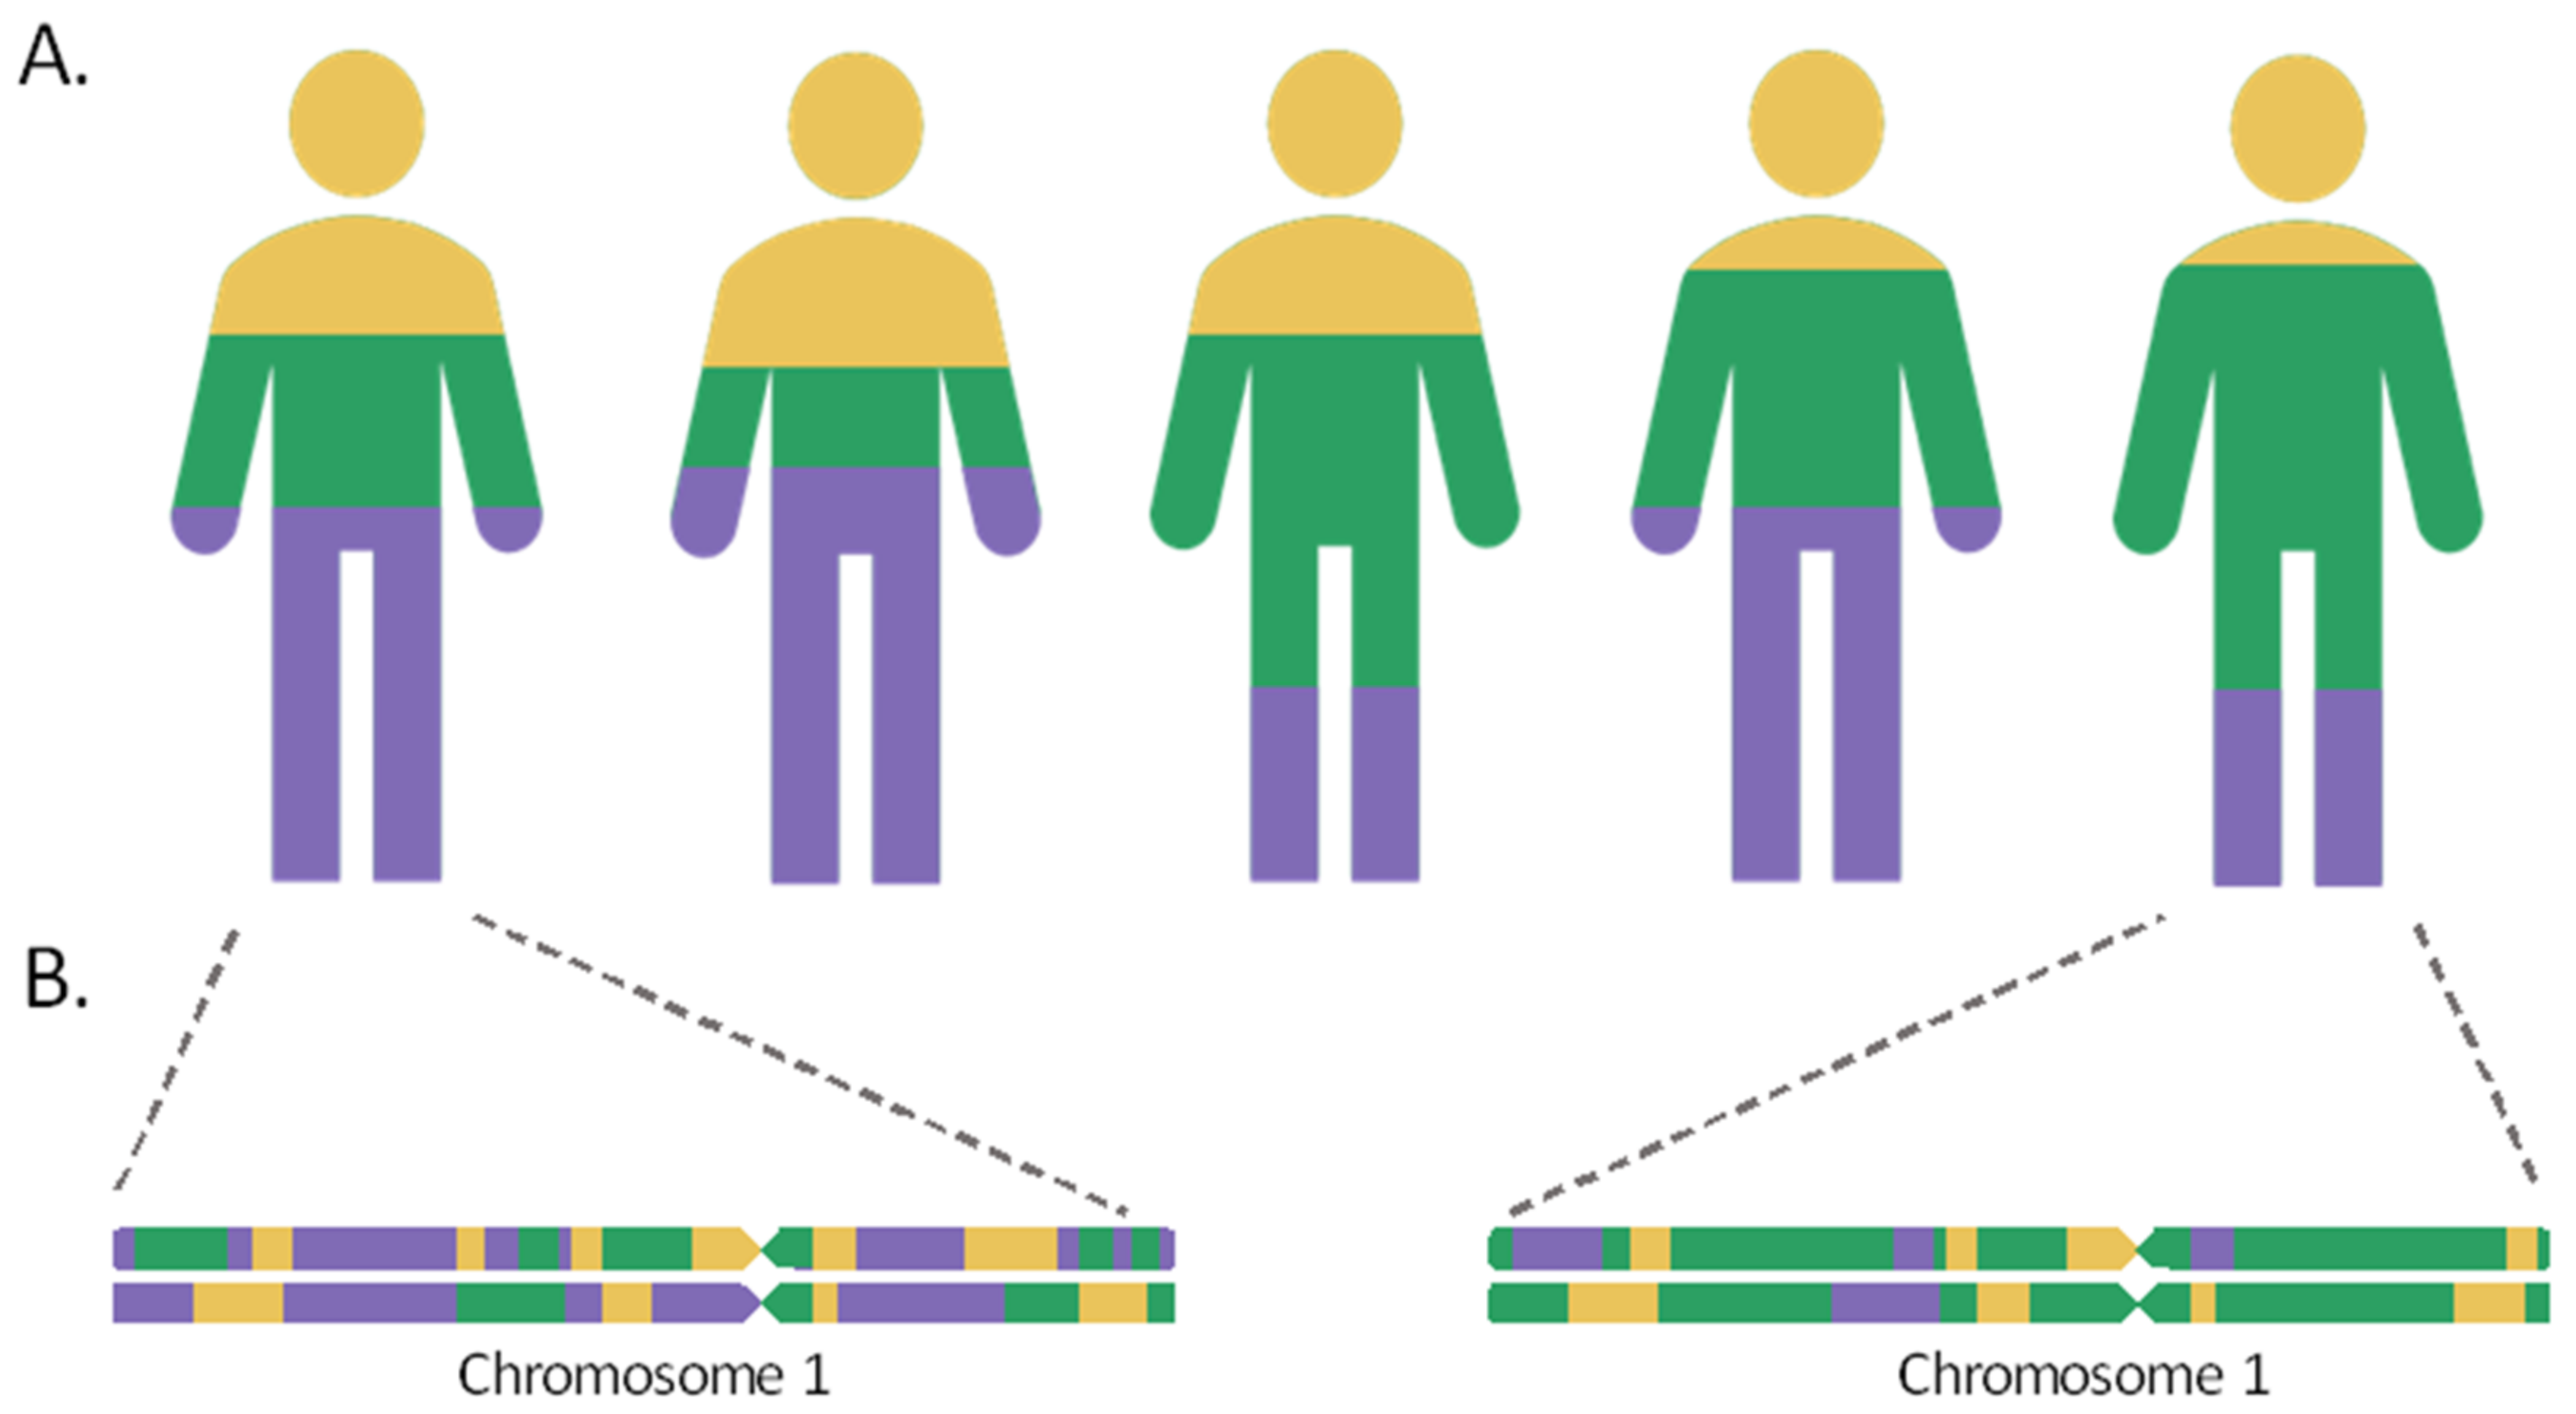
:1. Genetic Admixture
2. Estimation of Genetic Ancestry: Global and Local Ancestry

| SOFTWARE | Algorithm | Background LD | Phasing Requirement | Genetic Map | Physical Map | Number of Ancestral Populations | Reference |
|---|---|---|---|---|---|---|---|
| CHROMOPAINTER | HMM | Yes | Phased | Optional | No | ≥2 | [33] |
| EILA | k-means | No | Unphased | No | Yes | 2 or 3 | [34] |
| ELAI | Two layers HMM | Yes | Phased/Unphased a | No | No | ≥2 | [35] |
| HAPMIX | HMM | Yes | Phased /Unphased b | Yes | No | 2 | [36] |
| LAMP-LD | HMM | Yes | Phased/Unphased b | No | Yes | 2, 3 or 5 | [37] |
| Loter | Single layer HMM | No | Phased | No | No | ≥2 | [23] |
| PCAdmix | HMM and local PCA | No | Phased | Optional | Optional | ≥2 | [25] |
| RFMIX | CRF | No | Phased | Yes | No | ≥2 | [24] |
| SABER + | HMM | Yes | Phased | No | No | 2–4 | [38,39] |
| SEQMIX | HMM | No | Unphased | Yes | No | 2 | [40] |
| SupportMix | SVM | No | Phased | Yes | No | ≥2 | [26] |
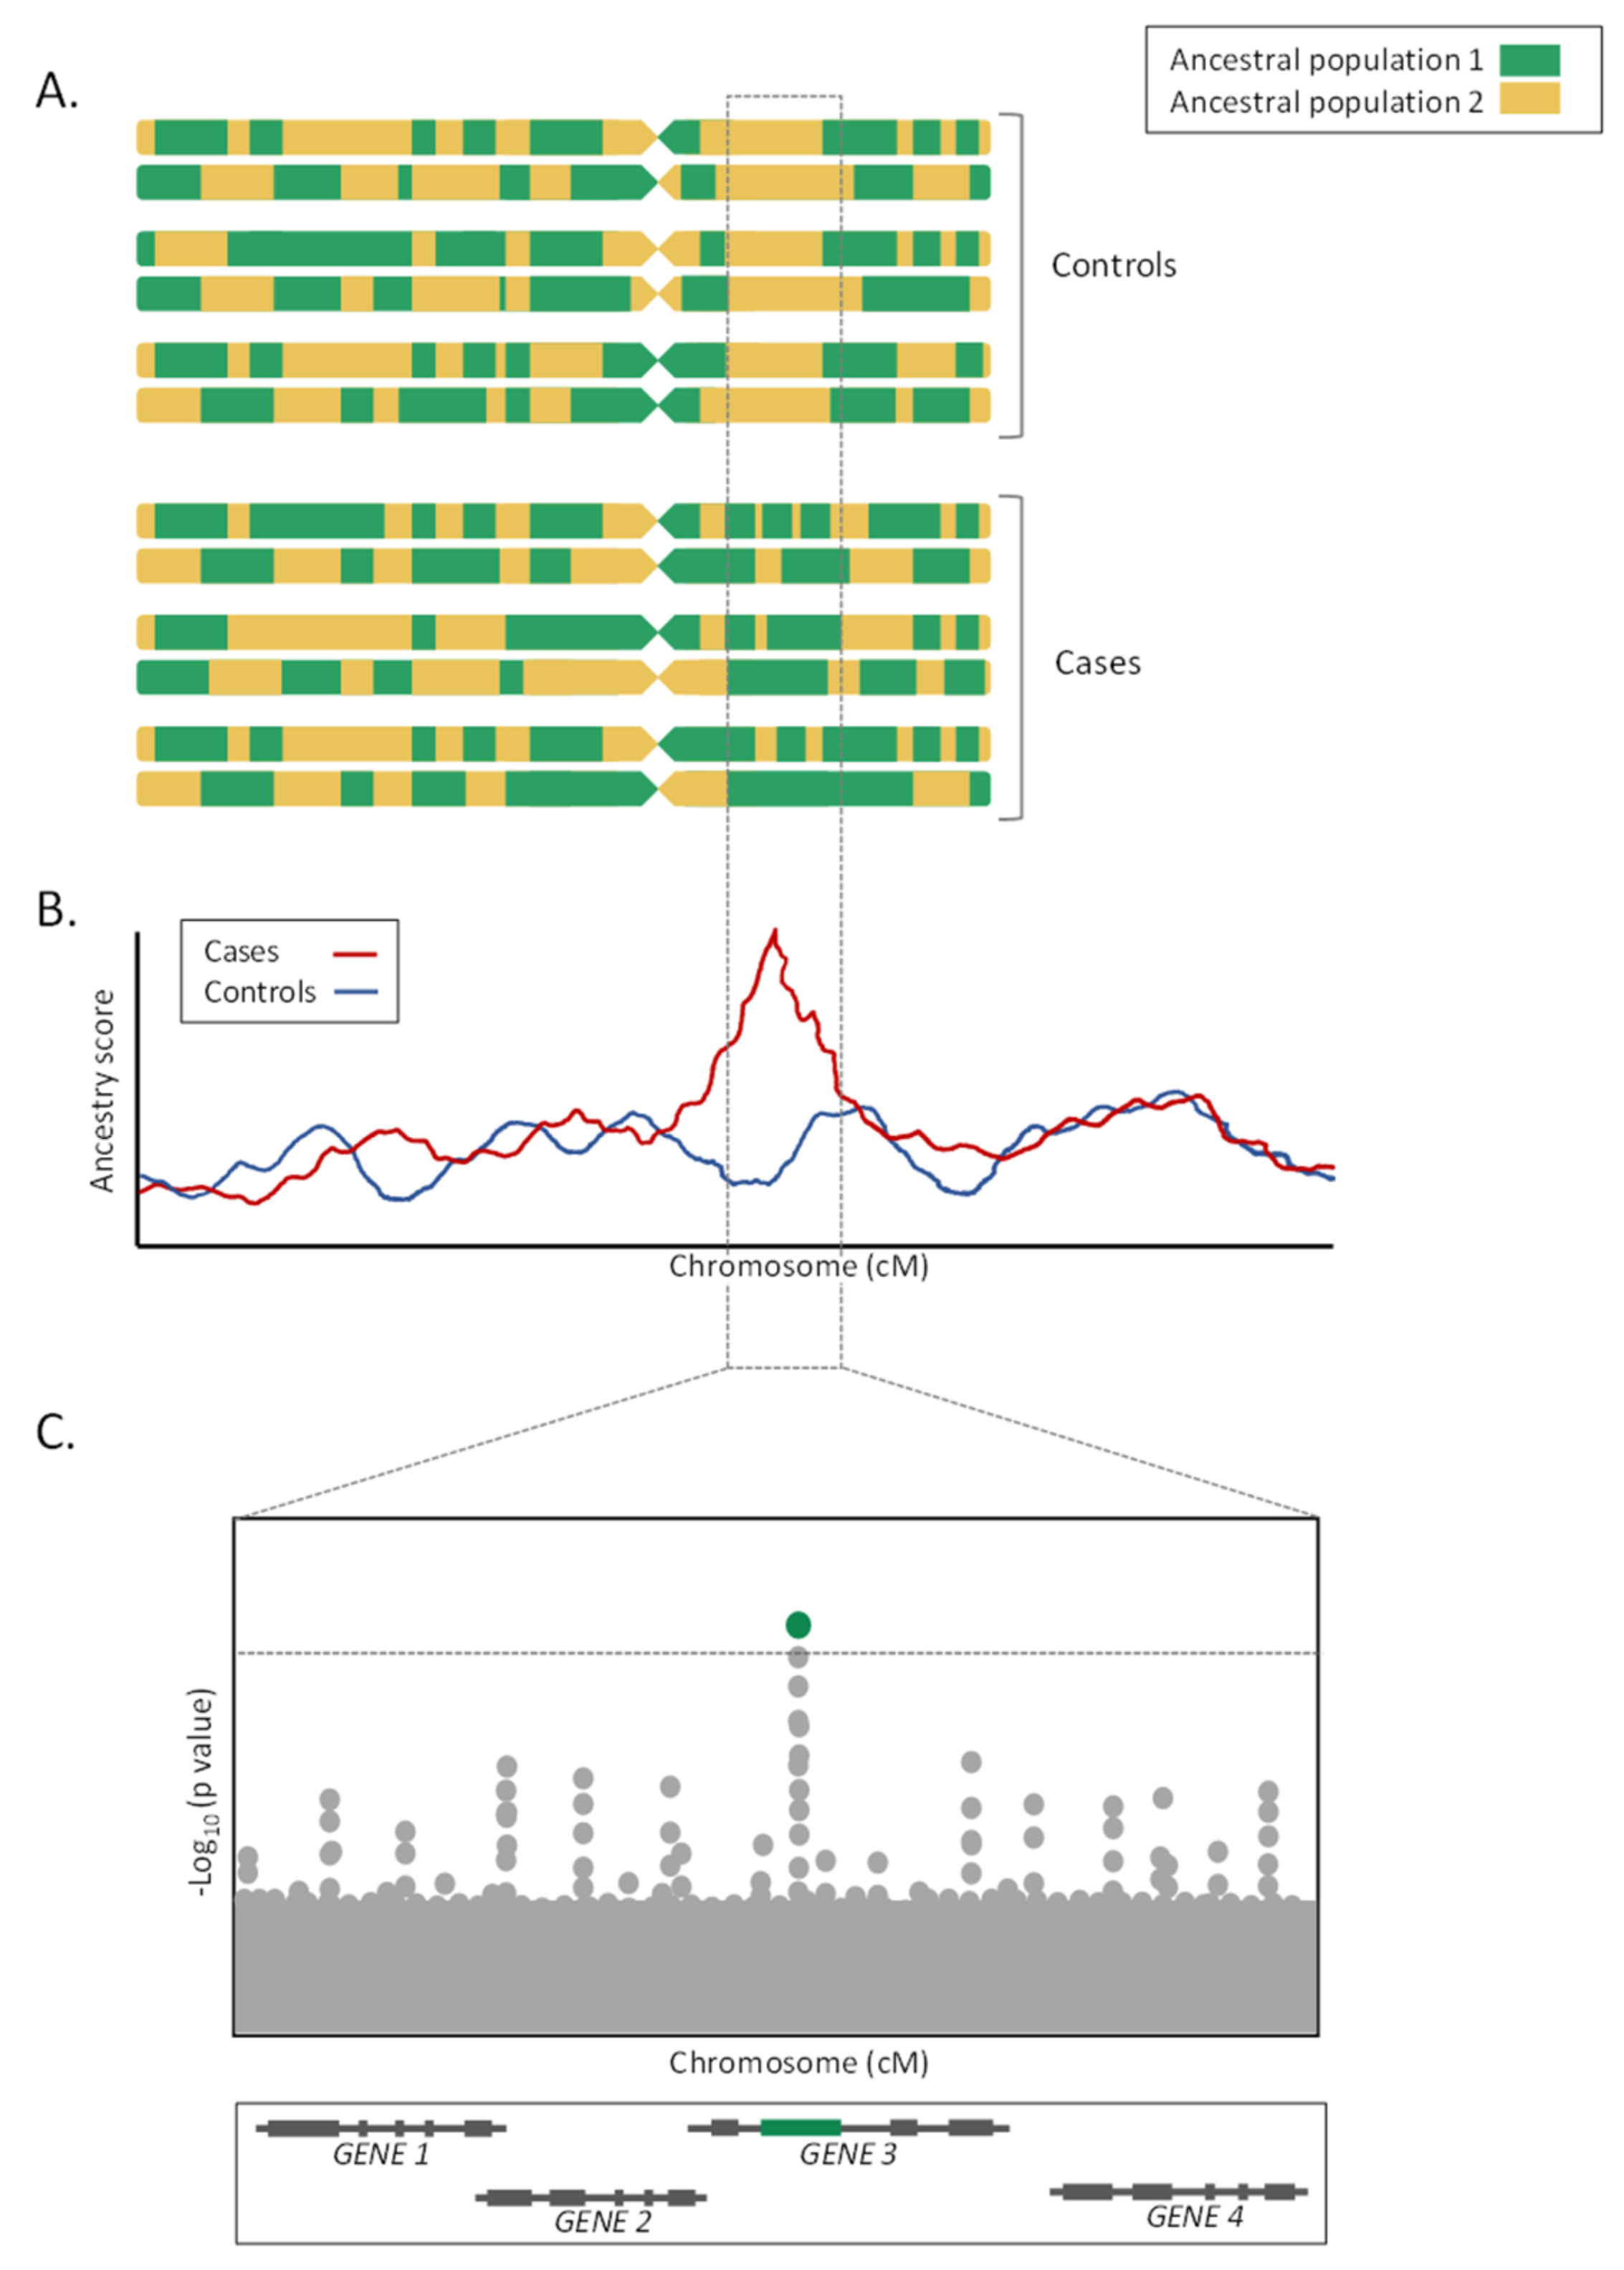
3. Admixture Mapping Studies
3.1. Definition
3.2. Advantages and Disadvantages of Admixture Mapping Studies
3.3. Applications of Admixture Mapping Studies in Biomedical Research
4. NGS and Genetic Ancestry Estimation
5. Concluding Remarks
Author Contributions
Funding
Institutional Review Board Statement
Informed Consent Statement
Data Availability Statement
Conflicts of Interest
References
- Jin, W.; Li, R.; Zhou, Y.; Xu, S. Distribution of ancestral chromosomal segments in admixed genomes and its implications for inferring population history and admixture mapping. Eur. J. Hum. Genet. 2014, 22, 930–937. [Google Scholar] [CrossRef] [PubMed] [Green Version]
- Guillen-Guio, B.; Lorenzo-Salazar, J.M.; Gonzalez-Montelongo, R.; Díaz-de Usera, A.; Marcelino-Rodrıguez, I.; Corrales, A.; de Leon, A.C.; Alonso, S.; Flores, C. Genomic analyses of human European diversity at the southwestern edge: Isolation, African influence and disease associations in the Canary Islands. Mol. Biol. Evol. 2018, 35, 3010–3026. [Google Scholar] [CrossRef] [PubMed] [Green Version]
- Loh, P.R.; Lipson, M.; Patterson, N.; Moorjani, P.; Pickrell, J.K.; Reich, D.; Berger, B. Inferring admixture histories of human populations using linkage disequilibrium. Genetics 2013, 193, 1233–1254. [Google Scholar] [CrossRef] [PubMed] [Green Version]
- Zhou, Y.; Qiu, H.; Xu, S. Modeling Continuous Admixture Using Admixture-Induced Linkage Disequilibrium. Sci. Rep. 2017, 7, 43054. [Google Scholar] [CrossRef] [PubMed] [Green Version]
- Chakraborty, R.; Weiss, K.M. Admixture as a tool for finding linked genes and detecting that difference from allelic association between loci. Proc. Natl. Acad. Sci. USA 1988, 85, 9119–9123. [Google Scholar] [CrossRef] [Green Version]
- Pfaff, C.L.; Parra, E.J.; Bonilla, C.; Hiester, K.; McKeigue, P.M.; Kamboh, M.I.; Hutchinson, R.G.; Ferrell, R.E.; Boerwinkle, E.; Shriver, M.D. Population structure in admixed populations: Effect of admixture dynamics on the pattern of linkage disequilibrium. Am. J. Hum. Genet. 2001, 68, 198–207. [Google Scholar] [CrossRef] [Green Version]
- Compston, A.; Coles, A. Multiple sclerosis. Lancet 2008, 372, 1502–1517. [Google Scholar] [CrossRef]
- Cho, N.H.; Shaw, J.E.; Karuranga, S.; Huang, Y.; da Rocha Fernandes, J.D.; Ohlrogge, A.W.; Malanda, B. IDF Diabetes Atlas: Global estimates of diabetes prevalence for 2017 and projections for 2045. Diabetes Res. Clin. Pract. 2018, 138, 271–281. [Google Scholar] [CrossRef] [PubMed]
- Mills, K.T.; Stefanescu, A.; He, J. The global epidemiology of hypertension. Nat. Rev. Nephrol. 2020, 16, 223–237. [Google Scholar] [CrossRef]
- Ortega, V.E.; Meyers, D.A. Pharmacogenetics: Implications of race and ethnicity on defining genetic profiles for personalized medicine. J. Allergy Clin. Immunol. 2014, 133, 16–26. [Google Scholar] [CrossRef] [Green Version]
- Suarez-Kurtz, G. Pharmacogenomics in admixed populations. Trends Pharmacol. Sci. 2005, 26, 196–201. [Google Scholar] [CrossRef]
- Villagra, D.; Duconge, J.; Windemuth, A.; Cadilla, C.L.; Kocherla, M.; Gorowski, K.; Bogaard, K.; Renta, J.Y.; Cruz, I.A.; Mirabal, S.; et al. CYP2C9 and VKORC1 genotypes in Puerto Ricans: A case for admixture-matching in clinical pharmacogenetic studies. Clin. Chim. Acta 2010, 411, 1306–1311. [Google Scholar] [CrossRef] [Green Version]
- Duconge, J.; Ramos, A.S.; Claudio-Campos, K.; Rivera-Miranda, G.; Bermúdez-Bosch, L.; Renta, J.Y.; Cadilla, C.L.; Cruz, I.; Feliu, J.F.; Vergara, C.; et al. A novel admixture-based pharmacogenetic approach to refine warfarin dosing in caribbean hispanics. PLoS ONE 2016, 11, e0145480. [Google Scholar] [CrossRef]
- Roche-Lima, A.; Roman-Santiago, A.; Feliu-Maldonado, R.; Rodriguez-Maldonado, J.; Nieves-Rodriguez, B.G.; Carrasquillo-Carrion, K.; Ramos, C.M.; Da Luz Sant’Ana, I.; Massey, S.E.; Duconge, J. Machine learning algorithm for predicting warfarin dose in caribbean hispanics using pharmacogenetic data. Front. Pharmacol. 2020, 10, 1–8. [Google Scholar] [CrossRef] [Green Version]
- Duconge, J.; Escalera, O.; Korchela, M.; Ruao, G. Clinical Implications of Genetic Admixture in Hispanic Puerto Ricans: Impact on the Pharmacogenetics of CYP2C19 and PON1. In Clinical Applications of Pharmacogenetics; IntechOpen: Rijeka, Croatia, 2012; Volume 19, pp. 151–163. [Google Scholar]
- Corvol, H.; De Giacomo, A.; Eng, C.; Seibold, M.; Ziv, E.; Chapela, R.; Rodriguez-Santana, J.R.; Rodriguez-Cintron, W.; Thyne, S.; Watson, H.G.; et al. Genetic ancestry modifies pharmacogenetic gene-gene interaction for asthma. Pharmacogenet. Genom. 2009, 19, 489–496. [Google Scholar] [CrossRef] [Green Version]
- Yang, J.J.; Cheng, C.; Devidas, M.; Cao, X.; Fan, Y.; Campana, D.; Yang, W.; Neale, G.; Cox, N.J.; Scheet, P.; et al. Ancestry and pharmacogenomics of relapse in acute lymphoblastic leukemia. Nat. Genet. 2011, 43, 237–241. [Google Scholar] [CrossRef] [PubMed] [Green Version]
- Falush, D.; Stephens, M.; Pritchard, J.K. Inference of population structure using multilocus genotype data: Dominant markers and null alleles. Mol. Ecol. Notes 2007, 7, 574–578. [Google Scholar] [CrossRef]
- Pritchard, J.K.; Stephens, M.; Donnelly, P. Inference of Population Structure Using Multilocus Genotype Data. Genetics 2000, 155, 945–959. [Google Scholar] [CrossRef] [PubMed]
- Alexander, D.H.; Novembre, J.; Lange, K. Fast model-based estimation of ancestry in unrelated individuals. Genome Res. 2009, 19, 1655–1664. [Google Scholar] [CrossRef] [PubMed] [Green Version]
- Alexander, D.H.; Lange, K. Enhancements to the ADMIXTURE algorithm for individual ancestry estimation. BMC Bioinform. 2011, 12, 246. [Google Scholar] [CrossRef] [PubMed] [Green Version]
- Limpiti, T.; Intarapanich, A.; Assawamakin, A.; Shaw, P.J.; Wangkumhang, P.; Piriyapongsa, J.; Ngamphiw, C.; Tongsima, S. Study of large and highly stratified population datasets by combining iterative pruning principal component analysis and structure. BMC Bioinform. 2011, 12, 255. [Google Scholar] [CrossRef] [PubMed] [Green Version]
- Dias-Alves, T.; Mairal, J.; Blum, M.G.B. Loter: A software package to infer local ancestry for a wide range of species. Mol. Biol. Evol. 2018, 35, 2318–2326. [Google Scholar] [CrossRef] [Green Version]
- Maples, B.K.; Gravel, S.; Kenny, E.E.; Bustamante, C.D. RFMix: A discriminative modeling approach for rapid and robust local-ancestry inference. Am. J. Hum. Genet. 2013, 93, 278–288. [Google Scholar] [CrossRef] [Green Version]
- Brisbin, A.; Bryc, K.; Byrnes, J.; Zakharia, F.; Omberg, L.; Degenhardt, J.; Reynolds, A.; Ostrer, H.; Mezey, J.G.; Bustamante, C.D. Pcadmix: Principal components-based assignment of ancestry along each chromosome in individuals with admixed ancestry from two or more populations. Hum. Biol. 2012, 84, 343–364. [Google Scholar] [CrossRef] [Green Version]
- Omberg, L.; Salit, J.; Hackett, N.; Fuller, J.; Matthew, R.; Chouchane, L.; Rodriguez-Flores, J.L.; Bustamante, C.; Crystal, R.G.; Mezey, J.G. Inferring genome-wide patterns of admixture in Qataris using fifty-five ancestral populations. BMC Genet. 2012, 13, 49. [Google Scholar] [CrossRef] [Green Version]
- Winkler, C.A.; Nelson, G.W.; Smith, M.W. Admixture Mapping Comes of Age. Annu. Rev. Genom. Hum. Genet. 2010, 11, 65–89. [Google Scholar] [CrossRef] [Green Version]
- Rosenberg, N.A.; Li, L.M.; Ward, R.; Pritchard, J.K. Informativeness of Genetic Markers for Inference of Ancestry. Am. J. Hum. Genet. 2003, 73, 1402–1422. [Google Scholar] [CrossRef] [PubMed] [Green Version]
- Ding, L.; Wiener, H.; Abebe, T.; Altaye, M.; Go, R.C.P.; Kercsmar, C.; Grabowski, G.; Martin, L.J.; Khurana Hershey, G.K.; Chakorborty, R.; et al. Comparison of measures of marker informativeness for ancestry and admixture mapping. BMC Genom. 2011, 12, 622. [Google Scholar] [CrossRef] [PubMed] [Green Version]
- Chen, G.; Shriner, D.; Zhou, J.; Doumatey, A.; Huang, H.; Gerry, N.P.; Herbert, A.; Christman, M.F.; Chen, Y.; Dunston, G.M.; et al. Development of admixture mapping panels for African Americans from commercial high-density SNP arrays. BMC Genom. 2010, 11, 417. [Google Scholar] [CrossRef] [PubMed] [Green Version]
- Xu, S.; Jin, L. A Genome-wide Analysis of Admixture in Uyghurs and a High-Density Admixture Map for Disease-Gene Discovery. Am. J. Hum. Genet. 2008, 83, 322–336. [Google Scholar] [CrossRef] [PubMed] [Green Version]
- Mao, X.; Bigham, A.W.; Mei, R.; Gutierrez, G.; Weiss, K.M.; Brutsaert, T.D.; Leon-Velarde, F.; Moore, L.G.; Vargas, E.; McKeigue, P.M.; et al. A genomewide admixture mapping panel for hispanic/latino populations. Am. J. Hum. Genet. 2007, 80, 1171–1178. [Google Scholar] [CrossRef] [PubMed] [Green Version]
- Lawson, D.J.; Hellenthal, G.; Myers, S.; Falush, D. Inference of population structure using dense haplotype data. PLoS Genet. 2012, 8, e1002453. [Google Scholar] [CrossRef] [Green Version]
- Yang, J.J.; Li, J.; Buu, A.; Williams, L.K. Efficient inference of local ancestry. Bioinformatics 2013, 29, 2750–2756. [Google Scholar] [CrossRef] [Green Version]
- Guan, Y. Detecting structure of haplotypes and local ancestry. Genetics 2014, 196, 625–642. [Google Scholar] [CrossRef] [Green Version]
- Price, A.L.; Tandon, A.; Patterson, N.; Barnes, K.C.; Rafaels, N.; Ruczinski, I.; Beaty, T.H.; Mathias, R.; Reich, D.; Myers, S. Sensitive detection of chromosomal segments of distinct ancestry in admixed populations. PLoS Genet. 2009, 5, e1000519. [Google Scholar] [CrossRef] [Green Version]
- Baran, Y.; Pasaniuc, B.; Sankararaman, S.; Torgerson, D.G.; Gignoux, C.; Eng, C.; Rodriguez-Cintron, W.; Chapela, R.; Ford, J.G.; Avila, P.C.; et al. Fast and accurate inference of local ancestry in Latino populations. Bioinformatics 2012, 28, 1359–1367. [Google Scholar] [CrossRef] [Green Version]
- Tang, H.; Coram, M.; Wang, P.; Zhu, X.; Risch, N. Reconstructing genetic ancestry blocks in admixed individuals. Am. J. Hum. Genet. 2006, 79, 1–12. [Google Scholar] [CrossRef] [PubMed] [Green Version]
- Johnson, N.A.; Coram, M.A.; Shriver, M.D.; Romieu, I.; Barsh, G.S.; London, S.J.; Tang, H. Ancestral Components of Admixed Genomes in a Mexican Cohort. PLoS Genet. 2011, 7, e1002410. [Google Scholar] [CrossRef] [Green Version]
- Hu, Y.; Willer, C.; Zhan, X.; Kang, H.M.; Abecasis, G.R. Accurate Local-Ancestry Inference in Exome-Sequenced Admixed Individuals via Off-Target Sequence Reads. Am. J. Hum. Genet. 2013, 93, 891–899. [Google Scholar] [CrossRef] [Green Version]
- Uren, C.; Hoal, E.G.; Möller, M. Putting RFMix and ADMIXTURE to the test in a complex admixed population. BMC Genet. 2020, 21, 40. [Google Scholar] [CrossRef] [Green Version]
- Geza, E.; Mugo, J.; Mulder, N.J.; Wonkam, A.; Chimusa, E.R.; Mazandu, G.K. A comprehensive survey of models for dissecting local ancestry deconvolution in human genome. Brief. Bioinform. 2019, 20, 1709–1724. [Google Scholar] [CrossRef]
- Schubert, R.; Andaleon, A.; Wheeler, H.E. Comparing local ancestry inference models in populations of two- And three-way admixture. PeerJ 2020, 8, 1–19. [Google Scholar] [CrossRef] [PubMed]
- Hui, D.; Fang, Z.; Lin, J.; Duan, Q.; Li, Y.; Hu, M.; Chen, W. LAIT: A local ancestry inference toolkit. BMC Genet. 2017, 18, 83. [Google Scholar] [CrossRef] [PubMed] [Green Version]
- Yuan, K.; Zhou, Y.; Ni, X.; Wang, Y.; Liu, C.; Xu, S. Models, methods and tools for ancestry inference and admixture analysis. Quant. Biol. 2017, 5, 236–250. [Google Scholar] [CrossRef] [Green Version]
- Thornton, T.A.; Bermejo, J.L. Local and global ancestry inference and applications to genetic association analysis for admixed Populations. Genet. Epidemiol. 2014, 38, S5–S12. [Google Scholar] [CrossRef] [Green Version]
- Browning, S.R.; Browning, B.L. Haplotype phasing: Existing methods and new developments. Nat. Rev. Genet. 2011, 12, 703–714. [Google Scholar] [CrossRef] [Green Version]
- Shriner, D.; Adeyemo, A.; Ramos, E.; Chen, G.; Rotimi, C.N. Mapping of disease-associated variants in admixed populations. Genome Biol. 2011, 12, 223. [Google Scholar] [CrossRef] [Green Version]
- Auton, A.; Abecasis, G.R.; Altshuler, D.M.; Durbin, R.M.; Bentley, D.R.; Chakravarti, A.; Clark, A.G.; Donnelly, P.; Eichler, E.E.; Flicek, P.; et al. A global reference for human genetic variation. Nature 2015, 526, 68–74. [Google Scholar] [CrossRef] [Green Version]
- Claiborne Stephens, J.; Briscoe, D.; O’Brien, S.J. Mapping by admixture linkage disequilibrium in human populations: Limits and guidelines. Am. J. Hum. Genet. 1994, 55, 809–824. [Google Scholar] [PubMed]
- McKeigue, P.M. Mapping genes underlying ethnic differences in disease risk by linkage disequilibrium in recently admixed populations. Am. J. Hum. Genet. 1997, 60, 188–196. [Google Scholar] [PubMed]
- McKeigue, P.M. Mapping genes that underlie ethnic differences in disease risk: Methods for detecting linkage in admixed populations, by conditioning on parental admixture. Am. J. Hum. Genet. 1998, 63, 241–251. [Google Scholar] [CrossRef] [Green Version]
- Hoggart, C.J.; Shriver, M.D.; Kittles, R.A.; Clayton, D.G.; McKeigue, P.M. Design and Analysis of Admixture Mapping Studies. Am. J. Hum. Genet. 2004, 74, 965–978. [Google Scholar] [CrossRef] [Green Version]
- Montana, G.; Pritchard, J.K. Statistical tests for admixture mapping with case-control and cases-only data. Am. J. Hum. Genet. 2004, 75, 771–789. [Google Scholar] [CrossRef] [Green Version]
- Hoggart, C.J.; Parra, E.J.; Shriver, M.D.; Bonilla, C.; Kittles, R.A.; Clayton, D.G.; McKeigue, P.M. Control of confounding of genetic associations in stratified populations. Am. J. Hum. Genet. 2003, 72, 1492–1504. [Google Scholar] [CrossRef] [Green Version]
- Patterson, N.; Hattangadi, N.; Lane, B.; Lohmueller, K.E.; Hafler, D.A.; Oksenberg, J.R.; Hauser, S.L.; Smith, M.W.; O’Brien, S.J.; Altshuler, D.; et al. Methods for High-Density Admixture Mapping of Disease Genes. Am. J. Hum. Genet. 2004, 74, 979–1000. [Google Scholar] [CrossRef] [Green Version]
- Atkinson, E.G.; Maihofer, A.X.; Kanai, M.; Martin, A.R.; Karczewski, K.J.; Santoro, M.L.; Ulirsch, J.C.; Kamatani, Y.; Okada, Y.; Finucane, H.K.; et al. Tractor uses local ancestry to enable the inclusion of admixed individuals in GWAS and to boost powe. Nat. Genet. 2021. [Google Scholar] [CrossRef]
- Wang, X.; Zhu, X.; Qin, H.; Cooper, R.S.; Ewens, W.J.; Li, C.; Li, M. Adjustment for local ancestry in genetic association analysis of admixed populations. Bioinformatics 2011, 27, 670–677. [Google Scholar] [CrossRef] [Green Version]
- Conomos, M.P.; Miller, M.; Thornton, T. Robust Inference of Population Structure for Ancestry Prediction and Correction of Stratification in the Presence of Relatedness. Genet. Epidemiol. 2015, 39, 276–293. [Google Scholar] [CrossRef] [Green Version]
- Kang, H.M.; Sul, J.H.; Service, S.K.; Zaitlen, N.A.; Kong, S.; Freimer, N.B.; Sabatti, C.; Eskin, E. Variance component model to account for sample structure in genome-wide association studies. Nat. Genet. 2010, 42, 348–354. [Google Scholar] [CrossRef] [Green Version]
- Buniello, A.; Macarthur, J.A.L.; Cerezo, M.; Harris, L.W.; Hayhurst, J.; Malangone, C.; McMahon, A.; Morales, J.; Mountjoy, E.; Sollis, E.; et al. The NHGRI-EBI GWAS Catalog of published genome-wide association studies, targeted arrays and summary statistics 2019. Nucleic Acids Res. 2019, 47, D1005–D1012. [Google Scholar] [CrossRef] [Green Version]
- Abou Tayoun, A.N.; Rehm, H.L. Genetic variation in the Middle East—An opportunity to advance the human genetics field. Genome Med. 2020, 12, 12–15. [Google Scholar] [CrossRef]
- Derks, E.M.; Zwinderman, A.H.; Gamazon, E.R. The Relation Between Inflation in Type-I and Type-II Error Rate and Population Divergence in Genome-Wide Association Analysis of Multi-Ethnic Populations. Behav. Genet. 2017, 47, 360–368. [Google Scholar] [CrossRef] [Green Version]
- Shriner, D. Overview of Admixture Mapping. Curr. Protoc. Hum. Genet. 2017, 94, 1.23.1–1.23.8. [Google Scholar] [CrossRef]
- Smith, M.W.; O’Brien, S.J. Mapping by admixture linkage disequilibrium: Advances, limitations and guidelines. Nat. Rev. Genet. 2005, 6, 623–632. [Google Scholar] [CrossRef]
- Reiner, A.P.; Ziv, E.; Lind, D.L.; Nievergelt, C.M.; Schork, N.J.; Cummings, S.R.; Phong, A.; Burchard, E.G.; Harris, T.B.; Psaty, B.M.; et al. Population structure, admixture, and aging-related phenotypes in African American adults: The cardiovascular health study. Am. J. Hum. Genet. 2005, 76, 463–477. [Google Scholar] [CrossRef] [Green Version]
- Bonilla, C.; Parra, E.J.; Pfaff, C.L.; Dios, S.; Marshall, J.A.; Hamman, R.F.; Ferrell, R.E.; Hoggart, C.L.; McKeigue, P.M.; Shriver, M.D. Admixture in the Hispanics of the San Luis Valley, Colorado, and its implications for complex trait gene mapping. Ann. Hum. Genet. 2004, 68, 139–153. [Google Scholar] [CrossRef] [Green Version]
- Bryc, K.; Durand, E.Y.; Macpherson, J.M.; Reich, D.; Mountain, J.L. The genetic ancestry of african americans, latinos, and european Americans across the United States. Am. J. Hum. Genet. 2015, 96, 37–53. [Google Scholar] [CrossRef] [Green Version]
- Freedman, M.L.; Haiman, C.A.; Patterson, N.; McDonald, G.J.; Tandon, A.; Waliszewska, A.; Penney, K.; Steen, R.G.; Ardlie, K.; John, E.M.; et al. Admixture mapping identifies 8q24 as a prostate cancer risk locus in African-American men. Proc. Natl. Acad. Sci. USA 2006, 103, 14068–14073. [Google Scholar] [CrossRef] [Green Version]
- Bock, C.H.; Schwartz, A.G.; Ruterbusch, J.J.; Levin, A.M.; Neslund-Dudas, C.; Land, S.J.; Wenzlaff, A.S.; Reich, D.; McKeigue, P.; Chen, W.; et al. Results from a prostate cancer admixture mapping study in African-American men. Hum. Genet. 2009, 126, 637–642. [Google Scholar] [CrossRef] [Green Version]
- Ruiz-Narváez, E.A.; Sucheston-Campbell, L.; Bensen, J.T.; Yao, S.; Haddad, S.; Haiman, C.A.; Bandera, E.V.; John, E.M.; Bernstein, L.; Hu, J.J.; et al. Admixture mapping of African-American women in the AMBER Consortium identifies new loci for breast cancer and estrogen-receptor subtypes. Front. Genet. 2016, 7, 1–10. [Google Scholar] [CrossRef] [Green Version]
- Schwartz, A.G.; Wenzlaff, A.S.; Bock, C.H.; Ruterbusch, J.J.; Chen, W.; Cote, M.L.; Artis, A.S.; van Dyke, A.L.; Land, S.J.; Harris, C.C.; et al. Admixture mapping of lung cancer in 1812 African-Americans. Carcinogenesis 2011, 32, 312–317. [Google Scholar] [CrossRef] [Green Version]
- Zhu, X.; Luke, A.; Cooper, R.S.; Quertermous, T.; Hanis, C.; Mosley, T.; Gu, C.C.; Tang, H.; Rao, D.C.; Risch, N.; et al. Admixture mapping for hypertension loci with genome-scan markers. Nat. Genet. 2005, 37, 177–181. [Google Scholar] [CrossRef]
- Gignoux, C.R.; Torgerson, D.G.; Pino-Yanes, M.; Uricchio, L.H.; Galanter, J.; Roth, L.A.; Eng, C.; Hu, D.; Nguyen, E.A.; Huntsman, S.; et al. An admixture mapping meta-analysis implicates genetic variation at 18q21 with asthma susceptibility in Latinos. J. Allergy Clin. Immunol. 2019, 143, 957–969. [Google Scholar] [CrossRef]
- Chi, C.; Shao, X.; Rhead, B.; Gonzales, E.; Smith, J.B.; Xiang, A.H.; Graves, J.; Waldman, A.; Lotze, T.; Schreiner, T.; et al. Admixture mapping reveals evidence of differential multiple sclerosis risk by genetic ancestry. PLoS Genet. 2019, 15, e1007808. [Google Scholar] [CrossRef]
- Daya, M.; van der Merwe, L.; Gignoux, C.R.; van Helden, P.D.; Möller, M.; Hoal, E.G. Using multi-way admixture mapping to elucidate TB susceptibility in the South African Coloured population. BMC Genom. 2014, 15, 1021. [Google Scholar] [CrossRef] [Green Version]
- Cyr, D.D.; Allen, A.S.; Du, G.; Ruf, F.; Adams, C.; Thaden, J.T.; Maskarinec, S.A.; Souli, M.; Guo, S.; Dykxhoorn, D.M.; et al. Evaluating genetic susceptibility to Staphylococcus aureus bacteremia in African Americans using admixture mapping. Genes Immun. 2017, 18, 95–99. [Google Scholar] [CrossRef] [Green Version]
- Spear, M.L.; Hu, D.; Pino-Yanes, M.; Huntsman, S.; Eng, C.; Levin, A.M.; Ortega, V.E.; White, M.J.; McGarry, M.E.; Thakur, N.; et al. A genome-wide association and admixture mapping study of bronchodilator drug response in African Americans with asthma. Pharm. J. 2019, 19, 249–259. [Google Scholar] [CrossRef]
- Kim, S.K.; Gignoux, C.R.; Wall, J.D.; Lum-Jones, A.; Wang, H.; Haiman, C.A.; Chen, G.K.; Henderson, B.E.; Kolonel, L.N.; Le Marchand, L.; et al. Population Genetic Structure and Origins of Native Hawaiians in the Multiethnic Cohort Study. PLoS ONE 2012, 7, e47881. [Google Scholar] [CrossRef] [Green Version]
- Mau, M.K.; Sinclair, K.; Saito, E.P.; Baumhofer, K.N.; Kaholokula, J.K.A. Cardiometabolic health disparities in native hawaiians and other pacific islanders. Epidemiol. Rev. 2009, 31, 113–129. [Google Scholar] [CrossRef] [Green Version]
- Maskarinec, G.; Erber, E.; Grandinetti, A.; Verheus, M.; Oum, R.; Hopping, B.N.; Schmidt, M.M.; Uchida, A.; Juarez, D.T.; Hodges, K.; et al. Diabetes incidence based on linkages with health plans: The multiethnic cohort. Diabetes 2009, 58, 1732–1738. [Google Scholar] [CrossRef] [Green Version]
- Sun, H.; Lin, M.; Russell, E.M.; Minster, R.L.; Chan, T.F.; Dinh, B.L.; Naseri, T.; Reupena, M.S.; Lum-Jones, A.; Cheng, I.; et al. The impact of global and local Polynesian genetic ancestry on complex traits in Native Hawaiians. PLOS Genet. 2021, 17, e1009273. [Google Scholar] [CrossRef] [PubMed]
- Guillen-Guio, B.; Hernández-Beeftink, T.; Marcelino-Rodriguez, I.; Rodríguez-Pérez, H.; Lorenzo-Salazar, J.M.; Espinilla-Peña, M.; Corrales, A.; Pino-Yanes, M.; Callero, A.; Perez-Rodriguez, E.; et al. Admixture mapping of asthma in southwestern Europeans with North African ancestry influences. Am. J. Physiol. Cell. Mol. Physiol. 2020, 318, 965–975. [Google Scholar] [CrossRef] [PubMed]
- Beleza, S.; Campos, J.; Lopes, J.; Araújo, I.I.; Hoppfer Almada, A.; Correia e Silva, A.; Parra, E.J.; Rocha, J. The Admixture Structure and Genetic Variation of the Archipelago of Cape Verde and Its Implications for Admixture Mapping Studies. PLoS ONE 2012, 7, e51103. [Google Scholar] [CrossRef] [Green Version]
- Wang, L.J.; Zhang, C.W.; Su, S.C.; Chen, H.I.H.; Chiu, Y.C.; Lai, Z.; Bouamar, H.; Ramirez, A.G.; Cigarroa, F.G.; Sun, L.Z.; et al. An ancestry informative marker panel design for individual ancestry estimation of Hispanic population using whole exome sequencing data. BMC Genom. 2019, 20, 1007. [Google Scholar] [CrossRef] [Green Version]
- Brown, R.; Pasaniuc, B. Enhanced Methods for Local Ancestry Assignment in Sequenced Admixed Individuals. PLoS Comput. Biol. 2014, 10, e1003555. [Google Scholar] [CrossRef]
- Maróti, Z.; Boldogkői, Z.; Tombácz, D.; Snyder, M.; Kalmár, T. Evaluation of whole exome sequencing as an alternative to BeadChip and whole genome sequencing in human population genetic analysis. BMC Genom. 2018, 19, 778. [Google Scholar] [CrossRef] [Green Version]
- Lachance, J.; Tishkoff, S.A. SNP ascertainment bias in population genetic analyses: Why it is important, and how to correct it. BioEssays 2013, 35, 780–786. [Google Scholar] [CrossRef] [Green Version]
- Díaz-de Usera, A.; Lorenzo-Salazar, J.M.; Rubio-Rodríguez, L.A.; Muñoz-Barrera, A.; Guillen-Guio, B.; Marcelino-Rodríguez, I.; García-Olivares, V.; Mendoza-Alvarez, A.; Corrales, A.; Íñigo-Campos, A.; et al. Evaluation of Whole-Exome Enrichment Solutions: Lessons from the High-End of the Short-Read Sequencing Scale. J. Clin. Med. 2020, 9, 3656. [Google Scholar] [CrossRef]
- Liu, Z.; Shriner, D.; Hansen, N.F.; Rotimi, C.N.; Mullikin, J.C.; Barnabas, B.B.; Black, S.; Bouffard, G.G.; Brooks, S.Y.; Coleman, H.; et al. Admixture mapping identifies genetic regions associated with blood pressure phenotypes in African Americans. PLoS ONE 2020, 15, e0232048. [Google Scholar] [CrossRef] [Green Version]
- Lin, B.M.; Grinde, K.E.; Brody, J.A.; Breeze, C.E.; Raffield, L.M.; Mychaleckyj, J.C.; Thornton, T.A.; Perry, J.A.; Baier, L.J.; de las Fuentes, L.; et al. Whole genome sequence analyses of eGFR in 23,732 people representing multiple ancestries in the NHLBI trans-omics for precision medicine (TOPMed) consortium. EBioMedicine 2021, 63, 103157. [Google Scholar] [CrossRef]
- Mulder, N.; Abimiku, A.; Adebamowo, S.N.; de Vries, J.; Matimba, A.; Olowoyo, P.; Ramsay, M.; Skelton, M.; Stein, D.J. H3Africa: Current perspectives. Pharmgenomics Pers. Med. 2018, 11, 59–66. [Google Scholar] [CrossRef] [Green Version]
- De Vries, J.; Tindana, P.; Littler, K.; Ramsay, M.; Rotimi, C.; Abayomi, A.; Mulder, N.; Mayosi, B.M.; Europe PMC Funders Group. The H3Africa policy framework: Negotiating fairness in genomics. Trends Genet. 2015, 31, 117–119. [Google Scholar] [CrossRef] [PubMed] [Green Version]
- Al-Ali, M.; Osman, W.; Tay, G.K.; Alsafar, H.S. A 1000 Arab genome project to study the Emirati population. J. Hum. Genet. 2018, 63, 533–536. [Google Scholar] [CrossRef]
- Sirugo, G.; Williams, S.M.; Tishkoff, S.A. The Missing Diversity in Human Genetic Studies. Cell 2019, 177, 26–31. [Google Scholar] [CrossRef] [Green Version]
- Manrai, A.K.; Funke, B.H.; Rehm, H.L.; Olesen, M.S.; Maron, B.A.; Szolovits, P.; Margulies, D.M.; Loscalzo, J.; Kohane, I.S. Genetic Misdiagnoses and the Potential for Health Disparities. N. Engl. J. Med. 2016, 375, 655–665. [Google Scholar] [CrossRef]
- Li, X.; Battle, A.; Karczewski, K.J.; Zappala, Z.; Knowles, D.A.; Smith, K.S.; Kukurba, K.R.; Wu, E.; Simon, N.; Montgomery, S.B. Transcriptome sequencing of a large human family identifies the impact of rare noncoding variants. Am. J. Hum. Genet. 2014, 95, 245–256. [Google Scholar] [CrossRef] [PubMed] [Green Version]
- Bhattacharya, A.; García-Closas, M.; Olshan, A.F.; Perou, C.M.; Troester, M.A.; Love, M.I. A framework for transcriptome-wide association studies in breast cancer in diverse study populations. Genome Biol. 2020, 21, 42. [Google Scholar] [CrossRef] [Green Version]
- Roelands, J.; Mall, R.; Almeer, H.; Thomas, R.; Mohamed, M.G.; Bedri, S.; Al-Bader, S.B.; Junejo, K.; Ziv, E.; Sayaman, R.W.; et al. Ancestry-associated transcriptomic profiles of breast cancer in patients of African, Arab, and European ancestry. npj Breast Cancer 2021, 7, 10. [Google Scholar] [CrossRef]
- Duncan, L.; Shen, H.; Gelaye, B.; Meijsen, J.; Ressler, K.; Feldman, M.; Peterson, R.; Domingue, B. Analysis of polygenic risk score usage and performance in diverse human populations. Nat. Commun. 2019, 10, 3328. [Google Scholar] [CrossRef]
- Cavazos, T.B.; Witte, J.S. Inclusion of variants discovered from diverse populations improves polygenic risk score transferability. Hum. Genet. Genomics Adv. 2021, 2, 100017. [Google Scholar] [CrossRef]
- Bitarello, B.D.; Mathieson, I. Polygenic Scores for Height in Admixed Populations. G3 Genes Genomes Genet. 2020, 10, 4027–4036. [Google Scholar] [CrossRef] [PubMed]
- Momozawa, Y.; Mizukami, K. Unique roles of rare variants in the genetics of complex diseases in humans. J. Hum. Genet. 2021, 66, 11–23. [Google Scholar] [CrossRef] [PubMed]
- Kosmicki, J.A.; Churchhouse, C.L.; Rivas, M.A.; Neale, B.M. Discovery of rare variants for complex phenotypes. Hum. Genet. 2016, 135, 625–634. [Google Scholar] [CrossRef] [PubMed]
- Qin, H.; Zhao, J.; Zhu, X. Identifying Rare Variant Associations in Admixed Populations. Sci. Rep. 2019, 9, 5458. [Google Scholar] [CrossRef]


| Concept | Definition |
|---|---|
| Ancestry informative marker (AIM) | Genetic variants, usually SNPs, that show large frequency differences between the parental populations and that are, thus, highly informative for ancestry estimation in admixed populations. |
| Admixture model | A simple model to describe how gene flow between ancestral populations could have occurred. Admixed populations can be the result of a mixture between individuals from two or more populations and that can be maintained in various generations (gradual admixture) or be a result of a single event (hybrid isolation). |
| Ancestry estimation | In admixed populations, this allows the determination of the proportion of each of the ancestries for a given admixture model. |
| Global ancestry (GA) | Estimated ancestry proportion with which each parental population contributes on average to the genome of an admixed individual for a given admixture model. |
| Local ancestry (LA) | Estimated ancestry proportion with which each parental population contributes to each locus of the genome of an admixed individual for a given admixture model. |
| Admixture mapping | Method that allows detecting if the genetic ancestry of a particular section of the genome in a mixed population tends to be inherited with a particular trait. |
| Advantages | Disadvantages |
|---|---|
|
|
Publisher’s Note: MDPI stays neutral with regard to jurisdictional claims in published maps and institutional affiliations. |
© 2021 by the authors. Licensee MDPI, Basel, Switzerland. This article is an open access article distributed under the terms and conditions of the Creative Commons Attribution (CC BY) license (https://creativecommons.org/licenses/by/4.0/).
Share and Cite
Suarez-Pajes, E.; Díaz-de Usera, A.; Marcelino-Rodríguez, I.; Guillen-Guio, B.; Flores, C. Genetic Ancestry Inference and Its Application for the Genetic Mapping of Human Diseases. Int. J. Mol. Sci. 2021, 22, 6962. https://doi.org/10.3390/ijms22136962
Suarez-Pajes E, Díaz-de Usera A, Marcelino-Rodríguez I, Guillen-Guio B, Flores C. Genetic Ancestry Inference and Its Application for the Genetic Mapping of Human Diseases. International Journal of Molecular Sciences. 2021; 22(13):6962. https://doi.org/10.3390/ijms22136962
Chicago/Turabian StyleSuarez-Pajes, Eva, Ana Díaz-de Usera, Itahisa Marcelino-Rodríguez, Beatriz Guillen-Guio, and Carlos Flores. 2021. "Genetic Ancestry Inference and Its Application for the Genetic Mapping of Human Diseases" International Journal of Molecular Sciences 22, no. 13: 6962. https://doi.org/10.3390/ijms22136962