Article

Short-Term Effect of a Low-Protein High-Carbohydrate Diet on Mature Female and Male, and Neomale Rainbow Trout

NUMEA, INRA, University Pau & Pays Adour, E2S UPPA, 64310 Saint-Pée-sur-Nivelle, France
*
Author to whom correspondence should be addressed.
Int. J. Mol. Sci. 2021, 22(11), 6149; https://doi.org/10.3390/ijms22116149
Submission received: 7 May 2021 / Revised: 31 May 2021 / Accepted: 2 June 2021 / Published: 7 June 2021
(This article belongs to the Section Molecular Biology)

Abstract

:
Rainbow trout are considered as a poor user of dietary carbohydrates, displaying persistent postprandial hyperglycaemia when fed a diet containing high amounts of carbohydrates. While this phenotype is well-described in juveniles, less attention was given to broodstock. Our objective was to assess for the first time the short-term consequences of feeding mature female and male, and neomale trout with a low-protein high-carbohydrate diet on glucose and lipid metabolism. Fish were fed for two days with a diet containing either no or 32% of carbohydrates. We analysed plasma metabolites, mRNA levels and enzymatic activities of glycolysis, gluconeogenesis, de novo lipogenesis and β-oxidation in the liver. Results demonstrated that the glucose and lipid metabolism were regulated by the nutritional status in all sexes, irrespective of the carbohydrate intake. These data point out that carbohydrate intake during a short period (5 meals) at 8 °C did not induce specific metabolic changes in broodstock. Finally, we demonstrated, for the first time, sex differences regarding the consequences of two days of feeding on glucose and lipid metabolism.

1. Introduction

Salmonid species, and more specifically rainbow trout (Oncorhynchus mykiss), are carnivorous species and are poor users of digestible carbohydrates. Nonetheless, the inclusion of carbohydrates in the aquafeed formula stems from the replacement of fish-derived products in recent years by more sustainable ingredients, such as animal processed proteins and plant-derived products [1]. However, when the substitution of fish meal (FM) by digestible carbohydrates exceeds 20% in the aquafeed formula, in the long term, rainbow trout display a decrease of growth and a persistent postprandial hyperglycaemia [2,3,4]. Several hypotheses have been proposed to explain this phenotype. Among them is the non-inhibition of the production of endogenous glucose by the liver through gluconeogenesis [5]. De novo lipogenesis is another pathway proposed to be involved in the above phenotype through glucose storing by the conversion of glucose to free fatty acid [6]. The de novo lipogenesis is indeed poorly induced by digestible carbohydrates, but when this pathway is activated by anti-diabetic drugs (metformin), it leads to a better postprandial glycaemic control [6,7,8].
While glucose metabolism is well-described for juvenile rainbow trout [4,8], only few studies have focused on this metabolic pathway in broodstock [9,10,11,12,13] and described it during gametogenesis in males and females. However, only one study addressed questions around the effect of feeding broodstock with a diet enriched in carbohydrates, and specifically on reproductive performance by demonstrating higher fecundity and survival rate of progeny of females fed with a diet containing white flour compared to females fed with a controlled diet [10]. More recently, Callet et al. reported that female and male broodstock are able to eat and use a high-carbohydrate diet (35%) during the whole reproductive cycle for females (9 months) and during the early part of the cycle for males (4 months), as reflected by the growth performance and the success of the reproduction process. Both sexes were never hyperglycaemic when fed with a high-carbohydrate diet, to the contrary of what is commonly observed in juveniles and resulting from a particular regulation of both the glucose and the lipid metabolism [14]. However, it is not clear whether the modulation of the glucose metabolism, which may explain their ability to eat and grow under a high-carbohydrate diet compared to juveniles, is related to their physiological stage (broodstock) or results from a long-term consequence/adaption of the intake of digestible carbohydrates (4 and 9 months respectively, for males and females). Moreover, Callet et al. evaluated the long-term consequences of a high-carbohydrate diet only in female and male broodstock. However, a third sex, called neomale, is commonly used in aquaculture to produce all-female mono-sex populations [15]. To our knowledge, no study has investigated the glucose and lipid metabolism of these particular individuals fed a high-carbohydrate diet.
In this context, the present study aimed to assess the short-term consequences on glucose and lipid metabolism in mature females and males, as well as in neomales, when fed a high-carbohydrate diet. To do so, we fed fish for two days (5 meals) with a 32% carbohydrate diet or a control diet containing no carbohydrates. At the end of this trial, we analysed plasma metabolites, mRNA levels and activities of glucose and lipid metabolism-related actors. All these parameters were studied in the liver, which has been demonstrated as a key organ for the regulation of intermediary metabolism.

2. Results

2.1. Zootechnical Parameters

Mean body weight was measured for fasted, NC and HC females, males and neomales (Figure 1a). Differences were not statistically significant between fasted females and NC and HC females as well as between NC females and HC females. Similar results were also found for males and neomales. Concerning the feed intake, females displayed no differences between females fed with the NC diet and females fed with the HC diet with around 20 g of feed per fish. No significant differences were found in males or in neomales eating 35–38 and 38 g per fish and day, respectively.

2.2. Results in Females

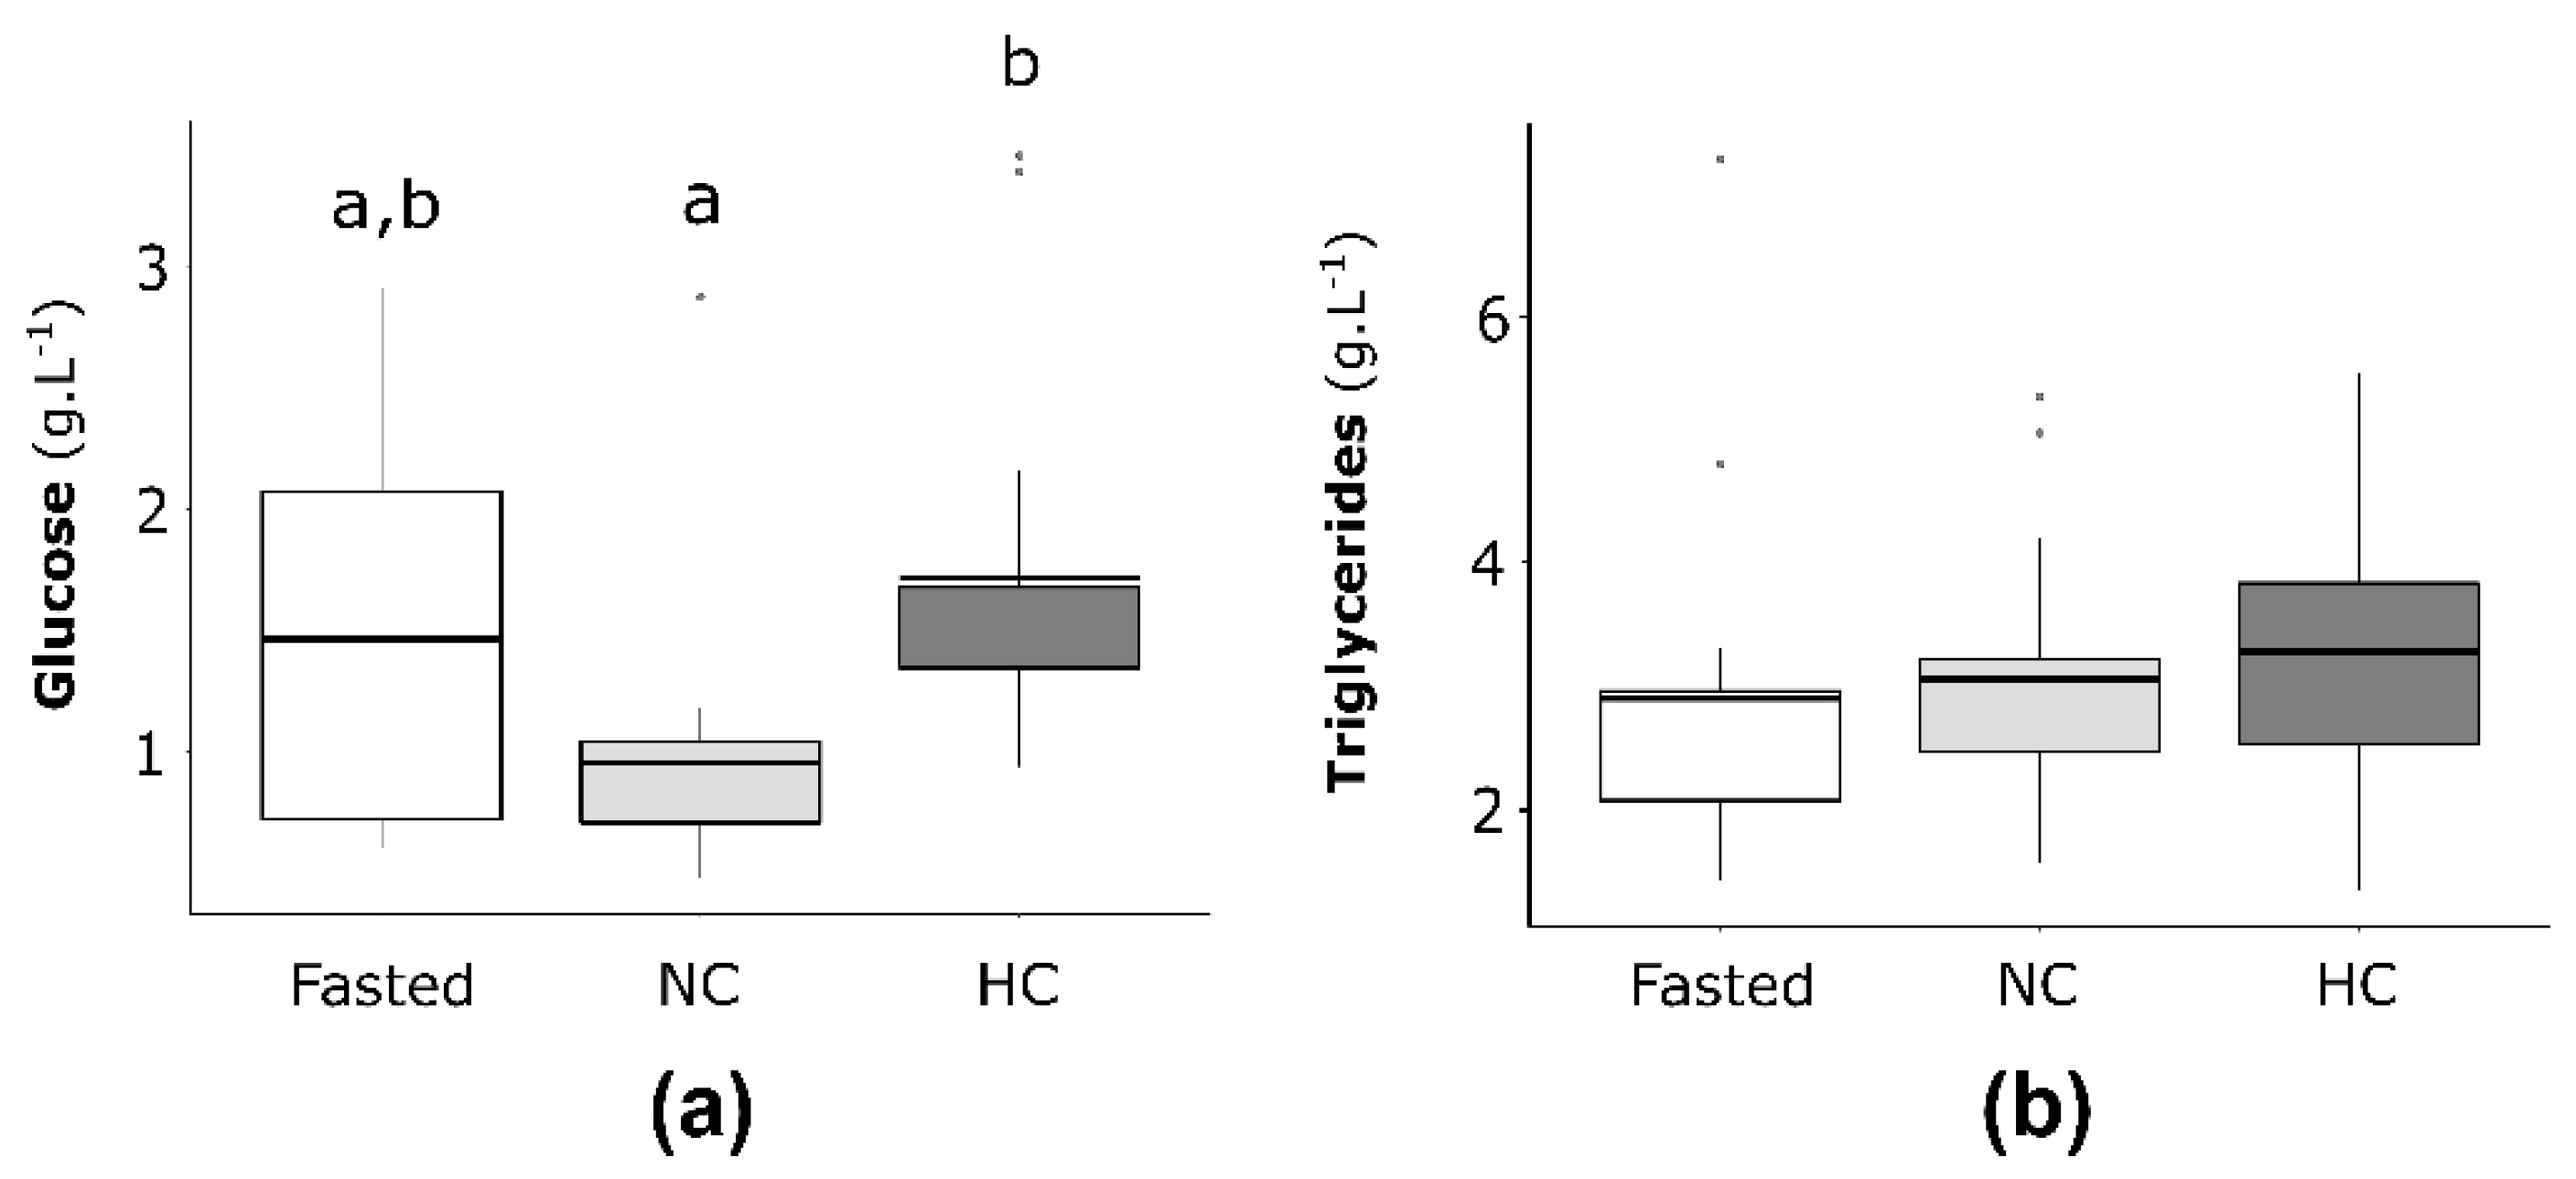
2.2.1. Plasma Glucose and Triglycerides Concentrations in Females

Plasma glucose and triglycerides concentrations were investigated for fasted females and females fed either the NC or the HC diet (Figure 2). The glucose plasma concentrations (Figure 2a) were not significantly different between females fasting 15 days and females fed with the NC or HC diet. Concerning the fed females, females with the NC diet had a significantly lower glycaemia compare to females fed the HC diet (p = 0.02). For triglycerides plasma concentrations (Figure 2b), no differences were statistically significant between fasted females and fed females as well as between NC and HC females.

2.2.2. Relative mRNA Levels of Glucose and Lipid Metabolism-Related Genes in the Liver of Females

The mRNA levels for glucose transporter, glycolysis, gluconeogenesis, de novo lipogenesis and β-oxidation-related genes were assessed in the liver of fasted females and in females fed with either the NC or HC diet (Table 1). For the genes glut2a and glut2b involved in the transport of glucose, mRNA levels in fasted and fed females as well as NC and HC females were not statistically different. For the genes involved in the glycolysis, no differences were statistically significant between fasted females and females fed with the NC or HC diet. For fed females, only gckb displayed differences among the conditions, with a higher mRNA level for HC females compared to NC ones. Concerning the gluconeogenesis, only genes coding for the enzyme involved in the last step of this pathway (glucose-6-phosphatase) displayed differences in mRNA levels between our experimental conditions. g6pca displayed higher mRNA levels in fasted females compared to HC females. g6pcb2a exhibited lower mRNA level in fasted females compared to females fed with the HC diet. Finally, g6pcb1a and g6pcb1b exhibited higher mRNA levels in fasted females than in females fed with the HC diet. For the de novo lipogenesis, srebf1, acly, aca-αa, aca-αb and fasn exhibited higher mRNA levels for females fed with the NC or HC diet compared to fasted females.

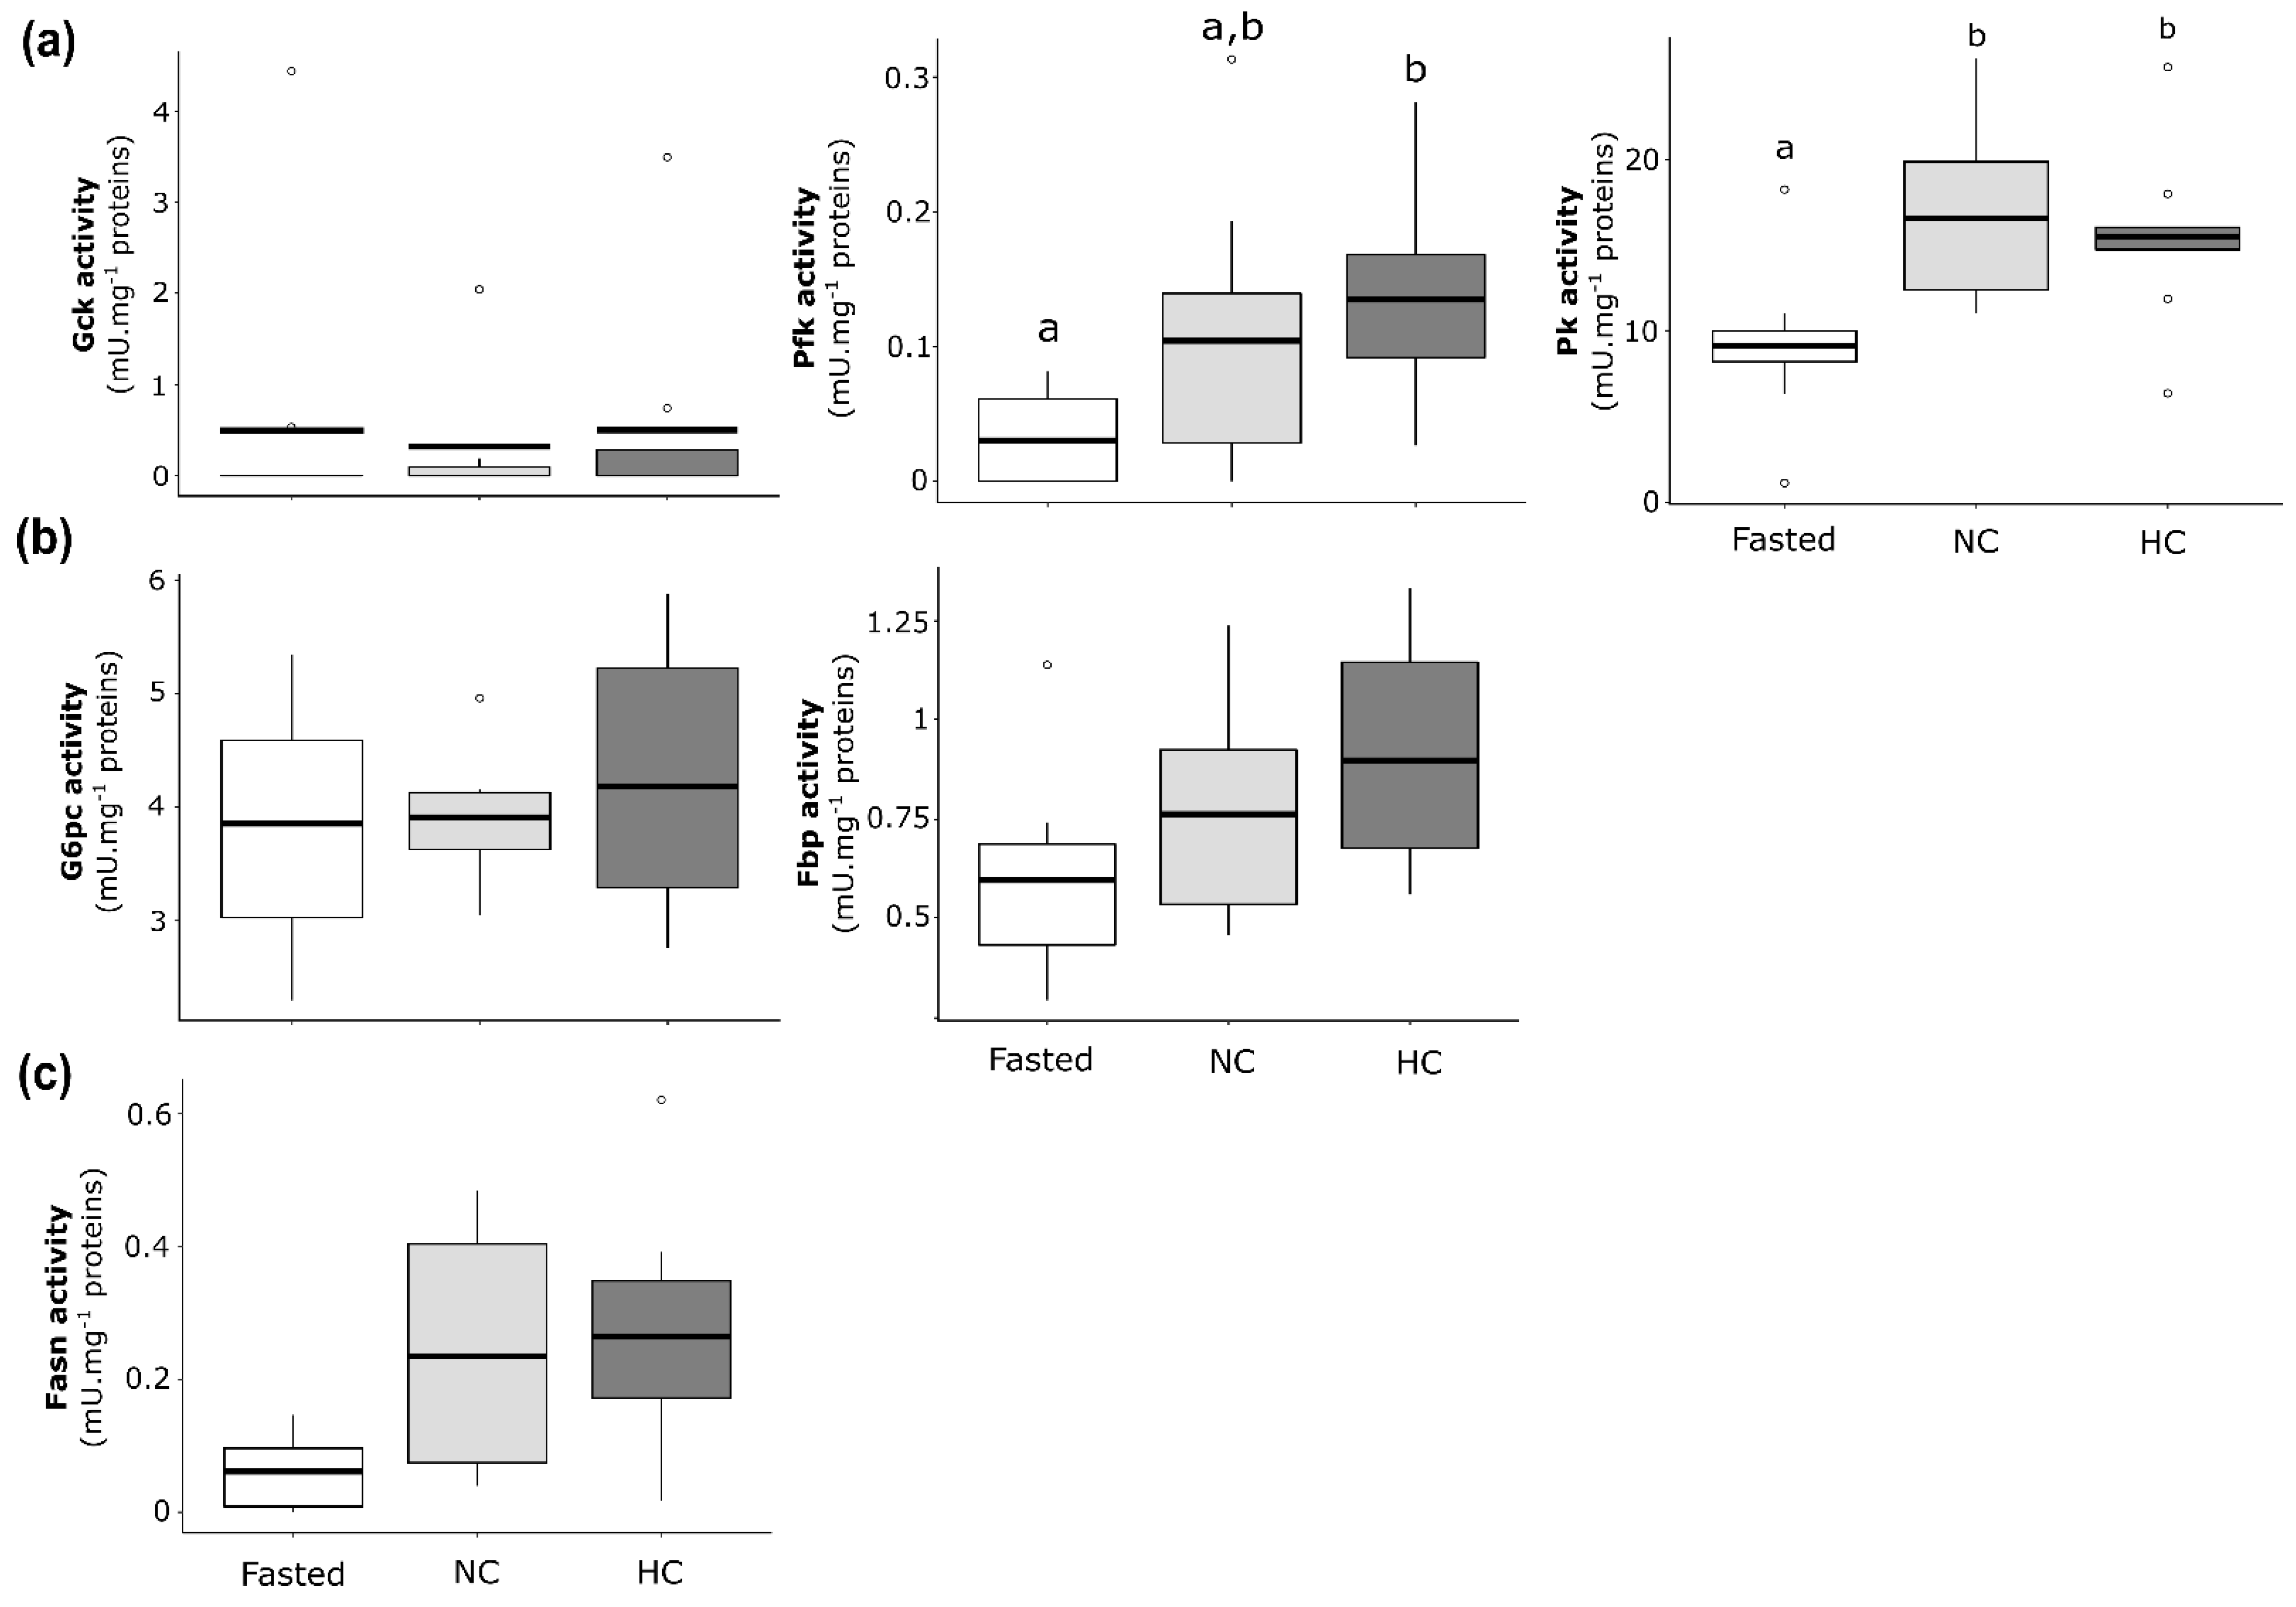
2.2.3. Enzymatic Activities of Glucose and Lipid Metabolisms in Liver of Females

Enzymatic activities were analysed and compared between females fasted for 15 days, females fed with the NC diet and females fed with the HC diet for 2 days. Concerning glycolysis enzymatic activities (Figure 3a), glucokinase (Gck) exhibited no significant differences between fasted females and females fed with the NC or HC diet. Phosphofructokinase (Pfk) exhibited a lower activity in liver of fasted females compared to females fed with the HC diet, and the difference was not statistically significant between NC and HC females. Concerning the pyruvate kinase (Pk), fasted females exhibited a lower enzymatic activity compared to females fed with the NC or the HC diet, but no statistically significant difference was highlighted between females fed the NC and the HC diet. Concerning the gluconeogenesis (Figure 3b), the glucose-6-phosphatase (G6pc) and the fructose-1,6-bisphosphatase (Fbp) displayed no significant statistical differences between fasted females and females fed with the NC or the HC diet, as well as between females fed with NC diet and females fed with the HC diet. Finally, concerning the de novo lipogenesis-related enzyme (Figure 3c), differences were not statistically significant between fasted females and females fed with the NC or the HC diet, as well as between NC-fed females and HC-fed females for the fatty acid synthase (Fasn).

2.3. Results in Males

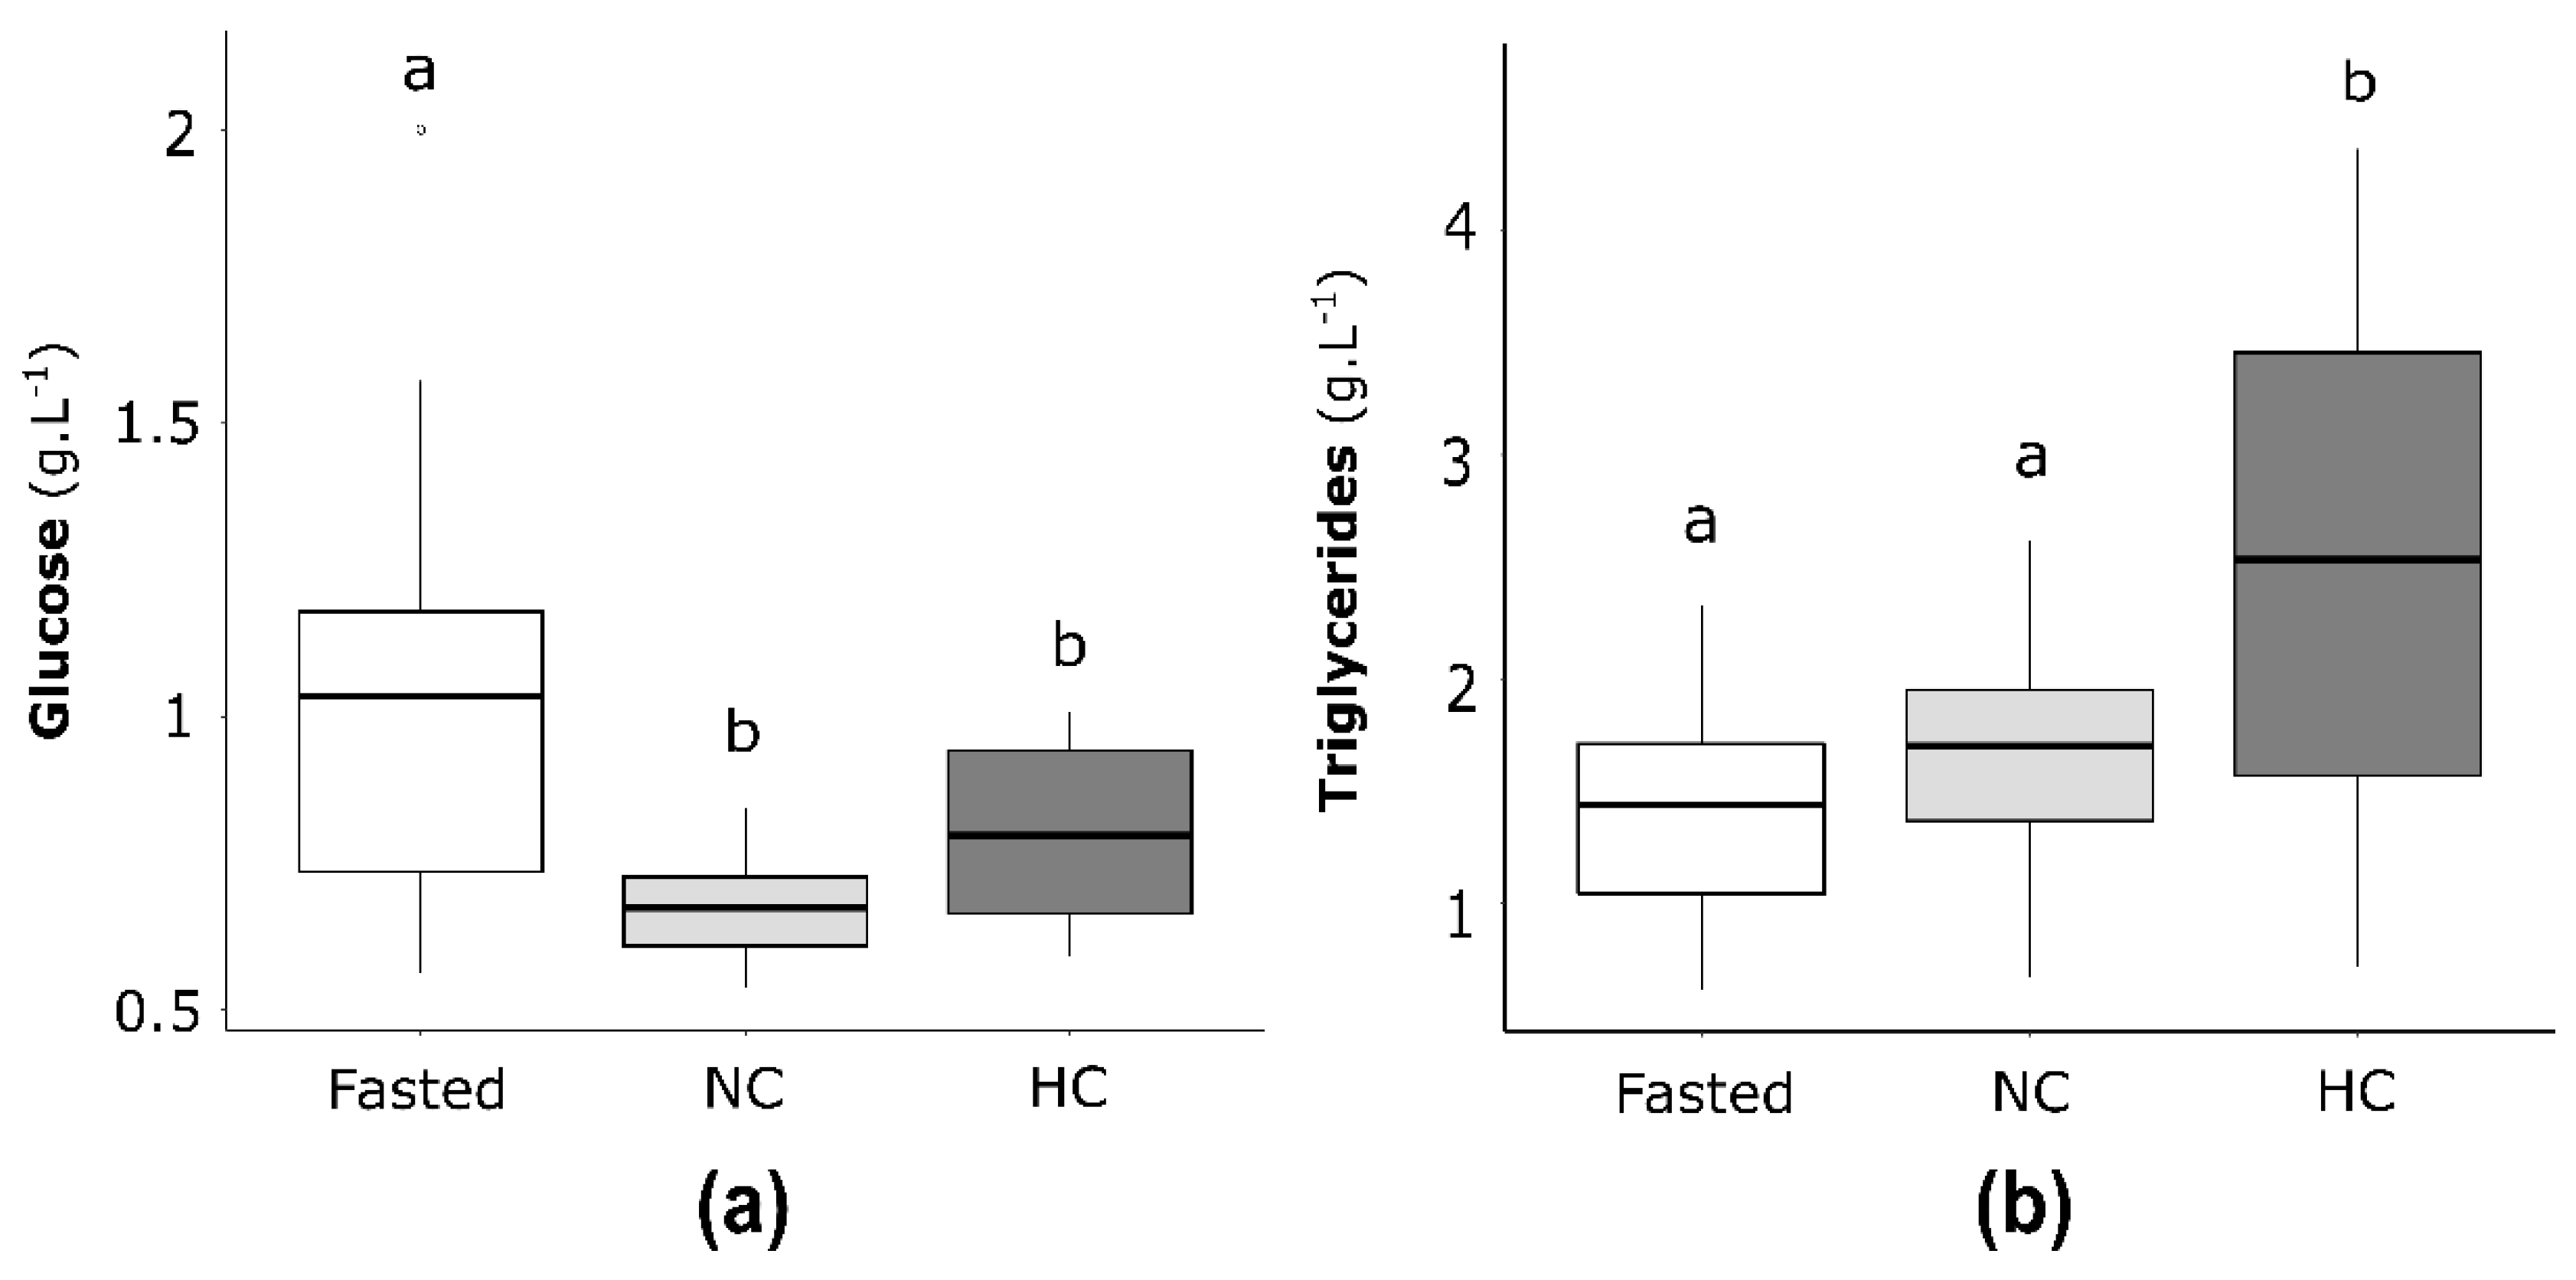
2.3.1. Plasma Glucose and Triglycerides Concentrations in Males

The plasma glucose and triglycerides concentrations were analysed and compared between males fasted for 15 days and males fed with either the NC or the HC diet (Figure 4a,b, respectively). Males exhibited higher glycaemia when fasted compared to males fed for two days with either the NC or the HC diet (Figure 4a), but no significant differences were observed between males fed with the NC diet and males fed with the HC diet. Concerning the plasma triglycerides concentration, fasted males and males fed with the NC diet displayed lower levels of plasma triglycerides than males fed with the HC diet.

2.3.2. Relative mRNA Levels of Glucose and Lipid Metabolism in Liver of Males

Relative mRNA levels of genes involved in the transport of glucose, glycolysis, gluconeogenesis, de novo lipogenesis and β-oxidation were analysed and compared between males fasted for 15 days and males fed with the NC or the HC diets (Table 2). For the transport of glucose, glut2a and glut2b displayed no significant differences between fasted males and males fed with NC or the HC diet, as well as between males fed with the NC diet and males fed with the HC diet. For the glycolysis, only the mRNA level of gcka significantly differed, with higher mRNA levels in fasted males compared to fed males. For the gluconeogenesis, only g6pcb1b and g6pcb2a displayed significant differences of mRNA levels between experimental conditions, whereas mRNA levels from other analysed genes remained stables. g6pcb1b displayed no significant differences between fasted and fed males. A higher mRNA level of g6pcb1b was observed in males fed with the NC diet compared to males fed with the HC diet. g6pcb2a mRNA levels were significantly lower in fasted males compared to fed males and the difference was not statistically significant between the NC and the HC diet. Finally, for pck1, males fed with the NC diet displayed higher mRNA levels compared to fasted males or males fed with the HC diet. Concerning the de novo lipogenesis, srebf1, aca-αa, aca-αb and fasn displayed lower mRNA levels in fasted males compared to fed males, but no significant difference was shown between males fed with the NC or the HC diet. Finally, the β-oxidation-related gene aca-βa displayed higher mRNA levels in fasted males compared to fed males, but no significant difference was highlighted between NC- and HC-fed males.

2.3.3. Enzymatic Activities of Glucose and Lipid Metabolism in Liver of Males

Enzymatic activities were analysed and compared between males fasted for 15 days, males fed with the NC diet and males fed with the HC diet for 2 days. For enzymatic activities related to the glycolysis (Figure 5a), Gck, Pfk and Pk displayed no differences between fasted and fed males, and differences were not statistically significant between males fed with the NC diet and males fed with the HC diet. Similar results were found for the activities of enzymes related to the gluconeogenesis (Figure 5b).

2.4. Results in Neomales

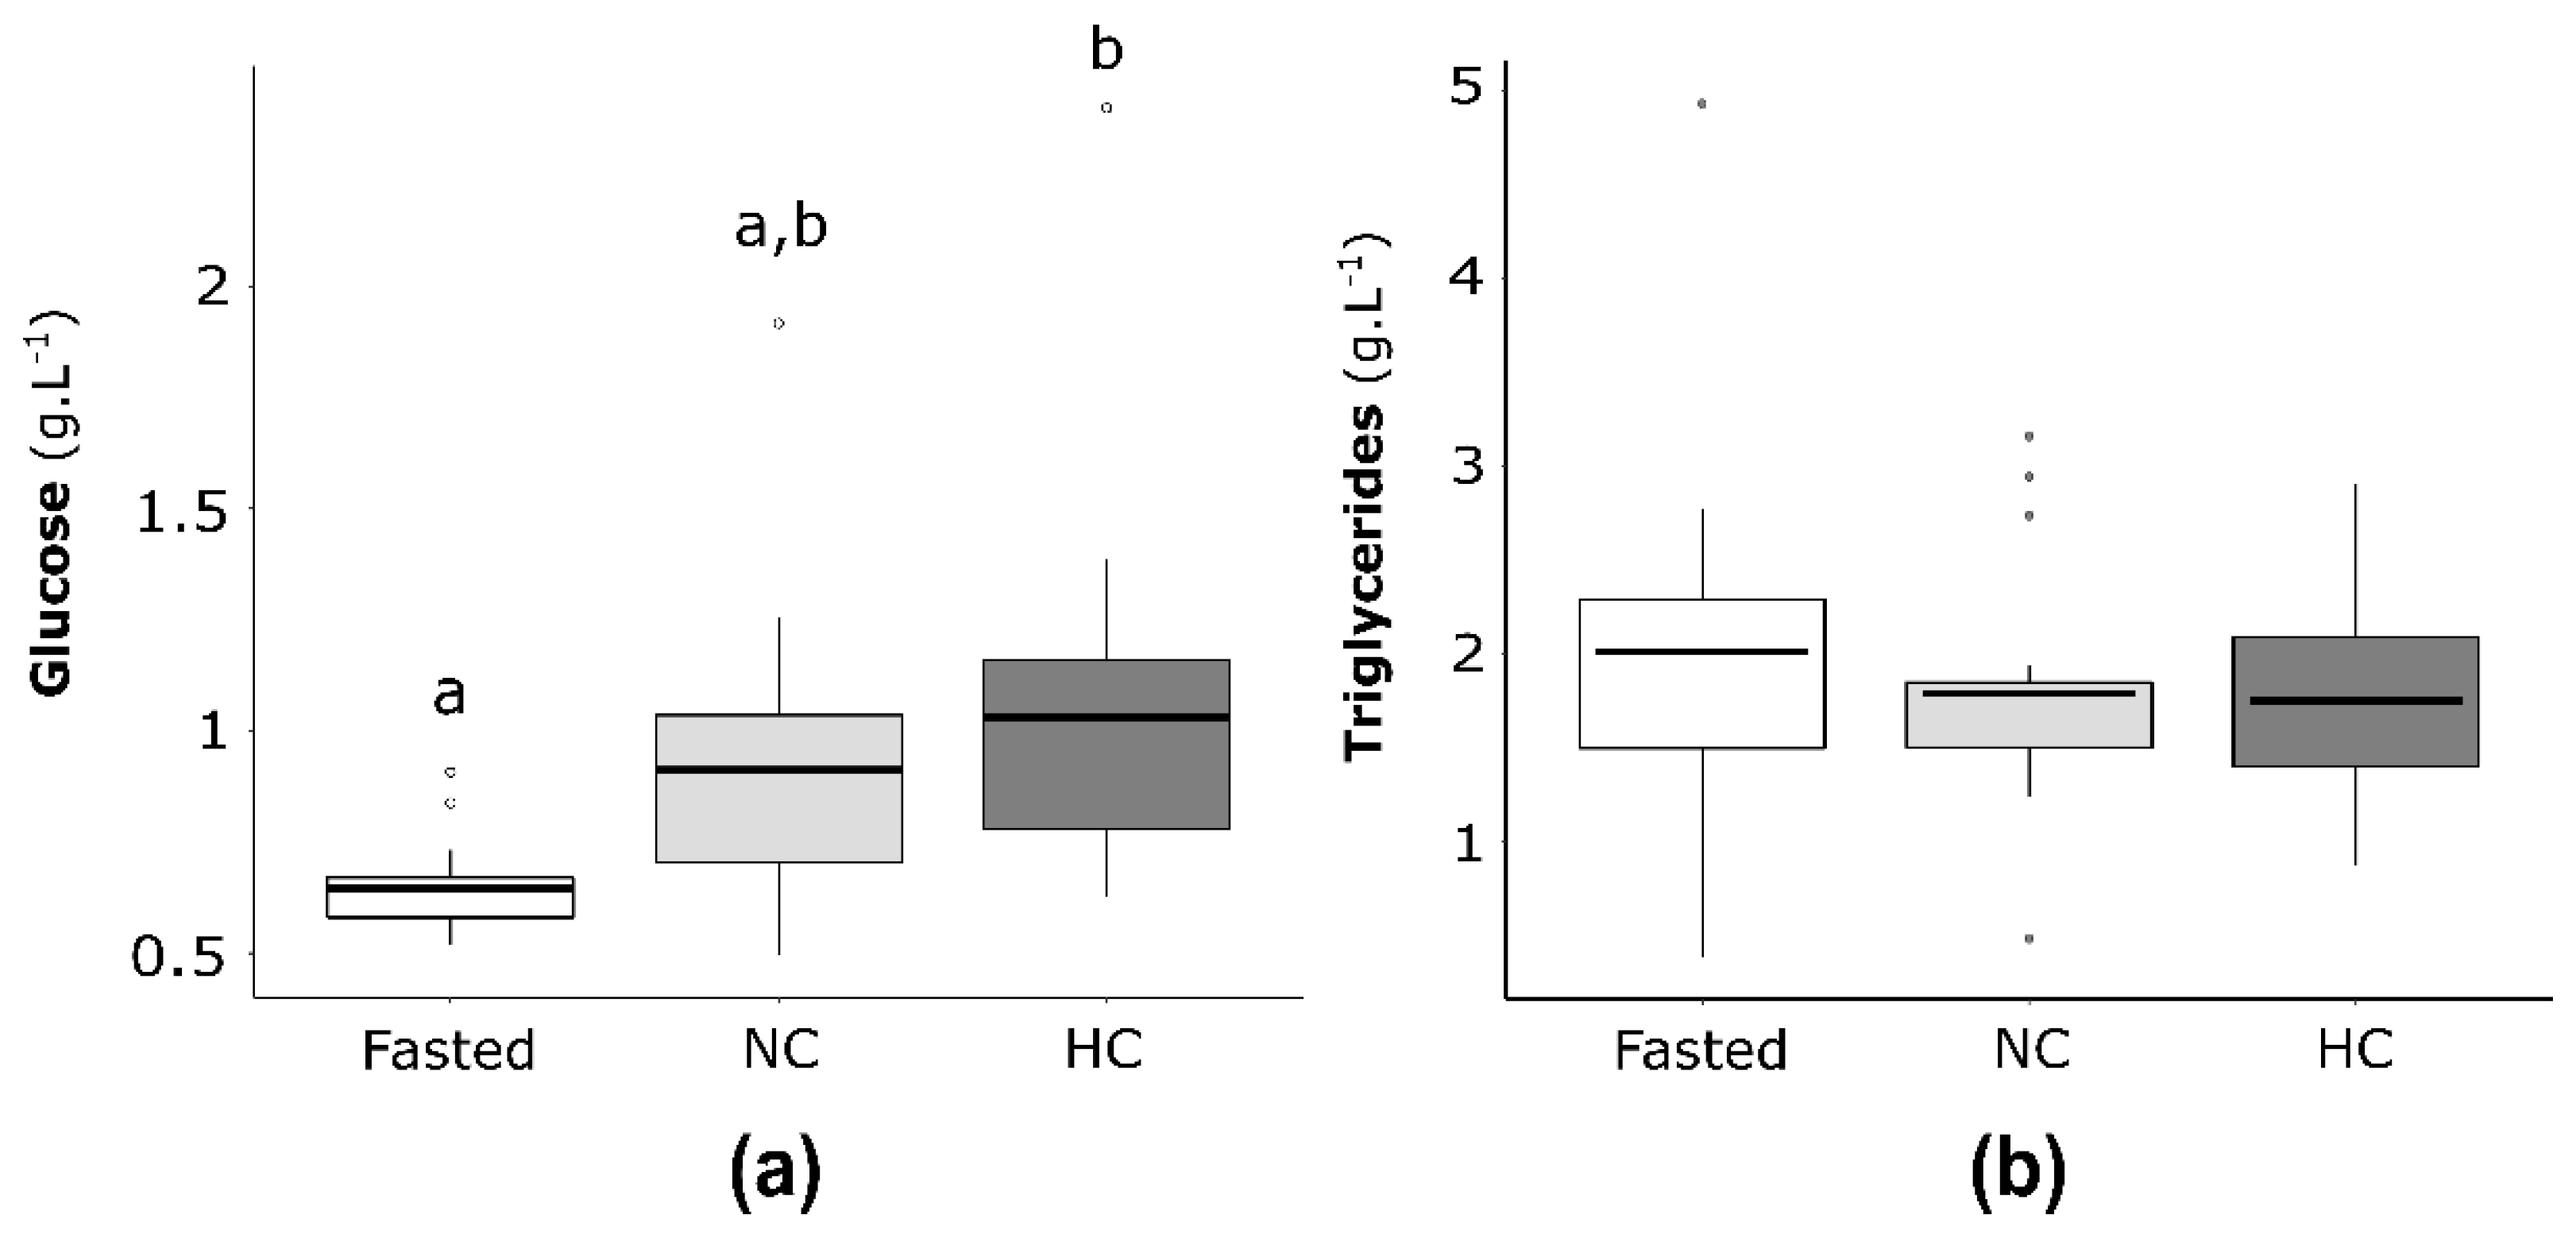
2.4.1. Plasma Glucose and Triglycerides Concentrations in Neomales

Plasma glucose (Figure 6a) and plasma triglycerides (Figure 6b) concentrations were analysed and compared in fasted neomales and neomales fed with either the NC diet or the HC diet. Concerning the glucose plasma concentration, fasted neomales displayed lower glycaemia compared to neomales fed with the HC diet, and differences were not statistically significant between neomales fed with the NC diet and neomales fed with the HC diet. Concerning the level of plasma triglycerides, no significant differences were demonstrated between fasted and fed neomales, as well as between neomales fed with the NC diet and neomales fed with the HC diet.

2.4.2. Relative mRNA Levels of Glucose and Lipid Metabolism in Liver of Neomales

The mRNA levels of key genes involved in the glucose transport, the glycolysis, the gluconeogenesis, the de novo lipogenesis and the β-oxidation were investigated and compared between neomales fasted for 15 days and neomales fed for two days with either the NC or the HC diet (Table 3). For the transport of glucose, either glut2a or glut2b displayed no significant differences between fasted or fed neomales. For the glycolysis, gckb displayed higher mRNA levels in neomales fed with the HC diet compared to fasted neomales and neomales fed with the NC diet. pfkla and pfklb displayed significantly lower mRNA levels in fasted neomales compared to neomales fed with the NC or the HC diet. Concerning the gluconeogenesis, g6pb1a displayed higher mRNA levels in fasted neomales compared to fed neomales, and differences were not statistically significant between neomales fed with the NC and neomales fed with the HC diet. g6pcb1b displayed lower mRNA levels in fasted neomales compared to neomales fed with the NC diet, and differences were not statistically significant between neomales fed with the NC diet and neomales fed with the HC diet. Fasted neomales displayed lower mRNA levels for g6pcb2a compared to fed fish and differences were not statistically significant between the two types of diet. Concerning the fructose-1,6-biphosphatase, fbp1b2 displayed higher mRNA levels in fasted neomales compared to neomales fed with the HC diet, and differences were not statistically significant between NC and HC fed neomales. Finally, with the phosphoenolpyruvate kinase, only pck1 displayed significant differences, with lower mRNA levels in fasted neomales compared to fed neomales. Concerning the de novo lipogenesis, investigated genes displayed significant differences among experimental conditions: srebf1, g6pd, acly, aca-αa, aca-αb and fasn, with lower mRNA levels in fasted neomales compared to fed neomales, and differences were not statistically significant between NC and HC neomales. aca-βa and aca-βb displayed higher mRNA levels in fasted neomales compared to neomales fed with the HC diet and neomales fed with the NC diet, respectively. For aca-βa and aca-βb, differences were not statistically significant between the NC and the HC diet.

2.4.3. Enzymatic Activities of Glucose and Lipid Metabolism in Liver of Neomales

Enzymatic activities were analysed and compared between neomales fasted for 15 days and neomales fed with the NC diet or fed with the HC diet for 2 days (Figure 7). For the glycolysis (Figure 7a), only Pk displayed different levels of activity between fasted neomales and neomales fed with the HC diet, and statistical differences were not significant between the two types of diet. For the gluconeogenesis (Figure 7b), statistical differences were not significant between fasted neomales and neomales fed with either the NC or HC diet for both G6pc and Fbp. Moreover, G6pc and Fbp displayed no statistical differences between fasted neomales and neomales fed with the NC or the HC diet, as well as between neomales fed with the NC diet and neomales fed with the HC diet. Finally, for the de novo lipogenesis (Figure 7c), Fasn displayed no statistical differences.

3. Discussion

Rainbow trout is a carnivorous fish metabolically adapted for high-protein catabolism and low-carbohydrate use, displaying persistent postprandial hyperglycaemia when fed a diet containing more than 20% of digestible carbohydrates [8]. It appears relevant to test, for the first time, the direct effects of feeding broodstocks with a high-carbohydrate diet. Indeed, broodstock are large animals consuming high amounts of feed. Mature females and males, and neomales, were fed with a non-carbohydrate diet or a high-carbohydrate diet for two days (5 meals), and glucose and lipid metabolism at the molecular level were investigated in the liver, the centre of intermediary metabolism regulation. First, we will discuss the molecular consequences of feeding broodstocks on their glucose metabolism to pursue on that of lipids with the de novo lipogenesis and the β-oxidation. Finally, we will conclude with the differences that we highlighted between all sexes studied.

3.1. Glucose Metabolism Is Regulated at the Molecular Level by the Nutritional Status, Irrespective of the Carbohydrate Intake

Feeding mature females and males, and neomales, has been effective regarding the regulation of glucose metabolism at the molecular level, and irrespective of the diet. Our results showed that feeding mature females and immature neomales for two days influenced the mRNA levels of glucose metabolism-related genes. Indeed, in females and neomales, we observed an overall upregulation of the glycolysis pathway. However, for fed females and neomales, we highlighted a poor regulation of the gluconeogenesis pathway by the nutritional status (except for g6pc genes) for all sexes investigated. Such regulation of the global glucose metabolism by the nutritional status mimics regulations previously reported in juvenile trout fasted and refed during a short period [5]. The maintenance of an active gluconeogenic pathway in fish fed a NC diet suggests a need for endogenous glucose production to sustain maintenance of normoglycaemia and provide glucose as fuel for physiological basal functions (such as brain or heart functioning) [16,17,18,19,20]. Furthermore, this is consistent with previous in vivo and in vitro studies showing that the gluconeogenesis flux is never turned off in fed carnivorous teleosts [21,22].
Except for the gluconeogenic g6pcb1b gene, which was downregulated in HC-fed trout, no significant differences were induced by the diet composition regarding the glucose metabolism. The absence of a drastic induction of glucokinase under the HC diet, which is a feature observed in rainbow trout fed such a diet [23], as well as the relatively low glycaemia observed, are in favour of a low assimilation of the dietary carbohydrates. This may be linked to a poor digestion of the carbohydrates contained in the HC diet due to the short time of feeding (2 days, 5 meals) and the low water temperature (8 °C) at which trout broodstock are usually reared [24]. However, we cannot exclude that the low glycaemia could also be linked to the low levels of lipids in the diets, amounts which sustain trout broodstocks’ needs. Indeed, low levels of lipids can be associated with a better glycaemia homeostasis in trout fed with carbohydrates [25]. All together, these data indicate that our experimental conditions, especially 5 meals, were not enough to trigger differences between the NC and HC diets.

3.2. At the Molecular Level, the De Novo Lipogenesis Is Upregulated and the β-Oxidation Is Downregulated by Feeding, Irrespective of the Carbohydrate Intake

The lipid metabolism is closely linked to the fate of glucose in cells by its conversion to triglycerides through the de novo lipogenesis (DNL). Moreover, DNL is hypothesised to be involved in the glucose-intolerant phenotype of the rainbow trout. Indeed, when this pathway is induced by anti-diabetic medication (metformin) in trout, it leads to a better postprandial glycaemic control [6]. In this study, we were able to demonstrate that DNL is upregulated by the nutritional status regardless of the sex and irrespective of the diet. Coupled with the upregulation of the DNL, we also observed, in males and neomales, the attenuation of the β-oxidation. This is in accordance with what is commonly observed, as the DNL and β-oxidation are known to be regulated by several factors, including the nutritional status [26,27]. As for the glucose metabolism, we did not demonstrate differences between the NC and the HC diets regarding the lipid metabolism. However, an increased hepatic lipogenic pathway has been demonstrated after 10 weeks of feeding in rainbow trout fed with a high-carbohydrate diet compared to trout fed with a non-carbohydrate diet [28]. As mentioned above, this latter result supports the hypothesis that the duration of the feeding trial was too short to allow a sufficient digestion of dietary carbohydrates able to induce metabolic changes.

3.3. The Two-Day Feeding of Mature Females and Males, and Neomales, Induced Different Regulation of the Glucose and Lipid Metabolism

In this study, we were able to demonstrate differences among sex regarding the glucose and lipid metabolism. First, we observed a lower feed intake in females compared to males and neomales. This can be explained by the fact that females eat less before and after the period of reproduction [29]. Indeed, reduction or complete cessation of feeding can be observed from a few days to several months during the reproduction in wild salmonids, and fasting is thus recommended for broodstock management (i.e., to avoid faeces or urine mixed with eggs) during reproduction [30,31]. This could explain the lower induction of DNL in fed females compared to males and neomales and the absence of attenuation of the β-oxidation.
One of the major differences between sex observed in this study is the absence of the induction of hepatic glycolysis in males fed with the HC diet. This could be linked to the fact that males were milted during the sampling events and that the glucose uptake may be preferentially used to sustain testes requirements [12].
Finally, we were able to highlight more differences in nutritional regulation of gene expression in neomales, irrespective of the metabolism investigated. Neomales are sex-reversed females used to produce an all-female population, and thus they are kept until maturation and sacrificed to collect gametes [32]. The more pronounced modifications of their metabolism in response to nutritional status or HC diet (more particularly, the huge increase in gcka mRNA levels) compared to mature females or males is probably linked to their physiological status and weight close to juveniles at the time point of the experiment, which imposes on them a lower response latency. However, they did not display hyperglycaemia nor induction of g6pcb2 genes when fed the HC diet as previously described in juveniles [5]. This could again be due to the hypothesised low assimilation of dietary carbohydrates in our experiment. However, regarding only the results obtained here, we cannot rule out that neomales may be able to better regulate their glucose metabolism than juveniles when fed a high-carbohydrate diet. Further studies are needed to perfectly describe the glucose and lipid metabolism of these particular broodstock, especially for longer periods of feeding during gametogenesis, as to our knowledge, no studies have focused on this point yet.

4. Materials and Methods

4.1. Fish Diet

Two experimental feeds for rainbow trout, i.e., NC (high-protein and low-carbohydrate diet) and HC (low-protein and high-carbohydrate diet), were prepared in our own facilities (INRAE, Donzacq, Landes, France) as extruded pellets. Gelatinised starch was included as the carbohydrate source, protein originated from fish meal and dietary lipids from fish oil and fish meal (Table 4). The two diets were isolipidic and isoenergetic. The amount of carbohydrate (~32%) was balanced by of the amount of protein. Chemical composition of diets was analysed through several steps: dry matter was determined after drying to constant mass at 105 °C, crude lipids were assessed by petroleum ether extraction (Soxtherm), crude proteins were assessed by the Kjeldahl method after acid digestion, gross energy was measured in an adiabatic bomb calorimeter (IKA, Heitersheim Gribeimer, Germany) and ash was estimated through incineration in a muffle furnace for 6 h at 600 °C.

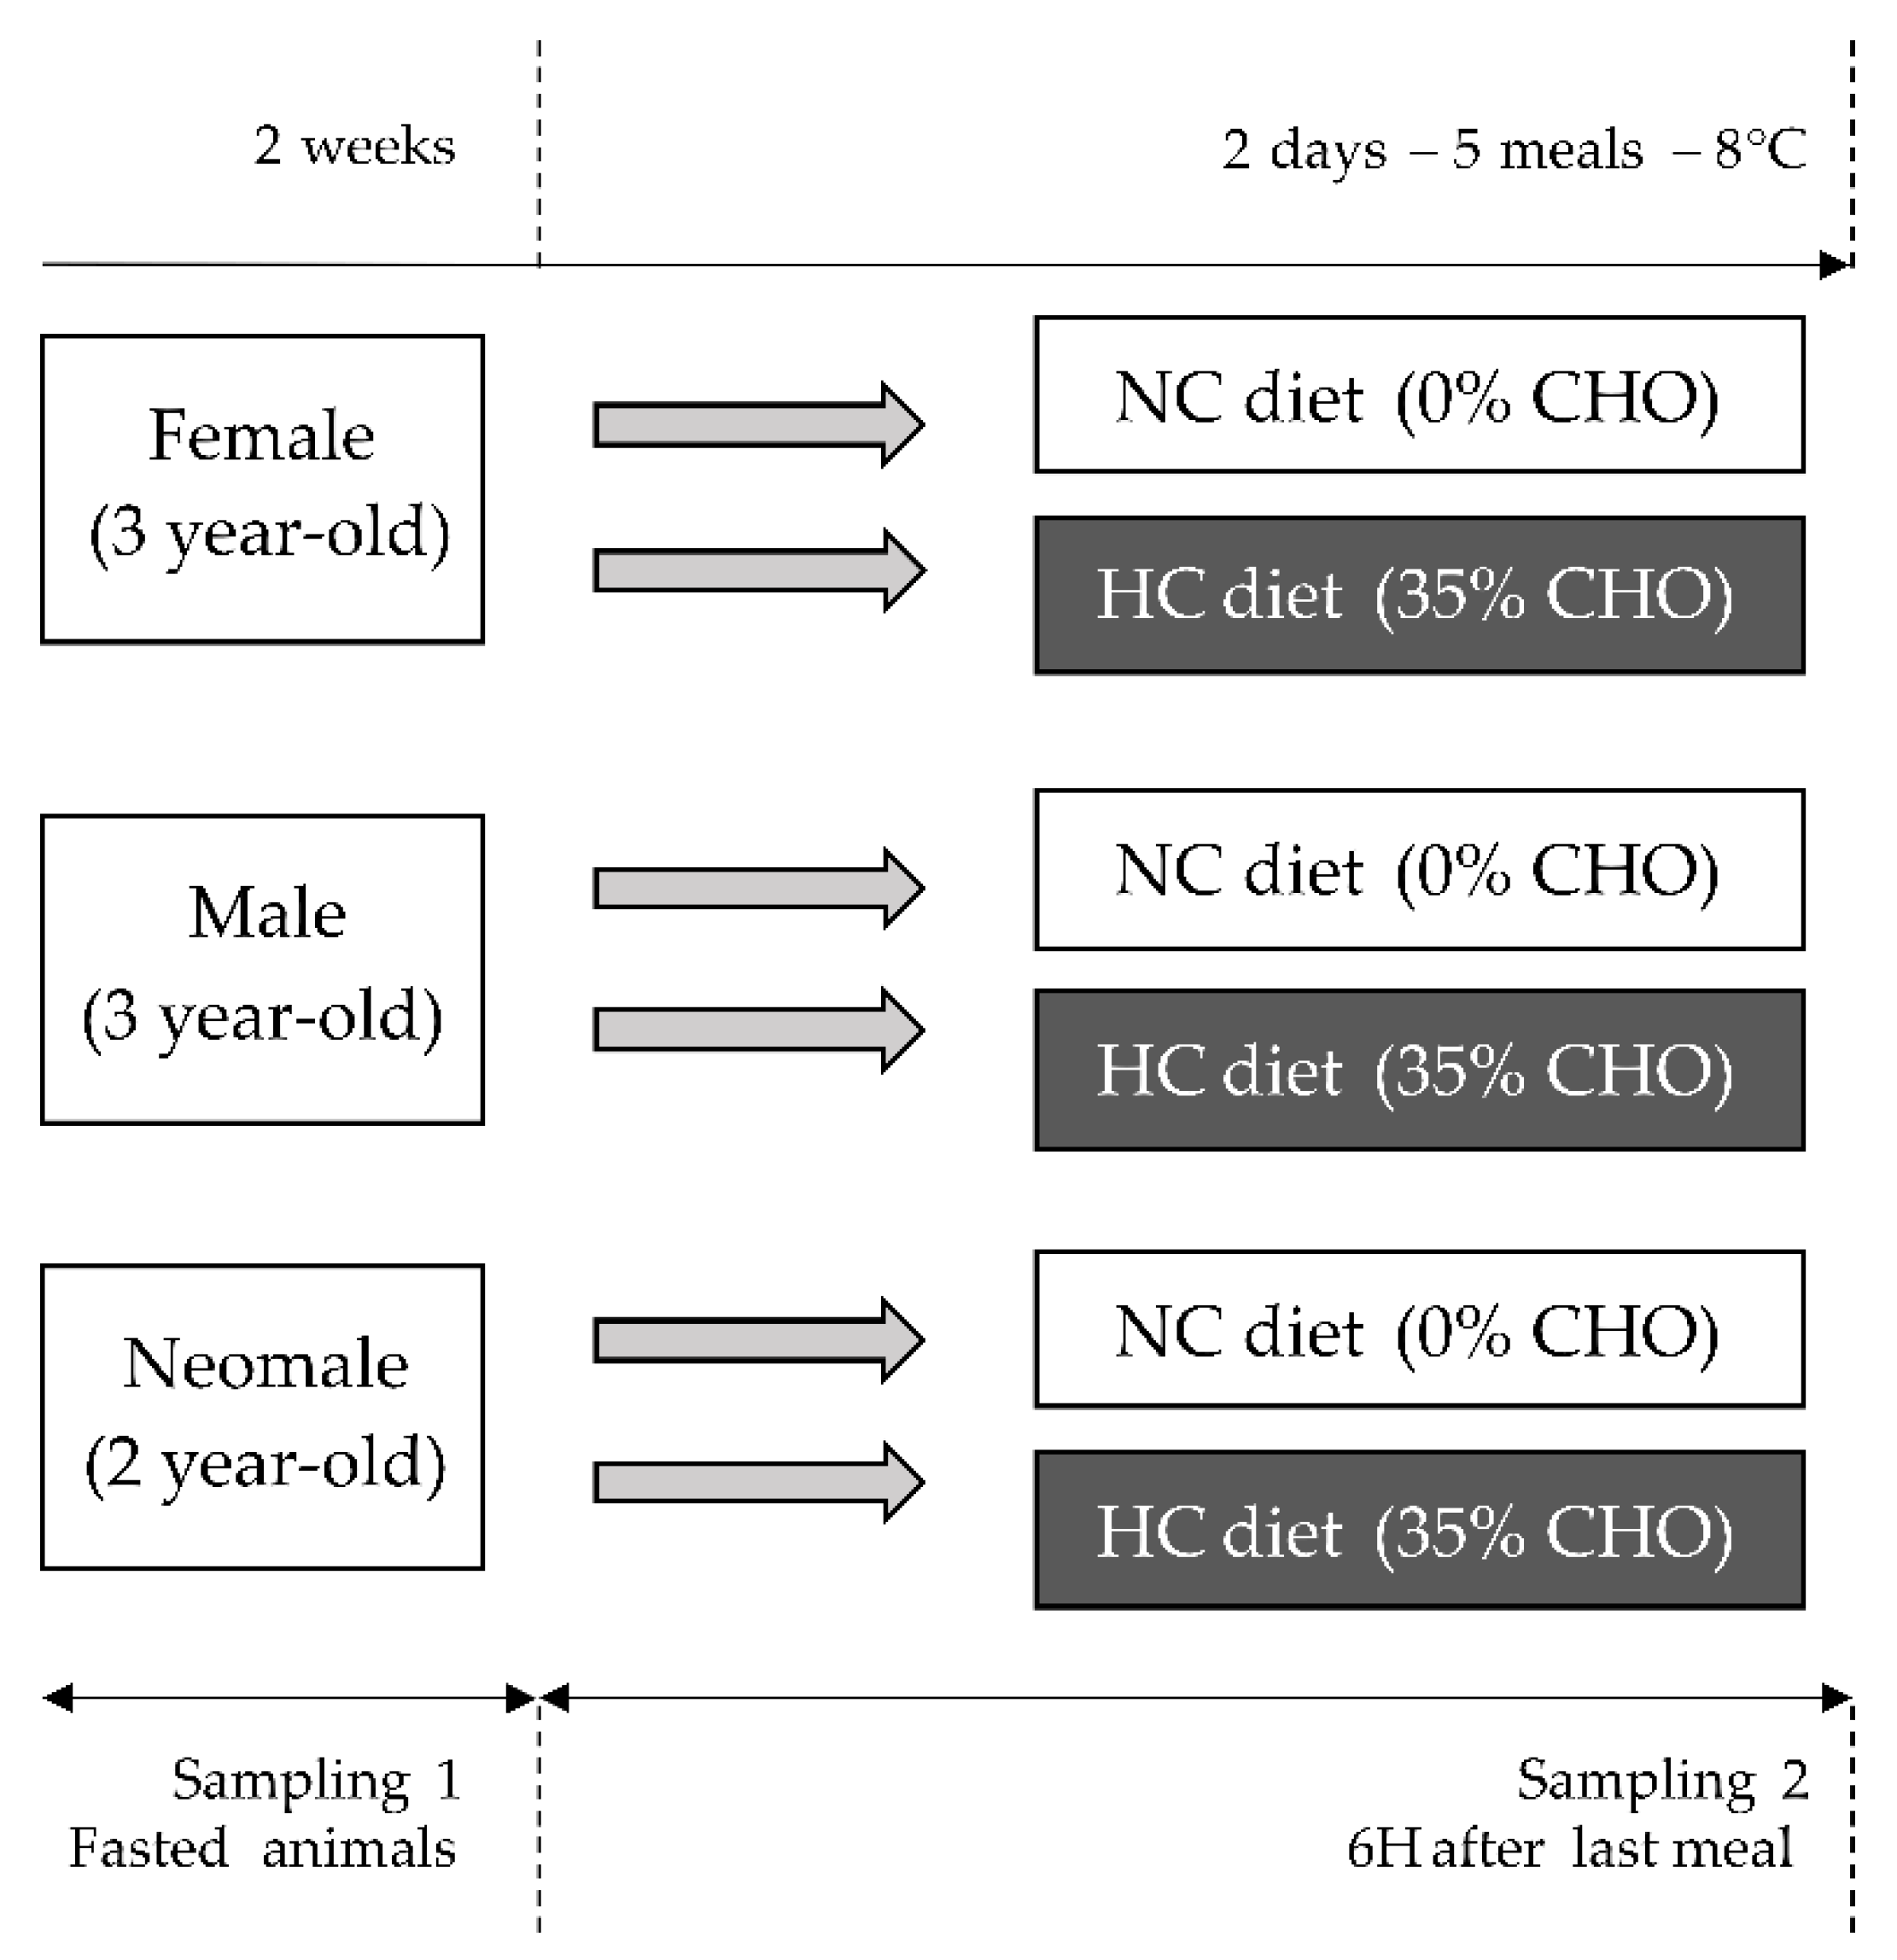
4.2. Fish Experimental Design

Rainbow trout used in this experiment were an autumnal strain that reproduce during winter in France (November–December). Three-year-old males and females and two-year-old neomales were fasted for 15 days from the stop of feeding of females occurring after the reproductive event at the INRAE Lées-Athas experimental fish farm at 8 °C (Figre 8). Fifteen fish per sex (Female, Male and Neomale) were therefore sampled after the 15 days of fasting (Figure 8, Sampling 1). Remaining fish were then distributed in 18 tanks (3 replicates of tank per condition) and fed either the NC diet or the HC diet (35%, HC) for two days (5 meals). Females were fed with 9 mm pellets, while both males and neomales were fed with 5 mm pellets due to their smaller size. Fifteen fish per sex and per diet (NC and HC) were sampled after two days of feeding, 6 h after the last meal (Figure 8, Sampling 2). During sampling events (Sampling 1 and Sampling 2), fish were first anaesthetised in a benzocaine bath at 30 mg·L−1 and then killed by an overdose of benzocaine (at 60 mg·L−1). Blood was collected from the caudal vein, centrifuged at 3000× g for 15 min and plasma was recovered and stored at −20 °C for future plasma metabolites’ analyses. Livers were dissected into three parts and snap-frozen in liquid nitrogen to perform analysis later.

4.3. Plasma Metabolites

Plasma glucose and triglycerides concentrations were analysed with Glucose RTU (BioMerieux, Marcy l’Étoile, France) and PAP 150 (BioMerieux) respectively, according to the recommendations of the manufacturers.

4.4. RNA Extraction and cDNA Synthesis

For RNA extractions, 9 fish per sex and condition were used. Liver samples were homogenised using Precellys®24 (Bertin Technologies, Montigny-le-Bretonneux, France) in Trizol reagent (Invitrogen, Carlsbad, CA, USA) with 2.8 mm ceramic beads for 2 × 20 s, separated by 15 s of break, at 5500 rpm. Luciferase control RNA (Promega), 10 pg per 1.9 mg of tissue, was added to each sample to allow for data normalisation. Total RNA was then extracted according to the instructions of the manufacturer of Trizol reagent. Total RNA obtained (2 µg) was then reverse transcribed to cDNA in duplicate using the SuperScript III RNase H-Reverse Transcriptase kit (Invitrogen) with random primers (Promega, Charbonnières-les-Bains, France).

4.5. Quantitative Real-Time PCR

Quantitative real-time PCR was used to measure mRNA levels of genes pertinent to (1) glucose transport, with glut2a and glut2b both coding for the glucose transporter 2, (2) glycolysis, with gcka and gckb coding for the glucokinase, pfkla and pfklb coding for the phosphofructokinase and pkl coding for the pyruvate kinase, (3) gluconeogenesis, with g6pca, g6pcb1a, g6pcb1b, g6pcb2a and g6pcb2b coding for the glucose-6-phosphatase, fbp1a, fbp1b1 and fbp1b2 coding for the fructose-1,6-biphosphatase and pck1, pck2a and pck2b coding for the phosphoenolpyruvate kinase and (4) de novo lipogenesis, with srebf1 coding for the sterol regulatory element-binding protein 1, acly coding for the ATP-citrate lyase, aca-αa, aca-αb, aca-βa and aca-βb coding for two isoforms of the acetyl-coenzyme A carboxylase, aca-α ohnologs coding for the isoform linked to the synthesis of fatty acid and aca-β ohnologs linked to the β-oxidation and fasn coding for the fatty acid synthase. The primer sequences used in real-time RT-PCR assays for gluconeogenic and glycolytic gene analyses were those previously described by Marandel et al. and Liu et al. Primers newly designed to study the lipogenic genes are listed in Table 5. Concerning g6pd, acly and fasn, primers were designed to coamplify different paralogs of the same gene. Lipogenic primers were validated using a pool of cDNA and sequencing of amplified products was performed systematically to verify the amplified sequence. Real-time RT-PCR were performed with the Roche Lightcycler 480 system (Roche Diagnostics, Neuilly-sur-Seine, France). The mix of the reaction was 6 μL per sample: 2 μL of diluted cDNA (1:76), 0.24 μL of each primer (100 mmol·L−1), 3 μL of Light Cycler 480 SYBR Green I Master mix and 0.52 μL of DNase/RNase-free water (5 Prime GmbH, Hamburg, Germany). The real-time RT-PCR protocol was initiated at 95 °C for 10 min for the denaturation of the cDNA and hot-start Tap-polymerase activation, followed by 45 cycles of a two-step amplification program (15 s at 95 °C; 10 s at 60 °C). Melting curves were verified systematically (temperature gradient 1.1 °C/15 s from 65 to 97 °C) at the end of the last amplification cycle to confirm the specificity of the amplification reaction. Each assay comprised replicate samples (duplicate of reverse transcription and PCR amplification, respectively) and negative controls (reverse transcriptase- and cDNA template-free samples, respectively). Data were then normalised to the exogenous luciferase transcript abundance in samples, as previously described [33].

4.6. Enzymatic Activities

The assessment of enzymatic activities was performed with frozen samples of liver. Samples were ground in an ice-cold buffer (50 mmol·L−1 TRIS, 5 mmol·L−1 EDTA, 2 mmol·L−1 DTT, protease inhibitor cocktail (Sigma, St. Louis, MO, USA)). For the fatty acid synthase (Fasn) and the glucose-6-phosphate dehydrogenase (G6pd), samples were centrifuged for 20 min at 24,000× g at 4 °C and supernatants were kept for the enzymatic assay. To measure pyruvate kinase (Pk) and phosphofructokinase (pfk) activities, samples were centrifuged again for 20 min at 20,000× g at 4 °C. For the glucose-6-phosphatase (G6pc), a sonic disruption (Bioruptor, 3 cycles, 30 s On/30 s Off), followed by a second centrifugation (10 min at 900× g at 4 °C) was applied, and supernatants were kept for the enzymatic assay. Enzyme activities were measured following the variation of the absorbance of nicotinamide adenine dinucleotide phosphate at 340 nm, in a Power Wave X (Biotek Instrument) reader. Reactions were started by the addition of specific substrates. Water was used as a blank for each sample. The enzymes assayed were: high km Hexokinase (Gck), as described in [23], glucose-6-phosphatase (G6pc) from [34], pyruvate kinase (Pk) following the protocol of [35], fructose-6-biphosphatase (Fbp) as described in [36], phosphofructokinase (Pfk) according to [37] and fatty acid synthase (Fasn) according to the protocol of [38].

4.7. Statistical Analysis

All statistical analyses were performed with the R Software (version 3.6.1). The results are presented as mean ± SD. Statistical analyses were carried out on the different parameters recorded to investigate potential differences among groups of fasted, NC and HC fish. When the normality of distributions was confirmed, one-way ANOVAs were performed on the different variables obtained. Kruskal–Wallis non-parametric tests were performed when the conditions of application of ANOVA were not respected. When significant differences were demonstrated, means were compared using a Tukey’s post hoc analysis. Statistical difference was considered significant when p-value was <0.05.

5. Conclusions

The present study investigated the glucose and lipid metabolism at the molecular level in mature female and male, and neomale, rainbow trout fed for two days with a NC diet or a HC diet. Except for the males, the results obtained for the glucose metabolism highlighted an activation of the hepatic glycolysis pathway by the nutritional status, irrespective of the diet. The upregulation of the de novo lipogenesis was also demonstrated in fed animals. These data point out that carbohydrate intake during a short period (5 meals) at low water temperature does not induce specific metabolic changes after two days of feeding in mature females and males, and neomales. Besides, we demonstrated, for the first time, sex differences regarding the consequences at the molecular level of two days of feeding, especially with neomales, displaying more pronounced regulation of the glucose metabolism than male and female broodstocks. To conclude, there is no negative effects of feeding mature female and male, and neomale, rainbow trout with a high-carbohydrate diet for a short period of time.

Author Contributions

Conceptualisation, S.P. and L.M.; Data curation, N.F.; Formal analysis, N.F., V.V. and M.M.; Funding acquisition, L.M.; Investigation, N.F. and A.S.; Methodology, L.M.; Project administration, L.M.; Resources, P.M. and N.T.; Supervision, S.P. and L.M.; Validation, N.F., S.P. and L.M.; Visualisation, N.F., S.P. and L.M.; Writing—original draft, N.F.; Writing—review and editing, N.F., S.P. and L.M. All authors have read and agreed to the published version of the manuscript.

Funding

N.F. received a doctoral fellowship from the E2S-UPPA. This research was funded by the French National Research Agency (grant number ANR-18-CE20-0012-01 “SweetSex”).

Institutional Review Board Statement

Experimentation was conducted according to the guiding principles for the use and care of laboratory animals and in compliance with French and European regulations on animal welfare (Décret 2001-464, 29 May 2001, and Directive 2010/63/EU, respectively).

Informed Consent Statement

Not applicable.

Data Availability Statement

Data are available by simple request from Lucie Marandel.

Acknowledgments

We thank T. Callet and J. Roy for their indispensable help with sampling. We thank K. Li for her help for enzymes’ extraction. We also thank F. Terrier for the preparation of the diets.

Conflicts of Interest

The authors declare no conflict of interest.

References

  1. Randazzo, B.; Zarantoniello, M.; Gioacchini, G.; Cardinaletti, G.; Belloni, A.; Giorgini, E.; Faccenda, F.; Cerri, R.; Tibaldi, E.; Olivotto, I. Physiological Response of Rainbow Trout (Oncorhynchus Mykiss) to Graded Levels of Hermetia Illucens or Poultry by-Product Meals as Single or Combined Substitute Ingredients to Dietary Plant Proteins. Aquaculture 2021, 538, 736550. [Google Scholar] [CrossRef]
  2. Panserat, S.; Médale, F.; Brèque, J.; Plagnes-Juan, E.; Kaushik, S. Lack of Significant Long-Term Effect of Dietary Carbohydrates on Hepatic Glucose-6-Phosphatase Expression in Rainbow Trout (Oncorhynchus Mykiss)11The Genbank Accession Number for the Rainbow Trout G6Pase Sequence Is AF120150. J. Nutr. Biochem. 2000, 11, 22–29. [Google Scholar] [CrossRef] [Green Version]
  3. Panserat, S.; Capilla, E.; Gutierrez, J.; Frappart, P.O.; Vachot, C.; Aguirre, P.; Breque, J.; Kaushik, S. Glucokinase Is Highly Induced and Glucose-6-Phosphatase Poorly Repressed in Liver of Rainbow Trout ž Oncorhynchus Mykiss/by a Single Meal with Glucose. Comp. Biochem. Physiol. Part B Biochem. Mol. Biol. 2001, 128, 275–283. [Google Scholar] [CrossRef]
  4. Polakof, S.; Panserat, S.; Soengas, J.L.; Moon, T.W. Glucose Metabolism in Fish: A Review. J. Comp. Physiol. B 2012, 182, 1015–1045. [Google Scholar] [CrossRef]
  5. Marandel, L.; Seiliez, I.; Véron, V.; Skiba-Cassy, S.; Panserat, S. New Insights into the Nutritional Regulation of Gluconeogenesis in Carnivorous Rainbow Trout (Oncorhynchus Mykiss): A Gene Duplication Trail. Physiol. Genom. 2015, 47, 253–263. [Google Scholar] [CrossRef] [PubMed] [Green Version]
  6. Panserat, S.; Skiba-Cassy, S.; Seiliez, I.; Lansard, M.; Plagnes-Juan, E.; Vachot, C.; Aguirre, P.; Larroquet, L.; Chavernac, G.; Medale, F.; et al. Metformin Improves Postprandial Glucose Homeostasis in Rainbow Trout Fed Dietary Carbohydrates: A Link with the Induction of Hepatic Lipogenic Capacities? Am. J. Physiol. Regul. Integr. Comp. Physiol. 2009, 297, R707–R715. [Google Scholar] [CrossRef] [PubMed] [Green Version]
  7. Polakof, S.; Médale, F.; Larroquet, L.; Vachot, C.; Corraze, G.; Panserat, S. Regulation of de Novo Hepatic Lipogenesis by Insulin Infusion in Rainbow Trout Fed a High-Carbohydrate Diet1. J. Anim. Sci. 2011, 89, 3079–3088. [Google Scholar] [CrossRef] [PubMed] [Green Version]
  8. Kamalam, B.S.; Medale, F.; Panserat, S. Utilisation of Dietary Carbohydrates in Farmed Fishes: New Insights on Influencing Factors, Biological Limitations and Future Strategies. Aquaculture 2017, 467, 3–27. [Google Scholar] [CrossRef]
  9. Luquet, P.; Watanabe, T. Interaction “Nutrition-Reproduction” in Fish. Fish. Physiol. Biochem. 1986, 2, 121–129. [Google Scholar] [CrossRef]
  10. Washburn, B.S.; Frye, D.J.; Hung, S.S.O.; Doroshov, S.I.; Conte, F.S. Dietary Effects on Tissue Composition, Oogenesis and the Reproductive Performance of Female Rainbow Trout (Oncorhynchus Mykiss). Aquaculture 1990, 90, 179–195. [Google Scholar] [CrossRef]
  11. Barciela, P.; Soengas, J.L.; Rey, P.; Aldegunde, M.; Rozas, G. Carbohydrate Metabolism in Several Tissues of Rainbow Trout, Oncorhynchus Mykiss, Is Modified during Ovarian Recrudescence. Comp. Biochem. Physiol. Part B Comp. Biochem. 1993, 106, 943–948. [Google Scholar] [CrossRef]
  12. Soengas, J.L.; Sanmartin, B.; Barciela, P.; Aldegunde, M.; Rozas, G. Changes in Carbohydrate Metabolism Related to the Onset of Ovarian Recrudescence in Dmesticated Rainbow Trout (Oncorhynchus Mykiss). Comp. Biochem. Physiol. Part A Physiol. 1993, 105, 293–301. [Google Scholar] [CrossRef]
  13. Soengas, J.L.; Sanmartín, B.; Barciela, P.; Aldegunde, M.; Rozas, G. Changes in Carbohydrate Metabolism in Domesticated Rainbow Trout (Oncorhynchus Mykiss) Related to Spermatogenesis. Comp. Biochem. Physiol. Part B Comp. Biochem. 1993, 105, 665–671. [Google Scholar] [CrossRef]
  14. Callet, T.; Hu, H.; Larroquet, L.; Surget, A.; Liu, J.; Plagnes-Juan, E.; Maunas, P.; Turonnet, N.; Mennigen, J.A.; Bobe, J.; et al. Exploring the Impact of a Low-Protein High-Carbohydrate Diet in Mature Broodstock of a Glucose-Intolerant Teleost, the Rainbow Trout. Front. Physiol. 2020, 11, 303. [Google Scholar] [CrossRef] [PubMed]
  15. Kowalski, R.K.; Sarosiek, B.; Demianowicz, W.; Judek, J.; Goryczko, K.; Dobosz, S.; Kuźmiński, H.; Demska-Zakęś, K.; Babiak, I.; Glogowski, J. Quantitative Characteristics of Rainbow Trout, Oncorhynchus Mykiss, Neo-Males (XX Genotype) and Super-Males (YY Genotype) Sperm. World Acad. Sci. Eng. Technol. 2011. [Google Scholar] [CrossRef]
  16. Walton, M.J.; Cowey, C.B. Gluconeogenesis by Isolated Hepatocytes from Rainbow Trout Salmo Gairdneri. Comp. Biochem. Physiol. Part B Comp. Biochem. 1979, 62, 75–79. [Google Scholar] [CrossRef]
  17. Cowey, C.B.; Cooke, D.J.; Matty, A.J.; Adron, J.W. Effects of Quantity and Quality of Dietary Protein on Certain Enzyme Activities in Rainbow Trout. J. Nutr. 1981, 111, 336–345. [Google Scholar] [CrossRef] [Green Version]
  18. French, C.J.; Mommsen, T.P.; Hochachka, P.W. Amino Acid Utilisation in Isolated Hepatocytes from Rainbow Trout. Eur. J. Biochem. 1981, 113, 311–317. [Google Scholar] [CrossRef]
  19. Groen, A.K.; Vervoorn, R.C.; Tager, J.M. Control of Gluconeogenesis in Rat Liver Cells. Biochem. Soc. Trans. 1983, 11, 88. [Google Scholar] [CrossRef]
  20. Washizu, T.; Tanaka, A.; Sako, T.; Washizu, M.; Arai, T. Comparison of the Activities of Enzymes Related to Glycolysis and Gluconeogenesis in the Liver of Dogs and Cats. Res. Vet. Sci. 1999, 67, 205–206. [Google Scholar] [CrossRef] [PubMed]
  21. Pereira, C.; Vijayan, M.M.; Moon, T.W. In Vitro Hepatocyte Metabolism of Alanine and Glucose and the Response to Insulin in Fed and Fasted Rainbow Trout. J. Exp. Zool. 1995, 271, 425–431. [Google Scholar] [CrossRef]
  22. Viegas, I.; Rito, J.; González, J.D.; Jarak, I.; Carvalho, R.A.; Metón, I.; Pardal, M.A.; Baanante, I.V.; Jones, J.G. Effects of Food-Deprivation and Refeeding on the Regulation and Sources of Blood Glucose Appearance in European Seabass (Dicentrarchus Labrax L.). Comp. Biochem. Physiol. Part A Mol. Integr. Physiol. 2013, 166, 399–405. [Google Scholar] [CrossRef] [PubMed] [Green Version]
  23. Panserat, S.; Médale, F.; Blin, C.; Brèque, J.; Vachot, C.; Plagnes-Juan, E.; Gomes, E.; Krishnamoorthy, R.; Kaushik, S. Hepatic Glucokinase Is Induced by Dietary Carbohydrates in Rainbow Trout, Gilthead Seabream, and Common Carp. Am. J. Physiol. Regul. Integr. Comp. Physiol. 2000, 278, R1164–R1170. [Google Scholar] [CrossRef] [PubMed] [Green Version]
  24. Yamamoto, T.; Shima, T.; Furuita, H.; Sugita, T.; Suzuki, N. Effects of Feeding Time, Water Temperature, Feeding Frequency and Dietary Composition on Apparent Nutrient Digestibility in Rainbow Trout Oncorhynchus Mykiss and Common Carp Cyprinus Carpio. Fish Sci. 2007, 73, 161–170. [Google Scholar] [CrossRef]
  25. Figueiredo-Silva, A.C.; Panserat, S.; Kaushik, S.; Geurden, I.; Polakof, S. High Levels of Dietary Fat Impair Glucose Homeostasis in Rainbow Trout. J. Exp. Biol. 2012, 215, 169–178. [Google Scholar] [CrossRef] [Green Version]
  26. Lin, H.; Romsos, D.R.; Tack, P.I.; Leveille, G.A. Effects of Fasting and Feeding Various Diets on Hepatic Lipogenic Enzyme Activities in Coho Salmon (Oncorhynchus Kisutch (Walbaum)). J. Nutr. 1977, 107, 1477–1483. [Google Scholar] [CrossRef]
  27. Tucci, S.; Alatibi, K.I.; Wehbe, Z. Altered Metabolic Flexibility in Inherited Metabolic Diseases of Mitochondrial Fatty Acid Metabolism. Int. J. Mol. Sci. 2021, 22, 3799. [Google Scholar] [CrossRef]
  28. Kamalam, B.S.; Medale, F.; Kaushik, S.; Polakof, S.; Skiba-Cassy, S.; Panserat, S. Regulation of Metabolism by Dietary Carbohydrates in Two Lines of Rainbow Trout Divergently Selected for Muscle Fat Content. J. Exp. Biol. 2012, 215, 2567–2578. [Google Scholar] [CrossRef] [PubMed] [Green Version]
  29. Mechanisms of Migration in Fishes; McCleave, J.D. (Ed.) IV Marine Sciences; Springer US: Berlin/Heidelberg, Germany, 1984; ISBN 978-1-4612-9708-6. [Google Scholar]
  30. Banks, J.W. A Review of the Literature on the Upstream Migration of Adult Salmonids. J. Fish. Biol. 1969, 1, 85–136. [Google Scholar] [CrossRef]
  31. Ridelman, J.M.; Hardy, R.W.; Brannon, E.L. The Effect of Short-Term Starvation on Ovarian Development and Egg Viability in Rainbow Trout (Salmo Gairdneri). Aquaculture 1984, 37, 133–140. [Google Scholar] [CrossRef]
  32. Nynca, J.; Kuźmiński, H.; Dietrich, G.J.; Hliwa, P.; Dobosz, S.; Liszewska, E.; Karol, H.; Ciereszko, A. Biochemical and Physiological Characteristics of Semen of Sex-Reversed Female Rainbow Trout (Oncorhynchus Mykiss, Walbaum). Theriogenology 2012, 77, 174–183. [Google Scholar] [CrossRef] [PubMed]
  33. Marandel, L.; Labbe, C.; Bobe, J.; Le Bail, P.-Y. Evolutionary History of c-Myc in Teleosts and Characterization of the Duplicated c-Myca Genes in Goldfish Embryos: TELEOST c-Myc HISTORY AND EMBRYONIC EXPRESSION. Mol. Reprod. Dev. 2012, 79, 85–96. [Google Scholar] [CrossRef] [PubMed]
  34. Alegre, M.; Ciudad, C.J.; Fillat, C.; Guinovart, J.J. Determination of Glucose-6-Phosphatase Activity Using the Glucose Dehydrogenase-Coupled Reaction. Anal. Biochem. 1988, 173, 185–189. [Google Scholar] [CrossRef]
  35. Kirchner, S.; Kaushik, S.; Panserat, S. Low Protein Intake Is Associated with Reduced Hepatic Gluconeogenic Enzyme Expression in Rainbow Trout (Oncorhynchus Mykiss). J. Nutr. 2003, 133, 2561–2564. [Google Scholar] [CrossRef] [PubMed]
  36. Tranulis, M.A.; Christophersen, B. A Glucokinase-Like Enzyme in the Liver of Atlantic Salmon (Salmo Salar). Comp. Biochem. Physiol. Part B Biochem. Mol. Biol. 1996, 114, 35–39. [Google Scholar] [CrossRef]
  37. Metón, I.; Caseras, A.; Fernández, F.; Baanante, I.V. Molecular Cloning of Hepatic Glucose-6-Phosphatase Catalytic Subunit from Gilthead Sea Bream (Sparus Aurata): Response of Its MRNA Levels and Glucokinase Expression to Refeeding and Diet Composition. Comp. Biochem. Physiol. Part B: Biochem. Mol. Biol. 2004, 138, 145–153. [Google Scholar] [CrossRef] [PubMed]
  38. Chakrabarty, K.; Leveille, G.A. Acetyl CoA Carboxylase and Fatty Acid Synthetase Activities in Liver and Adipose Tissue of Meal-Fed Rats. Proc. Soc. Exp. Biol. Med. 1969, 131, 1051–1054. [Google Scholar] [CrossRef] [PubMed]
Figure 1. (a) Mean body weight and (b) feed intake of mature females and males and neomales fasted (white), fed with NC diet (non-carbohydrate diet, light grey) or fed with HC diet (high-carbohydrate diet, dark grey). Data (n = 15 fish per sex and condition) were analysed with either one-way ANOVA when the conditions of application were respected or the Kruskal-Wallis test, followed by a post hoc Tukey’s test in case of significant differences (p < 0.05, indicated by different letters).
Ijms 22 06149 g001
Figure 2. (a) Plasma glucose and (b) triglycerides concentrations of mature female rainbow trout fasted 15 days (Fasted, white), fed with NC diet (non-carbohydrate diet, grey) and fed with HC diet (high-carbohydrate diet, dark grey). Data (n = 15 fish per condition) were analysed with either one-way ANOVA when the conditions of application were respected or the Kruskal-Wallis test, followed by a post hoc Tukey’s test in case of significant differences (p < 0.05, indicated with different letters).
Ijms 22 06149 g002
Figure 3. Enzymatic activities of glucose and lipid metabolism actors in the liver of mature female rainbow trout fasted (Fasted, white), fed with a non-carbohydrate diet (NC, grey) or fed with a high-carbohydrate diet (HC, dark grey). Enzymatic activities are expressed as mU·mg−1 of proteins for (a) glycolysis with the glucokinase (Gck), the phosphofructokinase (Pfk) and the pyruvate kinase (Pk), (b) gluconeogenesis with the glucose-6-phosphatase (G6pc) and the fructose-1,6-bisphosphatase (Fbp) and (c) de novo lipogenesis with the fatty acid synthase (Fasn).
Ijms 22 06149 g003
Figure 4. (a) Plasma glucose and (b) triglycerides concentrations of mature male rainbow trout fasted for 15 days (Fasted, white), fed with the NC diet (non-carbohydrate diet, grey) and fed with the HC diet (high-carbohydrate diet, dark grey). Data (n = 15 fish per condition) were analysed with either one-way ANOVA when the conditions of application were respected, or the Kruskal-Wallis test, followed by a post hoc Tukey’s test in case of significant differences (p < 0.05, indicated with different letters).
Ijms 22 06149 g004
Figure 5. Enzymatic activities of glucose and lipid metabolism in the liver of mature male rainbow trout fasted for 15 days (Fasted, white), fed with a non-carbohydrate diet (NC, grey) and fed with a high-carbohydrate diet (HC, dark grey). Enzymatic activities are expressed as mU·mg−1 of proteins for (a) glycolysis with the glucokinase (Gck), the phosphofructokinase (Pfk) and the pyruvate kinase (Pk), (b) gluconeogenesis with the glucose-6-phosphatase (G6pc) and the fructose-1,6-bisphosphatase (Fbp) and (c) de novo lipogenesis with the fatty acid synthase (Fasn).
Ijms 22 06149 g005
Figure 6. (a) Plasma glucose and (b) triglycerides concentrations of neomale rainbow trout fasted for 15 days (Fasted, white), fed with the NC diet (non-carbohydrate diet, grey) and fed with the HC diet (high-carbohydrate diet, dark grey). Data (n = 15 fish per condition) were analysed with either one-way ANOVA when the conditions of application were respected, or the Kruskal-Wallis test, followed by a post hoc Tukey’s test in case of significant differences (p < 0.05, indicated with different letters).
Ijms 22 06149 g006
Figure 7. Enzymatic activities of glucose and lipid metabolism in the liver of neomale rainbow trout fasted for 15 days (Fasted, white), fed with a non-carbohydrate diet (NC, grey) and fed with a high-carbohydrate diet (HC, dark grey). Enzymatic activities are expressed as mU·mg−1 of proteins for (a) glycolysis with the glucokinase (Gck), the phosphofructokinase (Pfk) and the pyruvate kinase (Pk), (b) gluconeogenesis with the glucose-6-phosphatase (G6pc) and the fructose-1,6-bisphosphatase (Fbp) and (c) de novo lipogenesis with the fatty acid synthase (Fasn).
Ijms 22 06149 g007
Figure 8. Experimental design. Mature female and male, and neomale, rainbow trout were fed either a diet containing no carbohydrates (NC) or containing 35% of carbohydrates (HC).
Ijms 22 06149 g008
Table 1. Relative mRNA levels of glucose and lipid metabolism-related genes in liver of fasted mature female rainbow trout, fed with a non-carbohydrate diet (NC) or fed with a high-carbohydrate diet (HC). Data are represented as means ± SD (n = 9 females per condition). Genes which have not been detected are represented by “nd”.Data were analysed using one-way ANOVA when conditions of application were respected, otherwise the Kruskal–Wallis test was performed. Significant differences of means were analysed using post hoc Tukey’s test and are represented using different letters (a, b) and bold p-values.
Pathway/GenesFastedNCHCp-Value
Glucose transport
glut2a1.92 ± 0.602.36 ± 1.331.82 ± 1.170.573
glut2b1.91 ± 0.642.37 ± 0.821.99 ± 1.090.567
Glycolysis
gcka3.01 ± 7.003.36 ± 5.370.119
gckb1.83 ± 4.12 a,b0.15 ± 0.36 a4.16 ± 6.18 b0.049
pfkla0.92 ± 0.28 a1.45 ± 0.35 b1.27 ± 0.51 a,b0.045
pfklb0.94 ± 0.321.5 ± 0.571.3 ± 0.330.051
pkl0.8 ± 0.351.37 ± 0.481.25 ± 0.630.1
Gluconeogenesis
g6pca0.93 ± 0.37 a0.75 ± 0.64 a,b0.42 ± 0.20 b0.004
g6pcb1a3.08 ± 3.17 a0.94 ± 1.71 a,b0.12 ± 0.37 b0.005
g6pcb1b0.35 ± 0.18 a0.7 ± 0.76 a0.09 ± 0.06 b0.001
g6pcb2a0.49 ± 0.57 a1.49 ± 0.87 a,b1.8 ± 1.46 b0.020
g6pcb2bndndnd-
fbp1andndnd-
fbp1b10.9 ± 0.431.02 ± 0.900.73 ± 0.230.848
fbp1b22.01 ± 0.672.11 ± 2.01.6 ± 0.760.340
pck100.11 ± 0.2300.157
pck2a1.79 ± 1.331.28 ± 0.581.45 ± 0.770.557
pck2b1.05 ± 0.531.56 ± 0.721.47 ± 0.650.266
Lipid metabolism
srebf10.2 ± 0.11 a0.99 ± 0.60 b1.34 ± 0.88 b<0.001
g6pd1.63 ± 1.123.19 ± 2.452.95 ± 2.140.289
acly0.92 ± 0.46 a2.64 ± 1.14 b2.04 ± 2.14 b0.007
aca-αa0.15 ± 0.11 a2.08 ± 2.06 b2.72 ± 1.26 b<0.001
aca-αb0.17 ± 0.09 a1.66 ± 1.49 b2.53 ± 2.44 b<0.001
aca-βa2.53 ± 0.671.87 ± 2.372.06 ± 1.260.160
aca-βb1.29 ± 0.591.3 ± 0.591.28 ± 0.870.701
fasn0.12 ± 0.22 a3.28 ± 2.20 b1.67 ± 1.36 b0.001
Table 2. Relative mRNA levels of glucose and lipid metabolism-related genes in liver of fasted mature male rainbow trout (Fasted), fed with a non-carbohydrate diet (NC) or fed with a high-carbohydrate diet (HC). Data are represented as means ± SD (n = 9 males per condition). Genes which have not been detected are represented by “nd”. Data were analysed using one-way ANOVA when conditions of application were respected, otherwise the Kruskal–Wallis test was performed. Significant differences of means were analysed using post hoc Tukey’s test and are represented using different letters (a, b) and bold p-values.
Pathway/GenesFastedNCHCp-Value
Glucose transport
glut2a2.51 ± 1.482.88 ± 1.662.15 ± 1.210.790
glut2b2.12 ± 1.232.59 ± 1.352.07 ± 0.960.656
Glycolysis
gcka1.61 ± 1.64 a0 b0 b0.001
gckb000.29 ± 0.870.434
pfkla0.6 ± 0.301.21 ± 0.680.9 ± 0.370.076
pfklb0.59 ± 0.311.2 ± 0.640.93 ± 0.380.062
pkl0.91 ± 0.611.48 ± 0.731.43 ± 0.390.100
Gluconeogenesis
g6pca1.85 ± 1.11.82 ± 1.21.23 ± 0.750.393
g6pcb1a0.38 ± 0.610.53 ± 1.5900.127
g6pcb1b1.1 ± 0.7 a,b2.76 ± 3.14 a0.62 ± 0.43 b0.046
g6pcb2a0.36 ± 0.17a1.71 ± 1.1 b1.87 ± 1.5 b0.018
g6pcb2bndndnd-
fbp1andndnd-
fbp1b11.66 ± 0.661.86 ± 0.921.62 ± 0.860.773
fbp1b20.84 ± 0.680.63 ± 0.430.74 ± 0.290.592
pck10.19 ± 0.23 a4.88 ± 6.35 b0.3 ± 0.3 a0.005
pck2a2.99 ± 2.261.87 ± 1.092.50 ± 1.770.317
pck2b1.21 ± 0.551.80 ± 0.831.33 ± 0.690.191
Lipid metabolism
srebf10.17 ± 0.06 a1.19 ± 0.86 b0.92 ± 0.59 b<0.001
g6pd1.64 ± 0.951.63 ± 1.021.69 ± 0.750.989
acly0.96 ± 0.632.01 ± 1.271.57 ± 0.720.132
aca-αa0.13 ± 0.09 a1.37 ± 1.59 b1.67 ± 1.43 b<0.001
aca-αb0.15 ± 0.09 a1.27 ± 1.24 b1.67 ± 1.31 b<0.001
aca-βa1.95 ± 0.84 a0.53 ± 0.39 b0.53 ± 0.36 b<0.001
aca-βb1.18 ± 0.621.94 ± 1.301.41 ± 0.670.177
fasn0.21 ± 0.12 a1.97 ± 1.24 b2.13 ± 1.34 b0.004
Table 3. Relative mRNA levels of glucose and lipid metabolism-related genes in liver of fasted neomale rainbow trout (Fasted), fed with a non-carbohydrate diet (NC) or fed with a high-carbohydrate diet (HC). Data are represented as means ± SD (n = 9 neomales per condition). Genes which have not been detected are represented by “nd”. Data were analysed using one-way ANOVA when conditions of application were respected, otherwise the Kruskal–Wallis test was performed. Significant differences of means were analysed using post hoc Tukey’s test and are represented using different letters (a, b) and bold p-values.
Pathway/GenesFastedNCHCp-Value
Glucose transport
glut2a1.96 ± 1.462.20 ± 1.101.92 ± 0.830.782
glut2b1.64 ± 1.081.89 ± 1.051.75 ± 0.840.917
Glycolysis
gcka000.89 ± 1.510.125
gckb0.02 ± 0.06 a0.02 ± 0.06 a2.51 ± 2.92 b0.006
pfkla0.88 ± 0.24 a1.48 ± 0.77 b1.55 ± 0.99 b0.042
pfklb0.83 ± 0.21 a1.43 ± 0.7 b1.46 ± 0.88 b0.037
pkl0.75 ± 0.351.04 ± 0.461.13 ± 0.690.156
Gluconeogenesis
g6pca1.22 ± 0.371.04 ± 0.510.84 ± 0.930.081
g6pcb1a1.92 ± 1.06a0 b0 b<0.001
g6pcb1b0.84 ± 0.74 a3.7 ± 3.25 b1.04 ± 2.10 a,b0.015
g6pcb2a0.32 ± 0.37 a1.73 ± 1.60 b1.35 ± 1.25 b0.001
g6pcb2bndndnd-
fbp1andndnd-
fbp1b10.96 ± 0.641.34 ± 0.670.76 ± 0.400.067
fbp1b21.3 ± 0.63 a0.97 ± 0.52 a,b0.59 ± 0.24 b0.006
pck10.03 ± 0.08 a5.32 ± 4.21 b2.17 ± 5.76 a<0.001
pck2a2.99 ± 2.261.87 ± 1.092.50 ± 1.770.317
pck2b1.21 ± 0.551.80 ± 0.831.33 ± 0.690.191
Lipid metabolism
srebf10.4 ± 0.23 a1.2 ± 0.65 b1.9 ± 1.32 b<0.001
g6pd0.6 ± 0.87 a2.51 ± 1.37 b1.99 ± 1.24 b0.001
acly0.68 ± 0.9 a2.4 ± 1.08 b2.15 ± 1.53 b0.001
aca-αa0.18 ± 0.11 a1.87 ± 1.27 b3.63 ± 3.24 b<0.001
aca-αb0.22 ± 0.13 a1.78 ± 1.15 b3.49 ± 3.09 b<0.001
aca-βa2.31 ± 1.23 a1.12 ± 0.74 a,b0.79 ± 0.52 b0.005
aca-βb2.35 ± 0.60 a1.19 ± 0.52 b1.38 ± 0.78 a,b0.005
fasn0.05 ± 0.11 a2.06 ± 1.25 b2.5 ± 1.85 b<0.001
Table 4. Diet composition of the non-carbohydrate diet (NC) and the high-carbohydrate diet (HC).
Ingredients (%)NCHC
5 mm9 mm5 mm9 mm
Fish meal 177.7777.774545
Pre-gelatinised starch 2--3737
CPSP90 32255
Soybean meal 41212--
Pea protein concentrated 5--55
Fish oil 61.661.663.963.96
Cellulosis 72.532.53--
Alginate 82222
Minerals premix 91111
Vitamins premix 91111
Astaxanthine 100.040.040.040.04
Proximate composition
Dry matter93.9794.4295.8496.05
Crude proteins (%DM)66.6365.741.9742.94
Gross energy (kJ/gDM)20.2120.4818.7320.44
Ash (%DM)16.8116.7510.3710.4
Carbohydrates (%DM)0.550.5532.5532.55
Crude lipids (%DM)8.719.697.576.47
1 Sopropêche 62126 Wimille, France, 2 Gelatinised corn starch roquette 62136 Wimille, France, 3 Sopropêche 62126 Wimille, France, 4 SUDOUEST Aliment 40360 Pomarez, France, 5 roquette 62136 Lestrem, 6 Sopropêche 62126 Wimille, France, 7 RETTENMAIER FRANCE SARL 78100 Saint Germain en Laye, France, 8 Louis François 77,134 Croissy Beaubourg, France, 9 INRAE SAAJ 78350 Jouy en Josas, France, 10 DSM food 59113 Seclin, France.
Table 5. Primer sequences and accession numbers for qPCR analysis of the de novo lipogenesis pathway.
GeneForward Primer (5’-3’)Reverse Primer (5’-3’)GenBank Accession Number
srebf1CAGTTGCTGCTGTGTGACCTTGATGTGTTCGTGTGGGACTXM_021624594.1
aclyCCTCTGTAAGGCCAAGTGGGTTGGCATCCAGGTCTGCAATXM_021624819.1/XM_021557697.1/XM_021575392.1
aca-αaACAGGACCCTAAAGCACAGGGGTGAAAGAGGTGTCCAGGAXM_021623125.1
aca-αbTCCAGTTCATGCTGCCTACCGCTTAATGTCCCGAGTGCGAXM_021618451.1
aca-βaTCGCTCAGAATTCCGGGTACCGCGTGGTGATGGTTACAATXM_021605386.1
aca-βbTGAACAGCTTGGTAAACAGCCTCTCGTGCATTCTACCAGGGXM_021620987.1
fasnTGATCTGAAAGCCCGTGTCAAATTTGGTTGCCGGGACGTAAXM_021576228.1/XM_021581290.1
Publisher’s Note: MDPI stays neutral with regard to jurisdictional claims in published maps and institutional affiliations.

