Article

Rare Variants in Autophagy and Non-Autophagy Genes in Late-Onset Pompe Disease: Suggestions of Their Disease-Modifying Role in Two Italian Families

by
Filomena Napolitano
1,2,†,
Giorgia Bruno
1,†,
Chiara Terracciano
1,3,
Giuseppina Franzese
1,
Nicole Piera Palomba
4,
Federica Scotto di Carlo
2,
Elisabetta Signoriello
1,
Paolo De Blasiis
1,
Stefano Navarro
2,
Alessandro Gialluisi
4,
Mariarosa Anna Beatrice Melone
1,5,
Simone Sampaolo
1,† and
Teresa Esposito
2,4,*,†
1
Department of Advanced Medical and Surgical Sciences, 2nd Division of Neurology, Center for Rare Diseases and Inter University Center for Research in Neurosciences, University of Campania “Luigi Vanvitelli”, 80131 Naples, Italy
2
Institute of Genetics and Biophysics “Adriano Buzzati-Traverso”, National Research Council, 80131 Naples, Italy
3
Neurology Unit, Guglielmo da Saliceto Hospital, 29121 Piacenza, Italy
4
IRCCS INM Neuromed, Pozzilli, 86077 Isernia, Italy
5
Sbarro Institute for Cancer Research and Molecular Medicine, Center for Biotechnology, Temple University, Philadelphia, PA 19122, USA
*
Author to whom correspondence should be addressed.
These authors contributed equally.
Int. J. Mol. Sci. 2021, 22(7), 3625; https://doi.org/10.3390/ijms22073625
Submission received: 6 March 2021 / Revised: 24 March 2021 / Accepted: 29 March 2021 / Published: 31 March 2021
(This article belongs to the Collection Feature Papers in Molecular Genetics and Genomics)

Abstract

:
Pompe disease is an autosomal recessive disorder caused by a deficiency in the enzyme acid alpha-glucosidase. The late-onset form of Pompe disease (LOPD) is characterized by a slowly progressing proximal muscle weakness, often involving respiratory muscles. In LOPD, the levels of GAA enzyme activity and the severity of the clinical pictures may be highly variable among individuals, even in those who harbour the same combination of GAA mutations. The result is an unpredictable genotype–phenotype correlation. The purpose of this study was to identify the genetic factors responsible for the progression, severity and drug response in LOPD. We report here on a detailed clinical, morphological and genetic study, including a whole exome sequencing (WES) analysis of 11 adult LOPD siblings belonging to two Italian families carrying compound heterozygous GAA mutations. We disclosed a heterogeneous pattern of myopathic impairment, associated, among others, with cardiac defects, intracranial vessels abnormality, osteoporosis, vitamin D deficiency, obesity and adverse response to enzyme replacement therapy (ERT). We identified deleterious variants in the genes involved in autophagy, immunity and bone metabolism, which contributed to the severity of the clinical symptoms observed in the LOPD patients. This study emphasizes the multisystem nature of LOPD and highlights the polygenic nature of the complex phenotype disclosed in these patients.

1. Introduction

Glycogen storage disease type II (GSDII; Online Mendelian Inheritance in Man (OMIM) 232300; Pompe disease or acid maltase deficiency) is an autosomal recessive disorder caused by mutations in the acid alpha-glucosidase (GAA) gene encoding a lysosome enzyme that hydrolyses glycogen to glucose [1].
Mutations in GAA lead to a wide spectrum of clinical phenotypes, ranging from a severe infantile form, presenting with cardiomyopathy and muscular hypotonia, to a relatively mild, LOPD form characterized by a slowly progressing proximal muscle weakness, often involving respiratory muscles [1,2]. More recently, many additional symptoms associated with LOPD came to light: dysarthria and dysphagia, osteoporosis, scoliosis, sleep apnoea, small fibre neuropathy, hearing loss, impaired gastric function, urinary tract and anal sphincter involvement, pain and fatigue, as well as a risk of cardiac arrhythmia and cerebral and intracranial aneurysms [3]. These clinical findings emphasize the multisystem nature of LOPD.
In LOPD patients, the levels of GAA enzyme activity and the severity of clinical pictures may be highly variable among individuals, even in those who harbour the same combination of GAA mutations [4,5]. This indicates that there is no definite correlation between enzyme activity levels and severity of phenotype in LOPD patients [5,6,7,8,9,10,11,12,13,14,15]. This evidence leads to the hypothesis that the expression of GAA mutations could be modified by genetic background and non-genetic factors (life-style, nutrition and environment) [16,17]. To identify the modifier factors, which might affect the severity of symptoms of LOPD patients, studies on large informative families are advisable. Indeed, GAA-mutated family members have the closest possible genetic background and might better define the genotype–phenotype correlation, including a wide spectrum of clinical parameters.
In this manuscript, we report on a detailed clinical, morphological and genetic study of 11 adult LOPD siblings belonging to two large Italian families carrying compound heterozygous GAA mutations [18]. To better manage the wide spectrum of clinical and biochemical data, we calculated a severity index that was useful to simplify the genotype–phenotype relationships in both LOPD families.

2. Results

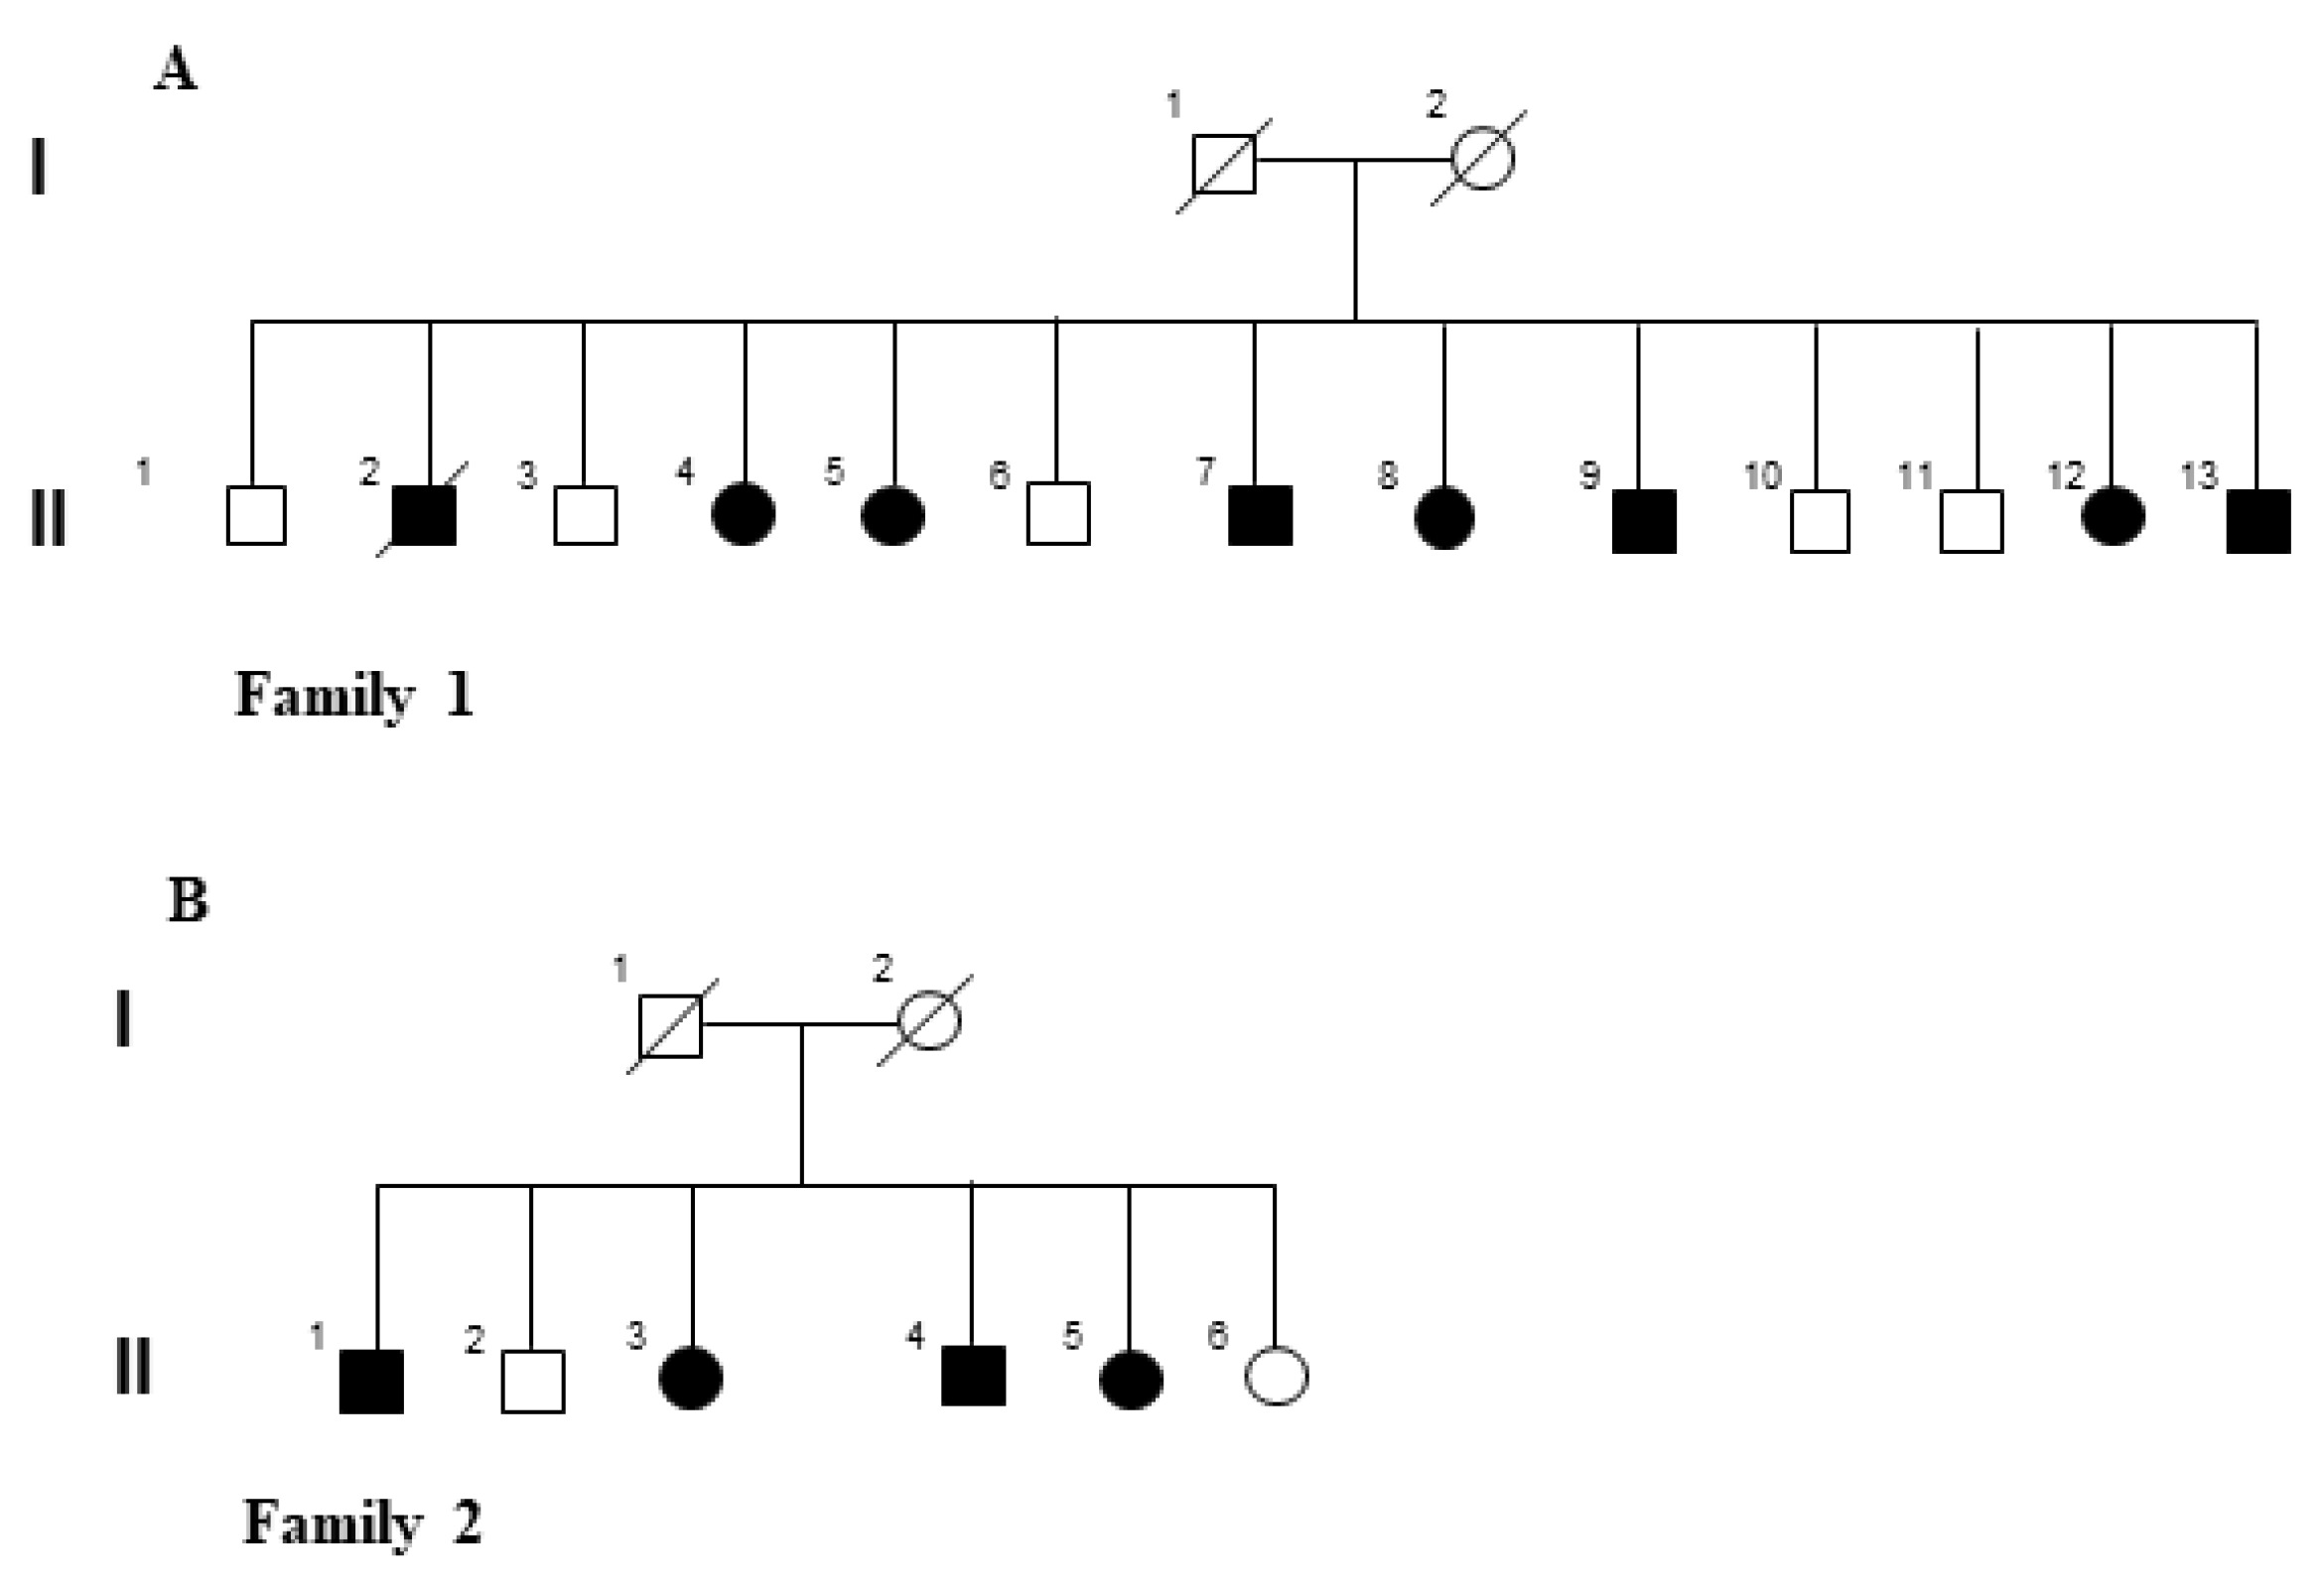
2.1. Clinical Evaluation of the LOPD Patients

In this study, we focused our analysis on 11 LOPD siblings from two families (family 1: II-4, II-5, II-7, II-8, II-9, II-12, II-13; 4 females and 3 males; family 2: II-I, II-3, II-4, II-5; 2 females and 2 males) from Southern Italy (ages 50–67 years for family 1, and 41–51 years for family 2) (Figure 1A,B). Family 1 was already published [18]. To reduce the genetic heterogeneity, we included in this study only the patients of the second generation who carried the same combination of GAA mutations. Subjects II-1 and II-6 had a different GAA genetic background [18], a less severe phenotype than other siblings did, and they refused both ERT and WES analysis.
A complete description of all the clinical data collected in this study is reported in Table 1. All data were collected at baseline before ERT treatment. The immune response to ERT was assessed after the first two infusions and at three, six and twelve months of treatments, according to the ERT protocol, and the data shown in the Table 1 were those recorded at 12 months.
Mean age at first symptoms was 41.7 years ± 6.7 standard deviation (SD) (range 29–53 years), with a higher average age at onset for females (43.5 ± 8.5 years) versus males (39.6 ± 3.2 years). The mean time lag between early symptoms and diagnosis was 12.5 ± 4.5 years. Analysis of motor function revealed mild reduced muscle strength in all patients, primarily affecting paraspinal and pelvic muscles, with manual muscle testing (MMT) mean score of 83.54% ± 8.61 and Gait, Stairs, Gower, Chair (GSCG) score of 11.09 ± 6.6. The 6-min walking test (6MWT) revealed a reduced physical functional capacity, achieving a distance of 241.66 ± 119 m for females and 279.2 ± 122.2 m for males.
The severity of muscle weakness varied between the patients regardless of gender and duration of the disease. A significant association between age at onset and muscle weakness was previously demonstrated in affected siblings of family 1 [18]. In accordance to this finding, looking at family 2 (Table 1), patients II-4 and II-5 showed worse motor capacity with earlier onset of symptoms (respectively at 38 and 29 years old) compared to other family members; in particular, subject II-5 was able to walk only with double support for a few meters (10 m at 6MWT). According to the Fatigue Severity Scale (FSS, Italian version), all our patients obtained a score higher than 5 (severe fatigue) [19]. The mean forced vital capacity (FVC) value in the upright position of all patients was 76.81% ± 21.76; the FVC was ≥80% of the predicted normal in 5 out of 7 siblings of family 1 (II-7, 8, 9, 12, 13) and only in II-1 of family 2 (Table 1). The other subjects analysed had reduced FVC upright values, which dropped in the supine position. However, patients II-4 and II-5 of family 2 (Table 1) were not able to perform spirometry in the supine position due the severe drop in respiratory performance, for which they needed non-invasive ventilation (NIV). These findings were suggestive of a restrictive respiratory pattern ranging from a mild to a moderately severe degree [20]. A meaningful correlation between respiratory impairment and age at onset was already reported in family 1 [18]; this is also true in family 2, in which the youngest members (II-4 and II-5) showed the most severe respiratory conditions compared to those of the other siblings (Table 1). Body mass index (BMI, kg/m2) was assessed since it represents a significant comorbidity in determining reduced motor capacity and worsening respiratory function. Although the patients with metabolic myopathies usually have normal or reduced BMI due to progressive muscle wasting, our patients showed an increased BMI mean value (27.74 ± 5.57) (Table 1). Furthermore, numerous studies demonstrated a high prevalence of osteoporosis in patients with LOPD [21]. To explore this aspect, we measured in all patients the circulating level of vitamin D and performed the analysis of bone mass density (BMD). The vitamin D levels were reduced in all subjects. In particular, patients II-12 and II-13 of family 1 and II-2 of family 2 (Table 1) showed a mean value of serum vitamin 25(OH)D of 19.25 ± 13.11, which denoted a status of insufficiency/deficiency. BMD was suggestive of osteopenia in most patients with reduced levels of vitamin D, whereas subjects F1-II-8 and F2-II-3 had normal T-score values despite vitamin D deficiency. In the patient II-4 of family 1, BMD indicated osteoporosis in accordance with her personal history of spontaneous vertebral collapse of two dorsal vertebrae. Furthermore, bone fractures occurred with low trauma and at a young age, with delayed healing, in patients F1-II-8 at 30 years old (proximal radius fracture) and in F2-II-5 at 42 years old (neck femur fracture). Additionally, LOPD is a predisposing condition to dilative arteriopathy and cerebral aneurysm formation [22], while structural cardiac alterations do not seem to be present when Pompe disease begins in adulthood [23]. We observed from brain magnetic resonance imaging (MRI) dilated intracranial internal carotid and basilar artery dolichoectasia in all siblings of family 1. Vascular anomalies in patient II-8, who carried a paramagnetic prosthesis, were confirmed through Angio-TC. Echocardiography revealed mild mitral prolapse in all subjects of family 1, except for II-13. Members of family 2 did not show any cerebral-vascular anomaly or cardiac valvular diseases. At the time of first evaluation of the patients, the GAA activity on Dried Blood Spot (DBS) was assessed, revealing a significantly reduced activity (mean values 0.56 ± 0.78 mol/h/L). Surprisingly, in subject II-4 of family 1, the dosage was in the normal range. A high number of lymphocytes containing Periodic Acid–Schiff (PAS)-positive granules were present on blood smears in the majority of the patients, with mean percentage values of 50.36% ± 21.36% (Table 1). Histological analysis of the muscle samplings detected a percentage of vacuolated fibres of 3.09% ± 5.02%, higher in the patients II-9 of family 1 (11.18%) and II-5 of family 2 (15.31%). Although the vacuolated fibres are representative of autophagy impairment in skeletal muscles, they do not seem to correlate with duration of the disease, age at biopsy nor with the residual GAA enzyme activity [18,24]. Finally, response to ERT and adverse reaction to therapy were considered. Specific serum IgG against rh-GAA ranged 850 to 6400 after one-year therapy. Patient II-5 of family 1 developed a severe adverse reaction after 18 months of ERT, disclosing diffuse cutaneous rash and shortness of breath during infusion. There were increased levels of specific serum IgG (51,000 mg/dL) and C3 and C4 fractions of the complement, while the C1 inhibitor was decreased (0.1 g/L) and the IgE antibodies against rh-GAA were absent.

2.2. Generation of a Phenotype Severity Index (SI) for LOPD

To simplify the large amount of clinical results and define the relationship between clinical variability and genetic factors, we elaborated a phenotype SI. The minimum score for SI was 1, which indicates a diagnosis of LOPD without additional significant clinical signs, while the maximum SI score was 47. Results are reported in Table 2. The grade of severity for a single item was assigned: grade 0 indicated normal findings; age at onset (years old) was graded from 1 to 6 (grade 1: >50; grade 2: 49–40; grade 3: 39–30; grade 4: 29–15; grade 5: 14–10; grade 6: 9–1), while Manual Muscle Testing—Medical Research Council (MMT-MRC) (%) was graded from 0 to 4 (grade 0: 100%; grade 1: 99–90; grade 2: 89–80; grade 3: 79–70; grade 4: <69). 6MWT (m) severity score was different by gender (6MWT for females: grade 0: 480 ± 57; grade 1: 422–362; grade 2: 361–301; grade 3: 300–240; grade 4: 239–179; grade 5: 178–118; grade 6: <118; 6MWT for males: grade 0: 580 ± 44; grade 1: 535–476; grade 2: 475–395; grade 3: 394–315; grade 4: 314–234; grade 5: 233–150; grade 6: <150), whereas GSCG score was considered equally for both sex (grade 0: 4; grade 1: 5–8; grade 2: 9–15; grade 3: 16–21; grade 4: 22–27). We attributed a grade from 1 to 4 for FVC (%) (grade 0: > 80; grade 1: 79–70; grade 2: 69–60; grade 3: 59–50; grade 4: <50) as well as for Δ-FVC (%) (grade 0: <10; grade 1: 10–15; grade 2: 15–20; grade 3: 20–30; grade 4: >30). BMI (Kg/m2) score was determined according to the definition of a normal weight, overweight and obesity as previously described (grade 0: 19.5–24.9; grade 1: 25–29.9, grade 2: 30–35.9, grade 3: 36–40, grade 4: >40). Reduced vitamin D 25-OH serum levels (ng/mL) were classified in accordance to the common definitions of insufficiency and deficiency (grade 0: 30–100; grade 1: 20–30; grade 2: <20), and for the BMD were considered values of the T-score (g/cm2) of three different districts if suggestive of osteopenia (grade 1) or osteoporosis (grade 2). We assigned a grade of 1 to bone fractures (grade 0: no history of bone fractures; grade 1: presence of bone fractures), basilar artery dolichoectasia (grade 0: normal findings at brain MRI; grade 1: presence of BAD) and to mitral valve prolapse (grade 0: normal mitral valve; grade 1: presence of mitral valve prolapsed). Equally was attributed a score of 1 to the relief of serum IgG anti-rhGAA (grade 0: absence of IgG; grade 1: presence of IgG).
For the FSS, all our patients obtained a score higher than 5 (severe fatigue) [19] and therefore the inclusion of this measure would not have changed the severity index calculation.
Moreover, since a clear relationship between disease severity and GAA activity in LOPD, as well as vacuoles in muscle fibres and in lymphocytes was not established yet [25,26], items related to autophagy impairment were not be considered in this index. Finally, the phenotype of the patients was divided into very mild (SI 1–10), mild (SI 11–20), moderate (SI 21–29), severe (SI 30–39), and very severe (SI ≥ 40).
As reported in Table 3, the clinical variables significantly associated with a worse severity score were global 6MWT (p = 0.03), FVC (p = 0.01), ΔFVC (p = 0.02), VDD (p = 0.01), BMD femoral neck (p = 0.03) and GSGC (p = 0.01). Considering the small sample size, 6MWT was analysed as global because the sex distribution was well distributed between the two subgroups. The association between 6MWT, GSGC, FVC, ΔFVC and the severity index score was also confirmed by Pearson correlation.

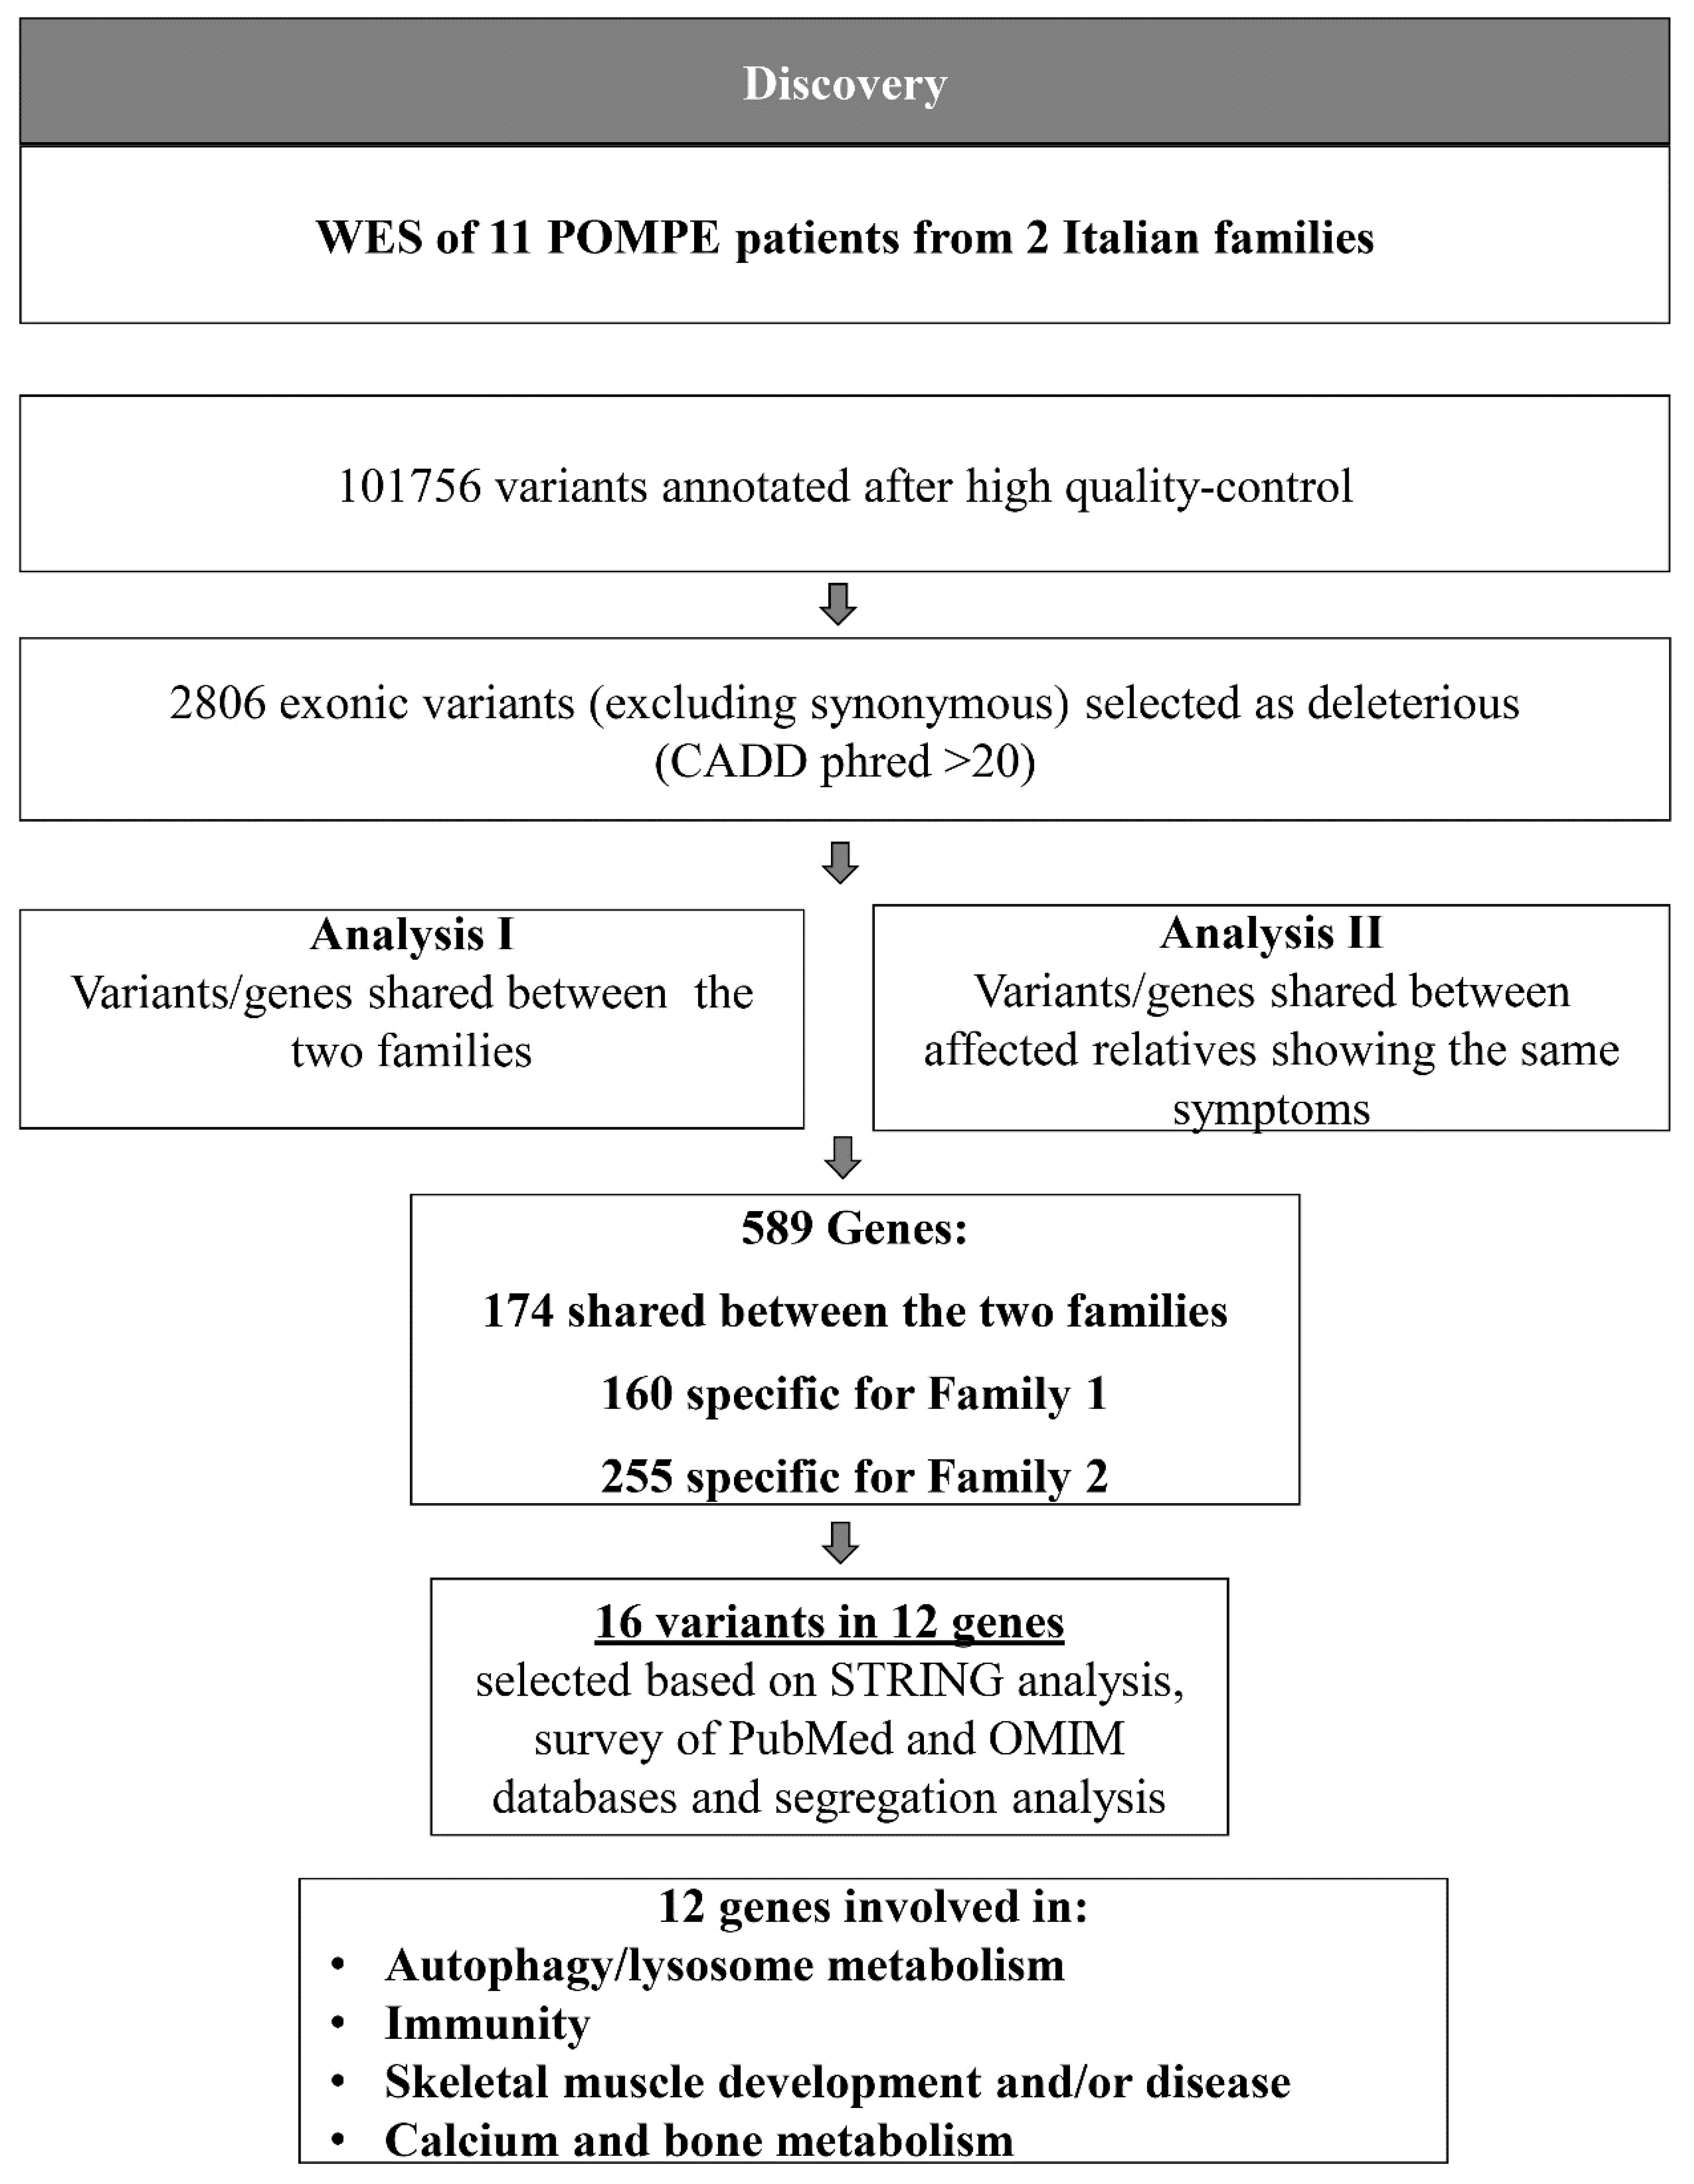
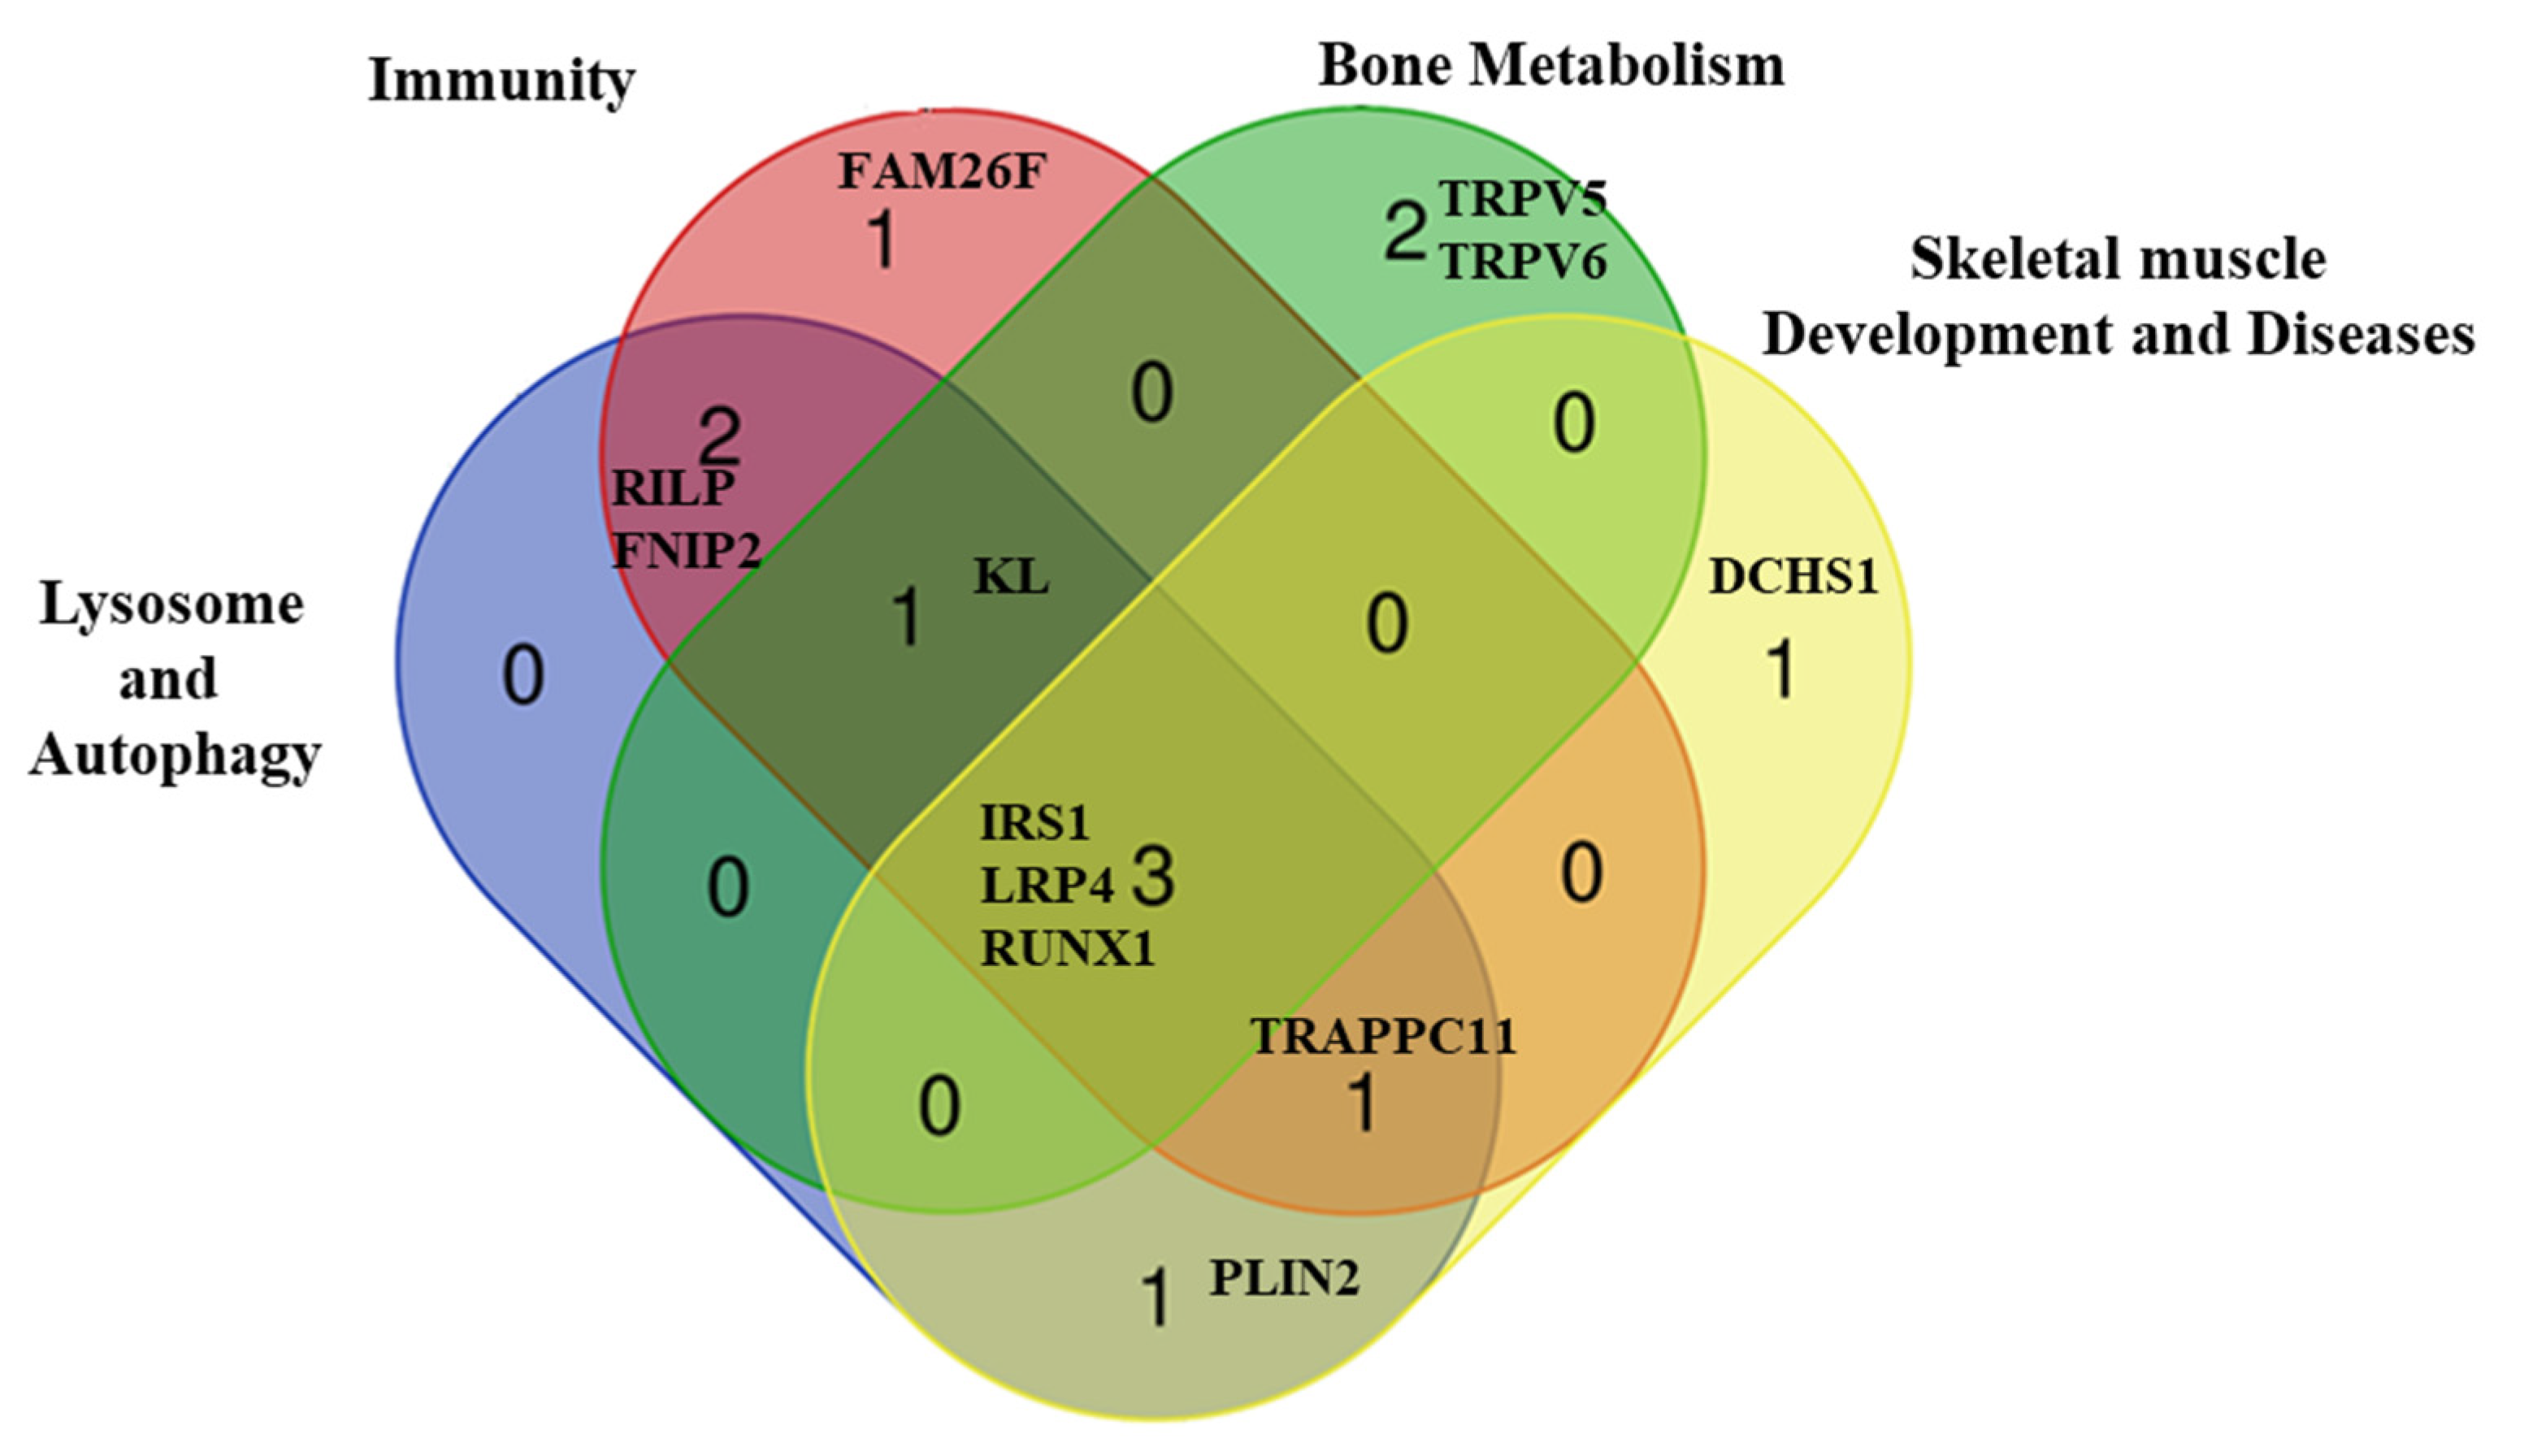
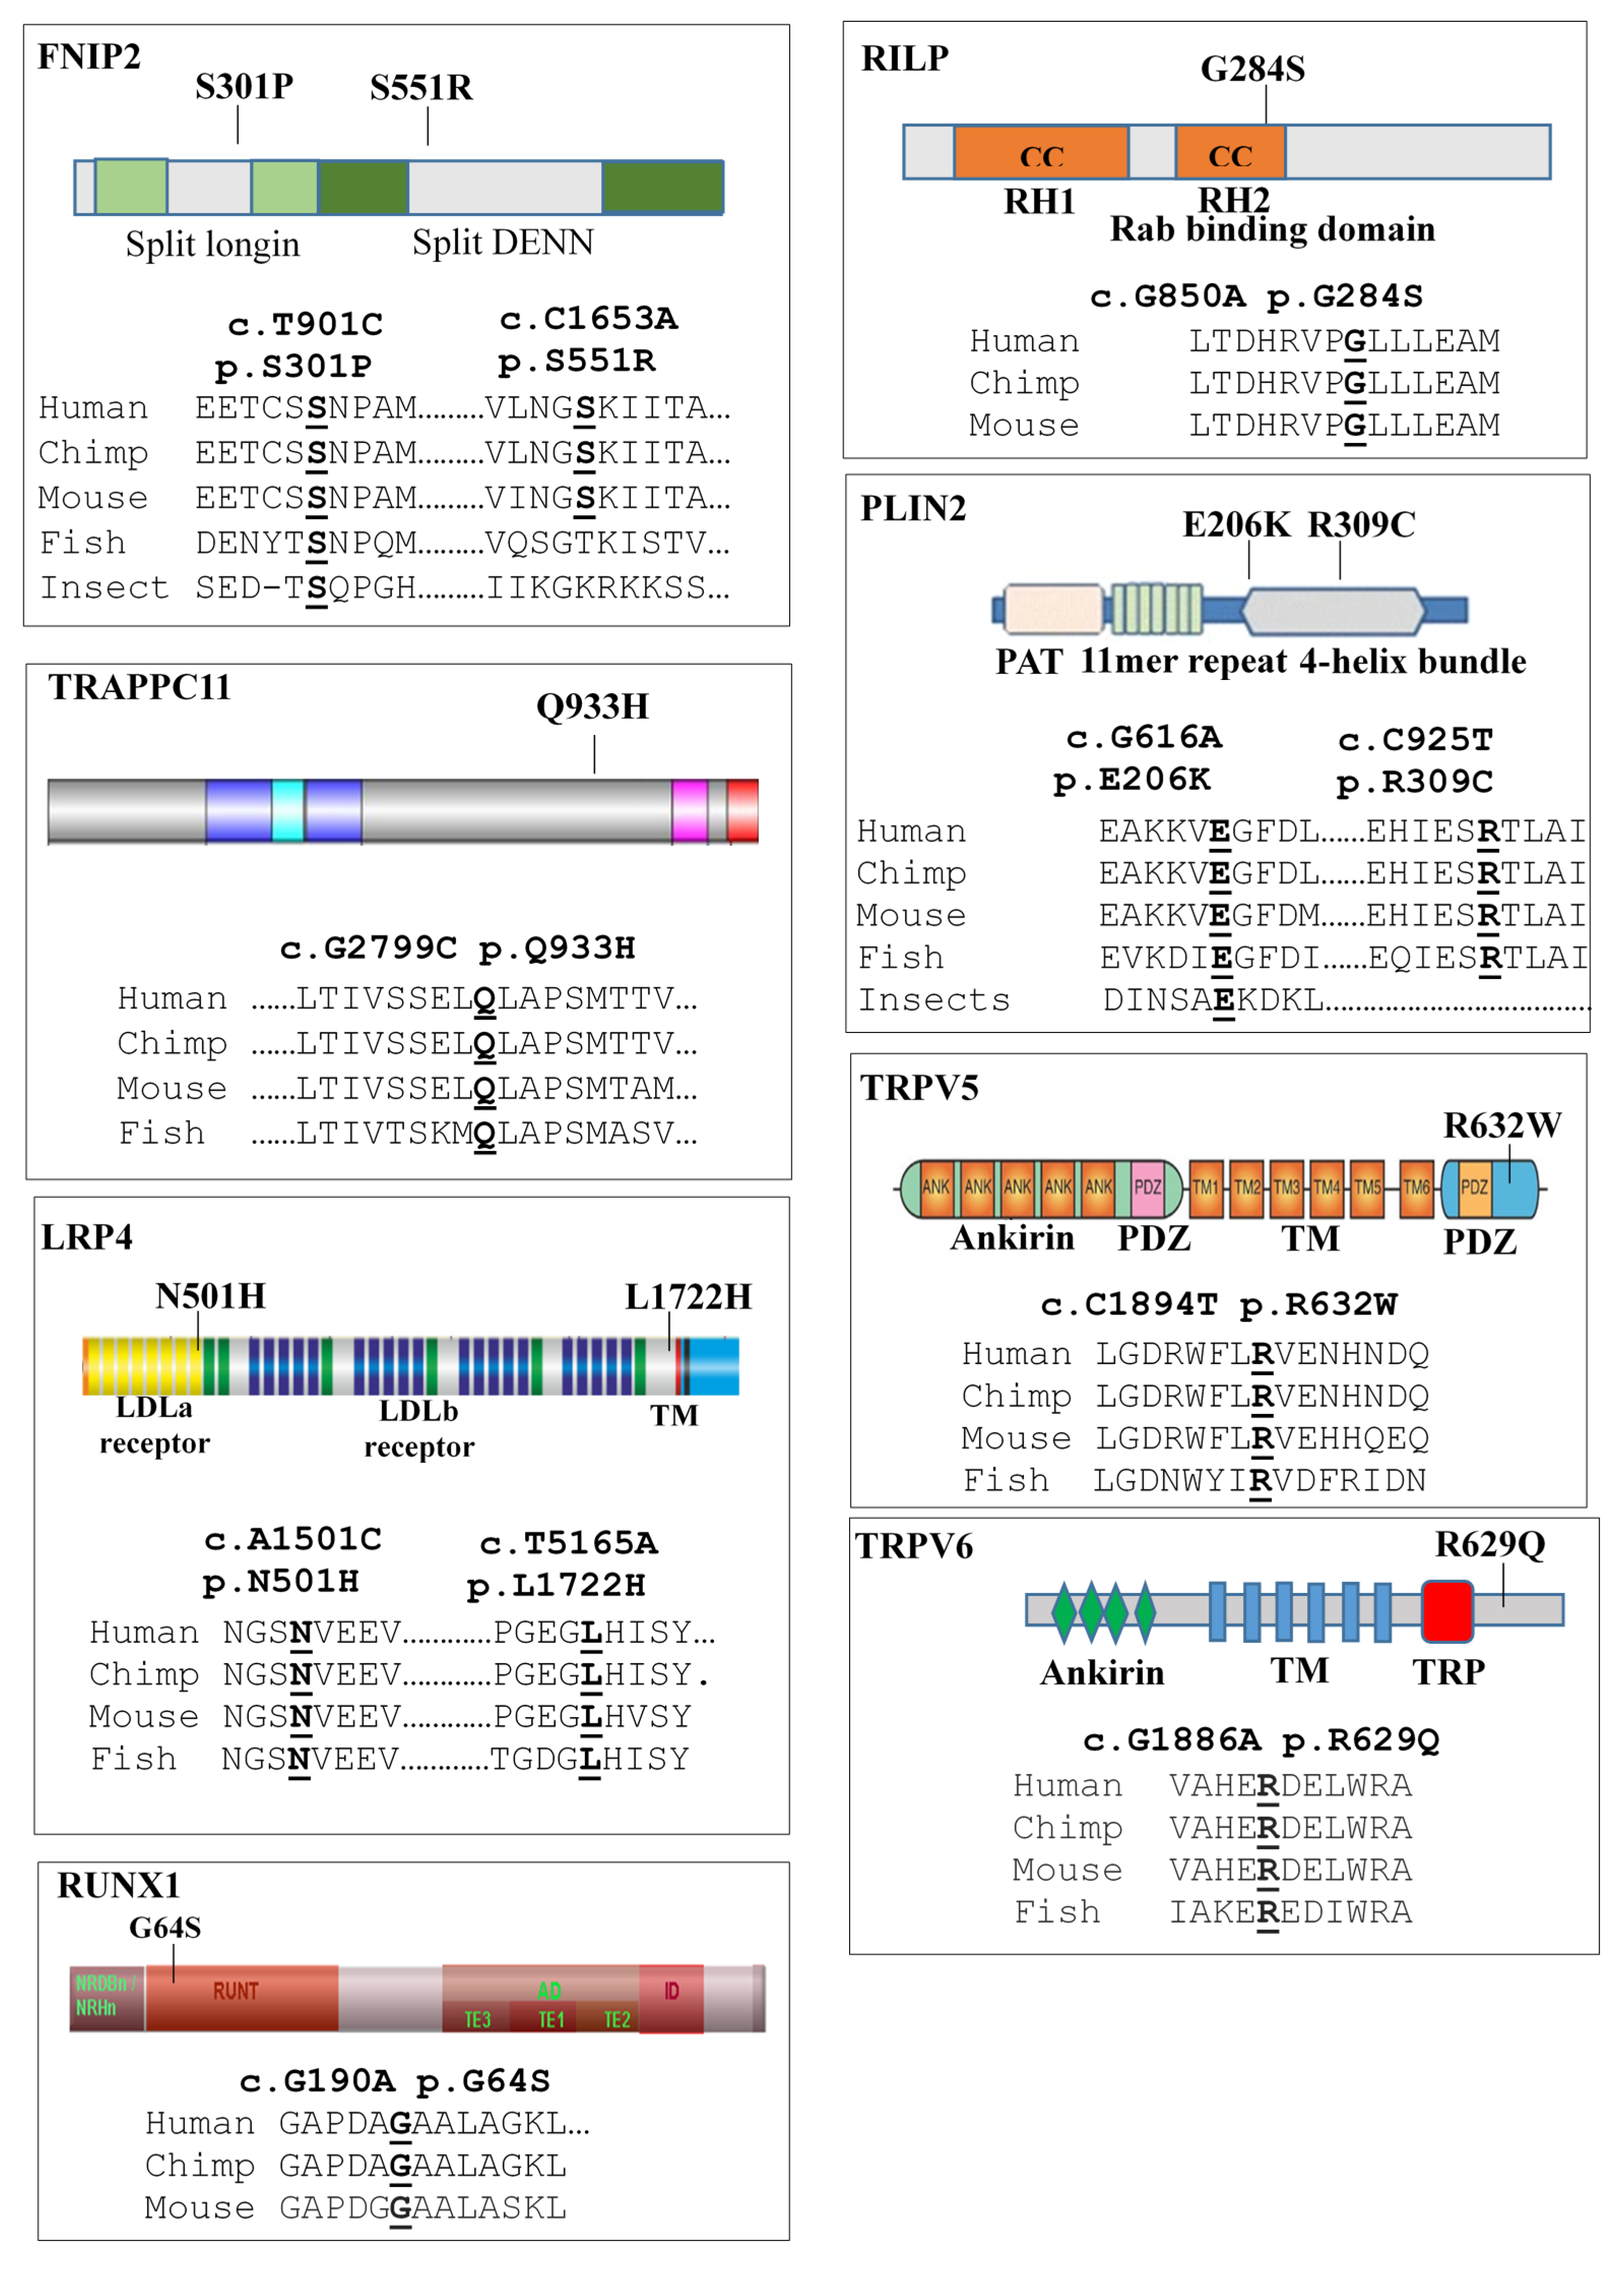
2.3. Comprehensive Genetic Analysis of the LOPD Patients

At the molecular level, the two families carried compound heterozygous mutations in GAA. Specifically, the 7 siblings of family 1 carried the two mutations c.118C > T (p.R40X) (reported as very severe in the Pompe Mutation Database) and c.2647-7G > A (p.N882fs) (potentially mild) [18], while the 4 siblings of family 2 carried the two mutations c.-32-13T > G (potentially mild) and c.1124G > T p.(Arg375Leu) (potentially less severe). Although the GAA c.2647-7G > A (p.N882fs) splicing variant of family 1 was associated to variable expression of the mutated allele [18], this mutation alone cannot explain the complex phenotype observed in these patients.
Considering that affected siblings belonging to the same family share the same GAA genomic region, we used the WES approach to search for other gene variants/mutations that might influence the severity of the LOPD phenotype.
We adopted a prioritization scheme to identify novel variants in modifier genes, similar to the approach taken in our recent studies (Figure 2) [27,28]. We annotated 101,756 high-quality variants from which we selected splicing variants (including splice acceptors and donor sites) and exonic variants, including non-synonymous variants (NSV), stop gain/loss and short coding insertions or deletions (indels; I) (16,230 variants); synonymous variants were excluded. Subsequently, we excluded the very common variants (minor allele frequency (MAF) ≥ 0.2) and selected the variants reported as highly deleterious (Combined Annotation Dependent Depletion (CADD) score ≥ 20) (2,806 variants), corresponding to those variants predicted to be amongst the 1% of the most deleterious variants in the genome. To dissect the different aspects of the disease manifestation, we performed dichotomization of the clinical signs as reported in the SI score (Table 2). Each patient was classified for each specific symptom as positive/negative or mild/severe. Subsequently, we performed two different analyses to identify the variants/genes shared between the two families (Analysis I, Figure 2) and the variants shared among relatives in each family (Analysis II, Figure 2). We selected 589 genes, including 174 shared between the two families, 160 specific to family 1 and 255 specific to family 2. To further reduce the number of variants, we performed a functional prioritization of the candidate genes using a STRING database analysis, as described in Material and Methods.
We identified 16 rare and deleterious variants (14 non-synonymous 1 non-frameshift insertion and 1 splicing) lying in 12 genes, involved across different interconnected pathways potentially deregulated in LOPD, including autophagy/lysosomal (RILP, FNIP2, TRAPPC11, PLIN2, IRS1, KL, LRP4, RUNX1), immunity (RILP, FNIP2, TRAPPC11, IRS1, KL, LRP4, RUNX1, FAM26F), bone metabolism (TRPV5, TRPV6, IRS1, KL, LRP4, RUNX1) and skeletal muscle development and/or disease (TRAPPC11, PLIN2, IRS1, LRP4, RUNX1, DCHS1) (Table 4 and Table 5 and Figure 3). Three out of the 12 genes, Rab Interacting Lysosomal Protein (RILP), Folliculin Interacting Protein 2 (FNIP2) and Perilipin 2 (PLIN2), were shared between the two families. RILP and FNIP2 were associated to a SI score > 20 and PLIN2 was associated with obesity in the two families. Polymorphic variants in the DCHS1 gene, which causes dominant Mitral Valve Prolapse type 2 (MVP2) [26], were identified in all patients with MVP as single or compound heterozygous (patients II-5, II-7 and II-12), suggesting their role as MVP susceptibility factors.
Noteworthy, all the affected residues identified in the patients occupy functionally important amino acid positions, which are highly conserved amongst vertebrates (Figure 4), supporting the evidence in favour of their functional role.
In the patient II-5 of family 1, who developed adverse response to ERT, we identified a splicing variant c.525 + 2T > G into the intron 2 of FAM26F gene, which codifies for a recently identified tetraspanin-like membrane glycoprotein that is involved in various immune modulating responses. A 100% probability was calculated by bioinformatics analysis that this variant completely disrupted the canonical donor splicing site into intron 2 of the FAM26F gene, suggesting that it was a deleterious change generating a frame shift (p.S174fs) and a predicted truncated protein of 224 amino acids. A reduced expression of the wild-type transcript was disclosed in patient II-5 combined with the presence of the aberrant spliced FAM26F transcript (Figure 5A,B).
Considering that the insufficiency/deficiency of vitamin D is the most important biochemical/clinical biomarker identified in our families, we investigated the allelic contribution in our patients of variants associated with low levels of vitamin D in genes involved in its metabolism. As reported in Table 6, we found in the two families an excess of CC alleles for the two variants rs2228570 (Vitamin D receptor (VDR) gene, c.T2C (p.M1T), also known as the FokI variant) and rs4588 (Vitamin D-binding protein (GC/DBP), c.C1307A (p.T436K)), which were reported as associated with low vitamin D levels in several populations [29].

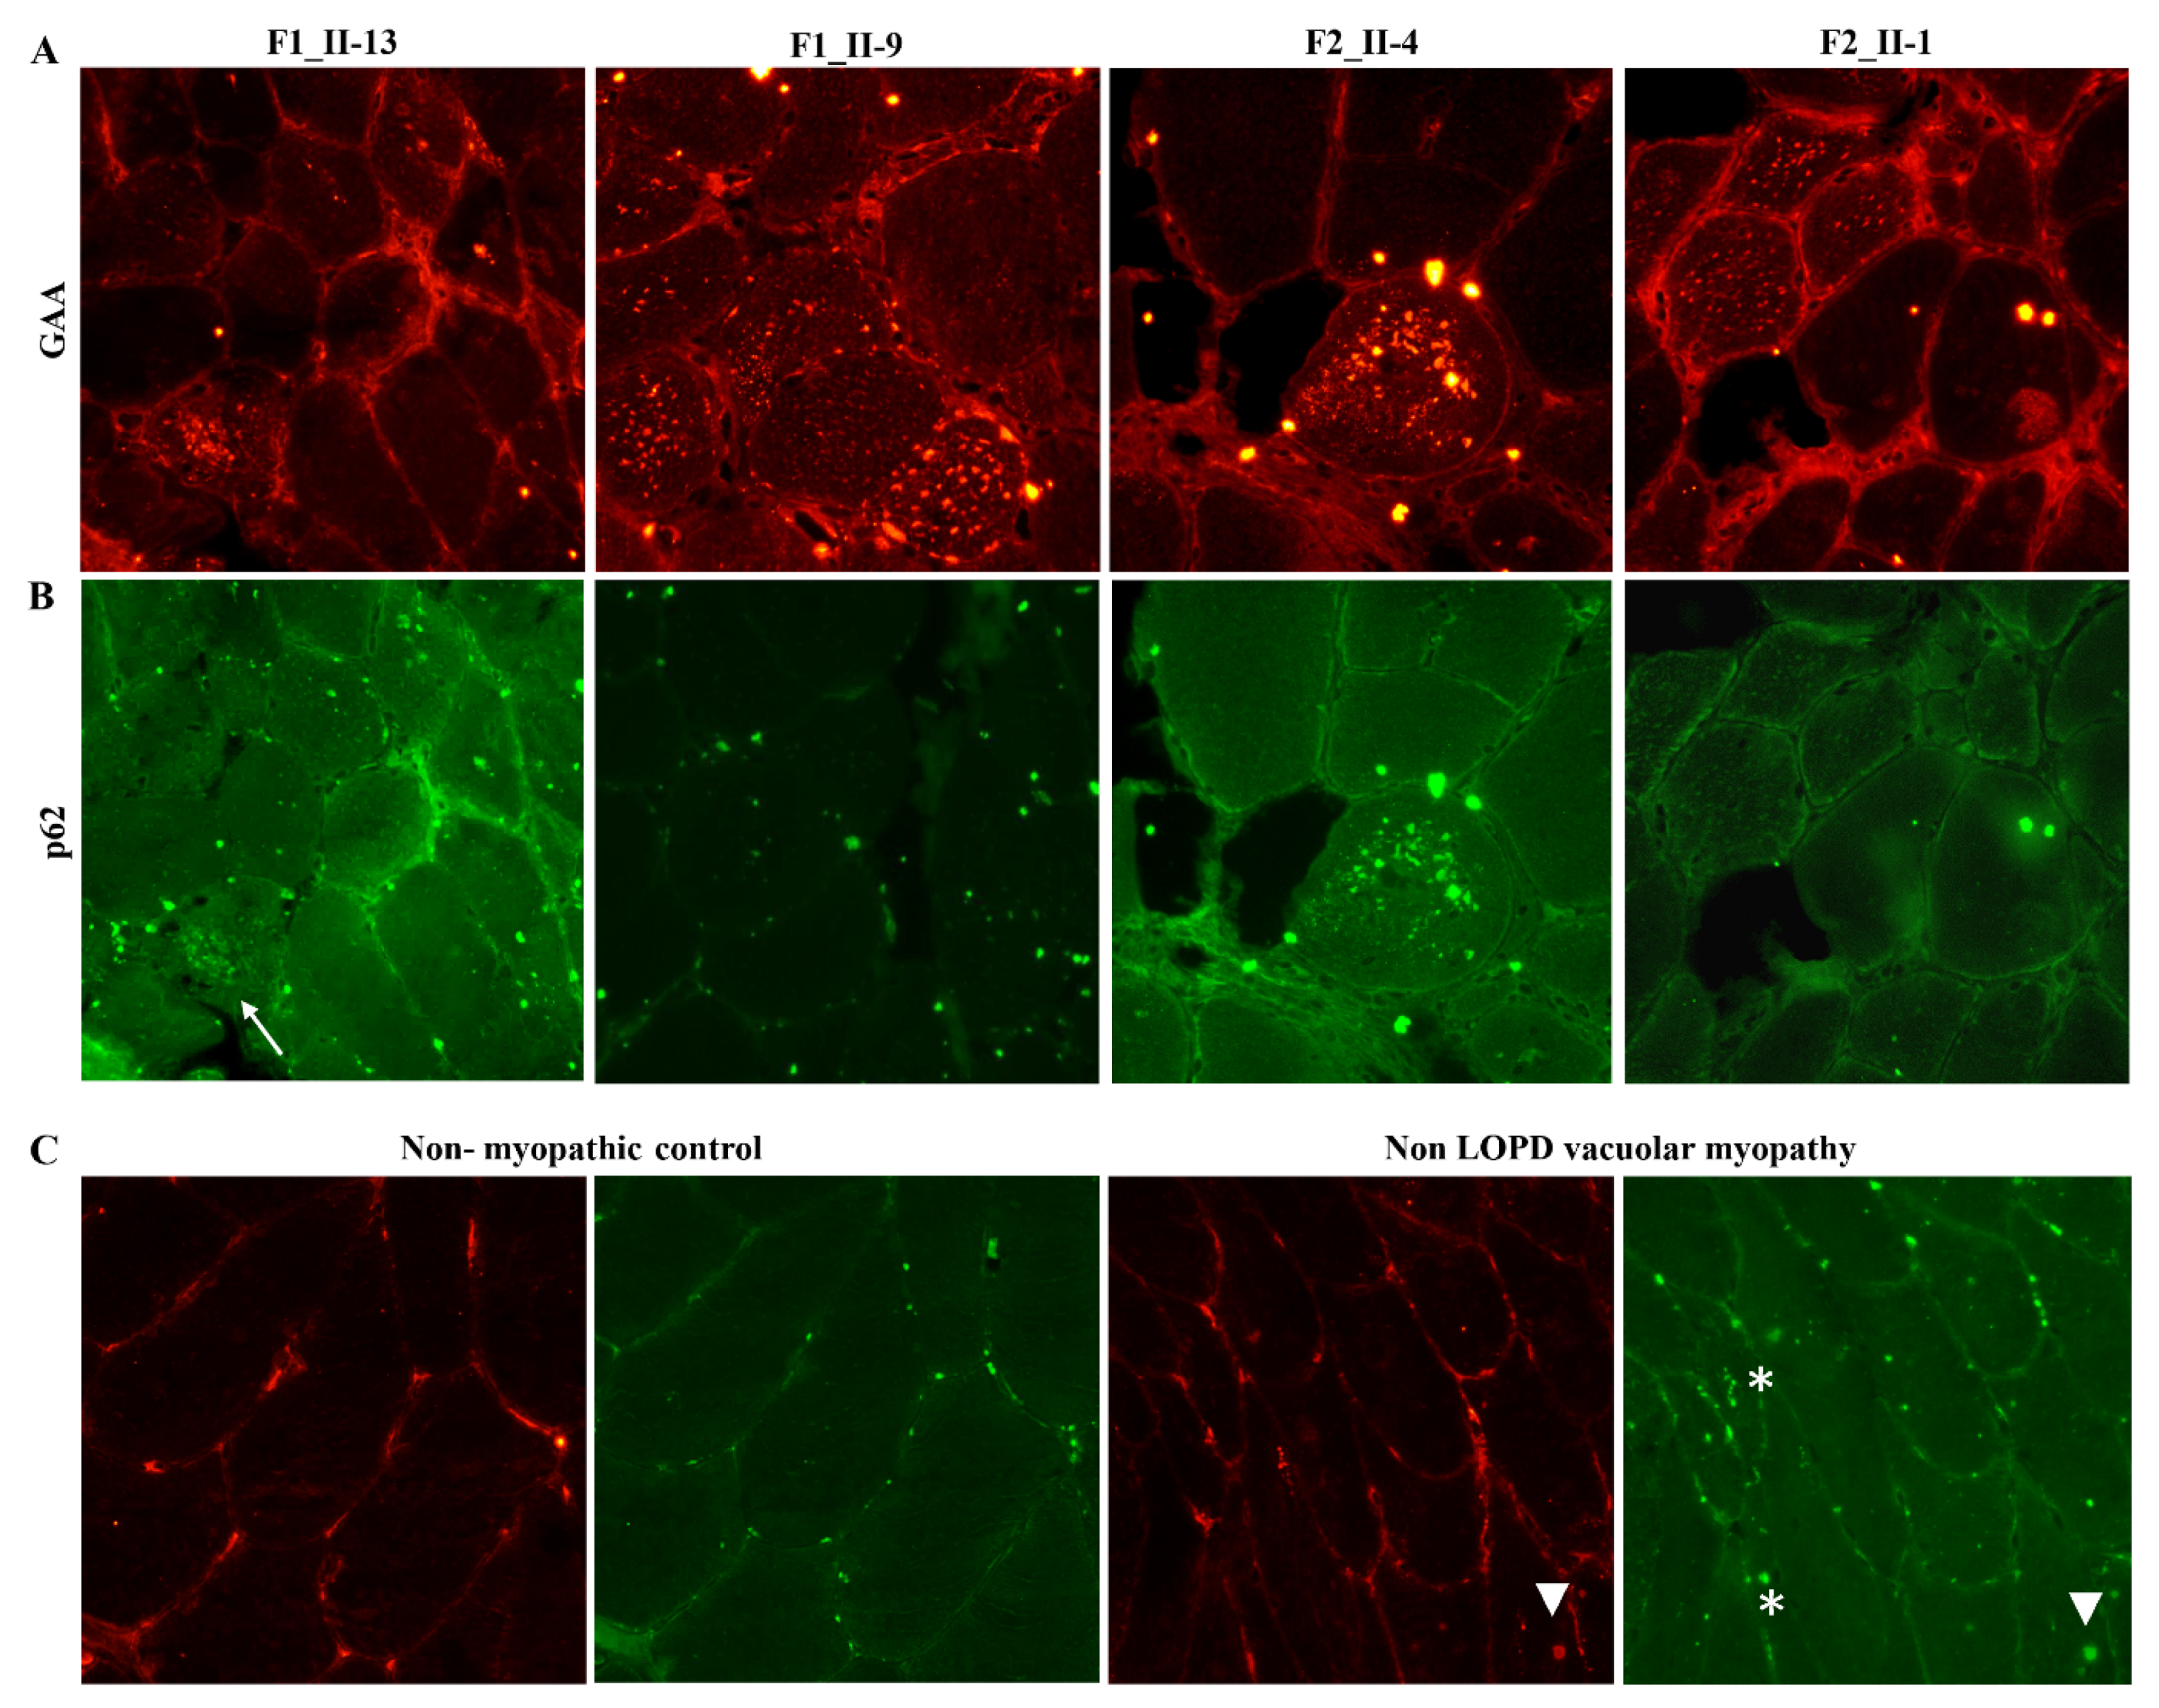
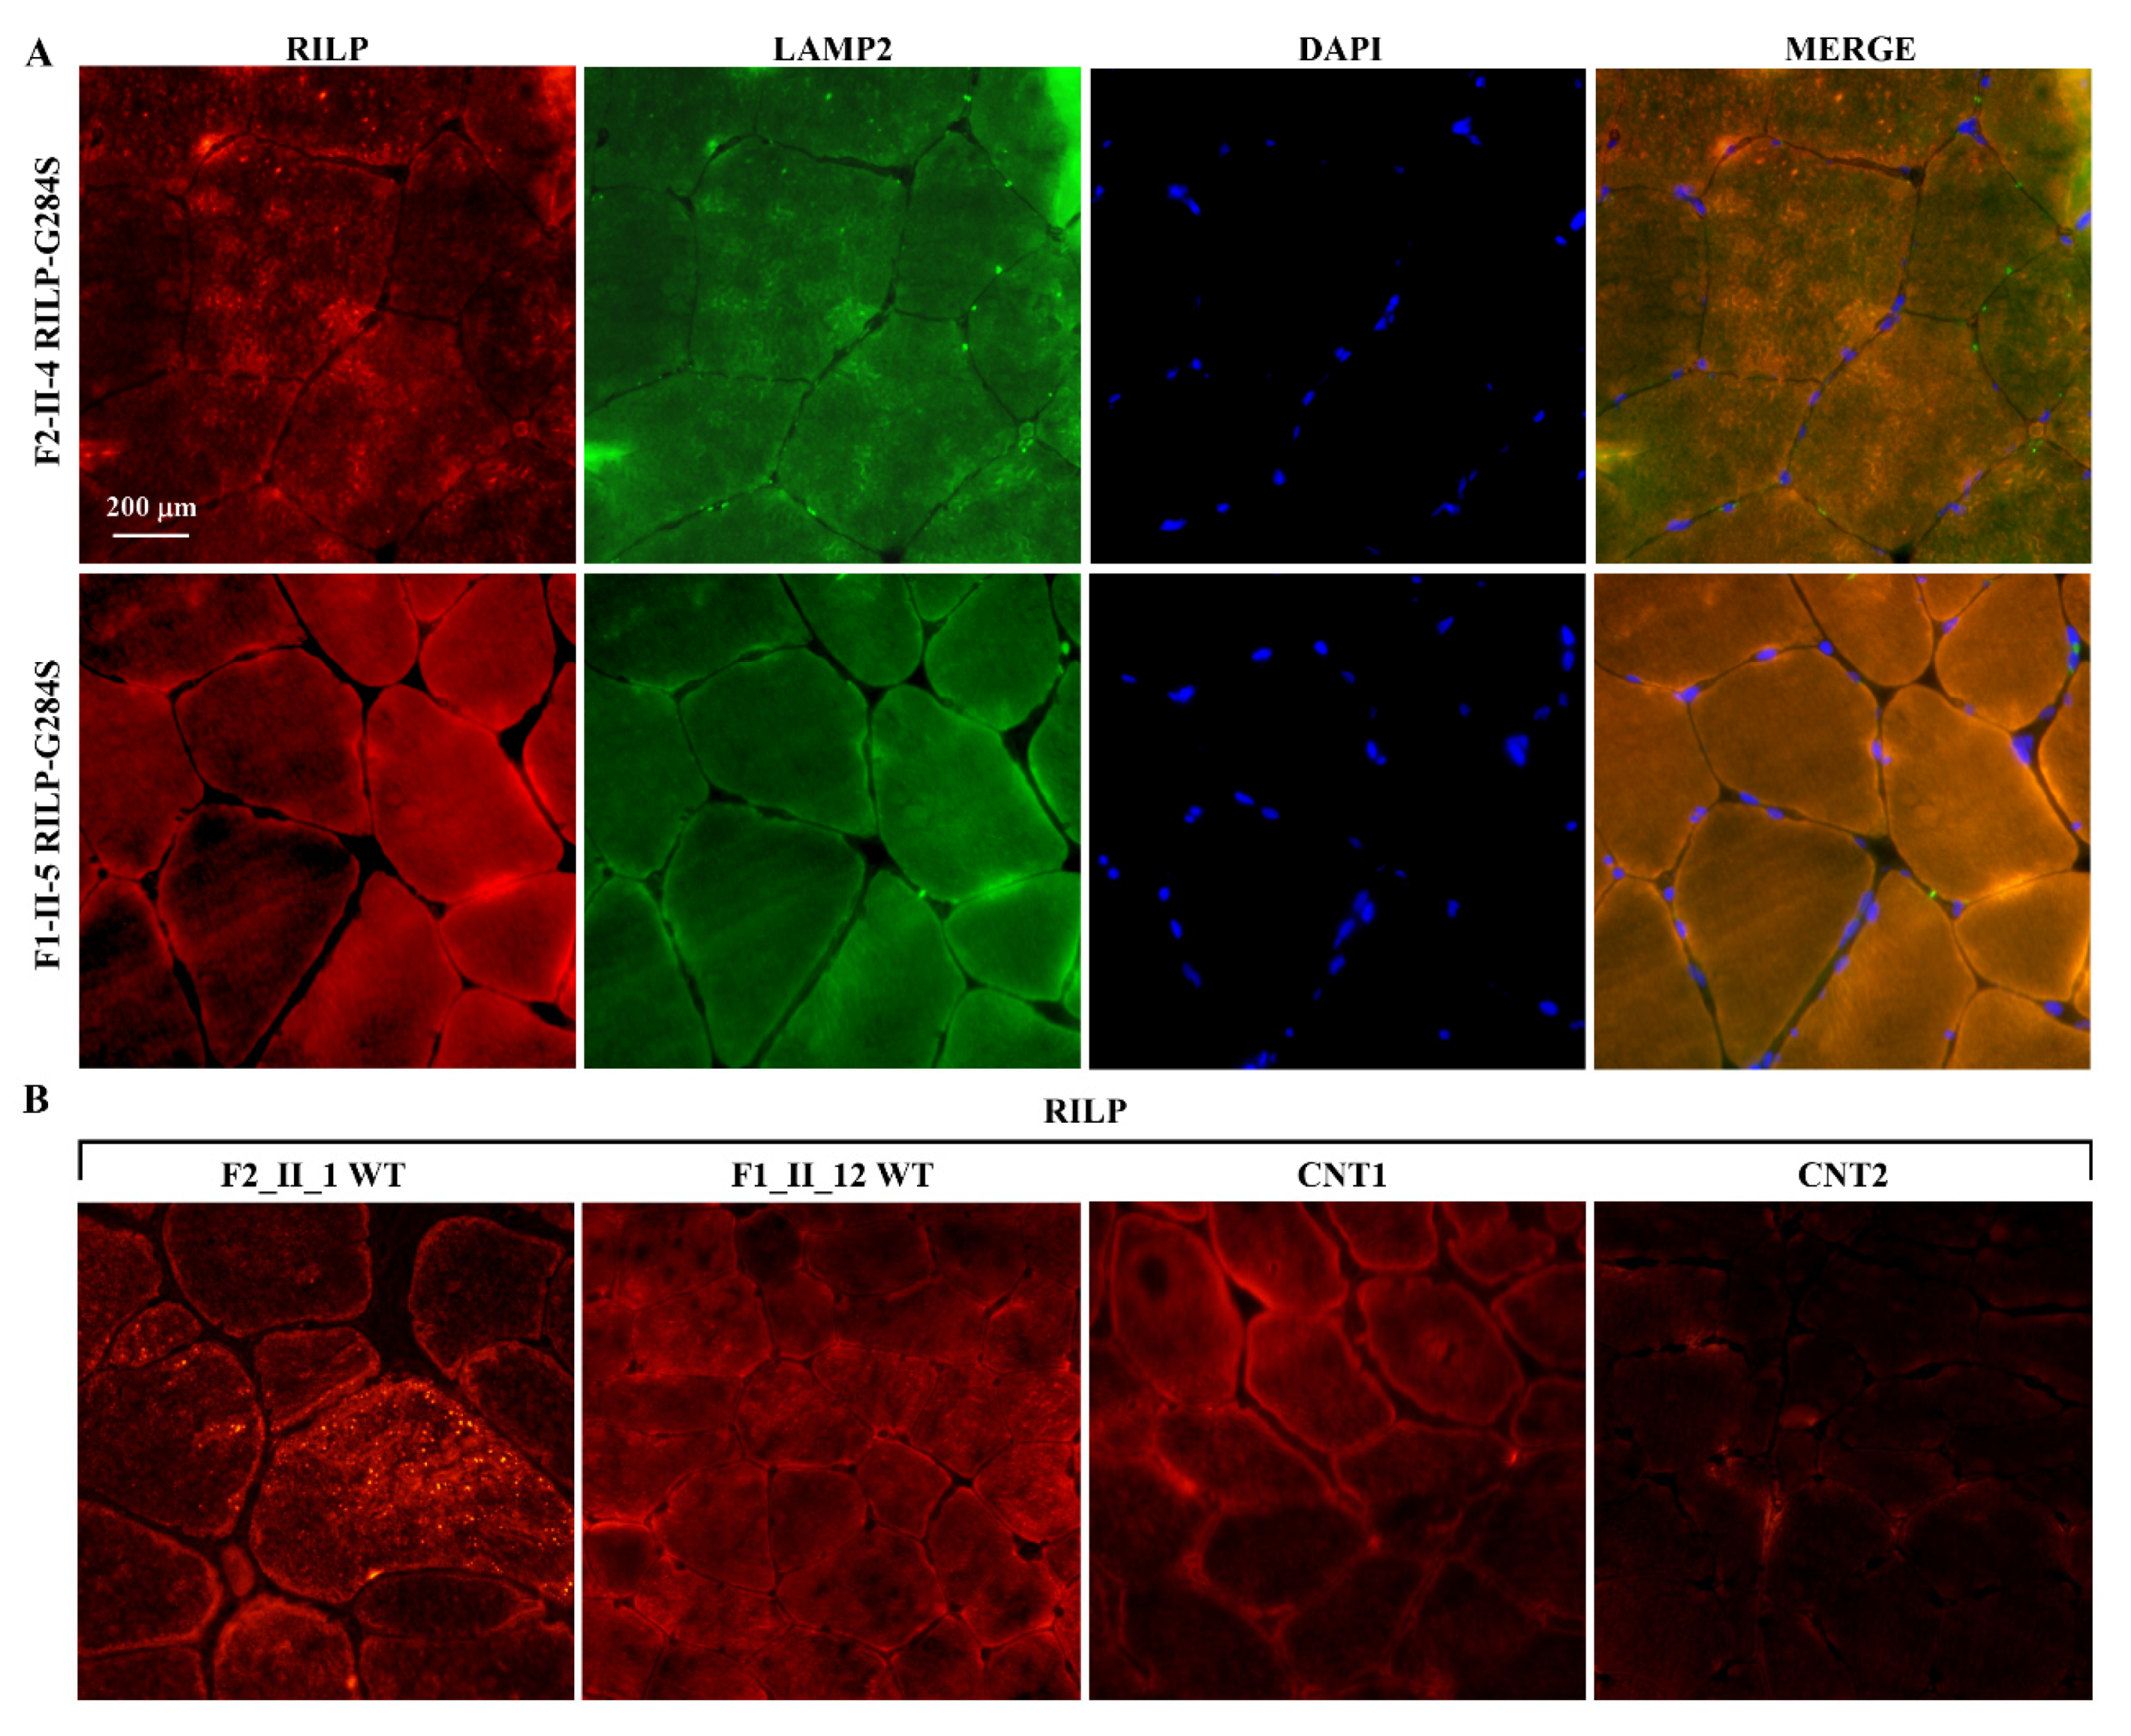
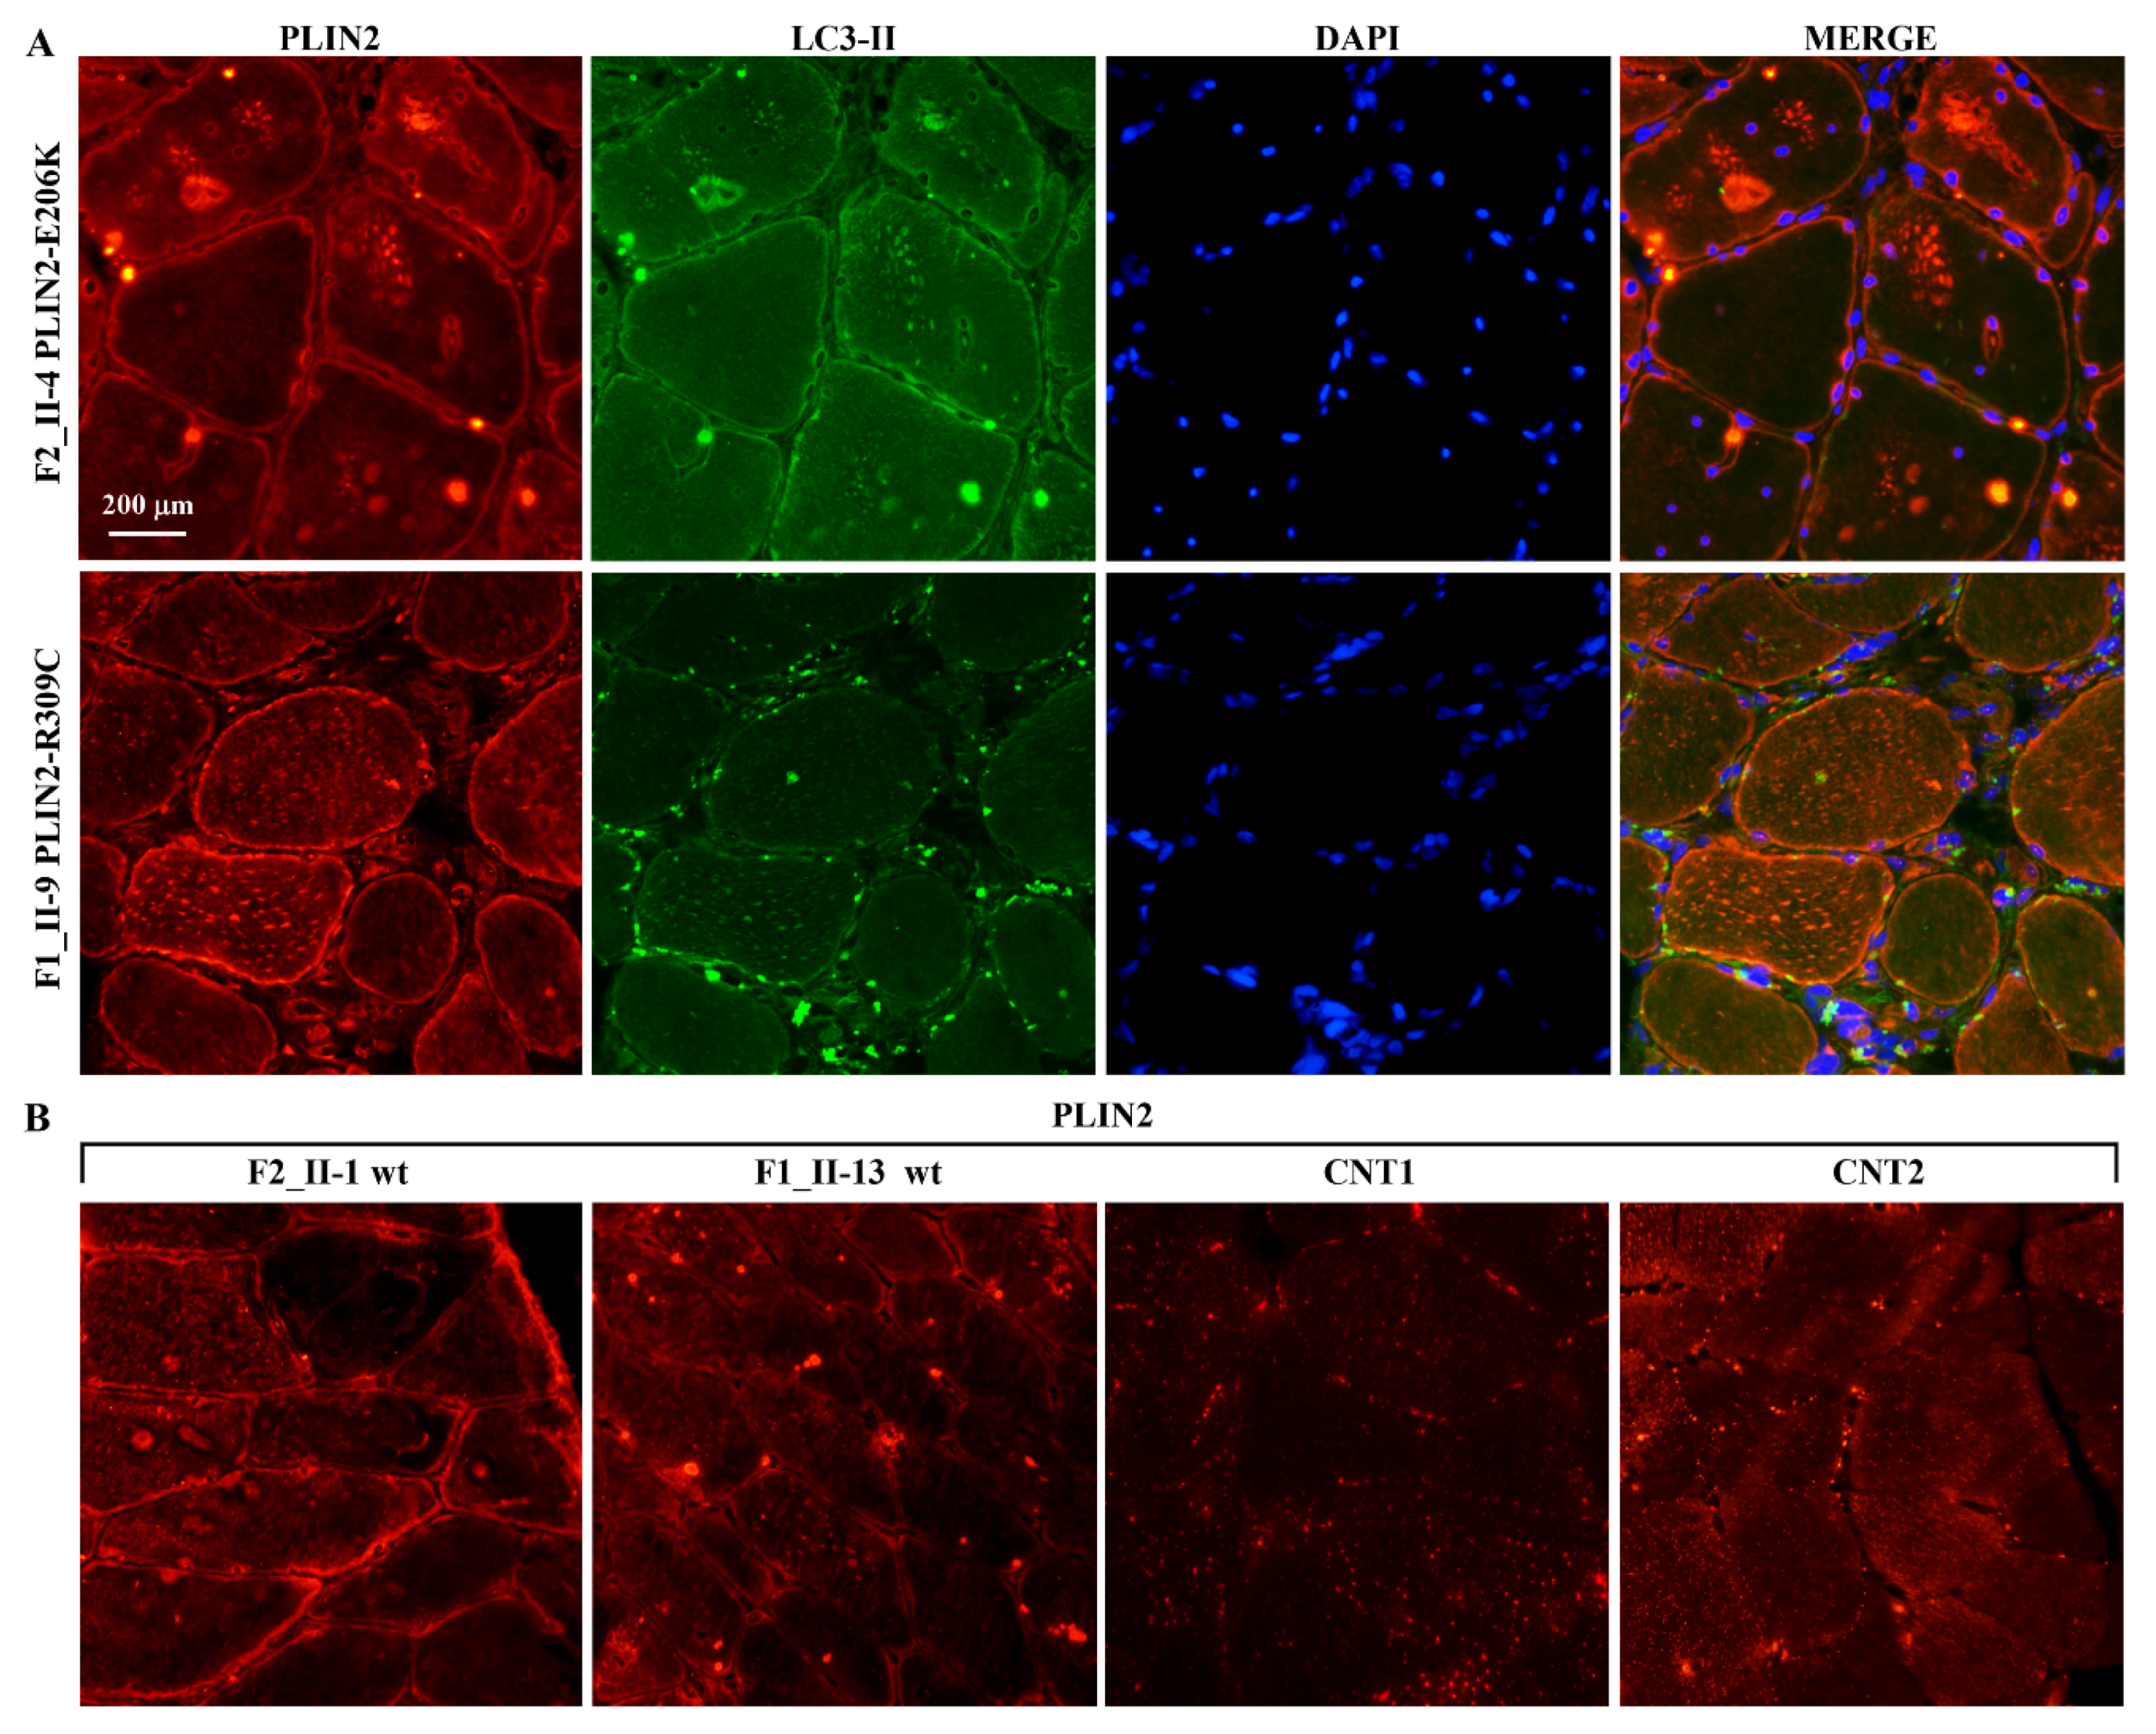
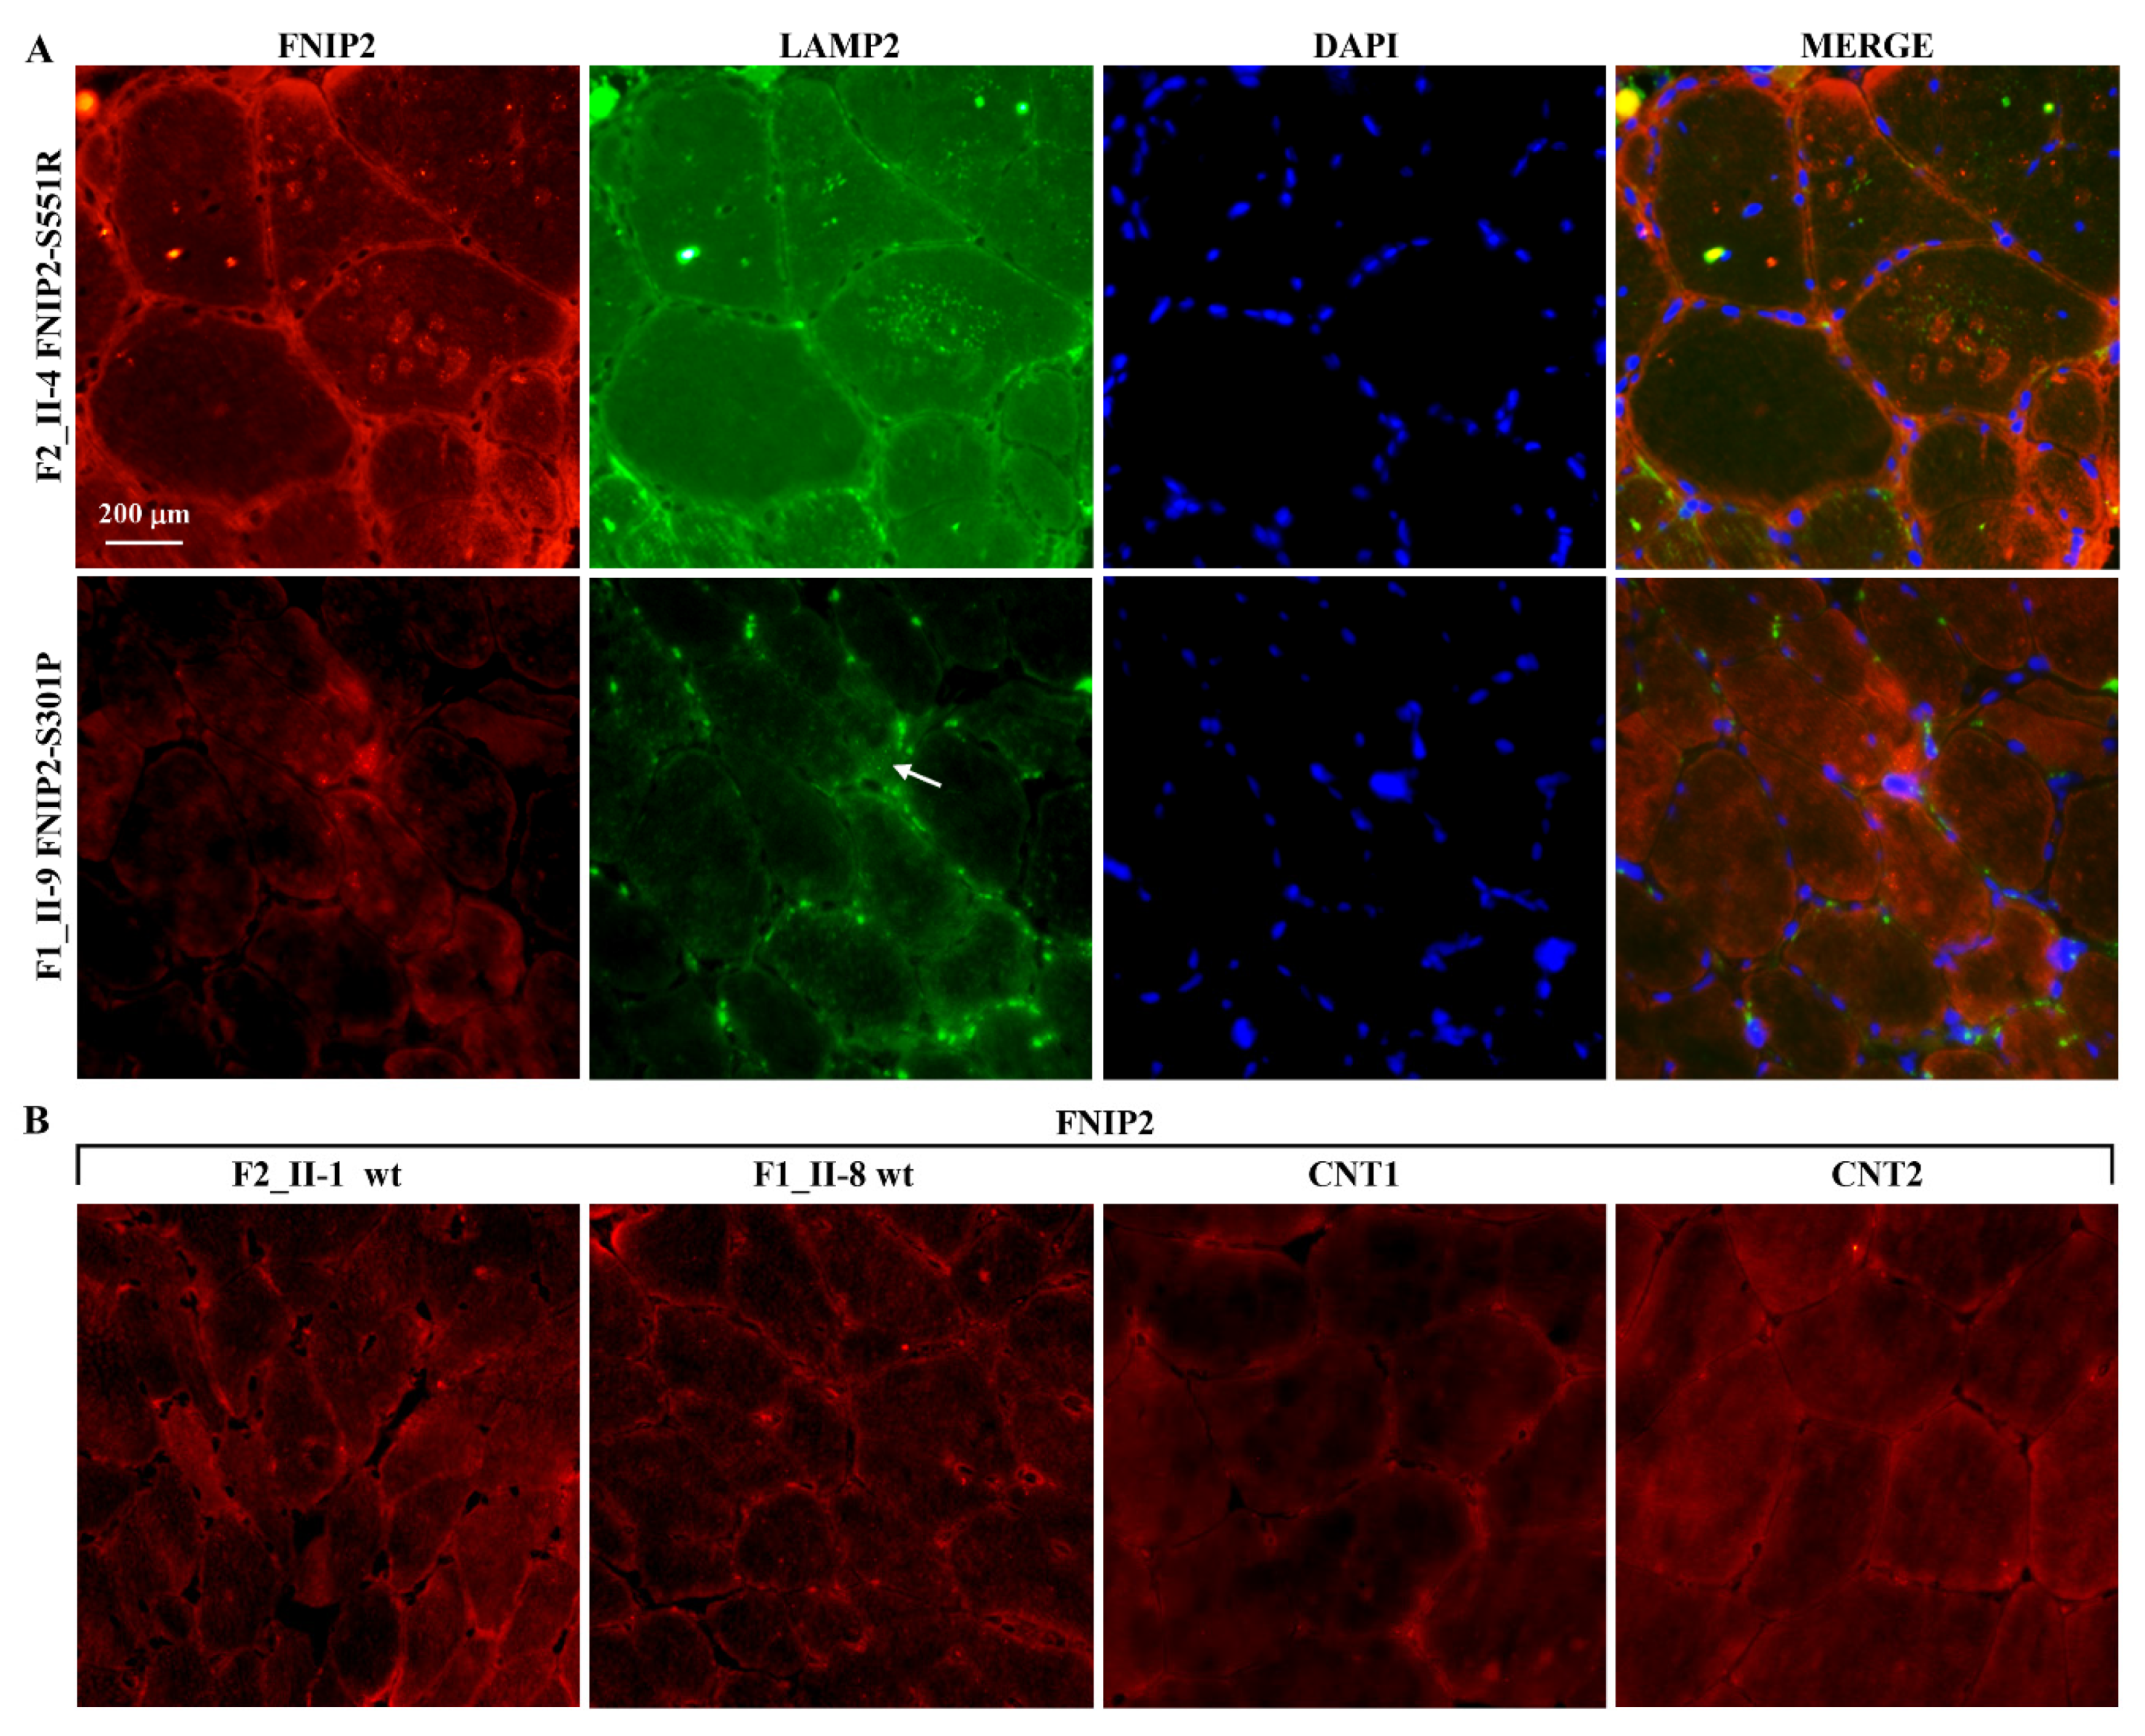
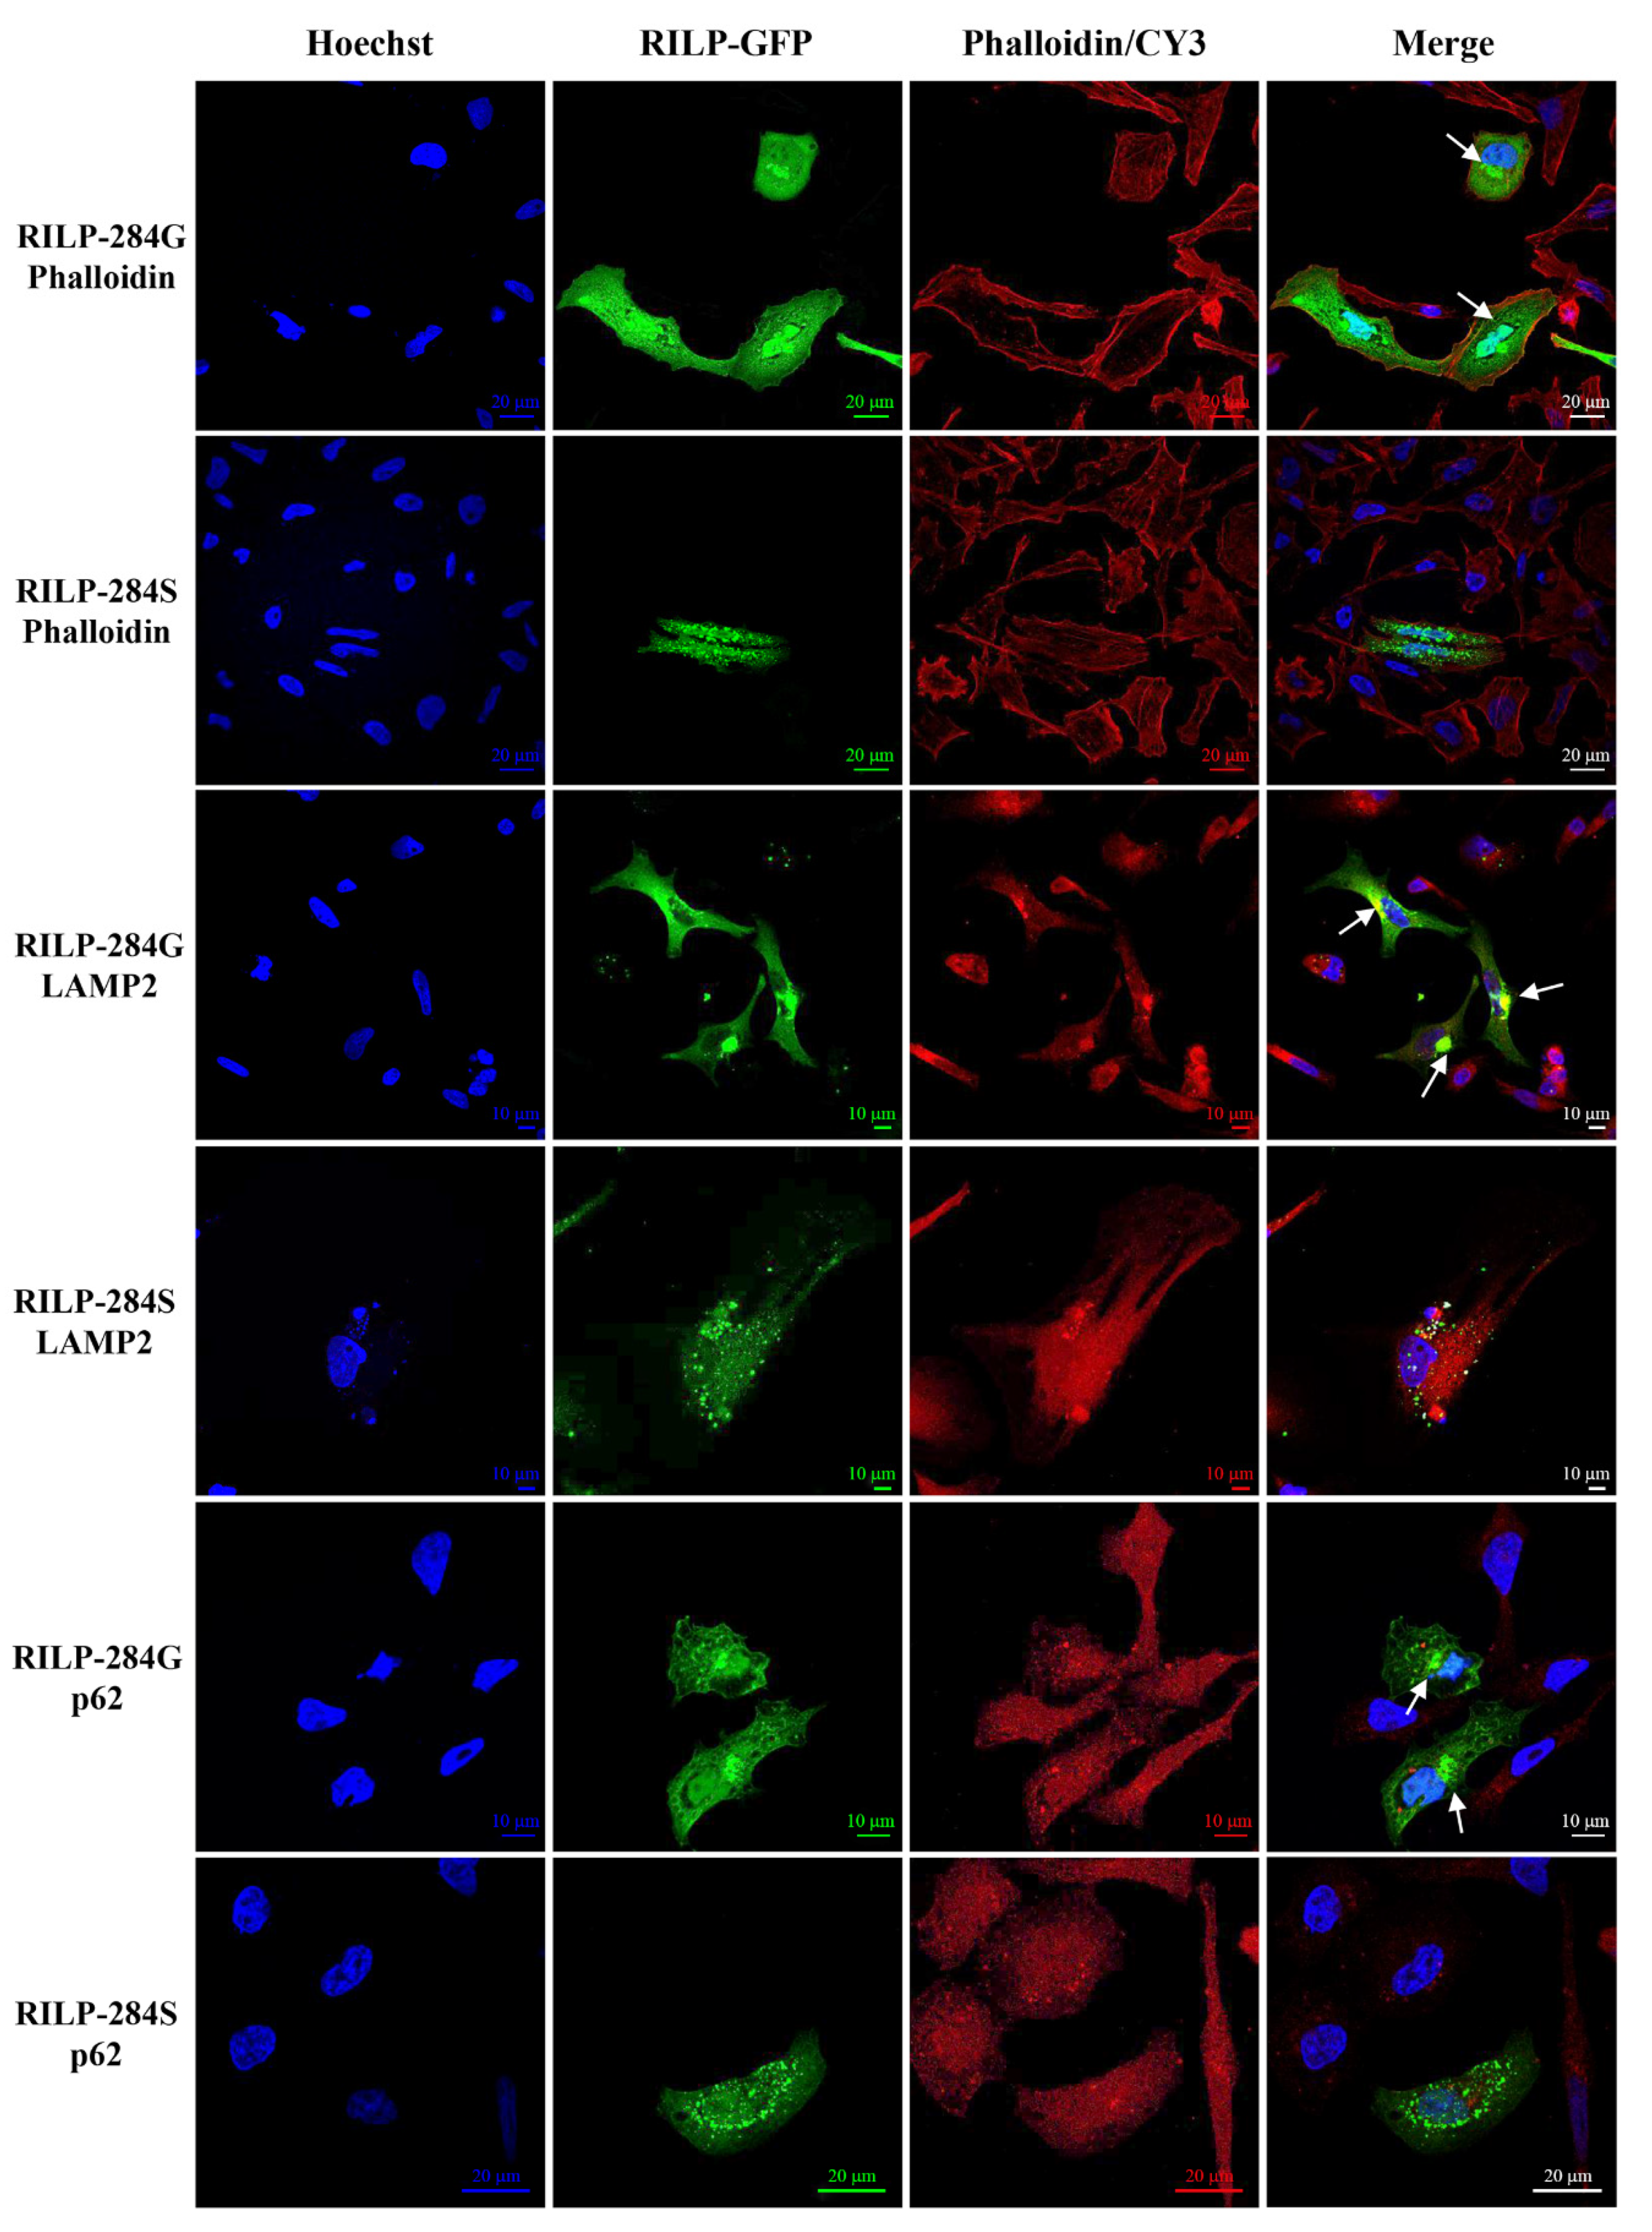
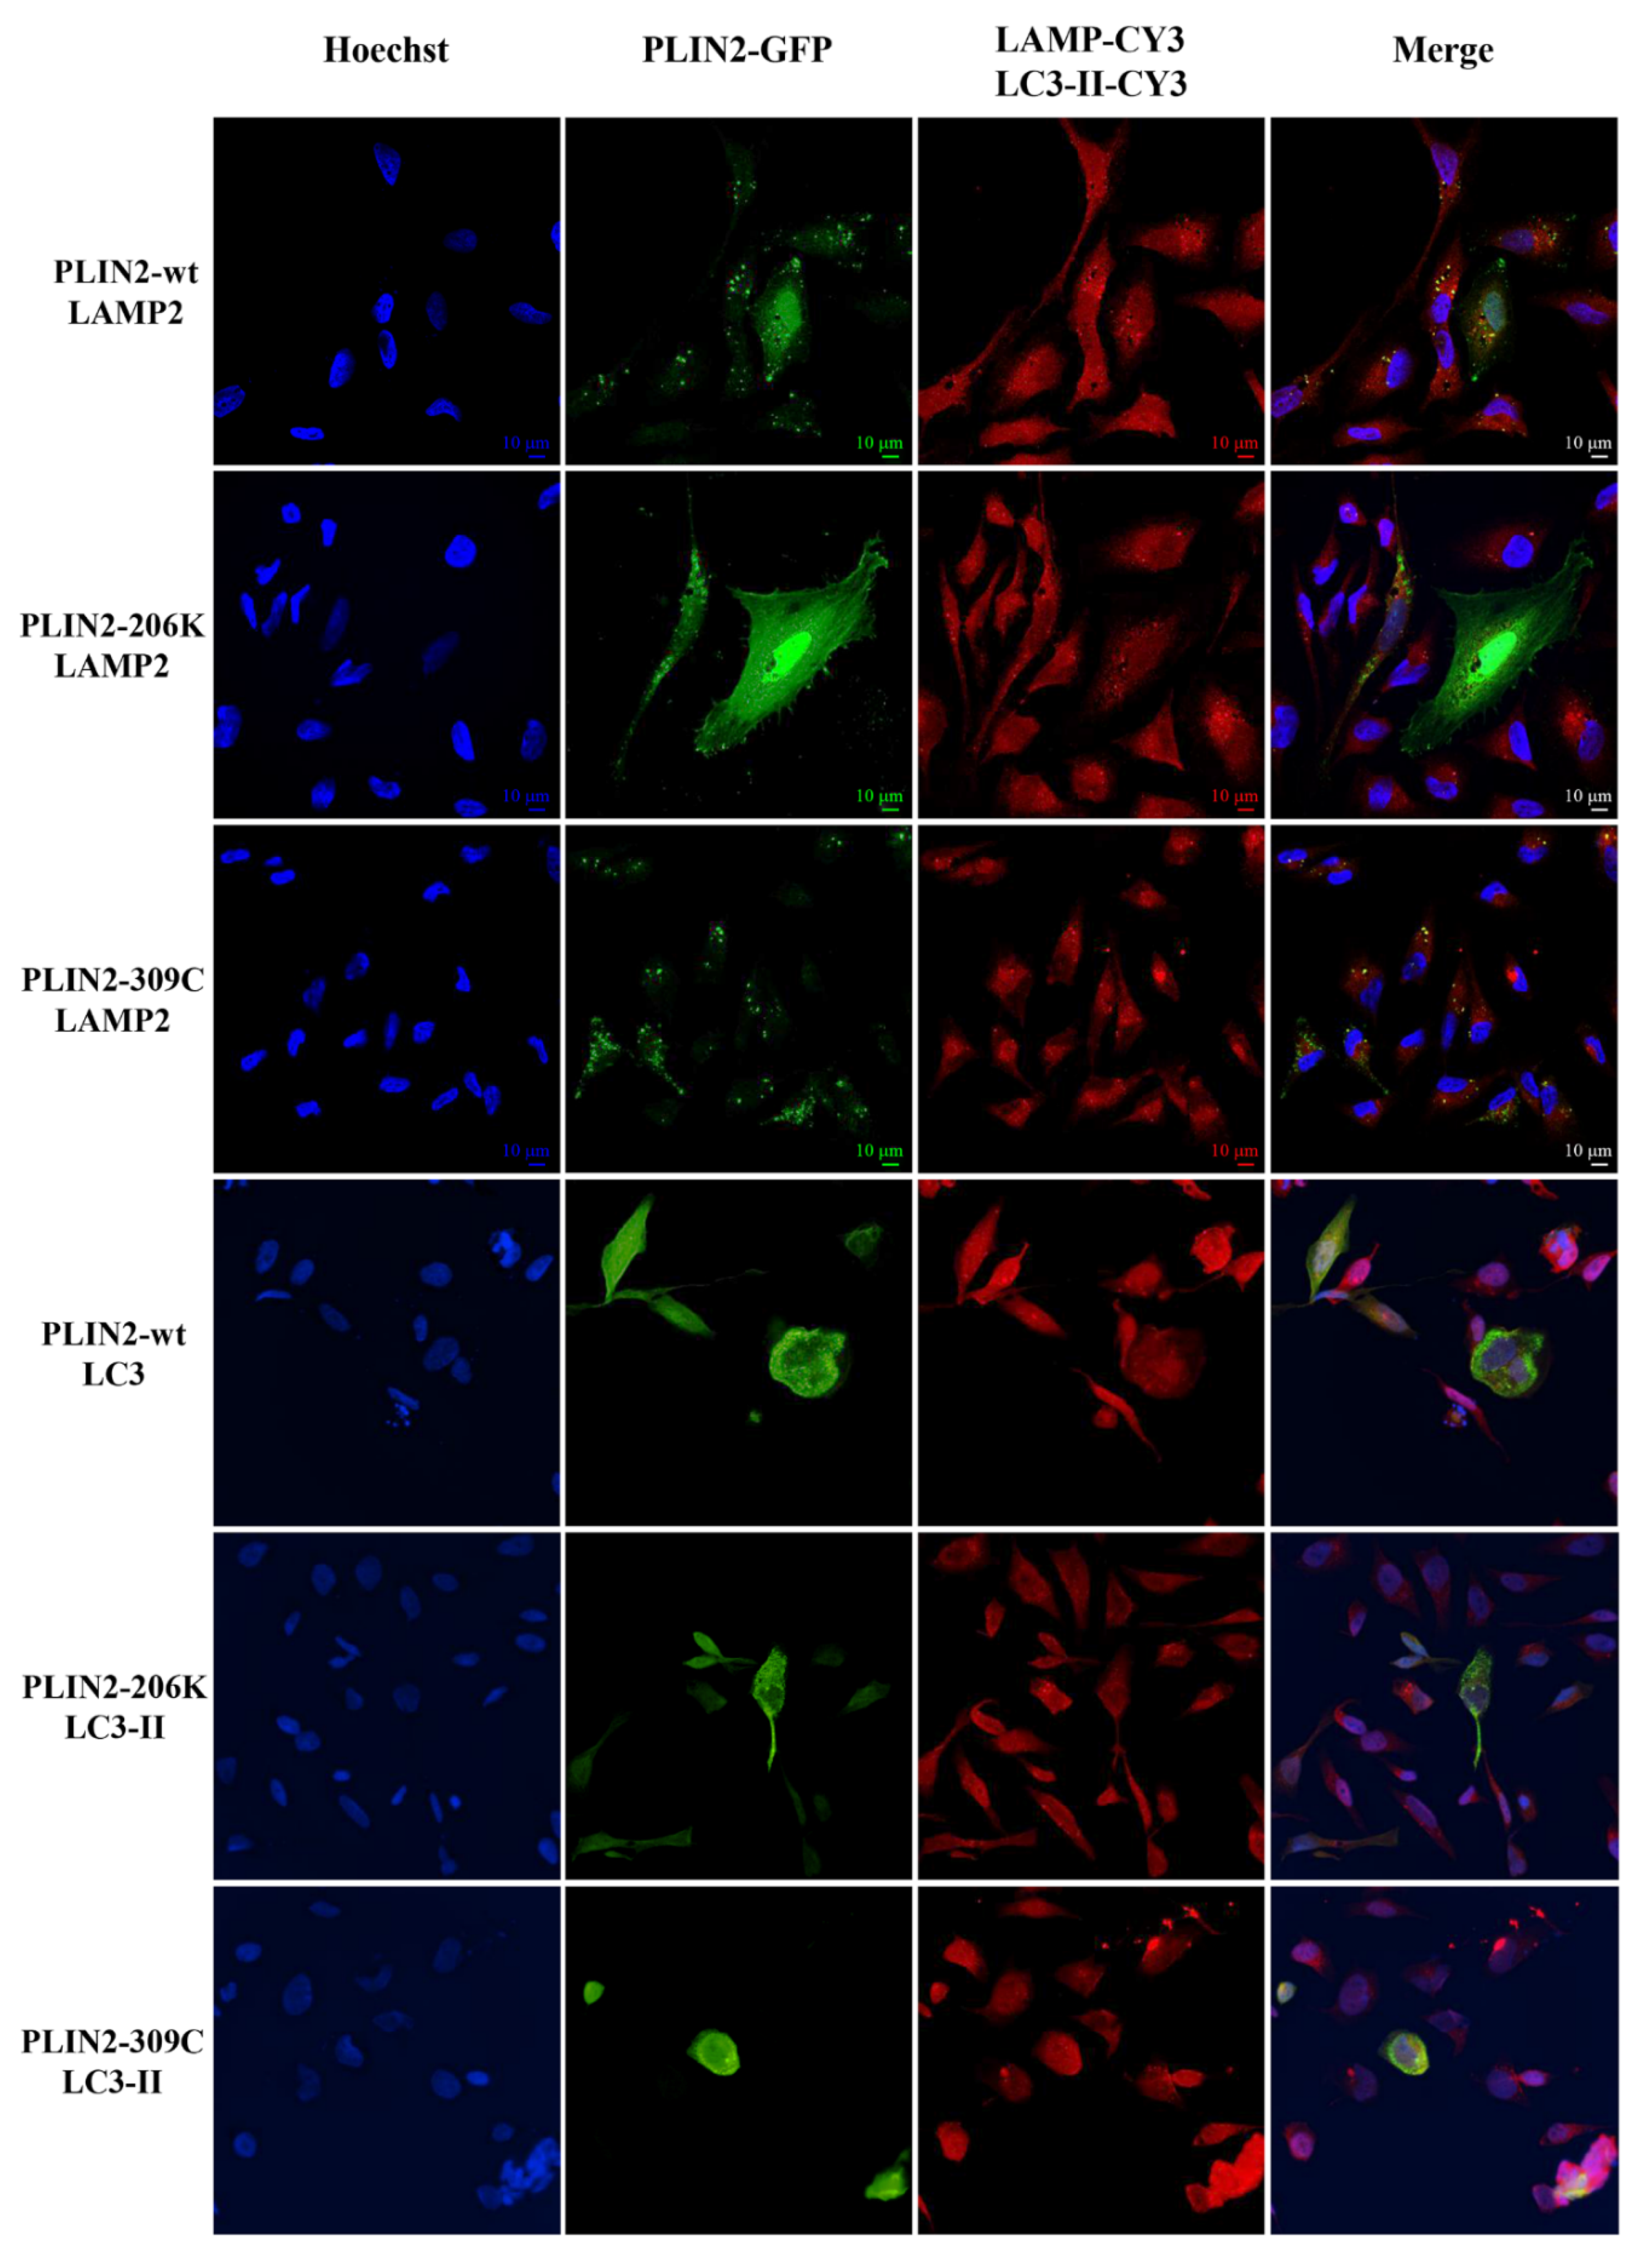
2.4. Expression Studies

The immunofluorescence study on muscle biopsies showed that the GAA protein defined the profile of the muscle fibres and, in some of them, marked small sarcoplasmic spots, some of which were also p62 positive (Figure 6). p62, also known as Sequestosome 1 (SQSTM1), is involved in autophagy-dependent elimination of ubiquitinated proteins, and autophagy inhibition leads to the accumulation of p62-positive aggregates. RILP was expressed in the subsarcolemmal spots and at the level of the sarcoplasmic micro vacuoles in both RILP mutated and non-mutated biopsies of LOPD patients; however, the reaction appeared less intense in mutated tissues. In healthy subjects (CNT1), a faint subsarcolemmal continuous signal was observed in the majority of fibres, while CNT2 showed almost no fluorescent signal (Figure 7). The PLIN2 signal was intense and continuous at sarcolemma in mutated and wild type muscle fibres, while it appeared faint and discontinuous in external controls (CNT1, CNT2). PLIN2-positive sarcoplasmic macro and micro vacuoles were also evident in the mutated muscle, while in both the wild type and external control tissues smaller and scattered sarcoplasmic PLIN2-positive spots were seen (Figure 8).
The FNIP2 reaction intensely labelled the vacuoles and micro vacuoles that also expressed the lysosome marker LAMP2 in the mutated biopsies. In the wild type as well as in external control tissues, the FNIP2 reaction marked weakly and diffusely the sarcolemma and the sarcoplasm of some fibres (Figure 9).
The c.G850A (p.G284S) variant in RILP was associated with the most severe SI score in the two families. IF analysis in HeLa cells showed that the RILP284G protein accumulated near the nucleus (a strong signal intensity was observed) and co-localized with the LAMP2 antibody, suggesting lysosome and autophagosome localization. In contrast, a low signal intensity was observed for the RILP284S protein variant, associated with the SI score > 20, which was spread all over the cytoplasm and did not show a complete co-localization with LAMP2 and p62 antibodies (Figure 10). These data suggest that this variant might perturb the binding of the protein to lysosomes.
The localization of the RILP wt is indicated by intense green spots localized near the nucleus. The LAMP2/CY3 reaction was quite superimposable to that of RILP. The RILP mutated protein is visualized as less intense green spots spread all over the cytoplasm. An incomplete co-localization with LAMP2 and p62 is highlighted.
In HeLa cells, the PLIN2 wt and mutated proteins (PLIN2206K and PLIN2309C) localized in the peripheral spots. The PLIN2 wt and PLIN2206K proteins also localized in the nucleus with different intensity (Figure 11).
In summary, we discovered a complex genetic background characterized by a set of rare variants in different genes worthy of future studies to confirm their role in the severity of the LOPD etiopathogenesis. These data highlights that the complexity of the LOPD phenotype is associated to a polygenic inheritance.

3. Discussion

Precision medicine is an emerging concept that stratifies the patients and their diseases by taking into account a wide array of individual data, including clinical and instrumental information, lifestyle, genetic background and individual drug responsiveness.
In the present study, we described two LOPD families from South Italy manifesting with a complex spectrum of disease symptoms, determining their clinical heterogeneity also within the same family.
The most frequent complaints were related to reduced muscle strength and fatigability, but some patients had to cope with respiratory insufficiency. These symptoms are usually the major contributors in developing severe complications during the disease course [30]. In this study, we generated a severity index score based on phenotypic manifestation of the disease and confirmed that impairment of motor capacity, assessed by GSCG scale as well as FVC and Δ-FVC values at baseline, were associated with a worse clinical outcome. Previous studies demonstrated that secondary factors might substantially influence the clinical course of the disease in LOPD patients, even if they carried the same GAA mutation [10]. In our cohort, alteration of bone metabolism, including vitamin D levels and BMD T-score of the femoral neck, showed a significant relationship with a higher value SI score. These results were supported by the evidence that low BMD is a frequent finding in patients with LOPD and may be causally related to decrease proximal muscle strength [21]. The essential role of vitamin D in muscle development and repair is well known, and the latest investigations demonstrated a genetic contribution of vitamin D to muscle functioning [31]. To our best knowledge, this is the first study demonstrating a significant association between low serum levels of Vitamin D and worse phenotype of LOPD patients.
We performed WES analysis of the affected siblings and identified 16 deleterious variants in 12 genes RILP, FNIP2, TRAPPC11, PLIN2, IRS1, KL, LRP4, RUNX1, FAM26F, TRPV5, TRPV6, and DCHS1. These genes are involved in interconnected pathways, including autophagy/lysosome, immunity, bone metabolism and skeletal muscle disease-related genes, suggesting that rare deleterious variants in these genes or more generally alterations of these pathways might act to worsen the LOPD phenotype.
Autophagy is a dynamic cellular process associated with the pathogenesis of a wide range of human disorders, including LOPD [32,33]. This implies that the deleterious variants in autophagy-related genes may affect disease onset and progression [33]. Recently, it has been suggested that any mutation affecting the autophagosome–lysosome machinery reduces GAA activity as a consequence of the down regulation of GAA synthesis and maturation [34,35]. This implies that the concurrence in each patient of variants in two or more genes acting in various steps of the autophagy–lysosomal pathway might explain differences in the clinical expressivity of the GAA mutations. Remarkably, in this study, we identified five LOPD patients (F1-II4, F1-II5, F1-II9, F2-II4 and F2-II5) showing the highest severity index score, deleterious variants affecting important domains of RILP and FNIP2 proteins involved in lysosome cellular positioning and autophagy [36].
Rab interacting lysosomal protein (RILP) is a 45 kDa lysosomal protein that acts as a downstream effector of Rab7 in phago-lysosome formation and in the transport of the endocytic cargo to the lysosome [37]. Active Rab7 on the phagosomal membrane recruits RILP, which in turn promotes a dynein–dynactin association with the phagosomes, mediating their retrograde moving towards the microtubule-organizing centre (MTOC), where late endosomes and/or lysosomes were clustered [37,38]. Remarkably, the c.G850A (p.G284S) variant, identified in both families investigated in this study, lays into the Rab binding domain and alters a highly conserved residue of the protein, suggesting that this change might disturb the formation of the RILP–Rab complex. These bioinformatics predictions were supported by a different pattern of expression and localization observed in skeletal muscle of the patients carrying the mutated allele and in HeLa cells. The RILP-284S protein was not efficiently recruited at autophagosome–lysosome and remains spread all over the cytoplasm, suggesting a perturbation of the autophagic flux.
Moreover, during nutrient insufficiency, the FLCN–FNIP complex modulates the formation of a FLCN–RILP–Rab complex for promoting the clustering of lysosomes around the nucleus [36].
Folliculin interacting proteins 2 (FNIP2) plays a crucial role in the regulation of the autophagic flux by modulating the formation of the FLCN–GABARAP complex [39]. Moreover, FLCN and FNIP proteins each contain both a longin and a differentially expressed in normal versus neoplastic cells (DENN) domain [40], which are implicated in the regulation of small GTPases and membrane trafficking. In fact, the FLCN–FNIP complex regulates both the Rag and Rab GTPase families [41,42], which in turn modulate the key mTORC1 signalling pathway and lysosomal distribution, respectively, in a manner dependent on amino acid availability [36]. Noteworthy, the two rare and deleterious variants identified in the two LOPD families alter the longin and DENN domains of the protein, suggesting that they might disturb the formation of this complex.
Taken together these evidences lead to hypothesize that alteration of the genes involved in lysosome positioning and autophagy might influence lysosome metabolism, worsening the effect of the GAA mutations in the two investigated families.
Separate consideration needs to be given to patient II-5 of family 2, who manifested the most severe phenotype observed in our cohort of patients, characterized by severe muscle and pulmonary impairments (6MWT = 10, GSCG = 26, FVC = 36% and vacuolated muscle fibres = 15%). Remarkably, this patient inherited, together with the two mutations in GAA gene and the two rare and deleterious variants in the RILP and FNIP2 genes, two compound heterozygous variants c.A1501C (p.N501H) and c.T5165A (p.L1722H), in the low-density lipoprotein receptor-related protein-4 (LRP4) gene. LPR4 is a major mediator of postsynaptic stability at the neuromuscular junction, a region critical for control of muscle contraction [43,44]. Recessive mutations in this gene are linked to congenital myasthenic syndrome (CMS17), a severe neuromuscular disorder associated to respiratory failure [43]. Respiratory related symptoms (dyspnoea on effort, reduced physical capacity and recurrent infections) and respiratory failure are often evident in the later stages of LOPD [45]. The two rare and deleterious LRP4 variants identified only in this patient alter the highly conserved residues laying in important domains of the protein (Figure 4). In this context, we hypothesize that these variants, although reported as likely benign in the Global Variome shared LOVD database (https://databases.lovd.nl/shared/genes (accessed on 5 March 2021)), might have worsened the entire clinical picture of this patient. Moreover, she also shares with her brother II-4 a rare deleterious variant in TRAPPC11, whose mutations cause limb girdle muscular dystrophy 2S (LGMD2S), congenital muscular dystrophy (CMD) and dystroglycanopathy. Interestingly, this gene has a role upstream of autophagosome formation, by recruiting the ATG2B-WIPI4/WDR45 complex to pre-autophagosomal membranes, suggesting that the TRAPPC11 variants might also perturb autophagy flux [46,47].
Two rare and deleterious variants disturbing the lipid-binding domain of the PLIN2 gene segregated with obesity in the two families. PLIN2 encodes the most abundant lipid droplet (LD)-associated protein in non-adipose tissue, and its expression correlates with intracellular lipid accumulation [48,49]. Recent studies reported that mutations in PLIN2 affect lipolysis and are associated with reduced plasma triglyceride levels in humans [48], as well as with reduced insulin secretion and increased insulin sensitivity in obese Italian subjects [50]. Moreover, lipids in LDs were reportedly required for the induction of autophagy in yeast and served as the substrate of autophagosomes [51]. This aspect leads to the hypothesis of a link between obesity and autophagy impairment in LOPD patients. Here, we have demonstrated that RILP, FNIP2 and PLIN2 proteins localized at the sarcolemmal or sarcoplasmic level, with the same localization of markers of the autophagic-lysosomal system (LC3, LAMP2). Differences in the pattern of distribution in mutated versus wild type biopsies and even more of these versus external controls were evident. In particular, the different protein distribution between LOPD patients and the external control affected by vacuolar myopathy not linked to GAA mutations is very interesting.
Recent studies reported that bone involvement is a common finding in Pompe disease, particularly in wheel-chair users, primarily characterized by low BMD and scoliosis. LOPD patients have a high risk of fragility fractures, chronic immobilization and muscle weakness and BMD reduction, particularly at the femoral neck, seems to be related to lower mechanical loading resulting from structural and functional impairment of the primary muscles involved in walking, such as hip flexors and knee extensors muscles [21,52]. Vitamin D plays a key role in the bone–muscle crosstalk [53]. In this context, its effects consist mainly of the maintenance of intracellular Ca2 + homeostasis that is of crucial importance for muscle contraction and bone metabolism. In the present work, deleterious variants in IRS1, KL, RUNX1, TRPV5 and TRPV6 genes, involved in bone and mineral metabolism, were identified in family 1 [54,55,56,57,58,59,60,61,62,63,64,65,66].
In this context, we hypothesize that the load of polygenic rare and deleterious variants in genes closely related to the Ca2+ level and bone metabolism together with a perturbed autophagy, which plays an important role in bone remodelling, might explain the different spectrum of bone compromising in the family members.
Since 2006, ERT has been available for Pompe disease. ERT improved survival and motor function, normalized left ventricular cardiac hypertrophy and stabilized respiratory capacity [67]. However, such a treatment has brought to light the role of the immune response in abrogating the efficacy of the rhGAA treatment. Several patients are also cross-reactive immunological material negative (CRIM-) and develop high titre immune responses to ERT with rhGAA [68]. Thus, optimization of treatment for such patients includes development and utilization of strategies to prevent or eliminate immune responses, including modulating the immune system (prophylactic and therapeutic immune tolerance induction regimens) and engineering the enzyme to be less immunogenic and more effective.
In this study, we identified a deleterious variant in the FAM26F gene in the patient II-5 who manifested immuno-intolerance to rhGAA. In silico analysis showed that the splicing variant c.525 + 2T > G disrupted the donor splicing site of intron 2, producing a predicted truncated protein of 224 amino acids lacking the fourth transmembrane domain and of the cytosolic C-terminal tail of the protein [69]. The family with sequence similarity 26, member F (FAM26F), is a recently identified tetraspanin-like membrane glycoprotein involved in various immune modulating responses, including homophilic interactions and potential synapses between several immune cells, including CD4+, CD8+, NK, dendritic cells and macrophages. Several studies have demonstrated that FAM26F is highly crucial in determining/dictating the immune response of an individual, also in diseased conditions [70]. The ImmuNet bioinformatics tool predicts a high relationship confidence with the C1S gene that codifies a major constituent of the human complement subcomponent C1.
We hypothesize that this variant might affect the expression of the FAM26F protein, thus representing a good candidate to explain the adverse reaction to ERT associated with the C1 protein inhibitor in patient II-5. We suggest measuring the C1 inhibitor level before ERT treatment in LOPD patients.
Moreover, we demonstrated the important role of bone metabolism, in particular of vitamin D, as a key contributor in determining a worse phenotype and severe complications, including bone fractures. More studies are needed to confirm this association. However, we suggest that vitamin D serum levels and BMD should be monitored at regular intervals, and, if necessary, vitamin D should be supplemented.

4. Materials and Methods

4.1. Patients

Patients were recruited at the Reference Centre for Neurological and Neuromuscular Rare Disease, University of Campania “Luigi Vanvitelli” (Figure 1A,B) [18].
For a better definition of the clinical heterogeneity of the LOPD patients (Table 1), we investigated 7 main functional areas divided into (1) motor function; (2) respiratory function; (3) body mass index; (4) bone metabolism; (5) immune response to ERT; (6) vascular anomalies; and (7) autophagy impairment.
All clinical data were collected at baseline, excepted for immune response to ERT, for which data were referred to a period after one year from the start of therapy. Motor function was assessed by MMT using the Medical Research Council (MRC) grading scale for different muscle groups, and the 6MWT was used to evaluate functional endurance during prolonged ambulation. The GSGC scale was performed as a measure of global motor disability. Respiratory assessment included spirometry for evaluation of FVC, considering as normal value FVC > 80% of predicted, and measurement of Δ-FVC, defined as drop of FVC from stand up to supine position (Δ-FVC > 20% is suggestive of restrictive pattern), according to the American Thoracic Society standards [20]. BMI was measured to provide an estimate of body fat in our patients. We defined a status of normal weight (19.5–24.9 kg/m2), overweight (25–29.9 kg/m2), obesity class I (30–35.9 kg/m2), obesity class II (36–40 kg/m2) and obesity class III (>40 kg/m2), according to WHO recommendation for Caucasian subjects [71]. Vitamin D serum levels (normal values: >30 ng/mL) were measured and the BMD of the lumbar-sacral tract, femoral neck and total-body (T-score normal value > −1) was evaluated by computerized bone mineralometry (MOC); both parameters were used for assessment of bone metabolism. History of bone fractures was considered. Basilar artery dolichoectasia was detected by brain MRI, and structural cardiac valvular defects were assessed by M-MODE/2D/Color-doppler cardiac ultrasound. Immunity state was determined using IgG and IgE antibodies against glucosidase alpha (anti-rhGAA); an adverse reaction to ERT was taken in account. After informed consent, muscle biopsy was obtained from all patients. Specimens from each biopsy were processed according to standard procedures for histology and biochemistry studies. Measurement of percentage of vacuolated fibres on muscle samplings, performed by optical microscopy on 3 fields at 20× on ATP pH 9.4 staining, and quantification of lymphocytes containing PAS-positive granules on blood smears [72] were carried out as indicators of impaired autophagy, together with assessment of GAA activity on DBS. All DBS were performed at the diagnostic service of Metabolic Laboratory, Centre of Diagnostics (Hamburg, Germany) by Dr. Zoltan Lukacs. The activity value of GAA was measured at pH 3.8, pH 7.0 and after specific inhibition. Normal GAA activity was considered between 1.86 and 21.9 mol/h/L. Beta-galactosidase activity was used as the internal control. Finally, venous blood samples were taken from patients for genomic DNA extraction and genetic analysis.

4.2. WES Analysis

WES was performed on 11 affected siblings (family 1: II-4, II-5, II-7, II-8, II-9, II-12, II-13; family 2: II-1, II-3, II-4, II-5). Exonic regions were enriched using the SureSelect All Exome kit V6 (Agilent Technologies, Santa Clara, CA, USA) based on DNA fragmentation and capture. Exomes were barcoded and sequenced at the Theragen Etex Bio Institute (Suwon, Korea), using the HiSeq2000 platform (Illumina, San Diego, CA, USA).
The alignment of the 100-bp paired-end reads to the human reference genome was performed by using the Burrows Wheeler Aligner (BWA) MEM, v0.7.542. After removal of duplicate reads through the Picard Mark Duplicates command (with standard options), we called the single nucleotide variants (SNVs) and insertions/deletions (indels) for all samples using HaplotypeCaller (BP_RESOULTION option) and GenotypeGVCFs in Genome Analysis Toolkit (GATK), v3.5-0-g36282e4, following the manufacturer’s best practice guidelines (available at https://software.broadinstitute.org/gatk/best-practices/ (accessed on 5 March 2021)) [73]. Variants with a Minor Allele Count (MAC) = 0, number of alternative alleles ≠2 and call rate <95% were also filtered out, as well as samples with identical-by-descent (IBD) sharing and sex mismatches, and samples with a call rate <90%. Variants passing quality control were annotated to genes (within 10 kb from transcription start/stop site) through ANNOVAR [74]. Variant annotation contained information concerning variant type, MAF in the general population and predictions of the variant’s effect on gene function. MAF was annotated in the National Heart, Lung, and Blood Institute (NHLBI) Grand Opportunity (GO) Exome Sequencing Project ESP6500si-v2 (European American and African American population) (http://evs.gs.washington.edu/EVS/ (accessed on 5 March 2021)), 1000 Genomes Project [AFR (African), AMR (Admixed American), EAS (East Asian), EUR (European), SAS (South Asian), http://www.1000genomes.org/ (accessed on 5 March 2021), Exome Aggregation Consortium (ExAC), EUR, non-Finish European population (NFE), AFR, SAS, EAS and AMR] (http://exac.broadinstitute.org/ (accessed on 5 March 2021)). SIFT (http://sift.bii.a-star.edu.sg/www/SIFT_seq_submit2.html/ (accessed on 5 March 2021)) PolyPhen2 (http://genetics.bwh.harvard.edu/pph2/ (accessed on 5 March 2021)) and CADD (cadd.gs.washington.edu/ (accessed on 5 March 2021)) were used to assess the deleterious effects of the identified variants.
Functional prioritization of the candidate genes was performed by STRING database analysis. The entire list of 589 candidate genes was analysed with the STRING database to search for protein–protein interaction (PPI) networks and for metabolic pathways enrichment. We found a significant PPI enrichment (p value = 1.7 × 10⁻⁶), which means that selected proteins have more interactions among themselves than what would be expected for a random set of proteins of similar size, drawn from the genome. In particular, we found a significant enrichment for genes related to skeletal muscle development and disease (p = 0.04) and in family 1 we identified a cluster of 18 gene products involved in calcium and bone metabolism (p = 0.03). Moreover, we analysed the metabolic pathways annotated by STRING to select the genes involved in the autophagy/lysosomal pathways as well as in immunity. Information were verified in OMIM and PubMed and selected variants were confirmed by direct sequencing, as already published [18].

4.3. Immunofluorescence Staining of Skeletal Muscle

For immunofluorescence (IF) analysis, skeletal muscle cryosections (7 µm-thick) were fixed in pre-cooled acetone (−20 °C) for 5 min at room temperature (RT). Endogenous peroxidase activity was blocked by means of a 0.3% hydrogen peroxide and methanol solution for 5 min at RT. After washing, incubation with a blocking buffer (1 × PBS/5% horse serum) was performed for 1 h in a humidified chamber. Primary and then secondary antibody incubations were performed at 4 °C overnight and at RT for 2 h, respectively. Anti-LYAG (GTX109821, GeneTex, Irvine, CA, USA; 1:200), anti-LC3B (NB100-2220, Novus Biologicals, Littleton, CO, USA; 1:200), anti-p62/SQSTM1 (P0067, Sigma-Aldrich, St. Louis, MO, USA; 1:100), anti-LAMP2 (ab25621, Abcam, Cambridge, UK; 1:100), anti-FNIP2 (ab106611, Abcam, Cambridge, UK; 1:100), anti-RILP (ab140188, Abcam, Cambridge, UK; 1:50), anti-ADRP (PLIN2) (sc377429, Santa Cruz Biotechnology, Dallas, TX, USA; 1:100) primary antibodies and sheep anti-rabbit IgG-Cy3 (C2306, Sigma-Aldrich, St. Louis, MO, USA, 1:100), goat anti-rabbit FITC (F9887, Sigma-Aldrich, St. Louis, MI, USA, 1:100), sheep anti-mouse IgG-Cy3 (C2181, Sigma-Aldrich, St. Louis, MO, USA, 1:100) and sheep anti-mouse IgG-FITC (F2266, Sigma-Aldrich, St. Louis, MO, USA, 1:100) secondary antibodies were used. Slides were visualized with a Nikon Eclipse E800 photomicroscope.
Muscle biopsies from a non-GAA vacuolar myopathy patient (CNT1) and from a non-myopathic orthopaedic patient (CNT2) were used as external controls, being available in the tissue bank of our department.

4.4. Plasmids Preparation, Cell Cultures and Transfection

The wild-type (wt) expression vectors of RILP and PLIN2 were purchased from the Addgene repository (EGFP-RILP catalogue: 110498; pEGFP-C1-ADRP (PLIN2) catalogue: 87161) and were used as the templates to introduce the RILP (c.G850A, p.G284S) and PLIN2 (c.G616A, p.E206K and c.C925T, p.R309C) variants. Mutagenesis were carried out by the Quick Change II XL site-directed mutagenesis technique according to the manufacturer’s instructions (Agilent Technologies, Santa Clara, CA, USA). The whole coding sequences of wild-type and mutant plasmids were sequenced to confirm the mutagenesis and to exclude undesired mutations.
HeLa cells were cultured in Dulbecco’s modified Eagle’s medium (DMEM) supplemented with 10% FBS (Invitrogen, Thermo Fisher Scientific, Waltham, MA, USA) and 2% L-glutamine in a humidified atmosphere of 5% CO2 at 37 °C.
In total, 500 nanograms of each vector were incubated with 1 microgram of Lipofectamine 2000 (Invitrogen, Thermo Fisher Scientific, Waltham, MA, USA) in Opti-MEM (Gibco, Thermo Fisher Scientific, Waltham, MA, USA) for 20 min; the mixture was added to HeLa cells (80,000 cells in 24 wells plate on coverslip) that were grown in complete medium for 20 h. Cells to be stained with anti-p62 and anti-LC3B antibodies were starved for 1 h in Hanks’ Balanced Salt solution (HBSS) before transfection. Twenty hours after transfection, cells were fixed with paraformaldehyde (PFA) 4% and stained with anti-LAMP2, anti-p62 and anti-LC3B antibodies. Briefly, incubation with blocking buffer (1×PBS/0.1% triton/5% serum) was performed for 15 min in a humidified chamber. Primary and then secondary antibody incubations (1 × PBS/0.1% triton/antibody) were performed at 4 °C overnight and at RT for 1 h, respectively. Anti-LAMP2 (ab25631, Abcam, Cambridge, UK, 1:100), anti-LC3B (NB100-2220, Novus Biologicals, Littleton, CO, USA, 1:200) and anti-p62/SQSTM1 (P0067, Sigma-Aldrich, St. Louis, MO, USA, 1:500) primary antibodies and anti-mouse IgG-Cy3 (C2181, Sigma-Aldrich, St. Louis, MO, USA, 1:200) and anti-rabbit IgG-Cy3 (C2306, Sigma-Aldrich, St. Louis, MO, USA, 1:200) secondary antibodies were used. Rhodamine-phalloidin (P1951, Sigma-Aldrich, St. Louis, Missouri, USA, 1:1000) and Hoestch H3570 (Thermo Fisher Scientific, Waltham, MA, USA; 1:1000) were used to visualize F-actin filaments and nuclei, respectively. Slides were visualized with a Nikon Confocal Microscope A1R and Nikon Eclipse Ni-E Microscope.

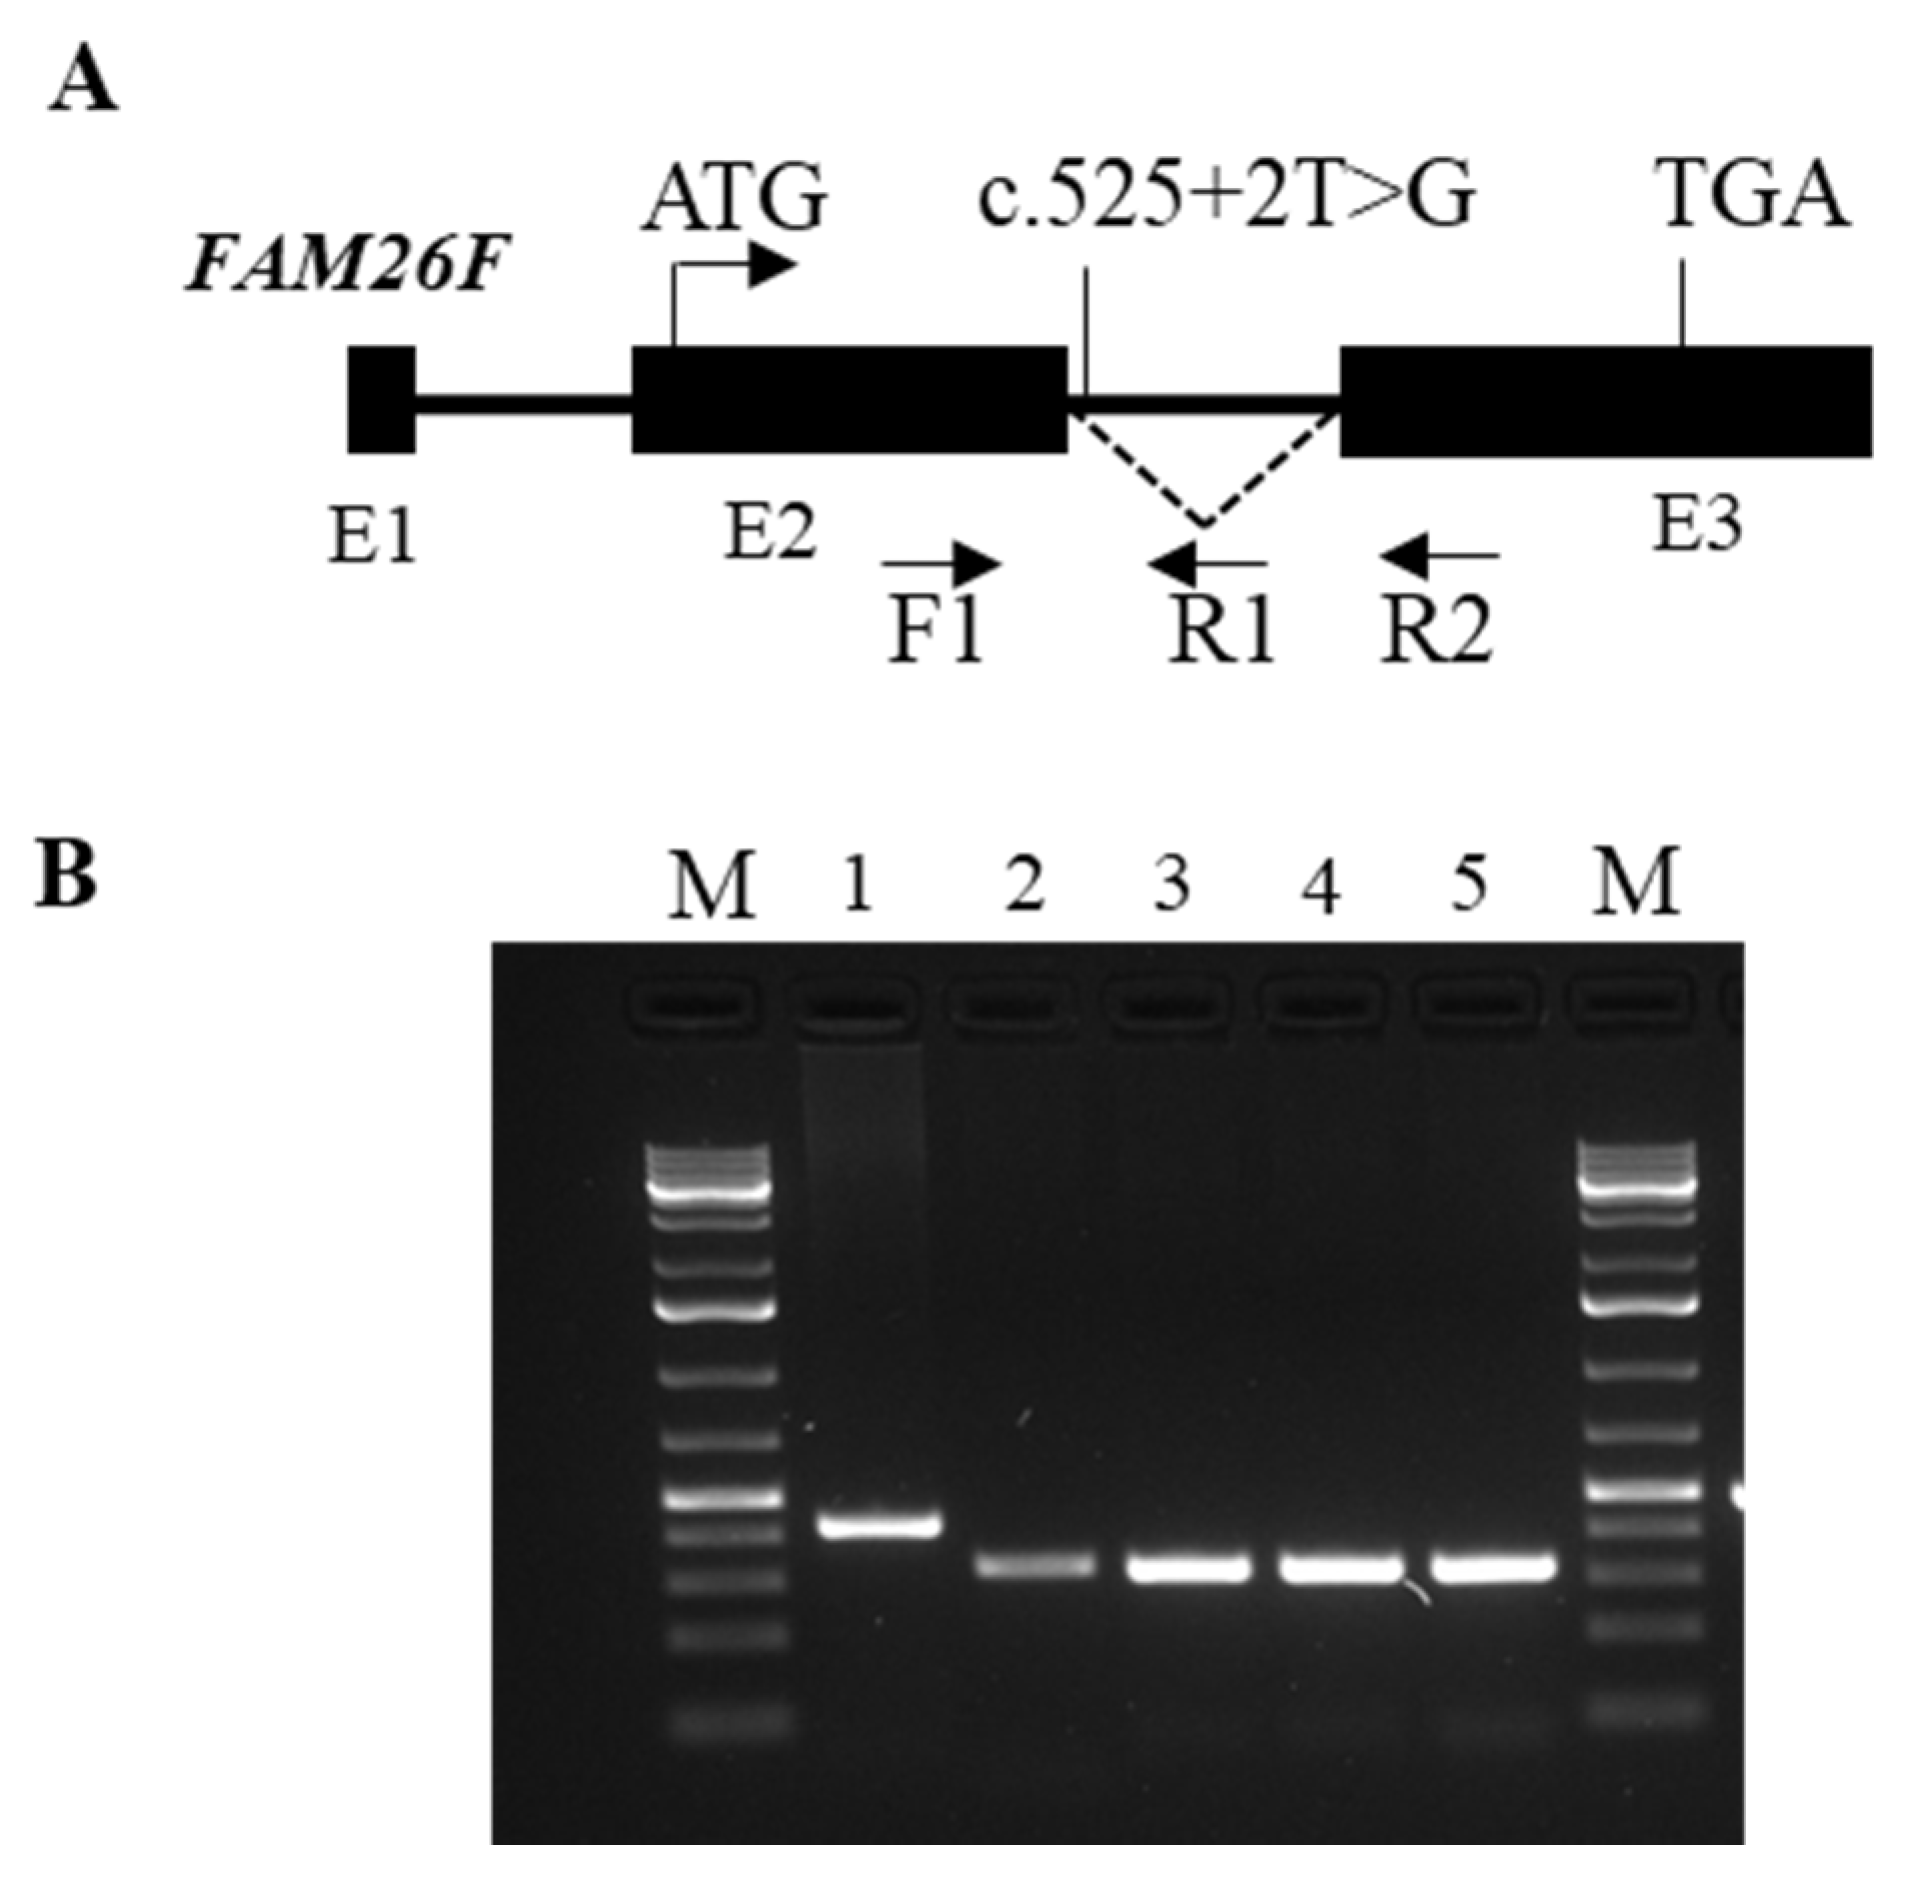
4.5. Expression Analysis of the Mutated FAM26Fc.525 + 2T > G Transcript

To assess the effect on splicing of the variant c.525 + 2T > G, located into the intron 2 of the FAM26F gene, we performed bioinformatics analysis by using the NetGene2 server (http://www.cbs.dtu.dk/services/NetGene2/ (accessed on 5 March 2021)), which produces neural network predictions of splice sites in human. We found that the c.525 + 2T > G variant completely disrupted (100% of probability) the canonical donor splicing site in intron 2.
To examine the expression pattern of the alternative transcript generated by the c.525 + 2T > G variant, an RT-PCR assay was performed using specific couples of oligonucleotides designed on exons 2 and 3 and on intron 2 of the gene. Blood RNA was isolated by using Tempus Spin RNA Isolation Kit (Thermo Fisher Scientific, Waltham, MA, USA). A total of 1 µg of total RNA, digested with DNasi RNasi free (Thermo Fisher Scientific, Waltham, MA, USA), was reverse transcribed with the Superscript III-First strand kit (Thermo Fisher Scientific, Waltham, MA, USA). Quantitative PCR (qPCR) reactions were performed in triplicate, using human FAM26F transcript-specific primers and ITaq Universal Sybr Green Supermix (Bio-Rad, Hercules, CA, USA) following the manufacturer’s directions. Results were normalized versus the expression of the beta-actin gene. The SD was calculated by using data of three different experiments. PCR products where directly sequenced on both strands using the Big Dye Terminator Ready Reaction Kit (Applied Biosystems, Foster City, CA, USA).

4.6. Statistical Analysis for Clinical Variables

Characteristics of the study population were presented using descriptive statistics. The mean and SD values were calculated for continuous variables, while frequencies were reported for categorical variables. Patients were classified as having a higher severity score (if moderate/severe or very severe score) or lower severity score (if mild or very mild score). Pearson correlation was used to explore the relationship between the severity score and clinical variables. A non-parametric test for independent samples (Mann–Whitney U) was used to compare the quantitative clinical variables (age, AAO, MMT-MRC, 6MWT, FVC, ΔFVC, BMI, VDD, BMD total body, BMD femoral neck, BMD lumbar-sacral and GSGC) in the two populations. Chi-squared tests were used to compare the qualitative variables (sex, BF, BAD, MVP, IgG-rhGAA and ERT-AE) between the two subgroups. A p value < 0.05 was considered statistically significant.

5. Conclusions

The findings of this study strongly support the hypothesis that disease severity and progression in LOPD patients is caused by the concomitant mutations of GAA and other autophagy genes. Of course, at this stage of advancement of our study, we cannot offer any improvement in practicing medicine; however, we believe it is important to report the two main results that emerge from this study. First is that the majority of the identified variants were located in autophagy-related genes, and second, some of these mutated genes were shared between the two LOPD families. Undoubtedly, the identification of potential modifier genes not shared by the majority of LOPD patients could cause great uncertainty on the interpretation of the clinical phenotype and of the ERT results collected in different series so far. However, at the molecular level, these findings offer a rational support to address additional genetic studies to identify in a larger cohort of LOPD patients the functional variants that could affect the autophagy pathway. A detailed molecular definition of Pompe disease would be essential to improve the treatment of the patients, in line with a personalized medicine approach.

Author Contributions

Conceptualization, S.S. and T.E.; data curation, T.E.; formal analysis, E.S., A.G. and T.E.; funding acquisition, M.A.B.M., S.S. and T.E.; investigation, F.N., G.B., C.T., N.P.P., F.S.d.C., P.D.B., S.N. and S.S.; methodology, G.F.; resources, M.A.B.M.; writing—original draft, F.N. and G.B.; writing—review and editing, C.T., S.S. and T.E. All authors have read and agreed to the published version of the manuscript.

Funding

Funding for this study was provided by Region of Campania Priority and Objectives of National importance (PON) pursuant to Article 4(1) of Regulation No 1, paragraphs 34 and 34 bis, of Law 662/96. MISSION MEM: Modern Innovative Healthcare Solutions in Improving Outcomes in MEM (Metabolic Hereditary Diseases). T.E. was financed by PON/MISE Project n. F/050011/01/X32 from Italian Ministry of Economic Development, and by Current Research founded by the Italian Ministry of Health. F.S.d.C. was supported by Fondazione Veronesi.

Institutional Review Board Statement

All procedures involving human participants were approved by the Institutional Review Board of the University of Campania Luigi Vanvitelli. Clinical investigations were conducted according to the principles expressed in the Declaration of Helsinki.

Informed Consent Statement

Informed consent was obtained from all subjects involved in the study.

Data Availability Statement

The datasets analyzed during the current study are available from the corresponding author on reasonable request.

Acknowledgments

The authors thank Giovanni Panella for skilful, consistent and invaluable technical support in conducting the laboratory studies. The authors also thank the Microscopy facility at IGB for technical assistance.

Conflicts of Interest

Authors declare that there is no conflict of interest.

References

  1. Hirschhorn, R.; Reuser, A.J. Glycogen storage disease type II: Acid alpha-glucosidase (acid maltase) deficiency. In The Metabolic and Molecular Bases of Inherited Disease; Scriver, C.R., Beaudet, A., Sly, W.S., Valle, D., Eds.; McGraw-Hill: New York, NY, USA, 2001; pp. 3389–3420. [Google Scholar]
  2. Kishnani, P.S.; Steiner, R.D.; Bali, D.; Berger, K.; Byrne, B.J.; Case, L.E.; Crowley, J.F.; Downs, S.; Howell, R.R.; Kravitz, R.M.; et al. Pompe disease diagnosis and management guideline. Genet. Med. 2006, 8, 267–288. [Google Scholar] [CrossRef] [Green Version]
  3. Chan, J.; Desai, A.K.; Kazi, Z.B.; Corey, K.; Austin, S.; Hobson-Webb, L.D.; Case, L.E.; Jones, H.N.; Kishnani, P.S. The emerging phenotype of late-onset Pompe disease: A systematic literature review. Mol. Genet. Metab. 2017, 120, 163–172. [Google Scholar] [CrossRef]
  4. Raben, N.; Nichols, R.C.; Martiniuk, F.; Plotz, P.H. A model of mRNA splicing in adult lysosomal storage disease (glycogenosis type II). Hum. Mol. Genet. 1996, 5, 995–1000. [Google Scholar] [CrossRef] [Green Version]
  5. Montalvo, A.L.; Bembi, B.; Donnarumma, M.; Filocamo, M.; Parenti, G.; Rossi, M.; Merlini, L.; Buratti, E.; De Filippi, P.; Dardis, A.; et al. Mutation profile of the GAA gene in 40 Italian patients with late onset glycogen storage disease type II. Hum. Mutat. 2006, 27, 999–1006. [Google Scholar] [CrossRef]
  6. Spada, M.; Porta, F.; Vercelli, L.; Pagliardini, V.; Chiadò-Piat, L.; Boffi, P.; Pagliardini, S.; Remiche, G.; Ronchi, D.; Comi, G.; et al. Screening for later-onset Pompe’s disease in patients with paucisymptomatic hyperCKemia. Mol. Genet. Metab. 2013, 109, 171–173. [Google Scholar] [CrossRef]
  7. Mehler, M.; Di Mauro, S. Residual acid maltase activity in late-onset acid maltase deficiency. Neurology 1977, 27, 178–184. [Google Scholar] [CrossRef]
  8. Umapathysivam, K.; Hopwood, J.J.; Meikle, P.J. Correlation of acid alpha-glucosidase and glycogen content in skin fibroblasts with age of onset in Pompe disease. Clin. Chim. Acta 2005, 36, 191–198. [Google Scholar] [CrossRef]
  9. Reuser, A.J.; Kroos, M.A.; Hermans, M.M.; Bijvoet, A.G.; Verbeet, M.P.; Van Diggelen, O.P.; Kleijer, W.J.; Van der Ploeg, A.T. Glycogenosis type II (acid maltase deficiency). Muscle Nerve 1995, 3, S61–S69. [Google Scholar] [CrossRef] [PubMed] [Green Version]
  10. Kroos, M.A.; Pomponio, R.J.; Hagemans, M.L.; Keulemans, J.L.; Phipps, M.; DeRiso, M.; Palmer, R.E.; Ausems, M.G.; Van der Beek, N.A.; Van Diggelen, O.P.; et al. Broad spectrum of Pompe disease in patients with the same c.-32-13T->G haplotype. Neurology 2007, 68, 110–115. [Google Scholar] [CrossRef] [PubMed]
  11. Kroos, M.A.; Van der Kraan, M.; Van Diggelen, O.P.; Kleijer, W.J.; Reuser, A.J. Two extremes of the clinical spectrum of glycogen storage disease type II in one family: A matter of genotype. Hum. Mut. 1997, 9, 17–22. [Google Scholar] [CrossRef]
  12. Ausems, M.G.; ten Berg, K.; Beemer, F.A.; Wokke, J.H. Phenotypic expression of late-onset glycogen storage disease type II: Identification of asymptomatic adults through family studies and review of reported families. Neuromusc. Disord. 2000, 10, 467–471. [Google Scholar] [CrossRef]
  13. Semplicini, C.; Letard, P.; De Antonio, M.; Taouagh, N.; Perniconi, B.; Bouhour, F.; Echaniz-Laguna, A.; Orlikowski, D.; Sacconi, S.; Salort-Campana, E.; et al. Late onset Pompe disease in France: Molecular features and epidemiology from a nation-wide study. J. Inherit. Metab. Dis. 2018, 41, 937–946. [Google Scholar] [CrossRef] [PubMed]
  14. Herzog, A.; Hartung, R.; Reuser, A.J.; Hermanns, P.; Runz, H.; Karabul, N.; Gökce, S.; Pohlenz, J.; Kampmann, C.; Lampe, C.; et al. A cross sectional single-centre study on the spectrum of Pompe disease, German patients: Molecular analysis of the GAA gene, manifestation and genotype-phenotype correlations. Orphanet. J. Rare Dis. 2012, 7, 35. [Google Scholar] [CrossRef] [PubMed] [Green Version]
  15. Laforet, P.; Laloui, K.; Granger, B.; Hamroun, D.; Taouagh, N.; Hogrel, J.Y.; Orlikowski, D.; Bouhour, F.; Lacour, A.; Salort-Campana, E.; et al. The French Pompe registry. Baseline characteristics of a cohort of 126 patients with adult Pompe disease. Rev. Neurol. 2013, 169, 595–602. [Google Scholar] [CrossRef]
  16. Slonim, A.E.; Bulone, L.; Goldberg, T.; Minikes, J.; Slonim, E.; Galanko, J.; Martiniuk, F. Modification of the natural history of adult-onset acid maltase deficiency by nutrition and exercise therapy. Muscle Nerve 2007, 35, 70–77. [Google Scholar] [CrossRef] [PubMed]
  17. Slonim, A.E.; Bulone, L.; Minikes, J.; Hays, A.P.; Shanske, S.; Tsujino, S.; DiMauro, S. Benign course of glycogen storage disease type IIb in two brothers: Nature or nurture? Muscle Nerve 2006, 33, 571–574. [Google Scholar] [CrossRef] [PubMed]
  18. Sampaolo, S.; Esposito, T.; Farina, O.; Formicola, D.; Diodato, D.; Gianfrancesco, F.; Cipullo, F.; Cremone, G.; Cirillo, M.; Del Viscovo, L.; et al. Distinct disease phenotypes linked to different combinations of GAA mutations in a large late-onset GSDII sibship. Orphanet. J. Rare Dis. 2013, 8, 159. [Google Scholar] [CrossRef] [PubMed] [Green Version]
  19. Hagemans, M.L.C.; van Schie, S.P.M.; Janssens, A.C.J.W.; van Doorn, P.A.; Reuser, A.J.J.; van der Ploeg, A.T. Fatigue: An important feature of late-onset Pompe disease. J. Neurol. 2007, 254, 941–945. [Google Scholar] [CrossRef] [Green Version]
  20. American Thoracic Society/European Respiratory Society. ATS/ERS: Statement on respiratory muscle testing. Am. J. Respir. Crit. Care Med. 2002, 166, 518–624. [Google Scholar] [CrossRef]
  21. Van den Berg, L.E.; Zandbergen, A.A.; van Capelle, C.I.; de Vries, J.M.; Hop, W.C.; van denHout, J.M.; Reuser, A.J.; Zillikens, M.C.; van der Ploeg, A.T. Low bone mass in Pompe disease: Muscular strength as a predictor of bone mineral density. Bone 2010, 47, 643–649. [Google Scholar] [CrossRef]
  22. Laforêt, P.; Petiot, P.; Nicolino, M.; Orlikowski, D.; Caillaud, C.; Pellegrini, N.; Froissart, R.; Petitjean, T.; Maire, I.; Chabriat, H.; et al. Dilative arteriopathy and basilar artery dolichoectasia complicating late-onset Pompe disease. Neurology 2008, 70, 2063–2066. [Google Scholar] [CrossRef]
  23. Morris, D.A.; Blaschke, D.; Krebs, A.; Canaan-Kühl, S.; Plöckinger, U.; Knobloch, G.; Walter, T.C.; Kühnle, Y.; Boldt, L.H.; Kraigher-Krainer, E.; et al. Structural and functional cardiac analyses using modern and sensitive myocardial techniques in adult Pompe disease. Int. J. Cardiovasc. Imaging 2015, 31, 947–956. [Google Scholar] [CrossRef]
  24. Kulessa, M.; Weyer-Menkhoff, I.; Viergutz, L.; Kornblum, C.; Claeys, K.G.; Schneider, I.; Plöckinger, U.; Young, P.; Boentert, M.; Vielhaber, S.; et al. An integrative correlation of myopathology, phenotype and genotype in late onset Pompe disease. Neuropathol. Appl. Neurobiol. 2020, 46, 359–374. [Google Scholar] [CrossRef] [PubMed] [Green Version]
  25. Wierzba-Bobrowicz, T.; Lewandowska, E.; Lugowska, A.; Rola, R.; Stepień, T.; Ryglewicz, D.; Pasennik, E. Adult glycogenosis type II (Pompe’s disease): Morphological abnormalities in muscle and skin biopsies compared with acid alpha-glucosidase activity. Folia Neuropathol. 2007, 45, 179–186. [Google Scholar] [PubMed]
  26. Durst, R.; Sauls, K.; Peal, D.S.; deVlaming, A.; Toomer, K.; Leyne, M.; Salani, M.; Talkowski, M.E.; Brand, H.; Perrocheau, M.; et al. Mutations in DCHS1 cause mitral valve prolapse. Nature 2015, 525, 109–113. [Google Scholar] [CrossRef]
  27. Sampaolo, S.; Napolitano, F.; Tirozzi, A.; Reccia, M.G.; Lombardi, L.; Farina, O.; Barra, A.; Cirillo, F.; Melone, M.A.B.; Gianfrancesco, F.; et al. Identification of the first dominant mutation of LAMA5 gene causing a complex multisystem syndrome due to dysfunction of the extracellular matrix. J. Med. Genet. 2017, 54, 710–720. [Google Scholar] [CrossRef]
  28. Napolitano, F.; Terracciano, C.; Bruno, G.; De Blasiis, P.; Lombardi, L.; Gialluisi, A.; Gianfrancesco, F.; De Giovanni, D.; Tummolo, A.; Di Iorio, G.; et al. Novel autophagic vacuolar myopathies: Phenotype and genotype features. Neuropathol. Appl. Neurobiol. 2021, 2021. [Google Scholar] [CrossRef]
  29. Alathari, B.E.; Sabta, A.A.; Kalpana, C.A.; Vimaleswaran, K.S. Vitamin D pathway-related gene polymorphisms and their association with metabolic diseases: A literature review. J. Diabetes Metab. Disord. 2020. [Google Scholar] [CrossRef] [PubMed]
  30. Hagemans, M.L.; Winkel, L.P.; Van Doorn, P.A.; Hop, W.J.; Loonen, M.C.; Reuser, A.J.; Van der Ploeg, A.T. Clinical manifestation and natural course of late-onset Pompe’s disease in 54 Dutch patients. Brain 2005, 128, 671–677. [Google Scholar] [CrossRef] [Green Version]
  31. Domingues-Faria, C.; Boirie, Y.; Walrand, S. Vitamin D and muscle trophicity. Curr. Opin. Clin. Nutr. Metab. Care 2017, 20, 169–174. [Google Scholar] [CrossRef]
  32. Condello, M.; Pellegrini, E.; Caraglia, M.; Meschini, S. Targeting autophagy to overcome human diseases. Int. J. Mol. Sci. 2019, 20, 725. [Google Scholar] [CrossRef] [PubMed] [Green Version]
  33. Rodríguez-Arribas, M.; Pedro, J.M.; Gómez-Sánchez, R.; Yakhine-Diop, S.M.; Martínez-Chacón, G.; Uribe-Carretero, E.; De Castro, D.C.; Casado-Naranjo, I.; López de Munaín, A.; Niso-Santano, M.; et al. Pompe disease and autophagy: Partners in crime, or cause and consequence? Curr. Med. Chem. 2016, 23, 2275–2285. [Google Scholar] [CrossRef] [PubMed]
  34. Nascimbeni, A.C.; Fanin, M.; Masiero, E.; Angelini, C.; Sandri, M. Impaired autophagy contributes to muscle atrophy in glycogen storage disease type II patients. Autophagy 2012, 8, 1697–1700. [Google Scholar] [CrossRef] [PubMed] [Green Version]
  35. Nascimbeni, A.C.; Fanin, M.; Angelini, C.; Sandri, M. Autophagy dysregulation in Danon disease. Cell Death Dis. 2017, 8, e2565. [Google Scholar] [CrossRef] [Green Version]
  36. De Martín Garrido, N.; Aylett, C.H.S. Nutrient signaling and lysosome positioning crosstalk through a multifunctional protein, Folliculin. Front. Cell Dev. Biol. 2020, 8, 108. [Google Scholar] [CrossRef] [Green Version]
  37. Cantalupo, G.; Alifano, P.; Roberti, V.; Bruni, C.B.; Bucci, C. Rab-interacting lysosomal protein (RILP): The Rab7 effector required for transport to lysosomes. EMBO J. 2001, 20, 683–693. [Google Scholar] [CrossRef]
  38. Harrison, R.E.; Bucci, C.; Vieira, O.V.; Schroer, T.A.; Grinstein, S. Phagosomes fuse with late endosomes and/or lysosomes by extension of membrane protrusions along microtubules: Role of Rab7 and RILP. Mol. Cell Biol. 2003, 23, 6494–6506. [Google Scholar] [CrossRef] [Green Version]
  39. Dunlop, E.A.; Seifan, S.; Claessens, T.; Behrends, C.; Kamps, M.A.F.; Rozycka, E.; Kemp, A.J.; Nookala, R.K.; Blenis, J.; Coull, B.J.; et al. FLCN, a novel autophagy component, interacts with GABARAP and is regulated by ULK1 phosphorylation. Autophagy 2014, 10, 1749–1760. [Google Scholar] [CrossRef]
  40. Shen, K.; Rogala, K.B.; Chou, H.-T.; Huang, R.K.; Yu, Z.; Sabatini, D.M. Cryo-EM structure of the human FLCN-FNIP2-Rag-ragulator complex. Cell 2019, 179, 1319. [Google Scholar] [CrossRef] [PubMed]
  41. Dodding, M.P. Folliculin–A tumor suppressor at the intersection of metabolic signaling and membrane traffic. Small GTPases 2017, 8, 100–105. [Google Scholar] [CrossRef] [PubMed] [Green Version]
  42. Schmidt, L.S.; and Linehan, W.M. FLCN: The causative gene for birt-hogg dubé syndrome. Gene 2018, 640, 28–42. [Google Scholar] [CrossRef]
  43. Rudolf, R.; Deschenes, M.R.; Sandri, M. Neuromuscular junction degeneration in muscle wasting. Curr. Opin. Clin. Nutr. Metab. Care 2016, 19, 177–181. [Google Scholar] [CrossRef] [Green Version]
  44. Barik, A.; Lu, Y.; Sathyamurthy, A.; Bowman, A.; Shen, C.; Li, L.; Xiong, W.C.; Mei, L. LRP4 is critical for neuromuscular junction maintenance. J. Neurosci. 2014, 34, 13892–13905. [Google Scholar] [CrossRef] [PubMed] [Green Version]
  45. Menzella, F.; Codeluppi, L.; Lusuardi, M.; Galeone, C.; Valzania, F.; Facciolongo, N. Acute respiratory failure as presentation of late-onset Pompe disease complicating the diagnostic process as a labyrinth: A case report. Multidiscip. Respir. Med. 2018, 13, 32. [Google Scholar] [CrossRef] [PubMed]
  46. Stanga, D.; Zhao, Q.; Milev, M.P.; Saint-Dic, D.; Jimenez-Mallebrera, C.; Sacher, M. TRAPPC11 functions in autophagy by recruiting ATG2B-WIPI4/WDR45 to pre-autophagosomal membranes. Traffic 2019, 20, 325–345. [Google Scholar] [CrossRef] [PubMed]
  47. Sacher, M.; Shahrzad, N.; Kamel, H.; Milev, M.P. TRAPPopathies: An emerging set of disorders linked to variations in the genes encoding transport protein particle (TRAPP)-associated proteins. Traffic 2019, 20, 5–26. [Google Scholar] [CrossRef] [Green Version]
  48. Magné, J.; Aminoff, A.; Perman Sundelin, J.; Mannila, M.N.; Gustafsson, P.; Hultenby, K.; Wernerson, A.; Bauer, G.; Listenberger, L.; Neville, M.J.; et al. The minor allele of the missense polymorphism Ser251Pro in perilipin 2 (PLIN2) disrupts an α-helix, affects lipolysis, and is associated with reduced plasma triglyceride concentration in humans. FASEB J. 2013, 27, 3090–3099. [Google Scholar] [CrossRef] [PubMed]
  49. Najt, C.P.; Lwande, J.S.; McIntosh, A.L.; Senthivinayagam, S.; Gupta, S.; Kuhn, L.A.; Atshaves, B.P. Structural and functional assessment of perilipin 2 lipid binding domain(s). Biochemistry 2014, 53, 7051–7066. [Google Scholar] [CrossRef]
  50. Sentinelli, F.; Capoccia, D.; Incani, M.; Bertoccini, L.; Severino, A.; Pani, M.G.; Manconi, E.; Cossu, E.; Leonetti, F.; Baroni, M.G. The perilipin 2 (PLIN2) gene Ser251Pro missense mutation is associated with reduced insulin secretion and increased insulin sensitivity in Italian obese subjects. Diabetes Metab Res. Rev. 2016, 32, 550–556. [Google Scholar] [CrossRef]
  51. Shpilka, T.; Welter, E.; Borovsky, N.; Amar, N.; Mari, M.; Reggiori, F.; Elazar, Z. Lipid droplets and their component triglycerides and steryl esters regulate autophagosome biogenesis. EMBO J. 2015, 34, 2117–2131. [Google Scholar] [CrossRef] [Green Version]
  52. Papadimas, G.K.; Terzis, G.; Methenitis, S.; Spengos, K.; Papadopoulos, C.; Vassilopoulou, S.; Kavouras, S.; Michelakakis, H.; Manta, P. Body composition analysis in late-onset Pompe disease. Mol. Genet. Metab. 2011, 102, 41–43. [Google Scholar] [CrossRef]
  53. Bischoff-Ferrari, H.; Stähelin, H.B.; Walter, P. Vitamin D effects on bone and muscle. Int. J. Vitam. Nutr. Res. 2011, 81, 264–272. [Google Scholar] [CrossRef]
  54. Peng, J.B.; Suzuki, Y.; Gyimesi, G.; Hediger, M.A. TRPV5 and TRPV6 calcium-selective channels. In Calcium Entry Channels in Non-Excitable Cells; Kozak, J.A., Putney, J.W., Jr., Eds.; CRC Press/Taylor & Francis: Boca Raton, FL, USA, 2018. [Google Scholar]
  55. Van Abel, M.; Hoenderop, J.G.; Bindels, R.J. The epithelial calcium channels TRPV5 and TRPV6: Regulation and implications for disease. Naunyn Schmiedebergs Arch. Pharmacol. 2005, 371, 295–306. [Google Scholar] [CrossRef] [Green Version]
  56. Earley, S. Vanilloid and melastatin transient receptor potential channels in vascular smooth muscle. Microcirculation 2010, 17, 237–249. [Google Scholar] [CrossRef] [PubMed] [Green Version]
  57. Hoenderop, J.G.; Voets, T.; Hoefs, S.; Weidema, F.; Prenen, J.; Nilius, B.; Bindels, R.J. Homo- and heterotetrameric architecture of the epithelial Ca2+ channels TRPV5 andTRPV6. EMBO J. 2003, 22, 776–785. [Google Scholar] [CrossRef] [PubMed] [Green Version]
  58. Vanoevelen, J.; Janssens, A.; Huitema, L.F.; Hammond, C.L.; Metz, J.R.; Flik, G.; Voets, T.; Schulte-Merker, S. Trpv5/6 is vital for epithelial calcium uptake and bone formation. FASEB J. 2011, 25, 3197–3207. [Google Scholar] [CrossRef] [Green Version]
  59. van der Eerden, B.C.; Hoenderop, J.G.; de Vries, T.J.; Schoenmaker, T.; Buurman, C.J.; Uitterlinden, A.G.; Pols, H.A.; Bindels, R.J.; van Leeuwen, J.P. The epithelial Ca2+ channel TRPV5 is essential for proper osteoclastic bone resorption. Proc. Natl. Acad. Sci. USA 2005, 102, 17507–17512. [Google Scholar] [CrossRef] [PubMed] [Green Version]
  60. Chen, F.; Ni, B.; Yang, Y.O.; Ye, T.; Chen, A. Knockout of TRPV6 causes osteopenia in mice by increasing osteoclastic differentiation and activity. Cell Physiol. Biochem. 2014, 33, 796–809. [Google Scholar] [CrossRef] [PubMed]
  61. Rhee, Y.; Bivi, N.; Farrow, E.; Lezcano, V.; Plotkin, L.I.; White, K.E.; Bellido, T. Parathyroid hormone receptor signaling in osteocytes increases the expression of fibroblast growth factor-23 in vitro and in vivo. Bone 2011, 49, 636–643. [Google Scholar] [CrossRef] [Green Version]
  62. Komaba, H.; Kaludjerovic, J.; Hu, D.Z.; Nagano, K.; Amano, K.; Ide, N.; Sato, T.; Densmore, M.J.; Hanai, J.I.; Olauson, H.; et al. Klotho expression in osteocytes regulates bone metabolism and controls bone formation. Kidney Int. 2017, 92, 599–611. [Google Scholar] [CrossRef] [Green Version]
  63. Erben, R.G. Update on FGF23 and Klotho signaling. Mol. Cell Endocrinol. 2016, 432, 56–65. [Google Scholar] [CrossRef]
  64. Ichikawa, S.; Imel, E.A.; Kreiter, M.L.; Yu, X.; Mackenzie, D.S.; Sorenson, A.H.; Goetz, R.; Mohammadi, M.; White, K.E.; Econs, M.J. A homozygous missense mutation in human KLOTHO causes severe tumoral calcinosis. J. Clin. Investig. 2007, 117, 2684–2691. [Google Scholar] [CrossRef] [PubMed] [Green Version]
  65. Brownstein, C.A.; Adler, F.; Nelson-Williams, C.; Iijima, J.; Li, P.; Imura, A.; Nabeshima, Y.; Reyes-Mugica, M.; Carpenter, T.O.; Lifton, R.P. A translocation causing increased alpha-klotho level results in hypophosphatemic rickets and hyperparathyroidism. Proc. Natl. Acad. Sci. USA 2008, 105, 3455–3460. [Google Scholar] [CrossRef] [Green Version]
  66. Ogata, N.; Chikazu, D.; Kubota, N.; Terauchi, Y.; Tobe, K.; Azuma, Y.; Ohta, T.; Kadowaki, T.; Nakamura, K.; Kawaguchi, H. Insulin receptor substrate-1 in osteoblast is indispensable for maintaining bone turnover. J. Clin. Investig. 2000, 105, 935–943. [Google Scholar] [CrossRef] [Green Version]
  67. Schoser, B.; Stewart, A.; Kanters, S.; Hamed, A.; Jansen, J.; Chan, K.; Karamouzian, M.; Toscano, A. Survival and longterm outcomes in late-onset Pompe disease following glucosidase alfa treatment: A systematic review and meta-analysis. J. Neurol. 2017, 264, 621–630. [Google Scholar] [CrossRef]
  68. Nayak, S.; Doerfler, P.A.; Porvasnik, S.L.; Cloutier, D.D.; Khanna, R.; Valenzano, K.J.; Herzog, R.W.; Byrne, B.J. Immune Responses and Hypercoagulation in ERT for Pompe Disease Are Mutation and rhGAA Dose Dependent. PLoS ONE 2014, 9, e98336. [Google Scholar] [CrossRef] [PubMed]
  69. Malik, U.; Javed, A. FAM26F: An enigmatic protein having a complex role in the immune system. Int. Rev. Immunol. 2016, 35, 1–11. [Google Scholar] [CrossRef] [PubMed]
  70. Malik, U.; Javed, A.; Ali, A.; Asghar, K. Structural and functional annotation of human FAM26F: A multifaceted protein having a critical role in the immune system. Gene 2017, 597, 66–75. [Google Scholar] [CrossRef]
  71. World Health Organization. Obesity: Preventing and managing the global epidemic. Report of a WHO consultation. World Health Organ. Tech. Rep. Ser. 2000, 894, 1–253. [Google Scholar]
  72. Pascarella, A.; Terracciano, C.; Farina, O.; Lombardi, L.; Esposito, T.; Napolitano, F.; Franzese, G.; Panella, G.; Tuccillo, F.; la Marca, G.; et al. Vacuolated PAS-positive lymphocytes as a hallmark of Pompe disease and other myopathies related to impaired autophagy. J. Cell Physiol. 2018, 233, 5829–5837. [Google Scholar] [CrossRef]
  73. DePristo, M.A.; Banks, E.; Poplin, R.; Garimella, K.V.; Maguire, J.R.; Hartl, C.; Philippakis, A.A.; del Angel, G.; Rivas, M.A.; Hanna, M.; et al. A framework for variation discovery and genotyping using next-generation DNA sequencing data. Nat. Genet. 2011, 43, 491–498. [Google Scholar] [CrossRef] [PubMed]
  74. Wang, K.; Li, M.; Hakonarson, H. ANNOVAR: Functional annotation of genetic variants from high-throughput sequencing data. Nucleic Acids Res. 2010, 38, e164. [Google Scholar] [CrossRef] [PubMed]
Figure 1. Pedigrees of the two Italian families. (A,B) Graphical representation of the two LOPD Italian families. The affected siblings are reported with filled symbols.
Ijms 22 03625 g001
Figure 2. Pipeline of the analysis. The flowchart explains the analysis of WES data to identify the gene/variants shared between the two families (Analysis I) or between the affected relatives in each family (Analysis II). Functional annotation was performed with transcripts of the RefSeq and UCSC databases. MAF annotations were based on the 1000 Genomes project, Exome Variant Server, and the ExAC database. A CADD phred score > 20 was chosen to select deleterious variants.
Ijms 22 03625 g002
Figure 3. Venn diagram. Venn diagram showing the 12 modifiers genes involved across different interconnected pathways: lysosome–autophagy-related genes, genes involved in immunity, in bone metabolism and those related to the development of skeletal muscle and/or skeletal muscle diseases.
Ijms 22 03625 g003
Figure 4. Evolutionary conservation study of the rare deleterious variants identified in the modifier genes. The affected residues are reported in bold underlined. For each gene, we reported the protein structure and the localization of the identified variant on protein domain.
Ijms 22 03625 g004
Figure 5. FAM26F gene structure and expression of the aberrant transcript. (A) Genomic structure of the human FAM26F gene. Exons are indicated by dark rectangles, introns with bold lines. The start site and stop codon are present in exons 2 and 3, respectively. The splicing mutation in intron 2 is indicated. Primers used in the expression analysis are indicated with arrows. (B) RT-PCR analysis. M: gene ruler 1 kb plus DNA ladder (Thermo Fisher Scientific, Waltham, MA, USA); lane 1: cDNA of patient II-5 amplified with primers F1-R1; lane 2: cDNA of patient II-5 amplified with primers F1-R2; lanes 3-5: cDNA of patients II-7, 9, 12 amplified with primers F1-R2. In patient II-5, the altered transcript carrying the unspliced intron 2 was amplified and a lower wild-type transcript was observed.
Ijms 22 03625 g005
Figure 6. Skeletal muscle biopsies: immunofluorescence studies for GAA and p62 antibodies. (A) GAA/CY3 antibody marks the autophagic microvacuoles, which appear as red spots into the sarcoplasm of several fibres in all LOPD tissues. (B) Autophagic microvacuoles are intensely green when labelled by p62/FITC antibodies (impaired autophagy) or p62/FITC negative (active autophagy). (C) Non-myopathic skeletal tissue did not showed any GAA/p62-positive sarcoplasmic spots, while non-GAA vacuolar myopathy tissue presented with either GAA/p62-positive spots (arrowheads) or GAA-negative/p62 positive sarcoplasmic spots (white asterisks). Scale bar: 200 μm.
Ijms 22 03625 g006
Figure 7. Skeletal muscle biopsies: immunofluorescence studies for RILP and LAMP2 antibodies. (A) In RILP mutated tissues the positive reaction for RILP/CY3 was visible both in the form of granular aggregates of variable extension and irregular profile located near the sarcolemma or scattered in the sarcoplasm (F2_II-4) and in the form of more or less extended subsarcolemmal linear reaction (F1_II-5). Immunofluorescence for LAMP2/FITC followed similar patterns of distribution but to a lesser extent and intensity. (B) The LOPD family members not mutated for RILP-positive RILP/CY3 granules appeared more intensely fluorescent than in mutated tissues with a similar subsarcolemmal and sarcoplasmic pattern of distribution. A non-LOPD vacuolar myopathy (CNT1) and a non-myopathic condition (CNT2) were used as external controls. In CNT1, a faint subsarcolemmal continuous signal was observed in the majority of fibres, while CNT2 showed almost no immunofluorescence. Nuclei were counterstained with DAPI (blue). Scale bar: 200 μm.
Ijms 22 03625 g007
Figure 8. PLIN2 and LC3 immuno-localization on skeletal muscle tissues. (A,B) Continuous PLIN2/CY3 signal with variable intensity delineated the sarcolemma in mutated (A) and wild type (B) muscle fibres, while it appears faint and discontinuous in external controls (CNT1, CNT2). PLIN2/CY3 immunofluorescence marked numerous sarcoplasmic macro- and micro-vacuoles in the mutated muscles (A), which were less numerous in both wild type biopsies (B). External controls disclosed fine and scattered sarcoplasmic spots of PLIN2 positivity. Spots of LC3/FITC immunofluorescence were visible along the sarcolemma membranes and in overlap with only a few PLIN2-positive spots in mutated tissues (A). Nuclei were counterstained with DAPI (blue). Scale bar: 200 μm.
Ijms 22 03625 g008
Figure 9. FNIP2 and LAMP2 immuno-localization on skeletal muscle biopsies. (A) FNIP2/CY3 expression was continuous and intense at the level of the sarcolemma membranes, and in the sarcoplasmic vacuoles and microvacuoles in FNIP2 [p.S551R] mutated biopsies, while more or less extended irregularly shaped spots of positive signals appeared at the edge in some fibres in (p.S301P) mutated biopsies. The LAMP2/FITC reaction was quite superimposable to that of FNIP2 in these biopsies. (B) A faint and diffuse FNIP2/CY3 positive reaction was observed at the sarcolemma and sarcoplasm of muscle fibres in both the wild type individuals and external controls (CNT1, CNT2). Nuclei were counterstained with DAPI (blue). Scale bar: 200 μm.
Ijms 22 03625 g009
Figure 10. Immuno-localization of the RILP wt (RILP-284G-GFP) and mutant (RILP-284S-GFP) proteins in the HeLa cells wt and mutant. RILP proteins were fused to the green fluorescent protein (GFP), and LAMP2 and p62 proteins were stained using anti-LAMP2/CY3 and anti-p62/CY3. F-actin fibres were stained with rhodamin phalloidin and nuclei were stained with Hoechst. Slides were visualized with a Nikon Confocal Microscope A1R at 60× magnification.
Ijms 22 03625 g010
Figure 11. Immuno-localization of the PLIN2 wt (PLIN2-GFP) and mutant (PLIN2-206K-GFP) and (PLIN2-309C-GFP) proteins in the HeLa cells wt and mutant. PLIN2 proteins were fused to the green fluorescent protein (GFP), and LAMP2 and LC3 proteins were stained using anti-LAMP2/CY3 and anti-LC3/CY3. Nuclei were stained with Hoechst. Slides were visualized with a Nikon Confocal Microscope A1R at 60× magnification (LAMP2) and with Nikon Eclipse Ni-E 40x magnification (LC3-II). The localization of the PLIN2 wt and mutant proteins is indicated by green spots spread all over the cytoplasm. PLIN2 wt protein is localized in peripheral spots as well as weakly in the nucleus. The PLIN2-206K mutant protein is expressed intensely in the nucleus in several cells, while the PLIN2-309C mutant protein was observed only as peripheral spots.
Ijms 22 03625 g011
Table 1. Clinical data of the two LOPD Italian families.
IDGAA MutSexAgeAAOMMTMRC6MWT GSCGFVCΔ-FVCBMIVDDBFBMD T-Score
TB/FN/LSV
BADMVPIgG–rhGAADBS GAAPPLVMF
F1
II-4
p.R40X
p.N882fs
F67507929712793522.206.64YES−2.9/−3/−3YESYES12002.7080.53
F1
II-5
p.R40X
p.N882fs
F65538222512624628.0011.6NO−1.3/−1.5/−2.6YESYES64000.12690.01
F1
II-7
p.R40X
p.N882fs
M6142763247981728.1028.4NO−1.1/−1.5/−0.5YESYES16000.11564.11
F1
II-8
p.R40X
p.N882fs
F5947863259901833.1018.5YES0.5/−0.7/−0.5npYES10000.04800.45
F1
II-9
p.R40X
p.N882fs
M5838742549832021.4012.7NO−0.8/−1.4/0.2YESYES32000.094811.18
F1
II-12
p.R40X
p.N882fs
F5141782688822128.7040.2NO1.1/2.2/0.6YESYES13500.12163.59
F1
II-13
p.R40X
p.N882fs
M50367525461051820.1041.3NO1.0/−0.8/−0.5YESNO6000.31591.30
F2
II-1
c.-32-13T > G
p.R375L
M5144994505891731.808.90NO−0.3/−0.5/0.9NONO10000.79520.05
F2
II-3
c.-32-13T > G
p.R375L
F4841973257792126.5030.1NO0.4/0.1/1.3NONO10100.13450.12
F2
II-4
c.-32-13T > G
p.R375L
M4638891142142n.p.39.188.4NO−0.8/−1.2/−0.5NONO8500.78585.28
F2
II-5
c.-32-13T > G
p.R375L
F412983102636n.p.26.107.11YES−0.7/−2.1/1.9NONO9000.986315.31
F1: family 1; F2: family 2; F: female; M: male; Age: age at diagnosis; AAO: age at onset; MMT-MRC (Manual Muscle Testing—Medical Research Council) (%): normal value 100%; 6MWT (six minute walk test): normal value 480 ± 57 m (females) 580 ± 44 m (males); GSCG score (Gait, Stairs, Gower, Chair): normal score 4/27; FVC: forced vital capacity, normal value ≥80% of predicted; Δ-FVC (drop of FVC from sitting to supine); BMI (body mass index): normal range 18.5–24.9 kg/m2, overweight 25–29.9 kg/m2, obesity grade I 30–35.9 kg/m2, obesity grade II 36–40 kg/m2, obesity grade III > 40 kg/m2; VDD: vitamin D 25-OH dosage (normal range 30–100 ng/mL); BMD (bone mass density): total-body (TB), femoral neck (FN), lumbar-sacral vertebrae (LSV) T-Score, normal T-score value −1 g/cm2 and above, T-score values between −1 and 2.5 g/cm2 suggestive of osteopenia, T-score values −2.5 g/cm2 and below suggestive of osteoporosis; BF: bone fractures; BAD: basilar artery dolichoectasia and/or dilation of intracranial internal carotid; MVP: mild mitral valve prolapse; IgG-rhGAA (mg/dL): dosage of IgG anti rh-GAA after one year therapy. DBS GAA (mol/h/L): GAA enzyme activity on DBS, normal value 1.86–21.9 mol/h/L; PPL: percentage of PAS-positive lymphocytes (average of 30 fields at 40×); VMF: percentage of vacuole positive fibres (average of 3 fields at 20× on ATP pH 9.4); np: not performed.
Table 2. The severity index obtained adding the score of each clinical feature of a single LOPD patient.
F1
II:4
F1
II:5
F1
II:7
F1
II:8
F1
II:9
F1
II:12
F1
II:13
F2
II:1
F2
II:3
F2
II:4
F2
II:5
AAO11223232233
MMT-MRC32323331122
6MWT34324342266
GSCG22122111134
FVC12000000144
Δ-FVC44222322344
BMI01121102131
VDD22122002022
BMD21101000011
BF10010000001
BAD11111110000
MVP11111110000
IgG-rhGAA01101010000
ERT-AE01000000000
Severity Index2123161721151611112828
Severity Index range: 1–47. AAO: age at onset; MMT-MRC (Manual Muscle Testing—Medical Research Council) (%): normal value 100%; 6MWT (six minute walk test): normal value 480 ± 57 m (females) 580 ± 44 m (males); GSCG score (Gait, Stairs, Gower, Chair): normal score 4/27; FVC: forced vital capacity, normal value ≥80% of predicted; Δ-FVC (drop of FVC from sitting to supine); BMI (body mass index): normal range 18.5–24.9 kg/m2, overweight 25–29.9 kg/m2, obesity grade I 30–35.9 kg/m2, obesity grade II 36-40 kg/m2, obesity grade III > 40 kg/m2; VDD: vitamin D 25-OH dosage (normal range 30–100 ng/mL); BMD (bone mass density): total-body (TB), femoral neck (FN), lumbar-sacral vertebrae (LSV) T-Score, normal T-score value −1 g/cm2 and above, T-score values between −1 and 2.5 g/cm2 suggestive of osteopenia, T-score values –2.5 g/cm2 and below suggestive of osteoporosis; BF: bone fractures; BAD: basilar artery dolichoectasia and/or dilation of intracranial internal carotid; MVP: mild mitral valve prolapse; IgG-rhGAA (mg/dL): dosage of IgG anti rh-GAA after one year of therapy; AE-ERT: adverse reaction to enzymatic replacement therapy.
Table 3. Clinical variables associated with a higher severity index score.
CLINICAL OUTCOMESSEVERITYNMean (SD)p
6MWT (m)VM/M6324.3 (69.5)0.03
M/S5180.0 (116.6)
FVC (%)VM/M690.5 (9.73)0.01
M/S560.4 (21.1)
ΔFVC (%)VM/M6
3
18.6 (13.0)0.02
M/S33.6 (18.8)
VDDVM/M6
5
27.9 (11.4)0.01
M/S9.29 (2.4)
BMD femoral neckVM/M6
5
-0.20 (0.37)0.03
M/S-1.80 (0.77)
GSGCVM/M6
5
7.0 (1.41)0.01
M/S16.0 (7.17)
6MWT (m): six minute walk test (meters); FVC: forced vital capacity; Δ-FVC: drop of FVC from sitting to supine; VDD: vitamin D 25-OH dosage; BMD: bone mass density; GSCG score: Gait, Stairs, Gower, Chair; VM/M: very mild or mild phenotype; M/S: moderate/severe or very severe.
Table 4. Genes selected by functional prioritization in families 1 and 2.
Type of AnalysisPatient ID
Family 1
GeneOmim/RFInheritanceSKM Related DiseaseAIMCVMO/BFVDOb
Severity score > 20
F1 and F2
F1 and F2RILPnrnrnryesyesnrnrnrnrnr
F1 and F2FNIP2nrnrnryesyesnrnrnrnrnr
F2TRAPPC11LGMDR18ARyesyesyesyesnrnrnrnr
BMIF1 and F2PLIN2Obesitynrnryesnryesnrnrnryes
BMD/BF/VDD
F1
II-4, II-5TRPV6HRPTTNARnrnrnrnrnryesyesnr
II-4, II-5, II-7, II-9, II-12, II-13 (II-8 only IRS1)IRS1NIDDMRFnryesyesyesnryesyesyes
KLHFTC3nrnryesyesnrnryesyesnr
TRPV5nrnrnrnrnrnrnryesyesnr
BMD/BF/VDD
F2
II-5LRP4CMS17ARyesyesyesyesnryesnryes
RUNX1FPDMMADnryesyesyesnryesyesnr
MVP
F1
II-4, II-5, II-7, II-8, II-9, II-12DCHS1*MVP2ADyesnrnryesnrnrnrnr
AR-ERT
F1
II-5FAM26Fnrnrnrnryesnrnrnrnrnr
BMI: body mass index; BMD: bone mass density; BF: bone fractures; VDD: vitamin D deficiency; MVP: mild mitral valve prolapse; AR-ERT: adverse response to enzyme replacement therapy; SKM-related disease: skeletal muscle-related disease; A: autophagy; I: immunity; M: muscle related; CVM: cerebrovascular malformations; O: osteoporosis; BF: bone fractures; VD: vitamin D related; Ob: obesity related; nr: not related; HRPTTN: Hyperparathyroidism, Transient Neonatal; NIDDM: Diabetes Mellitus, Noninsulin-Dependent; HFTC3: Tumoral Calcinosis, Hyperphosphatemic, Familial, 3; CMS17: Myasthenic Syndrome, Congenital, 17; FPDMM: Platelet Disorder, Familial, with associated myeloid malignancy; MVP2: Mitral Valve Prolapse 2; CMD1BB: Cardiomyopathy, Dilated, 1BB; ARVD10: Arrhythmogenic Right Ventricular Dysplasia, Familial, 10; CMH26: cardiomyopathy, familial hypertrophic, 26; MPD4: Myopathy, Distal, 4; MFM5: Myopathy, Myofibrillar, 5; BTHLM1: Bethlem Myopathy 1; LGMDR18: Muscular Dystrophy, Limb-Girdle, Autosomal Recessive 18; RF: risk factor; AR: autosomal recessive; AD: autosomal dominant. DCHS1*: II-5, II-7 and II-12 were compound heterozygous for DCHS1 variants. FLNC*: patients II-4, II-5 and II-13 were compound heterozygous for the two FLNC variants.
Table 5. List of the rare and deleterious variants identified in the two families.
Type of AnalysisFamily Geneavsnp147Accession NumberExonic FunctionNucleotide ChangeAA ChangeMAF MaxCADD PhredSIFTPolyPhen2
Severity score > 20F1 and F2RILPrs61735419NM_031430NSVc.G850Ap.G284S0.0427.4TD
F1FNIP2rs148251675NM_020840NSVc.T901Cp.S301P0.0223TT
F2FNIP2rs62001914NM_020840NSVc.C1653Ap.S551R0.0325DT
F2TRAPPC11rs62617790NM_021942NSVc.G2799Cp.Q933H0.1323DD
BMIF1PLIN2rs759915698NM_001122NSVc.C925Tp.R309C0.0000324DD
F2PLIN2nrNM_001122NSVc.G616Ap.E206Kna27DD
BMD/BF/VDDF1TRPV6rs778016744NM_018646NSVc.G1886Ap.R629Q0.00000824TP
F1TRPV5nrNM_019841NSVc.C1894Tp.R632Wna33DD
F1KLrs9536314NM_004795NSVc.T1054Gp.F352V0.1927DD
F1 and F2IRS1rs1801278NM_005544NSVc.G2911Ap.G971R0.0824TP
F2LRP4rs72897663NM_002334NSVc.A1501Cp.N501H0.0721TT
F2LRP4rs117936904NM_002334NSVc.T5165Ap.L1722H0.0229DD
F2RUNX1nrNM_001754NSVc.G190Ap.G64Sna23TP
MVPF1DCHS1*rs35599968NM_003737NSVc.G8480Cp.R2827P0.1020TT
F1DCHS1*rs376287018NM_003737NFinsc.99_100insCTGp.G34insLG0.10nrnrnr
AR-ERT
F1
F1FAM26Frs117361304NM_001010919splicingc.525 + 2T > Gnr0.0925.4nrnr
BMI: body mass index; BMD: bone mass density; BF: bone fractures; VDD: vitamin D deficiency; MVP: mild mitral valve prolapse; AR-ERT: adverse response to enzyme replacement therapy; AA change: amino acid change; MAF (Minor Allele Frequency) max: the highest frequency value reported in public databases is reported (aESP6500si-v2 (European American and African American population), 1000 Genomes project (AFR, AMR, EAS, EUR, SAS), ExAC browser (NFE, AFR, SAS, EAS and AMR)); CADD phred: Combined Annotation Dependent Depletion, a value ≥20 corresponds to those variants which are predicted to be amongst the 1% most deleterious variants in the genome; nr: not reported; D: deleterious; T: tolerated; P: probably damaging; DCHS1*: II-5, II-7 and II-12 were compound heterozygous for DCHS1 variants.
Table 6. Genotype distribution of the VDR and GC polymorphisms associated to vitamin D levels.
VDRGC/DBP
IDSexAgeAAOVDD
(ng/mL)
rs2228570
c.T2C p.M1T
FokI Variant
rs7975232
G/T
ApaI
rs731236
c.T1056C p.I352I
TaqI Variant
rs4588
c.C1307A
p.T436K
F1 II-4F67506.64CCGTTCCC
F1 II-5F655311.6CCGGTTCC
F1 II-7M614228.4CCGGTTCC
F1 II-8F594718.5CCGTTCCC
F1 II-9M583812.7TCGTTCCC
F1 II-12F514140.2TCTTCCCC
F1 II-13M503641.3CCGTTCCC
F2 II-1M51448.90CCTTTCCC
F2 II-3F484130.1CCTTTTCA
F2 II-4M46388.4
CCTTCCCC
F2 II-5F41297.11CCTTTCCC
AAO: age at onset; VDD: vitamin D dosage; VDR: vitamin D receptor; GC/DBP: vitamin D-binding protein.
Publisher’s Note: MDPI stays neutral with regard to jurisdictional claims in published maps and institutional affiliations.

