
Pharmacodynamic Effects of Standard versus High Caffeine Doses in the Developing Brain of Neonatal Rats Exposed to Intermittent Hypoxia


Abstract
: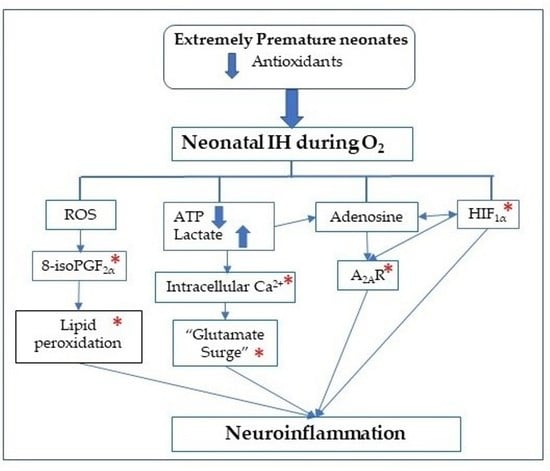
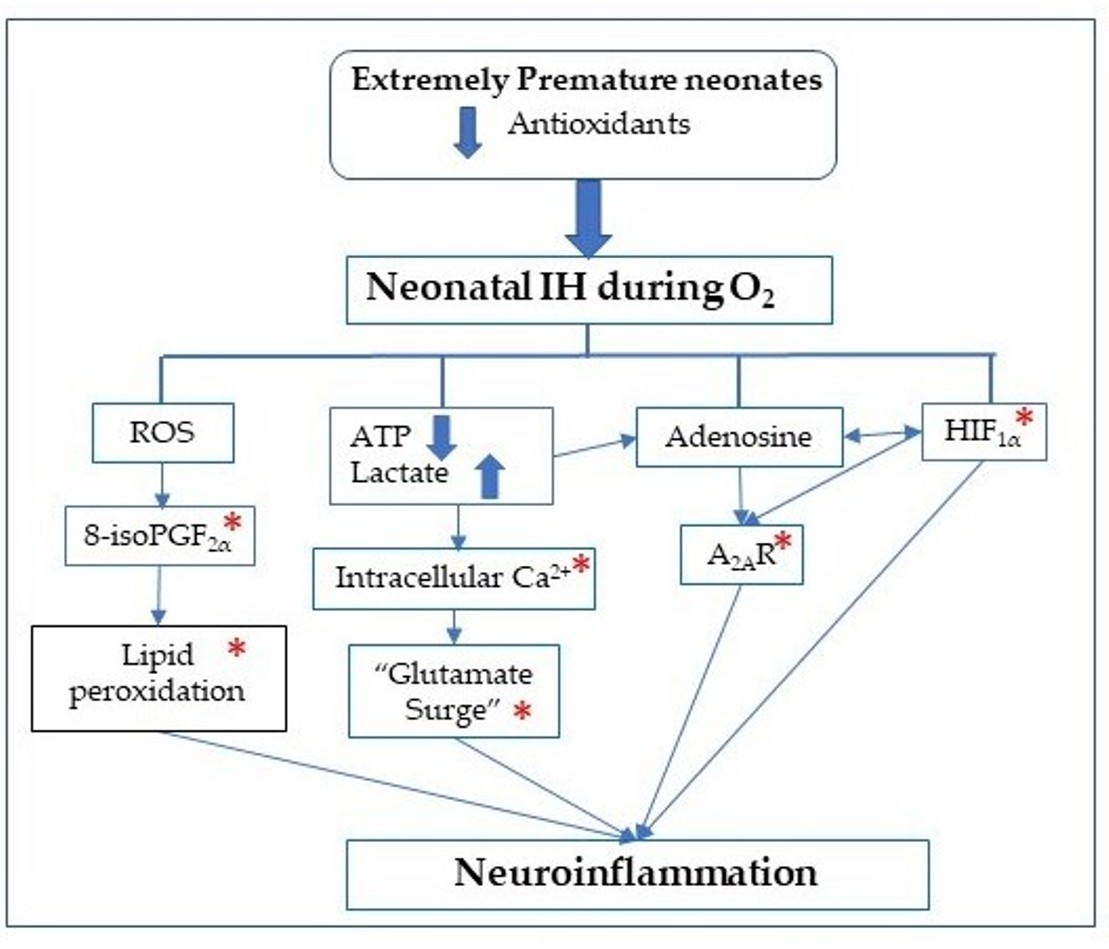
1. Introduction
2. Results
2.1. Blood Gases
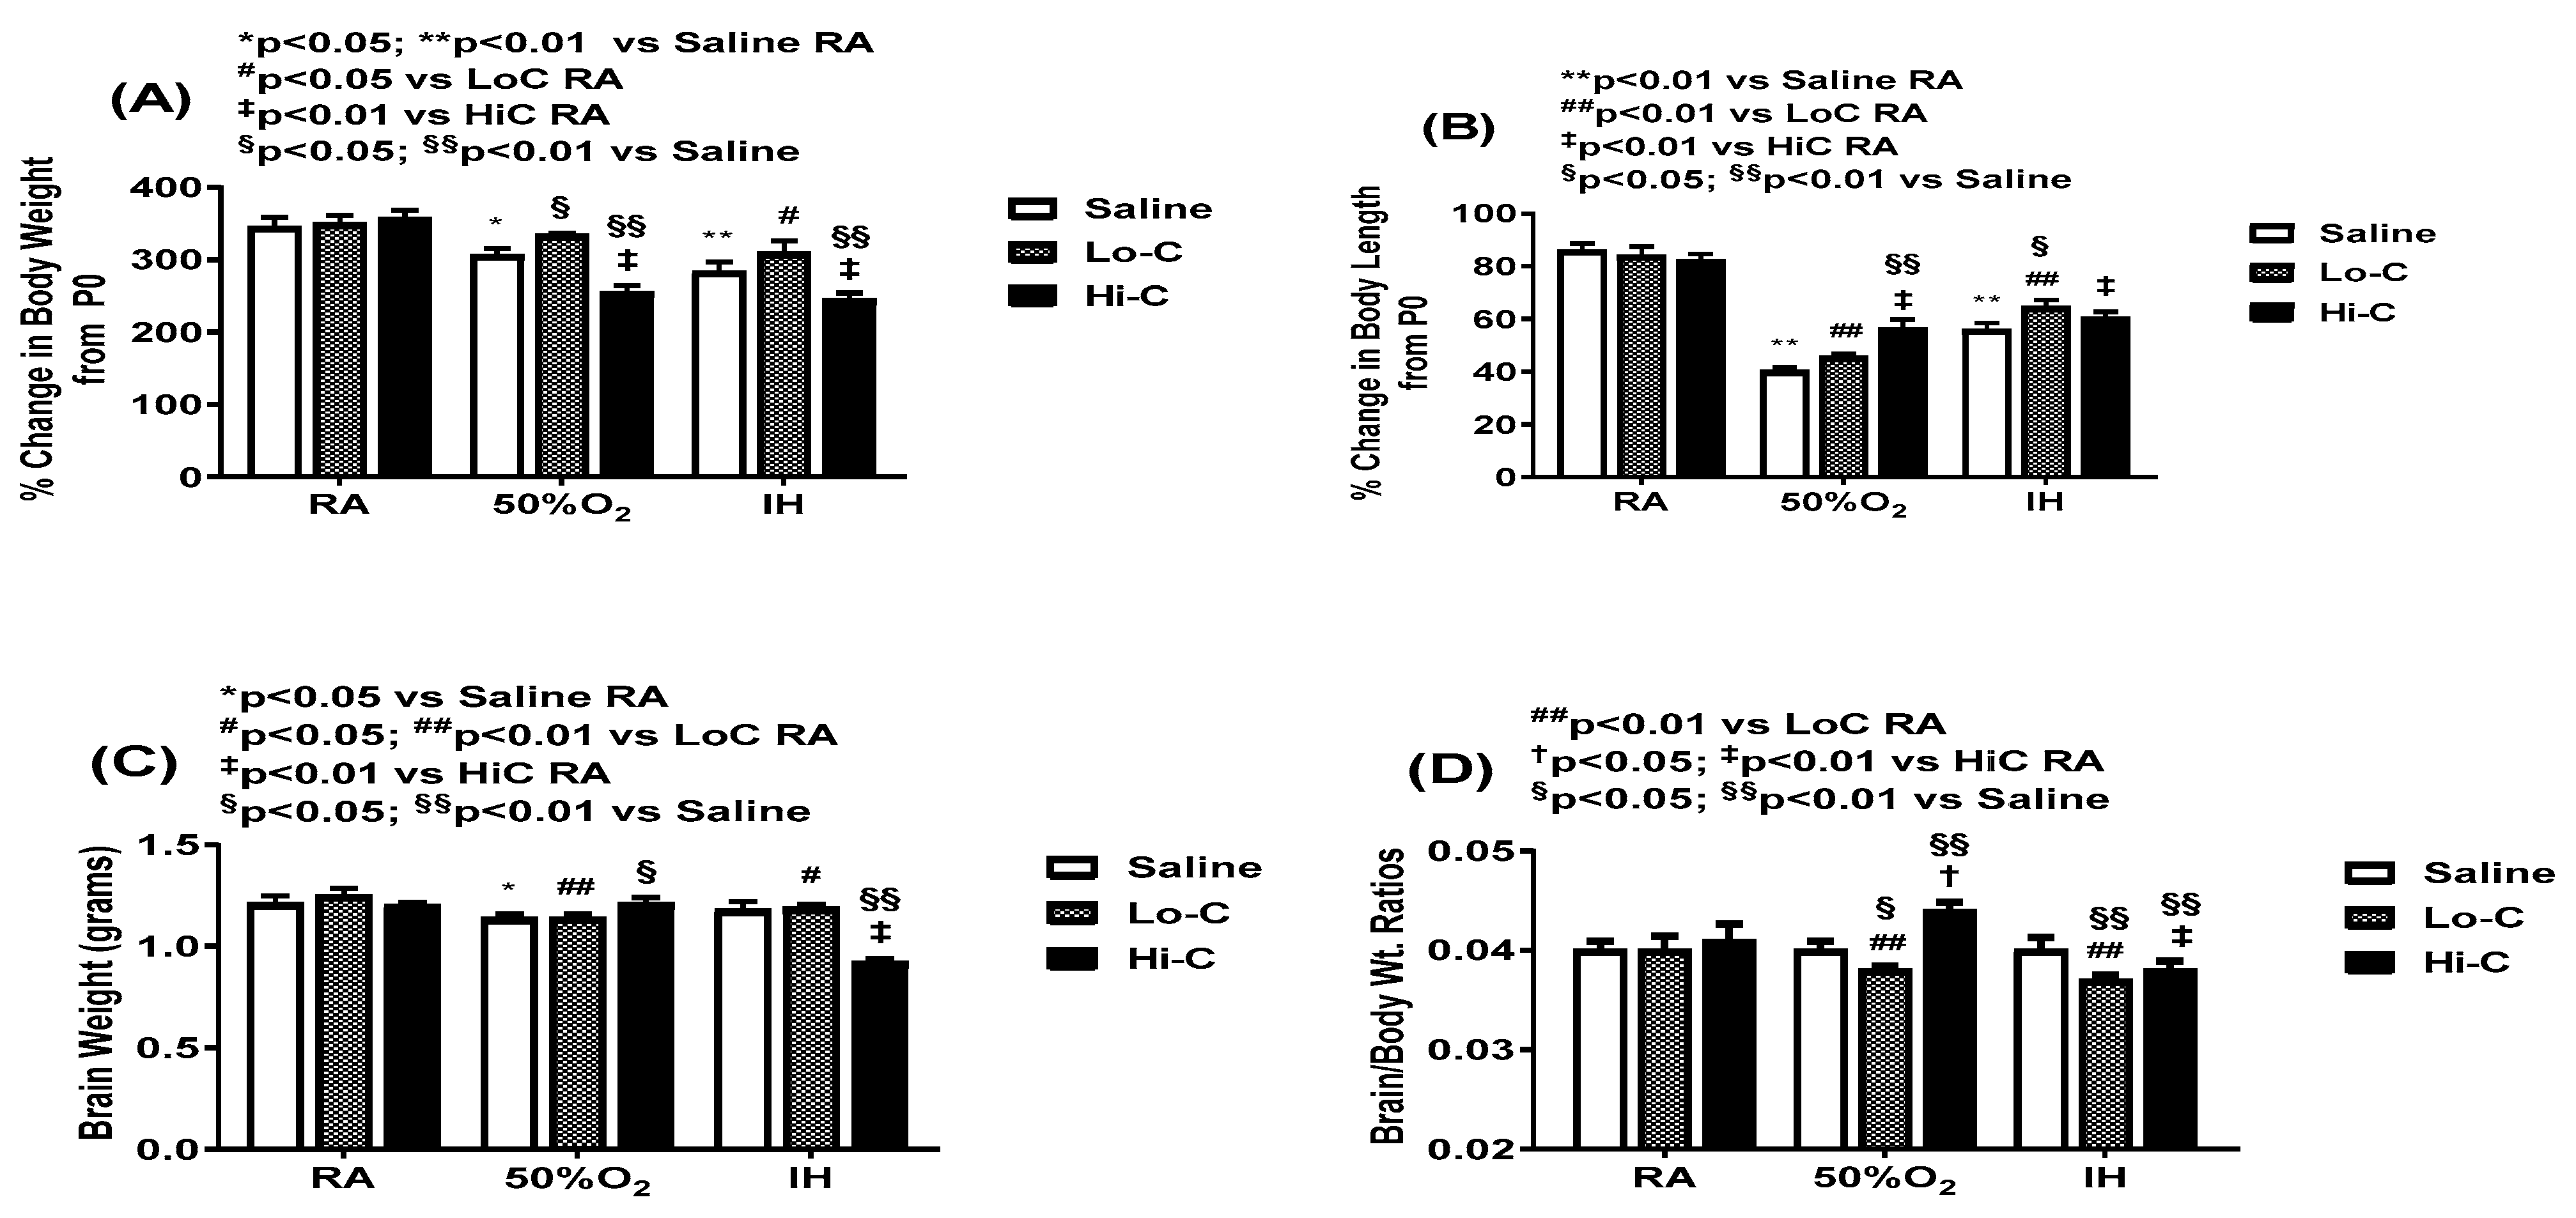
2.2. Growth
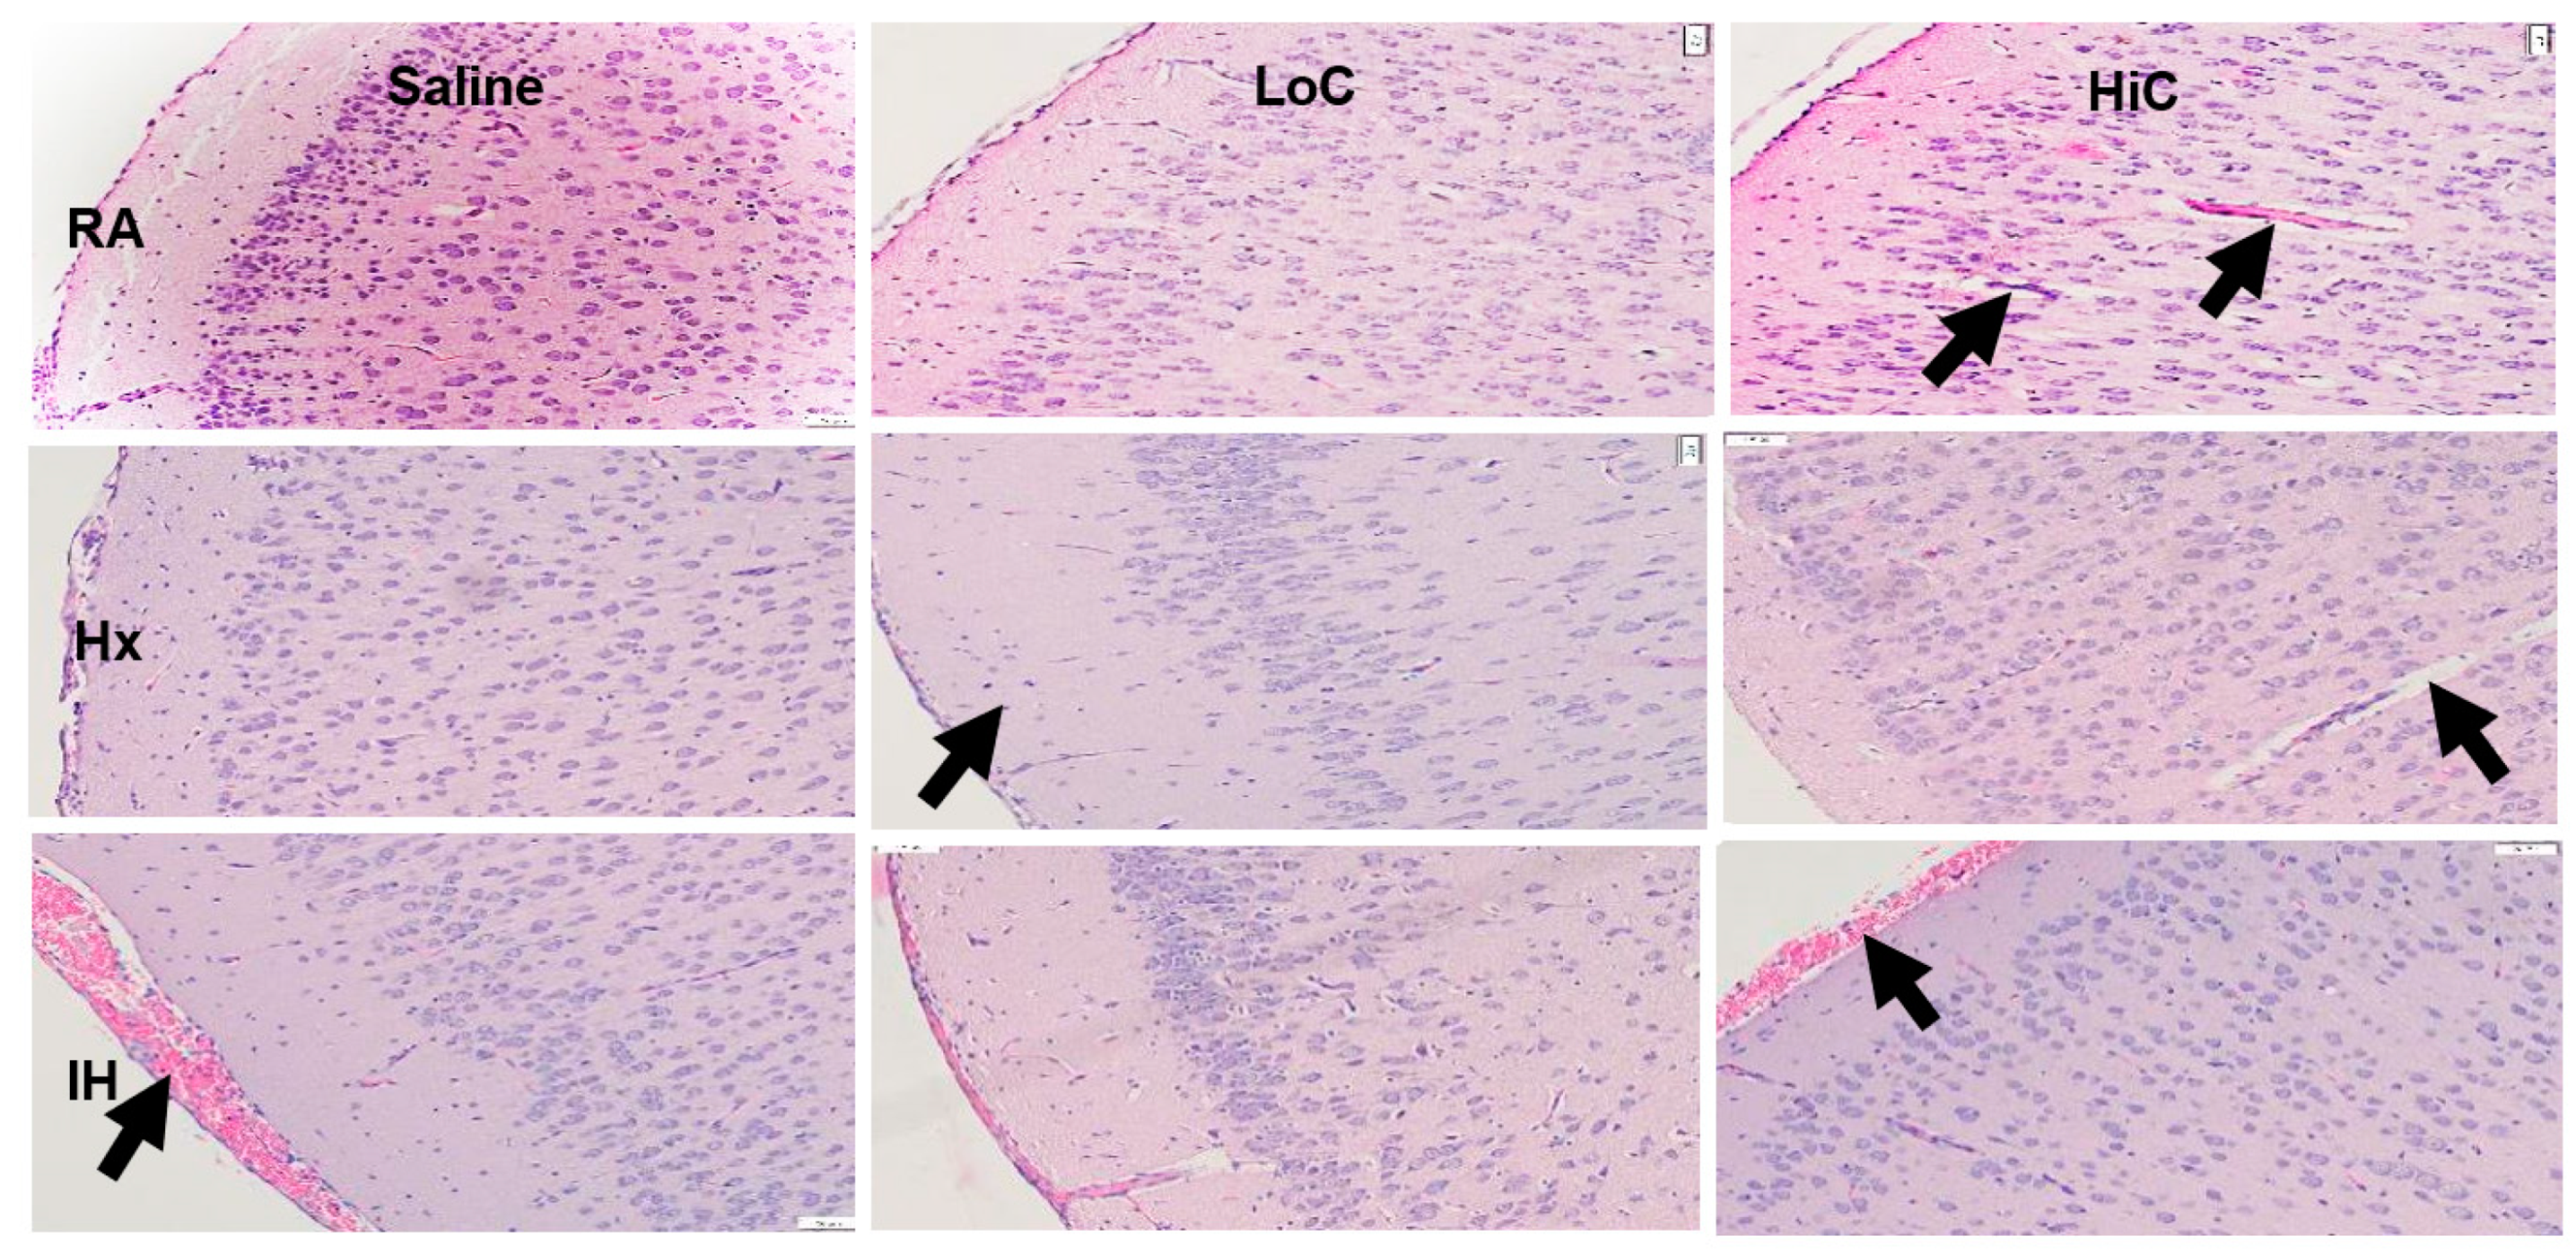
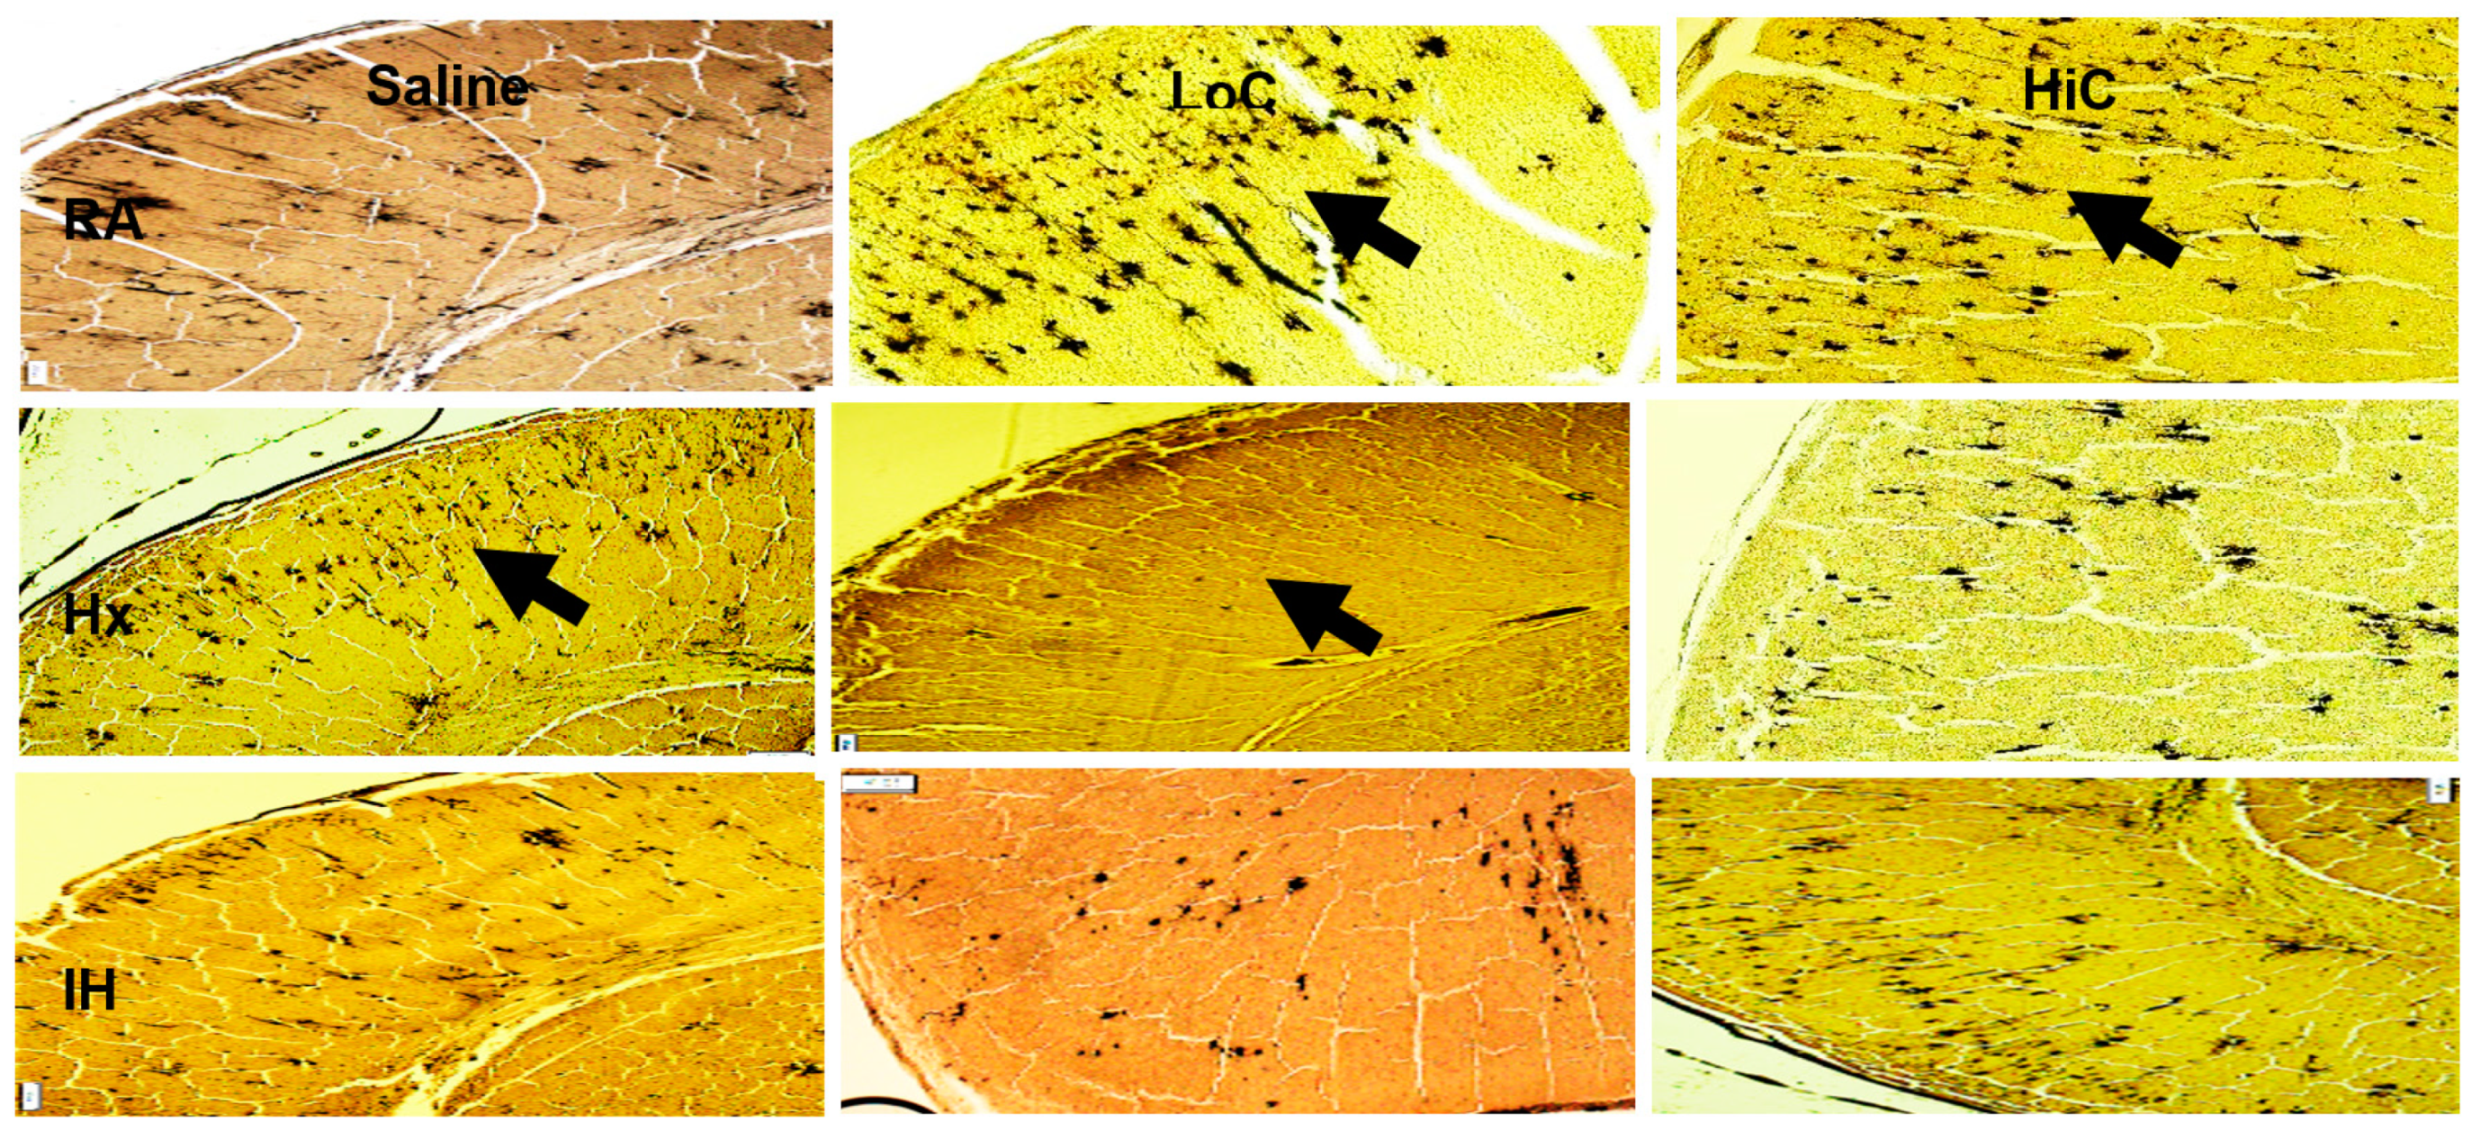
2.3. Histopathology
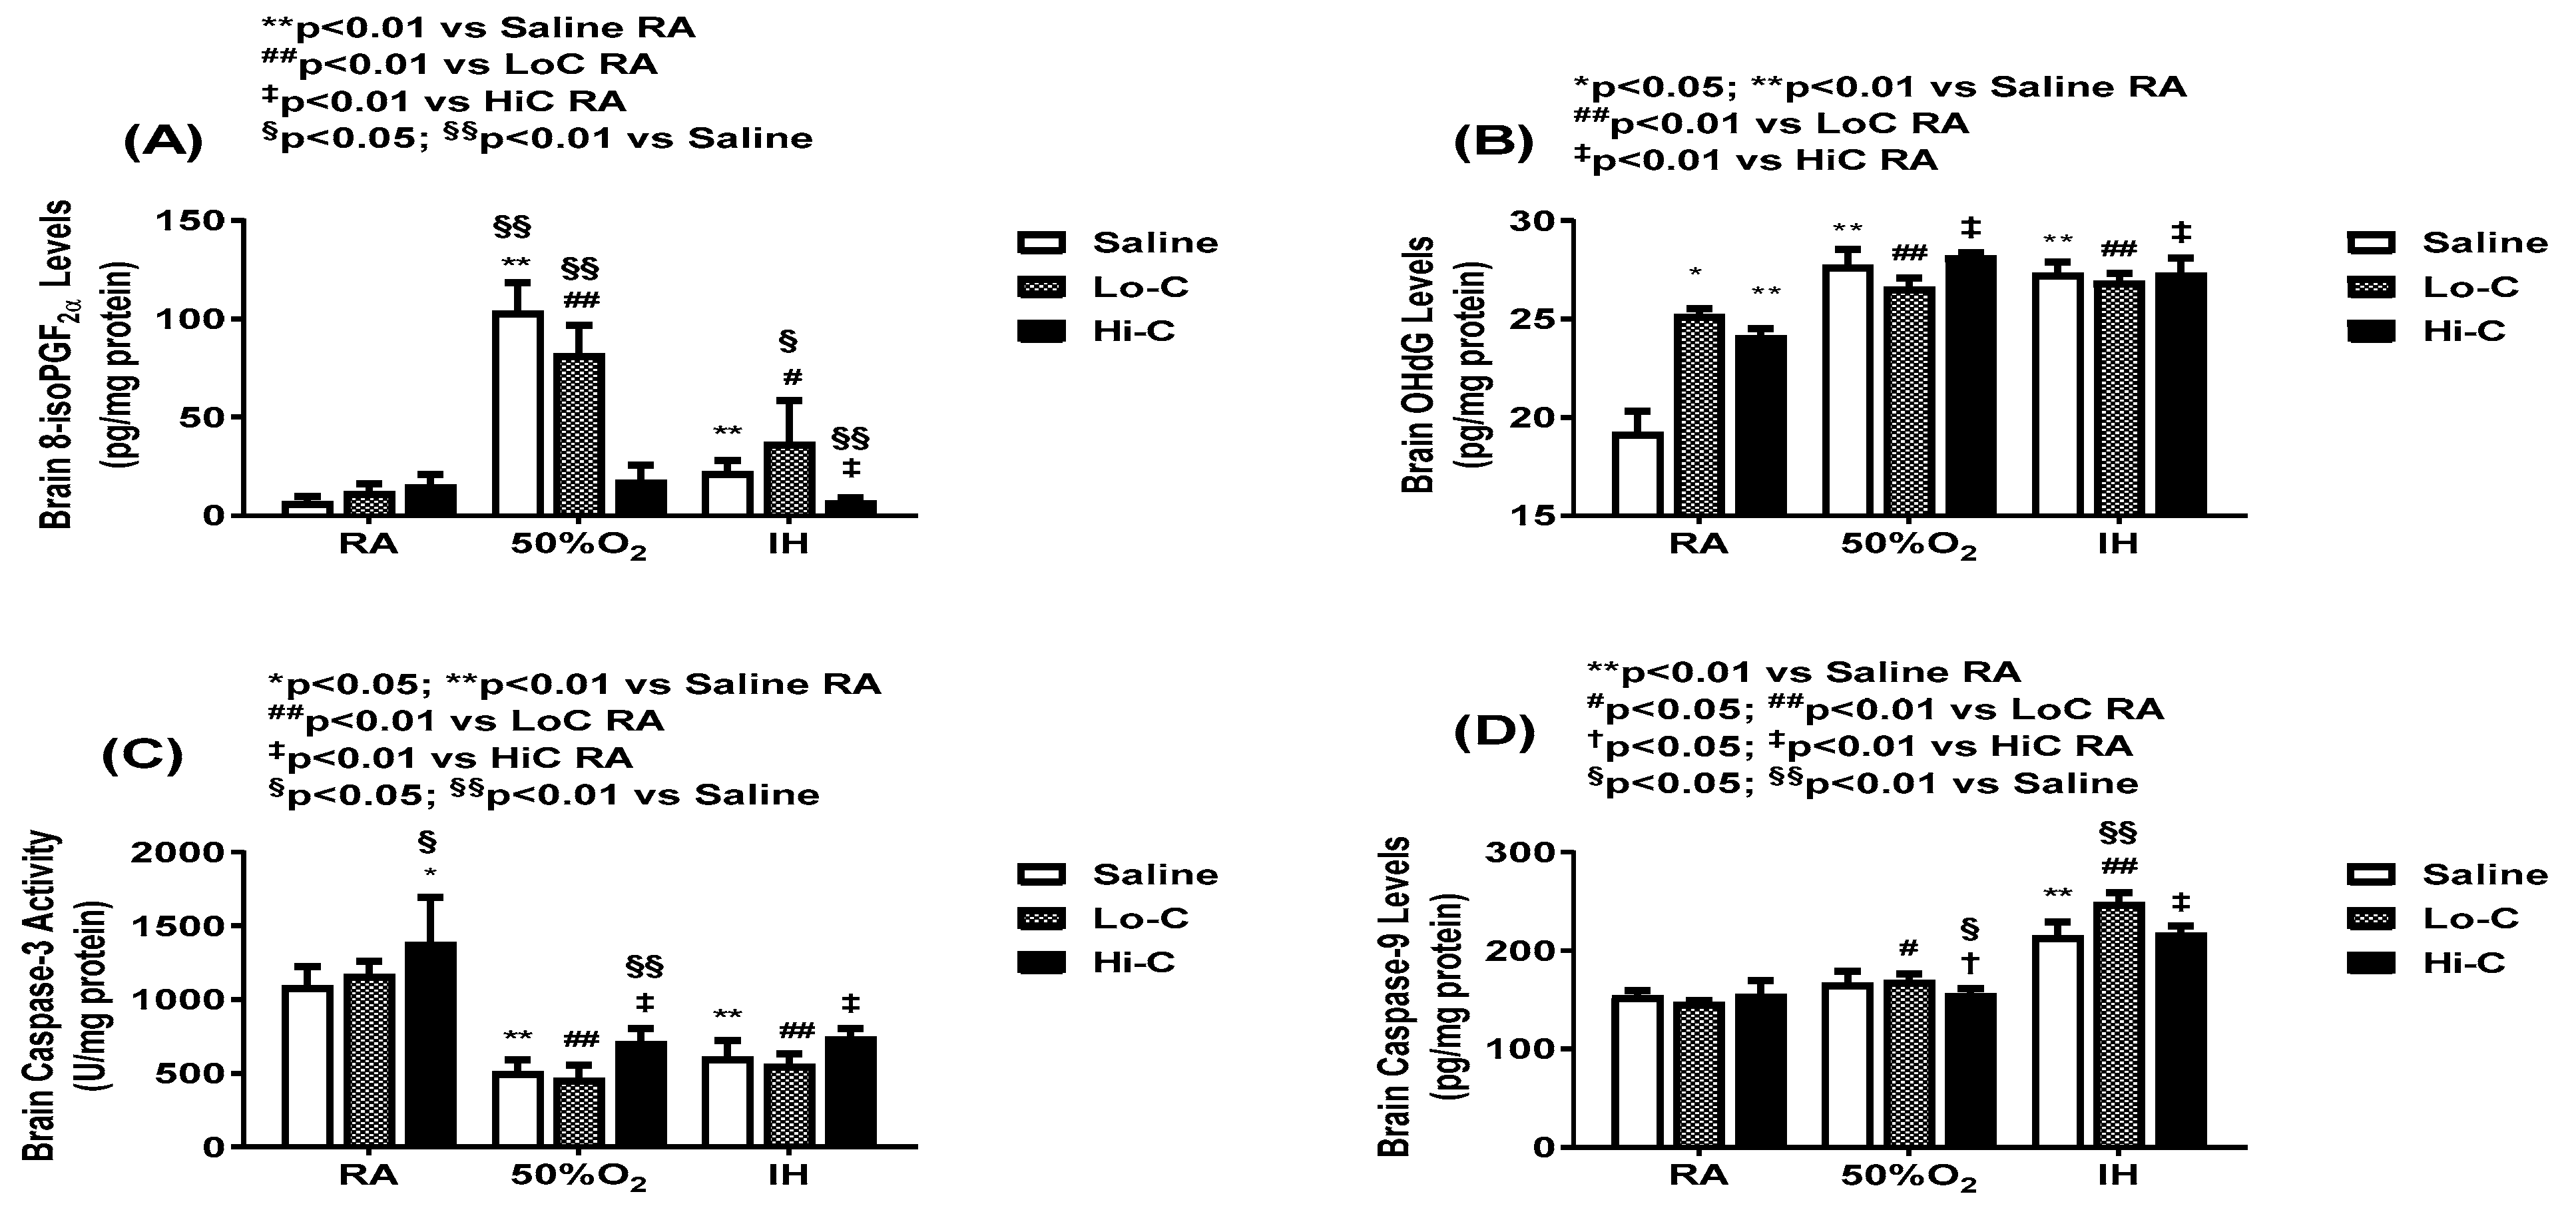
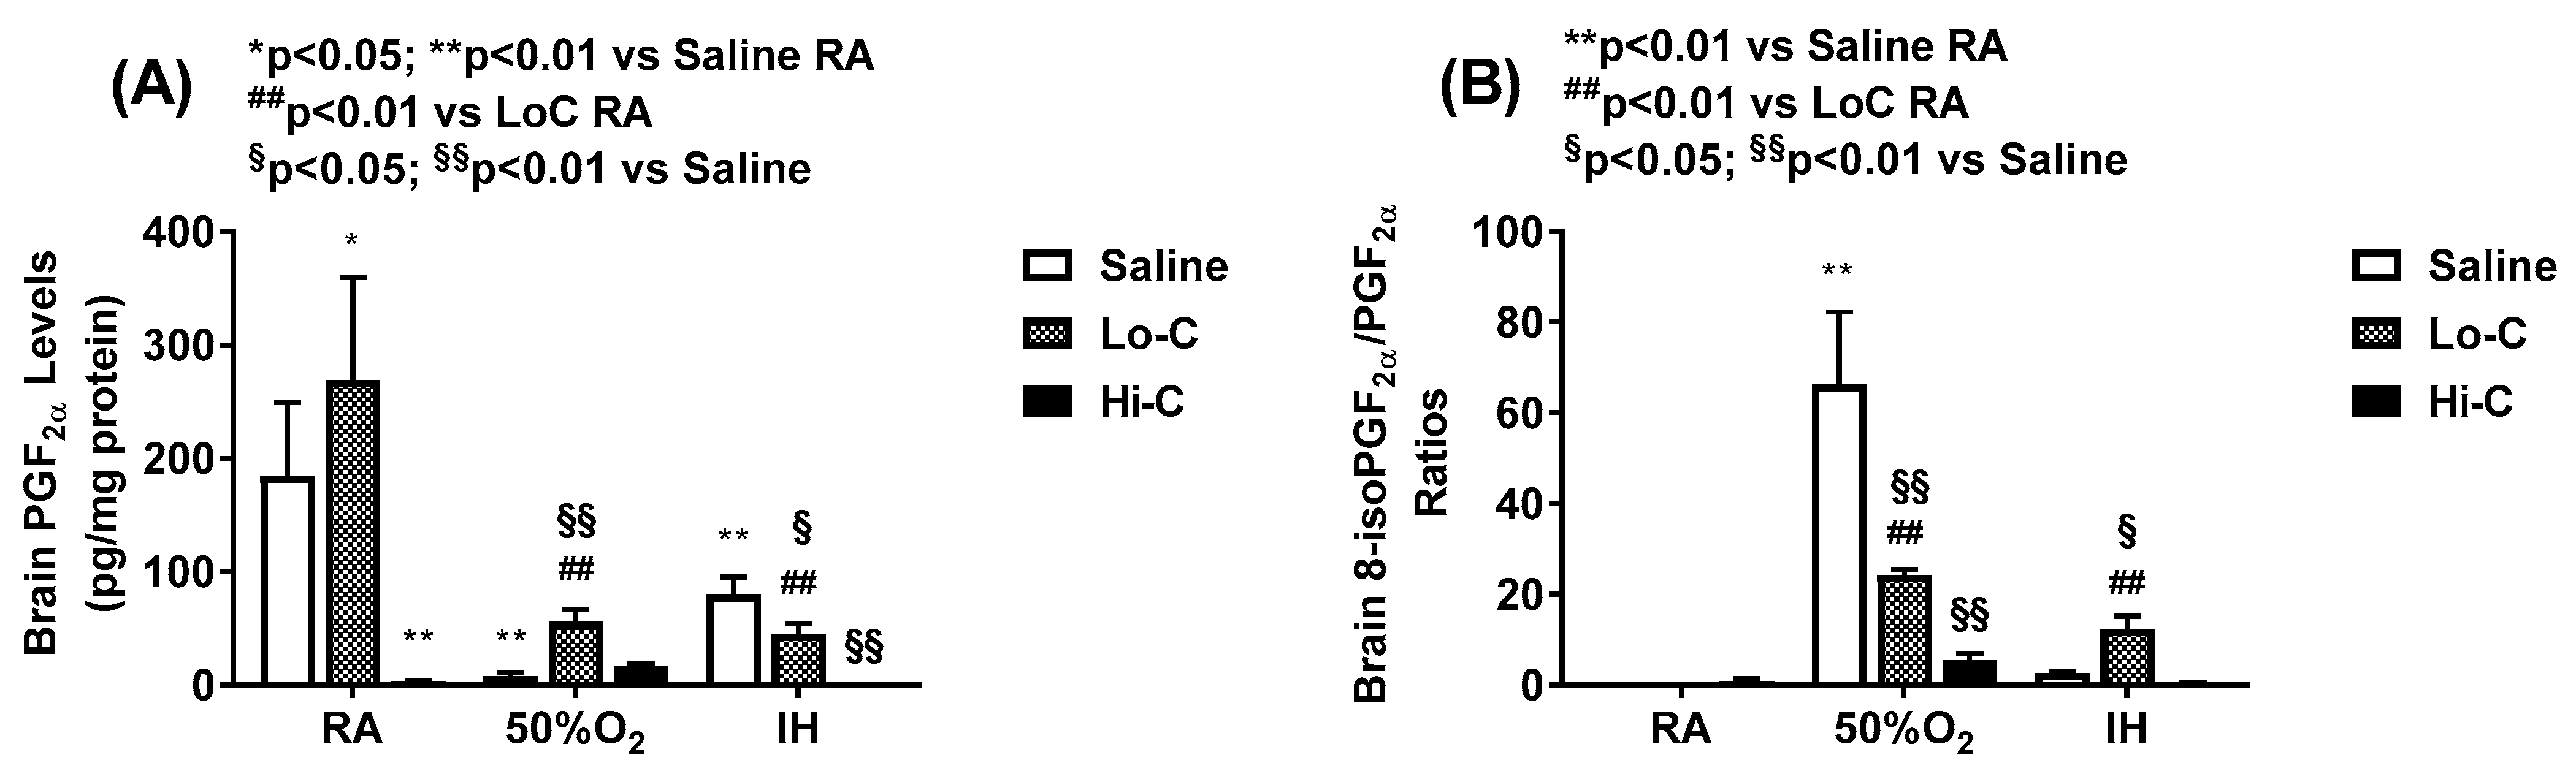
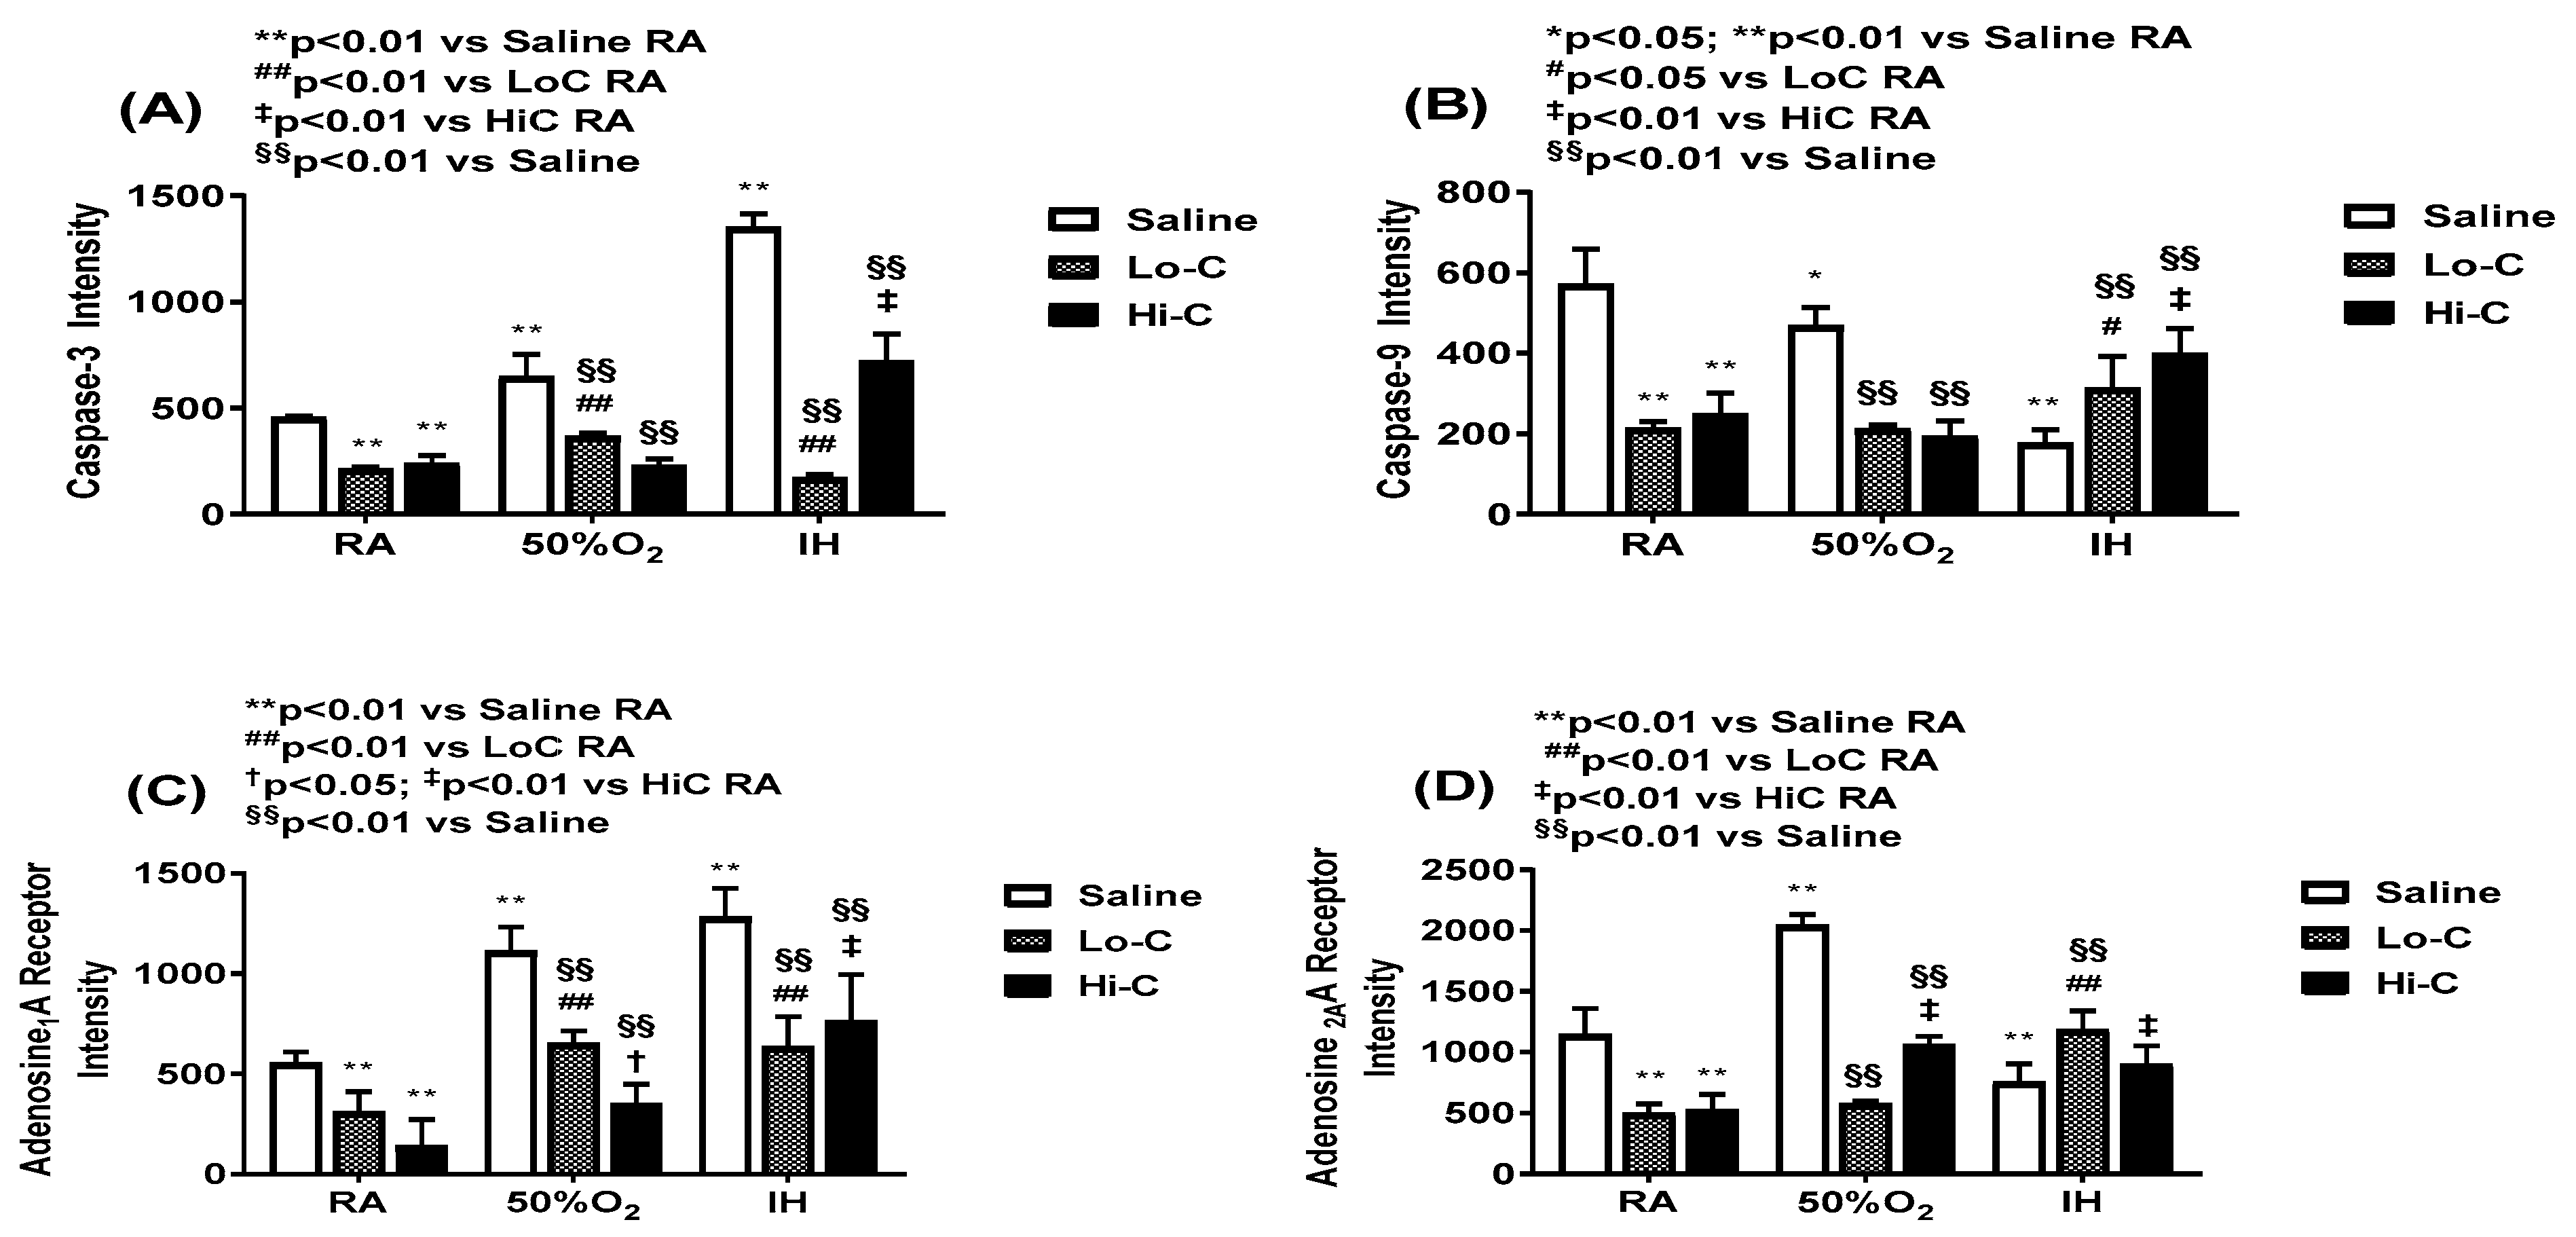
2.4. Oxidative Stress and Apoptosis
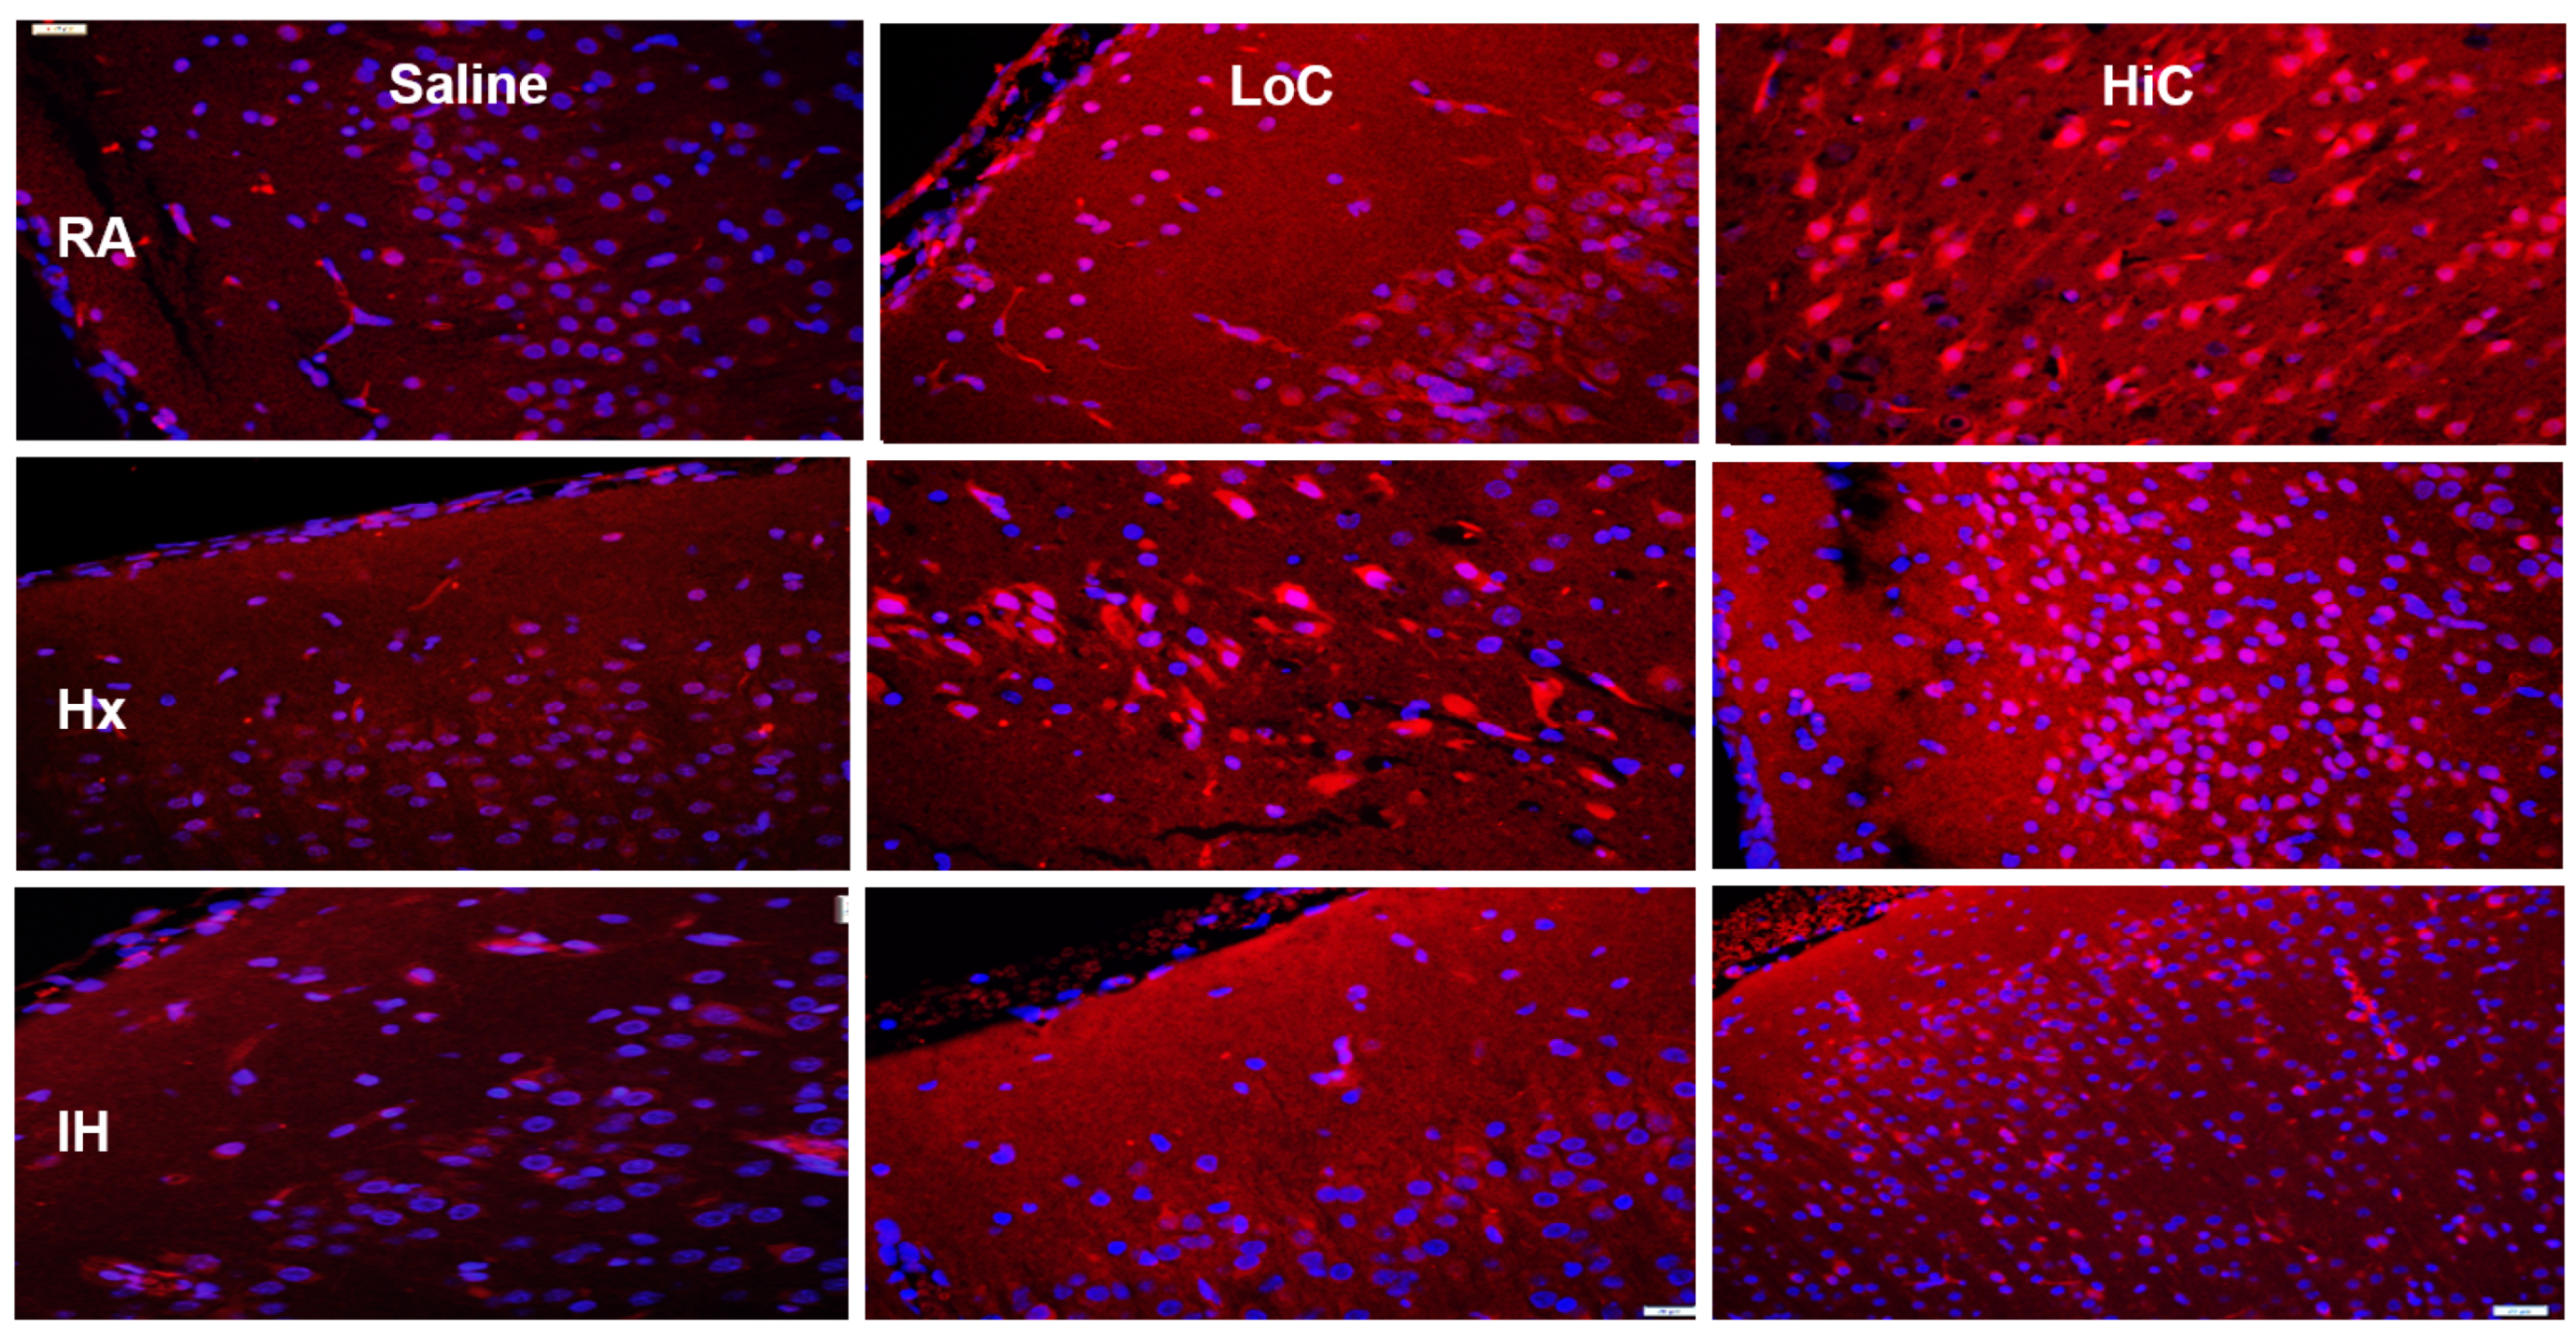
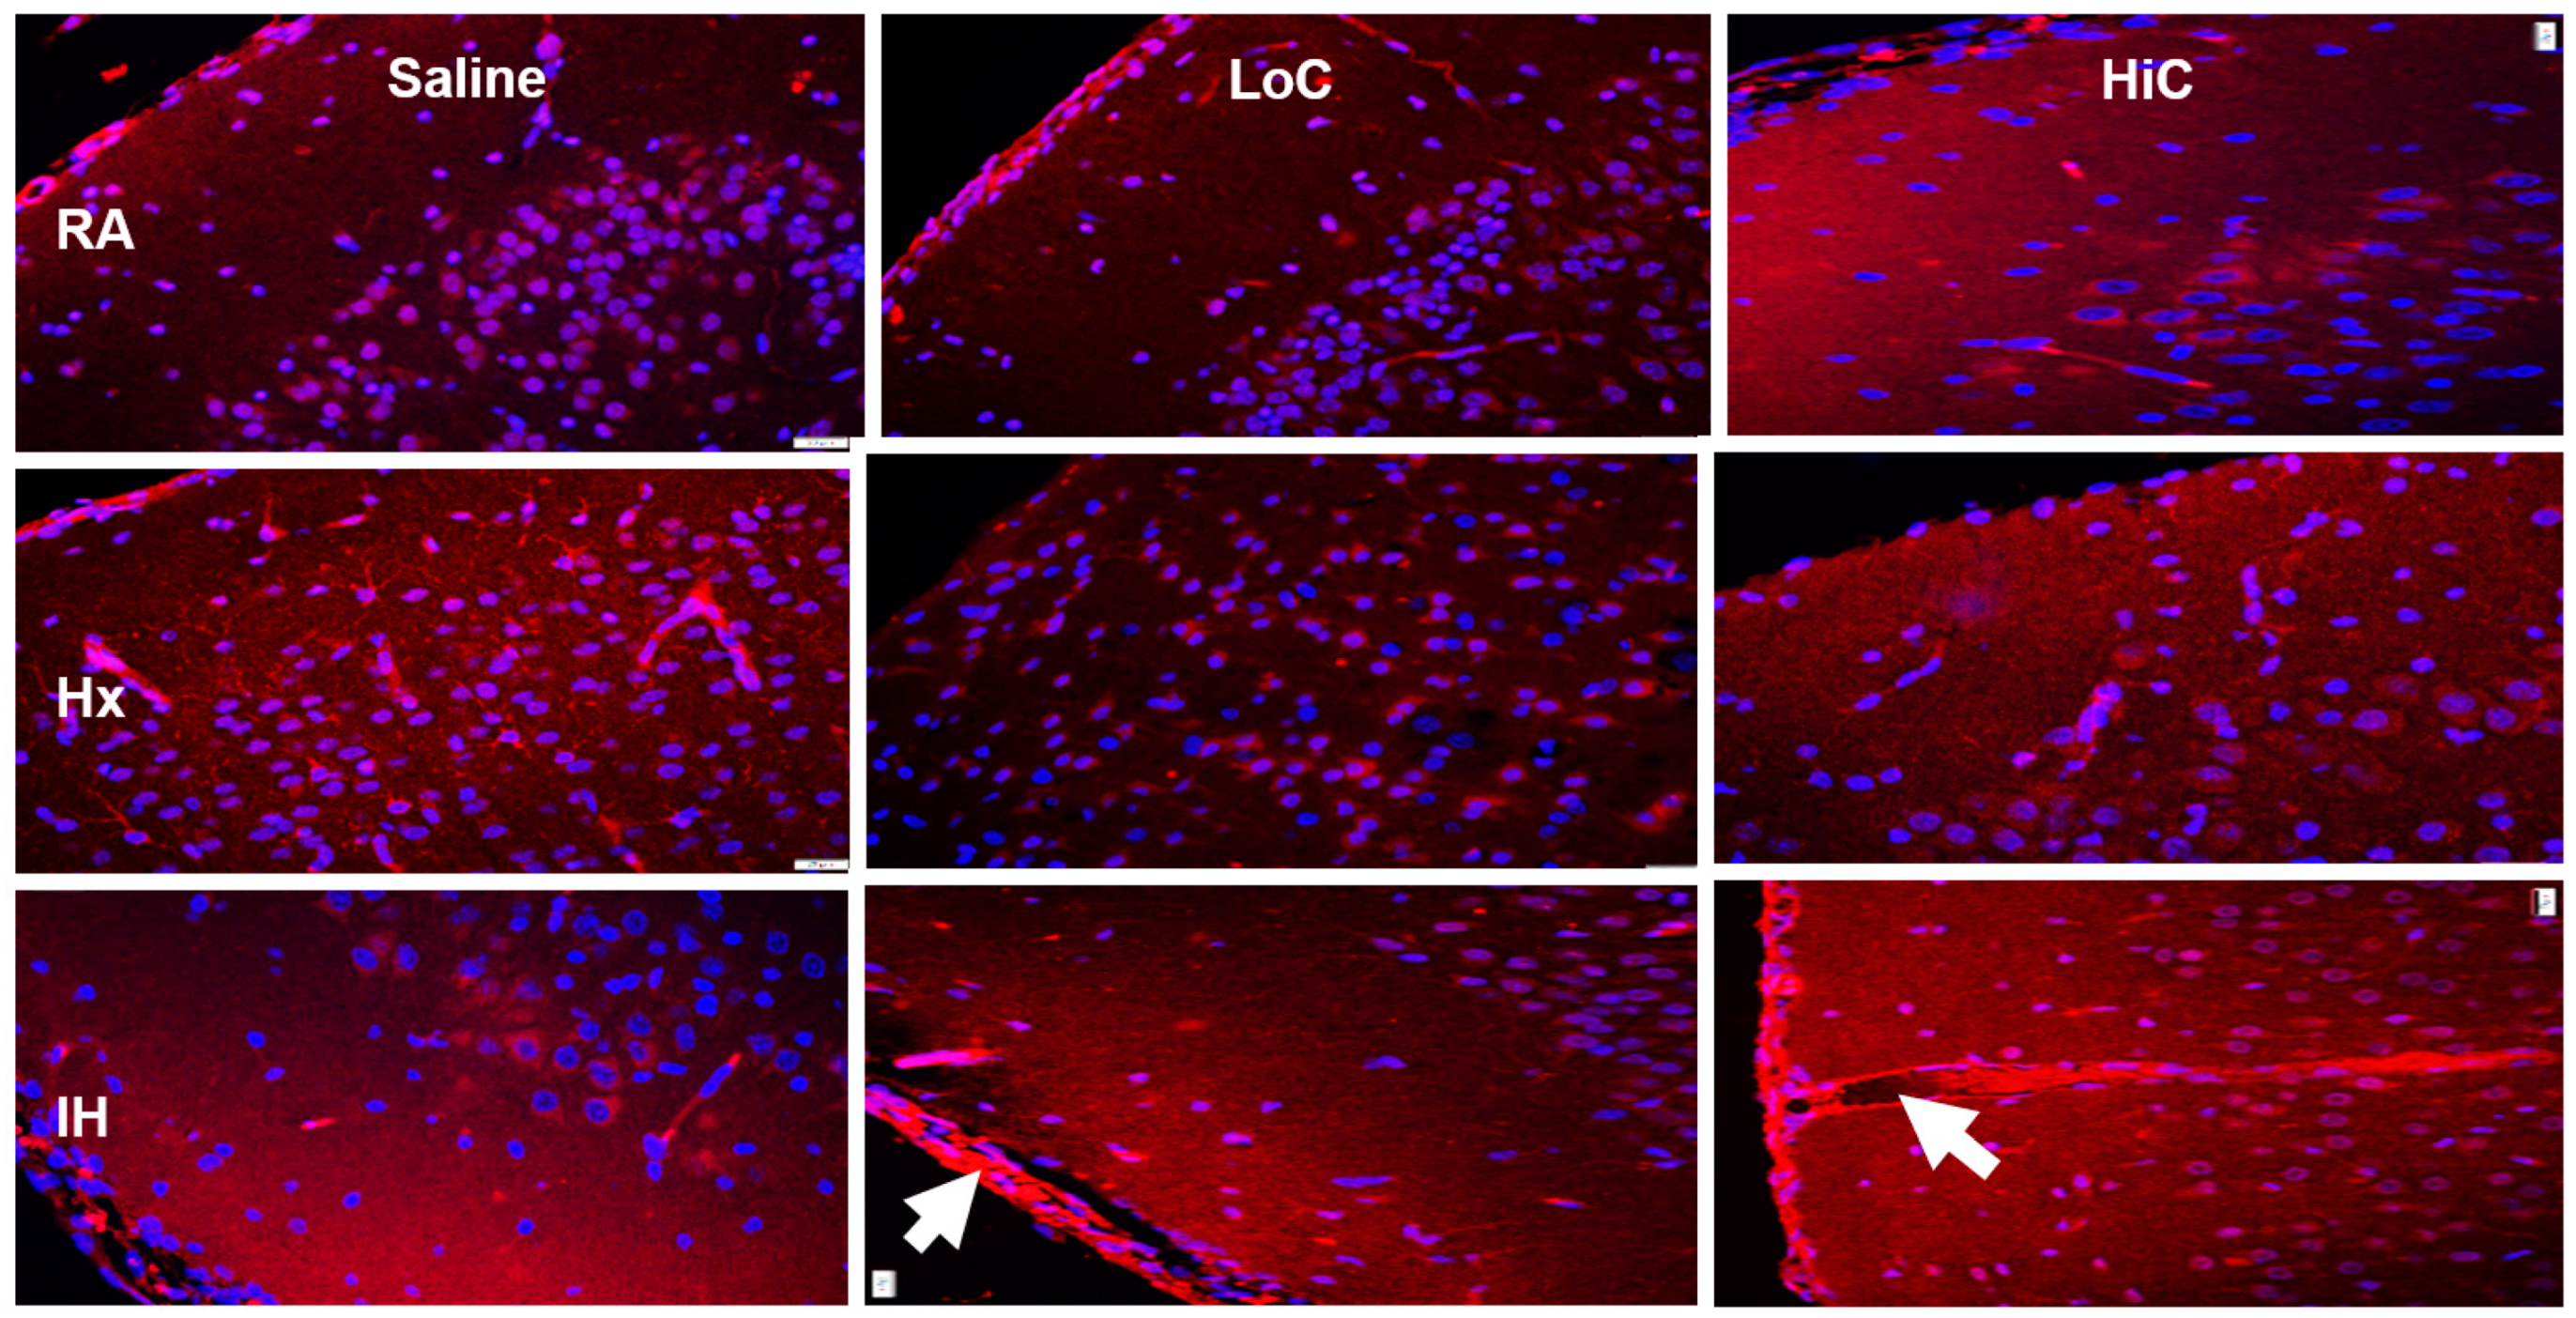
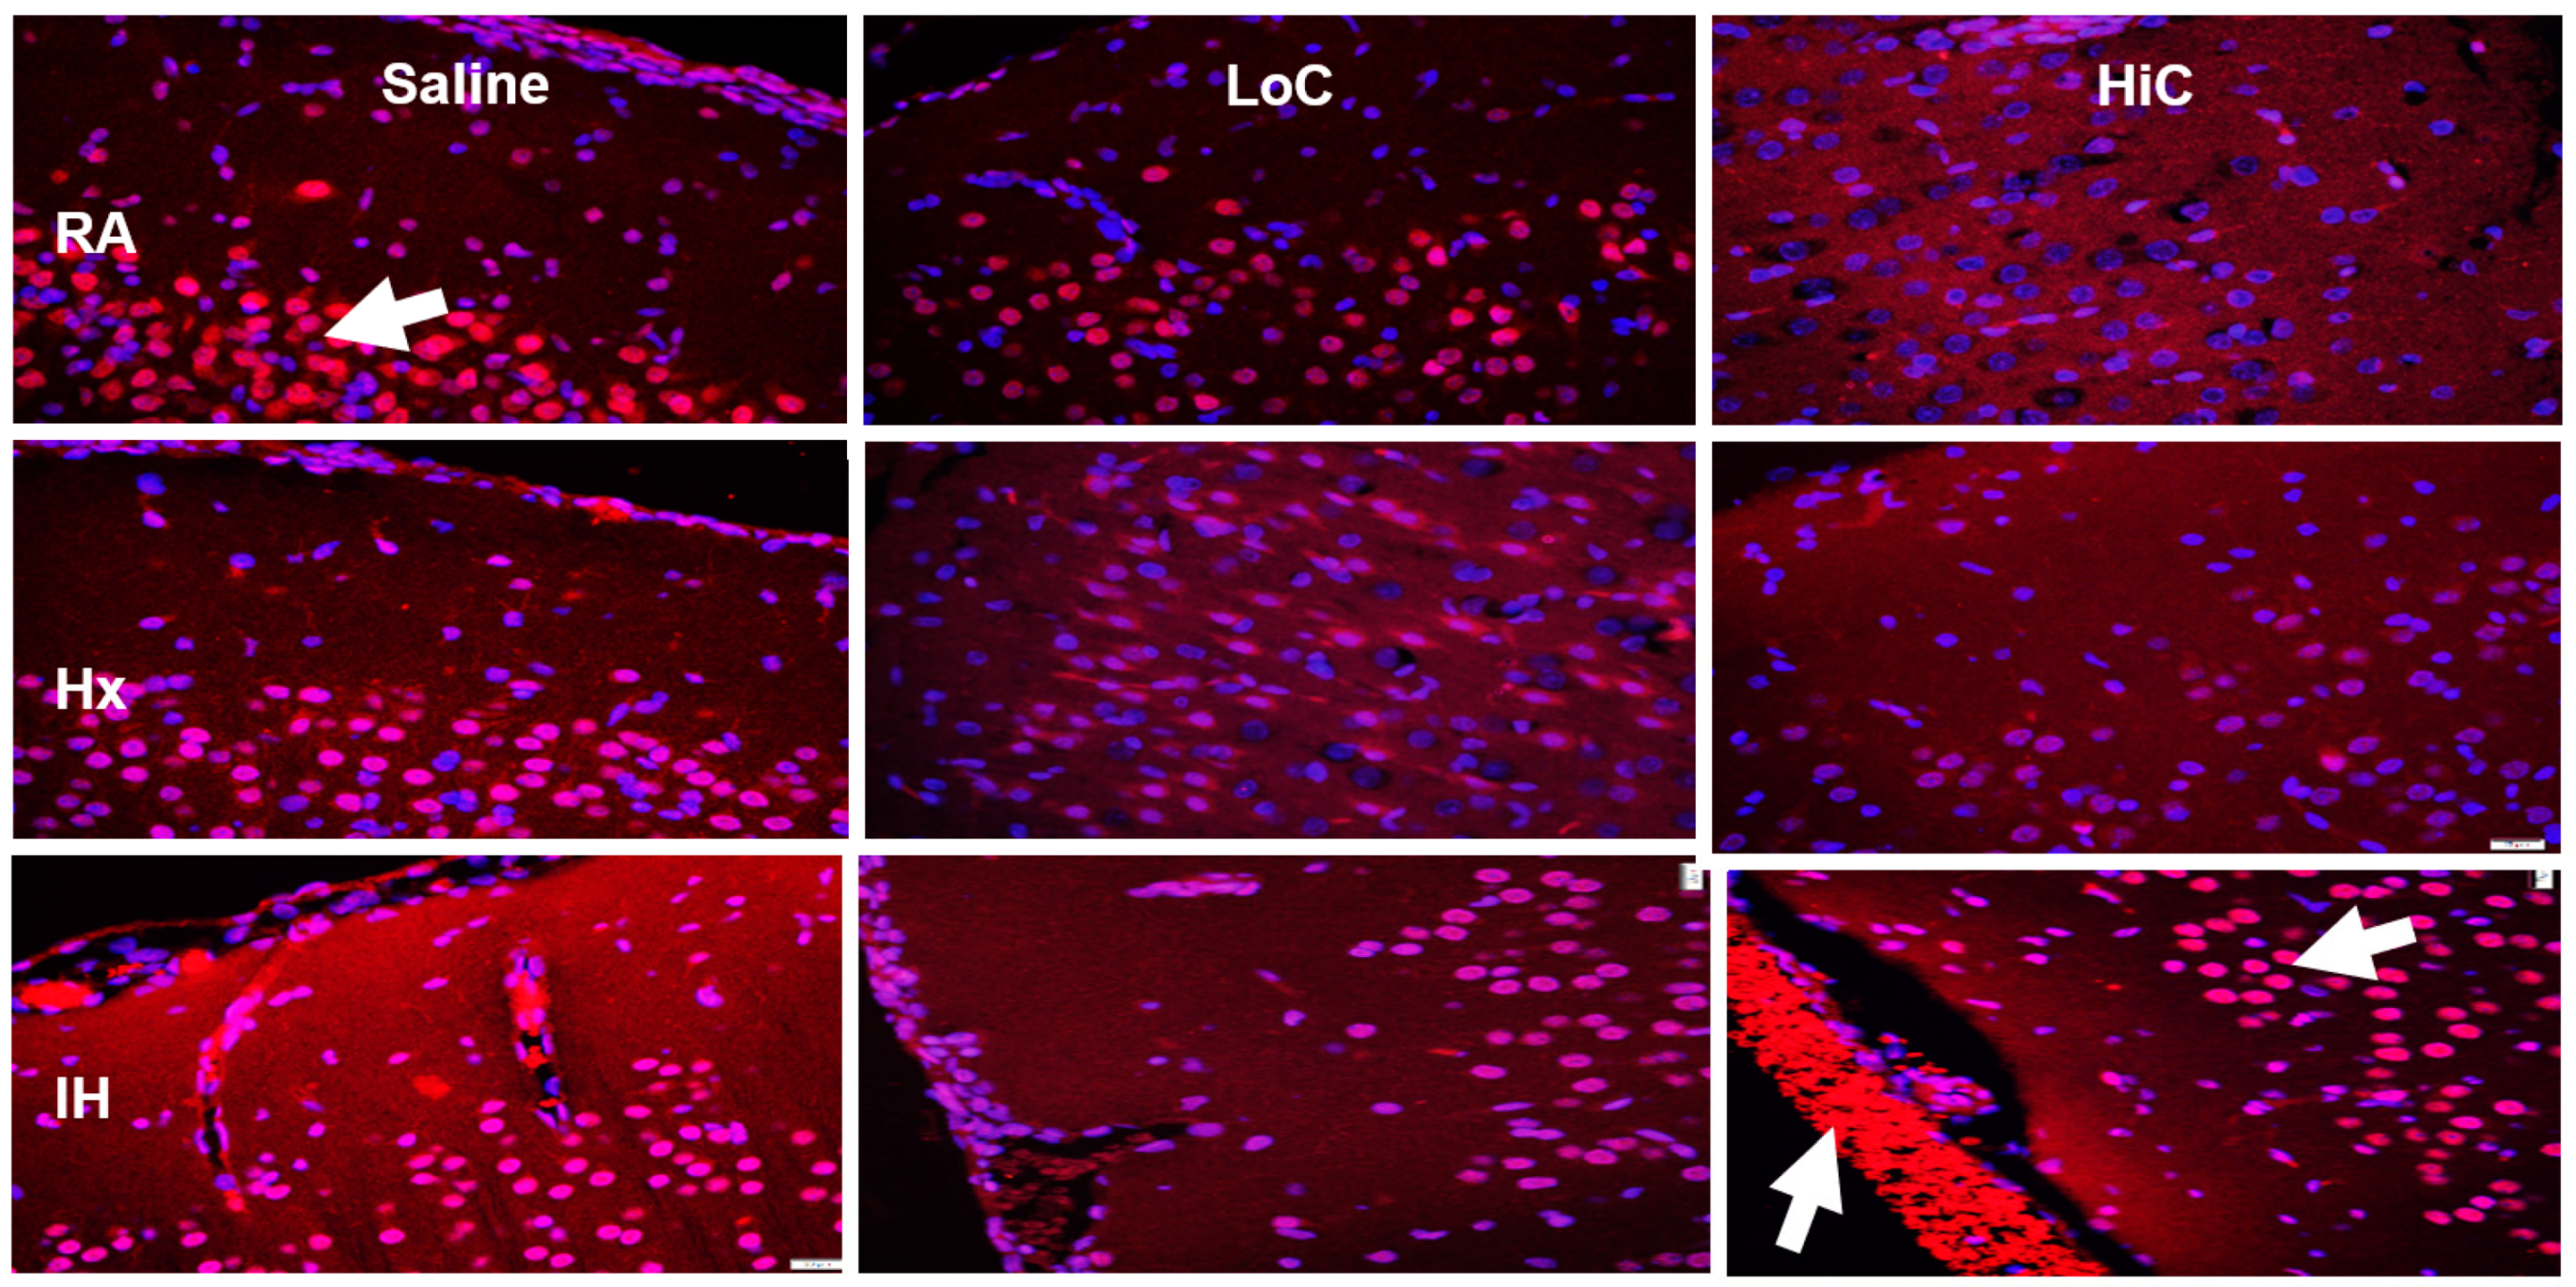
2.5. Immunoreactivity
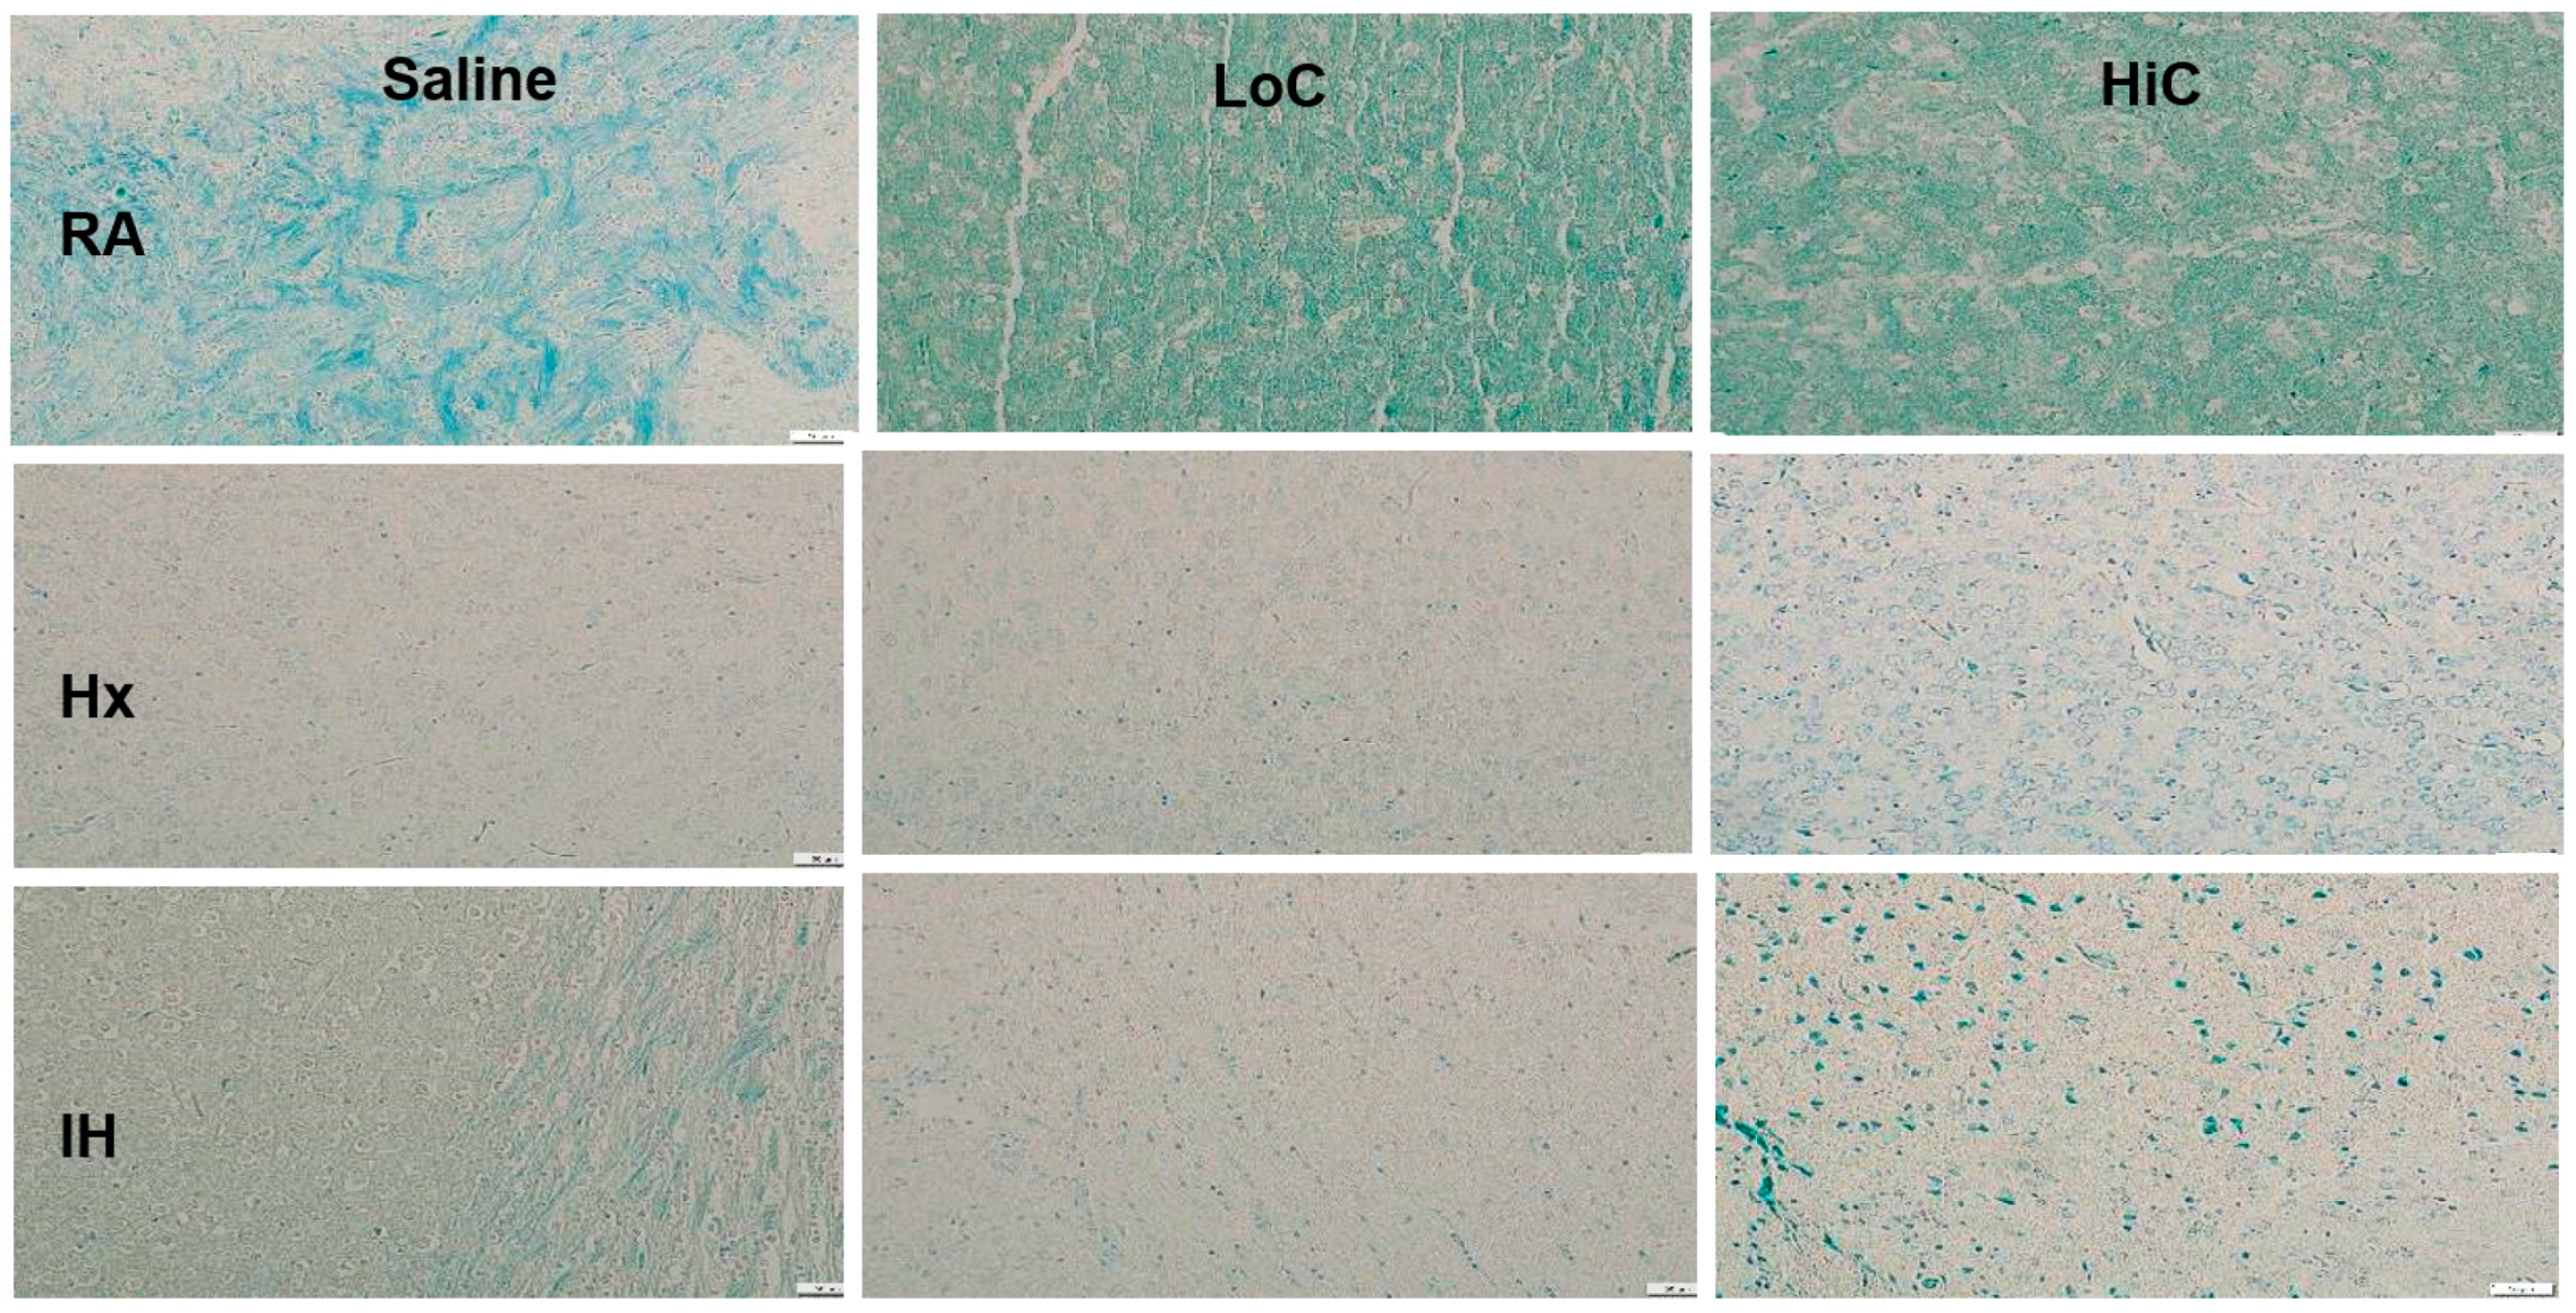
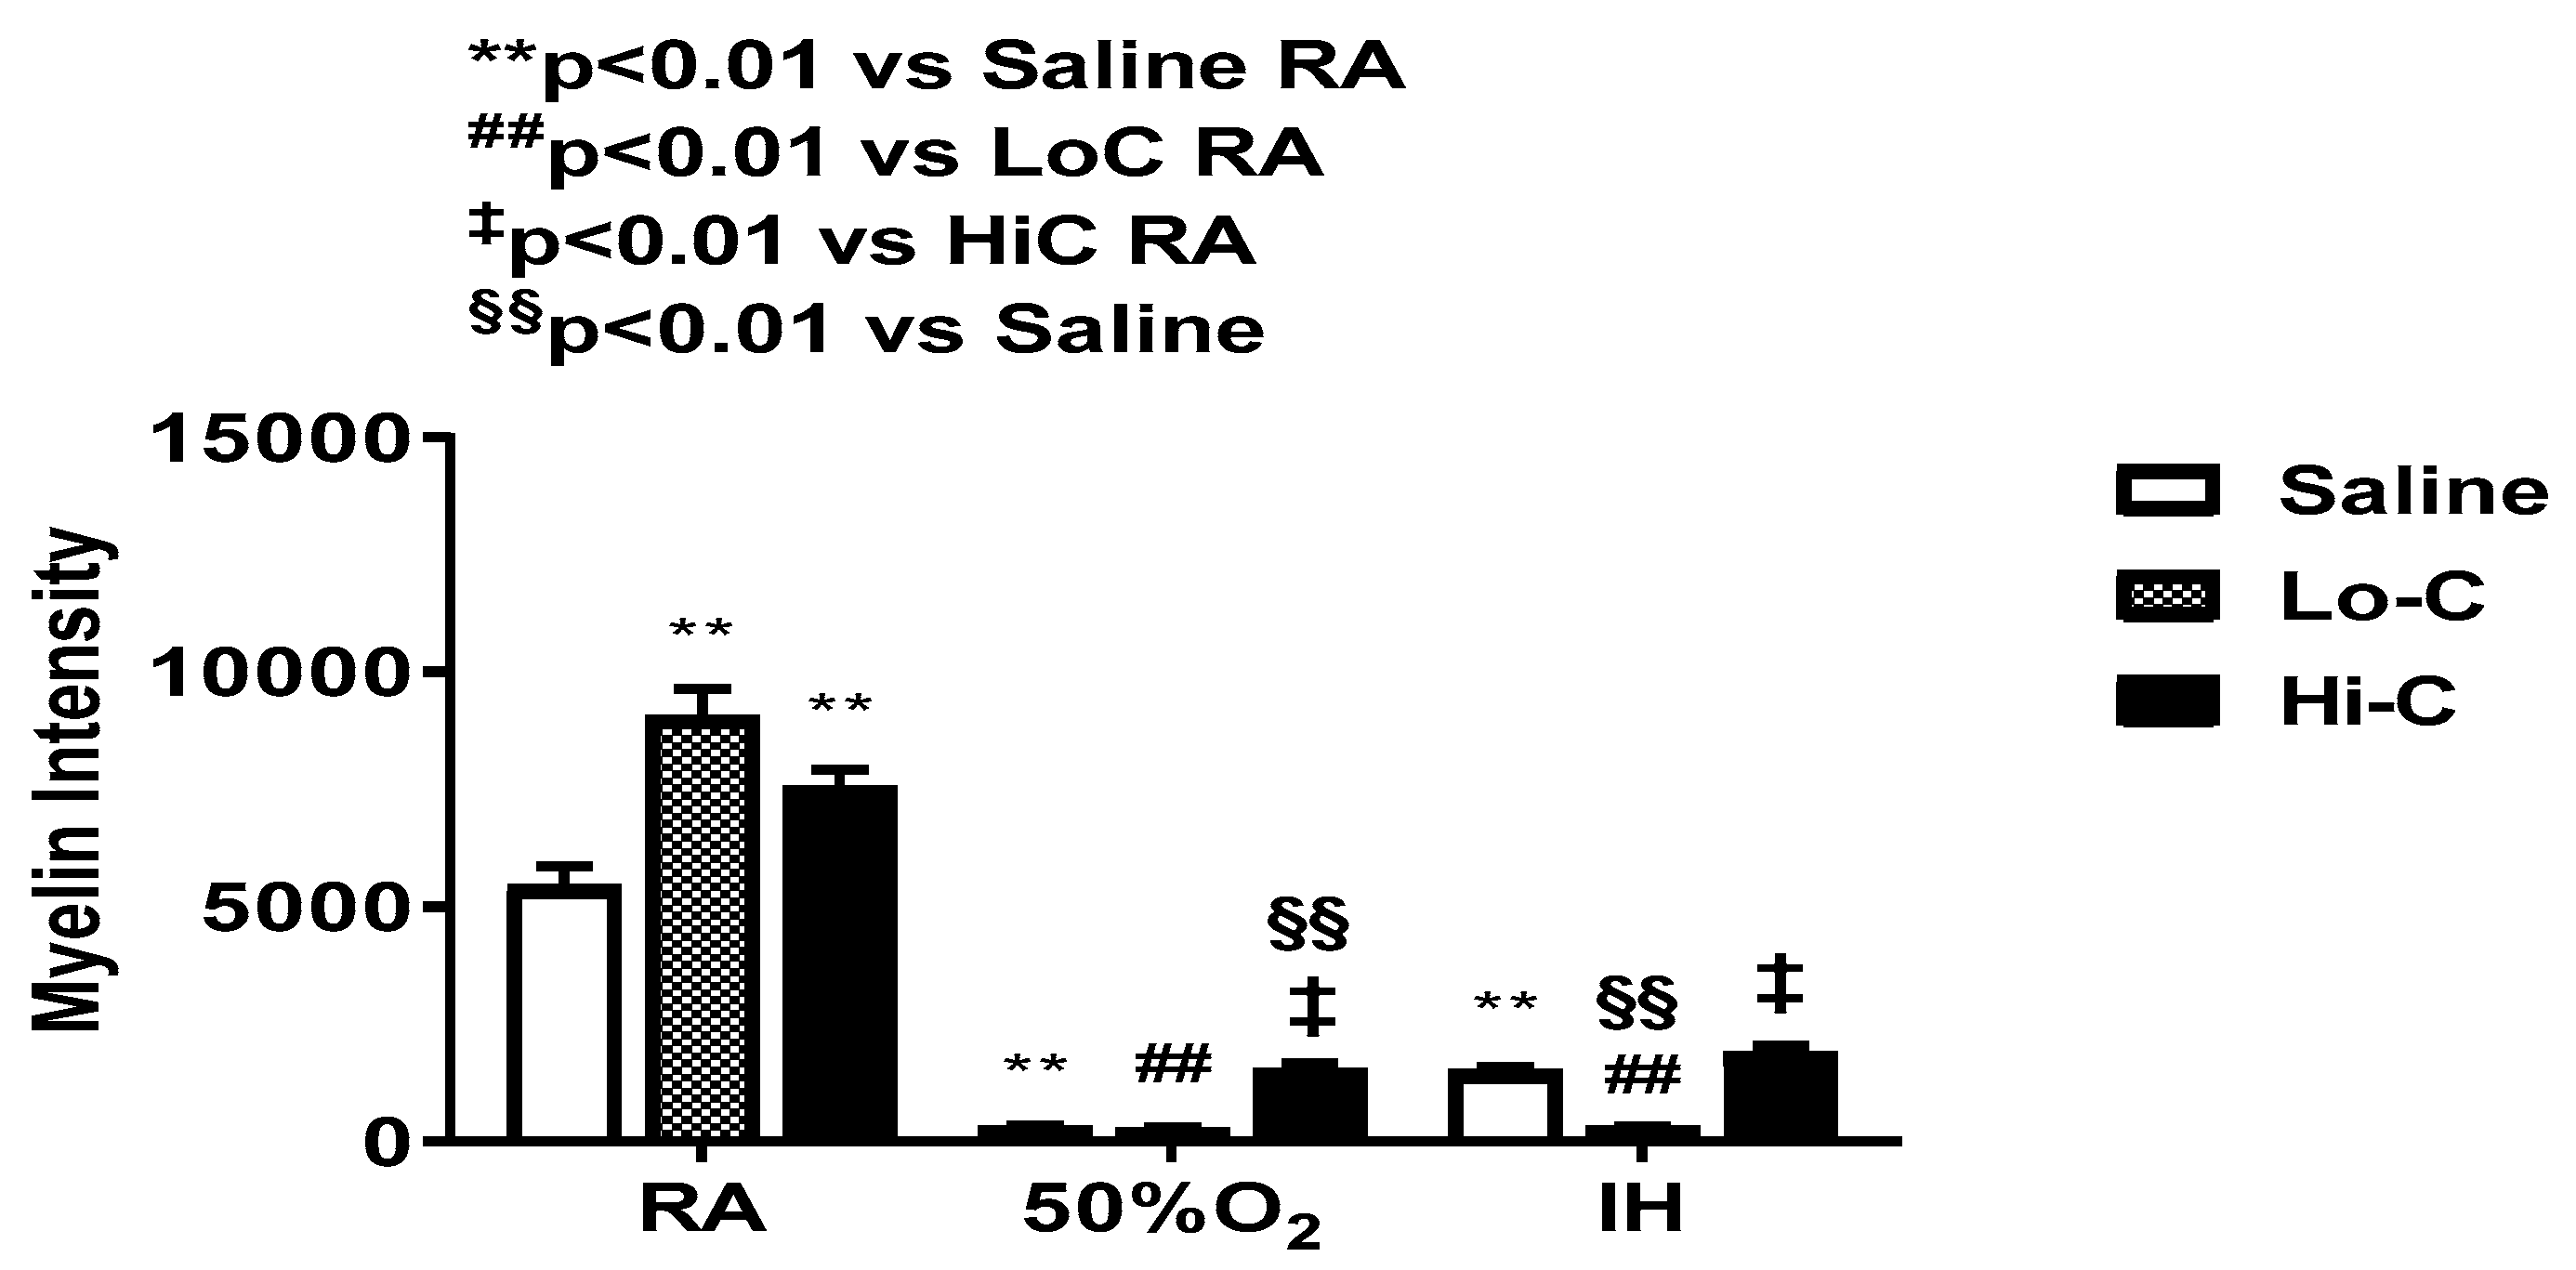
2.6. Myelination
3. Discussion
4. Materials and Methods
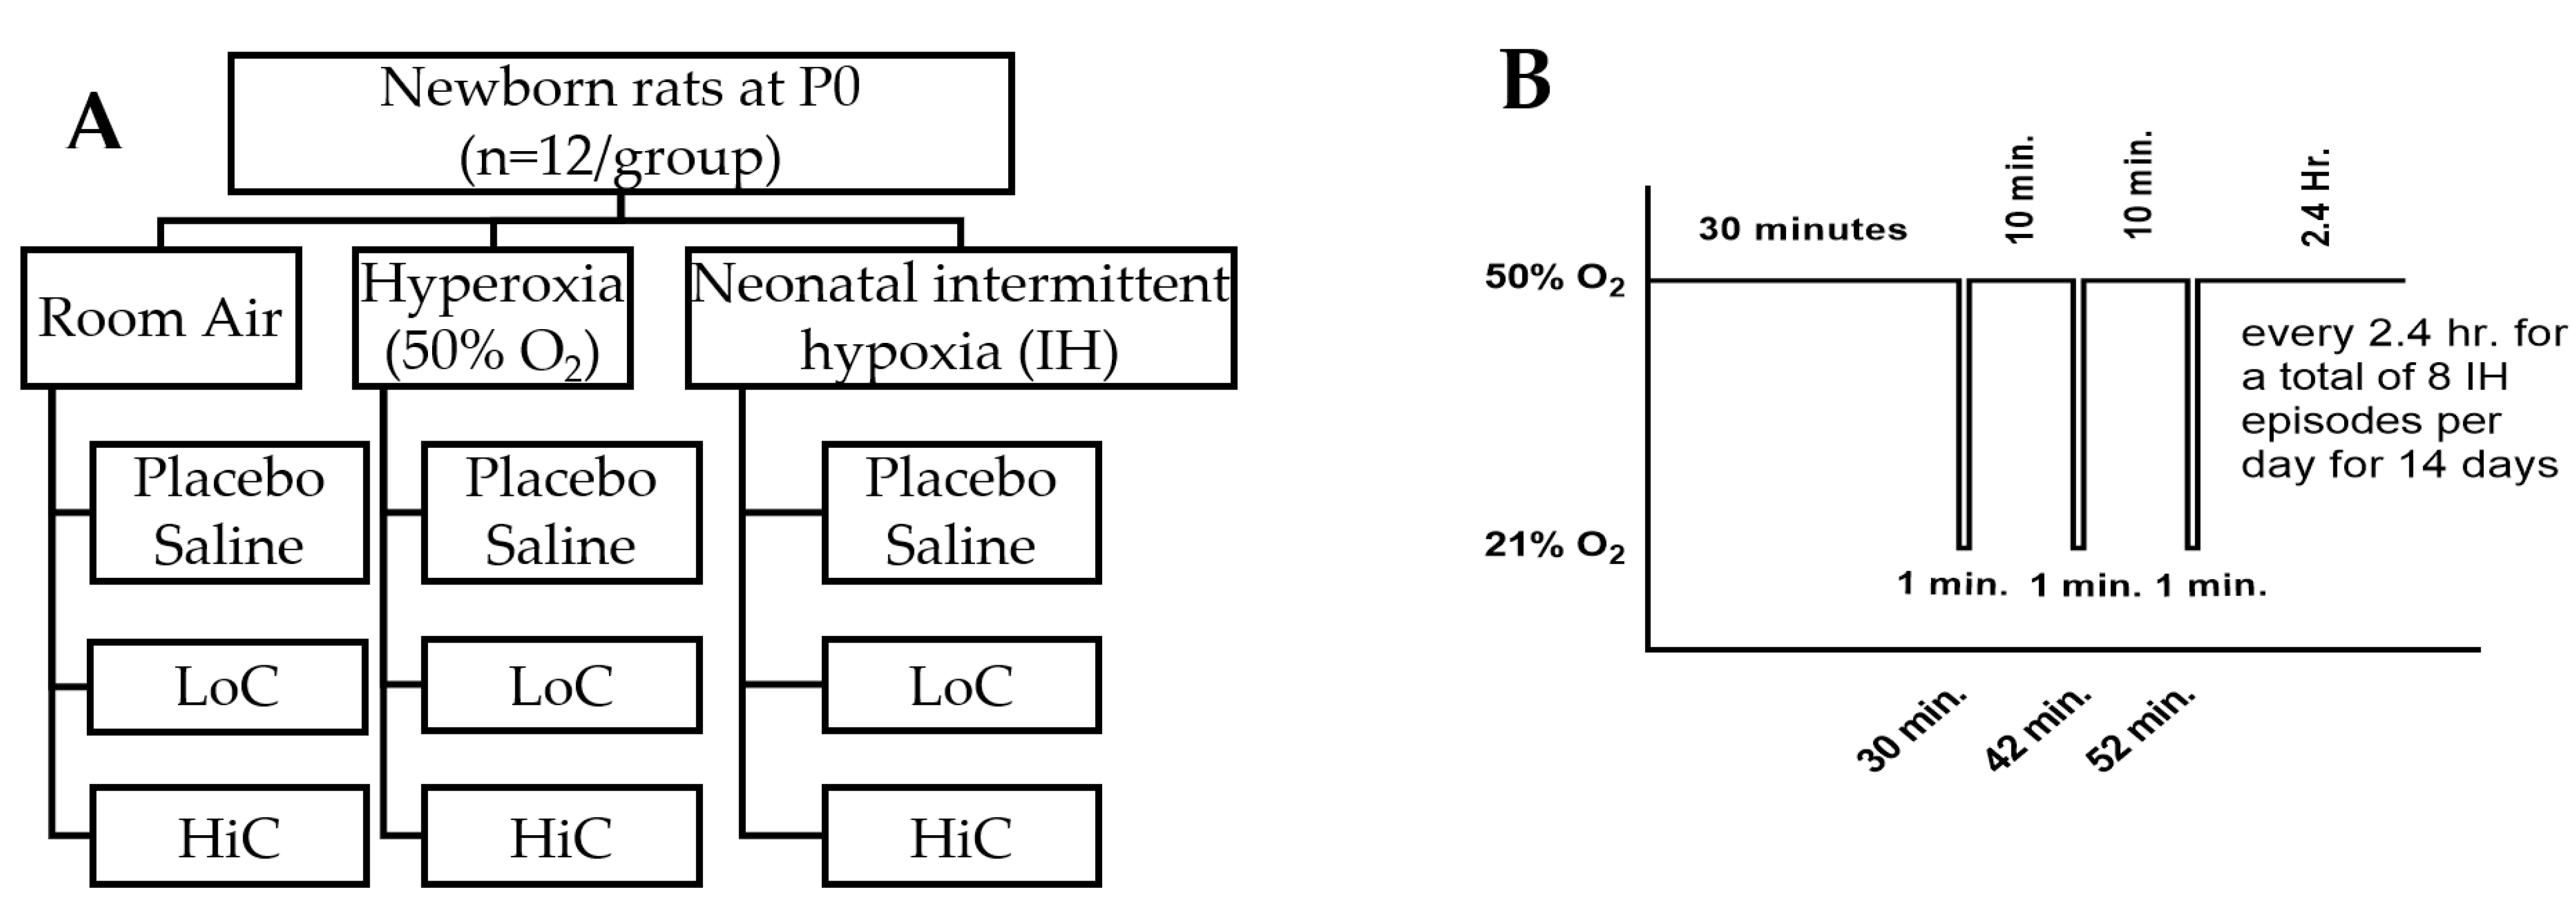
4.1. Experimental Design
4.2. Justification for the Doses of Caffeine
4.3. Intermittent Hypoxia Profile
4.4. Sample Collection
4.5. 8-isoPGF2α, PGF2α and 8-OHdG
4.6. Caspase-3 and -9
4.7. Total Cellular Protein Levels
4.8. Histopathology
4.9. Myelin Stain
4.10. Golgi Staining
4.11. Morphometric Analyses
4.12. Immunofluorescence (IF) Staining
4.13. Statistical Analyses
5. Conclusions
Supplementary Materials
Author Contributions
Funding
Institutional Review Board Statement
Informed Consent Statement
Data Availability Statement
Conflicts of Interest
References
- Rhein, L.M.; Dobson, N.R.; Darnall, R.A.; Corwin, M.J.; Heeren, T.C.; Poets, C.F.; McEntire, B.L.; Hunt, C.E.; Caffeine Pilot Study Group. Effects ofcaffeineon intermittent hypoxia in infants born prematurely: A randomized clinical trial. JAMA Pediatr. 2014, 168, 250–257. [Google Scholar] [CrossRef] [PubMed]
- Di Fiore, J.M.; Vento, M. Intermittent hypoxemia and oxidative stress in preterm infants. Respir. Physiol. Neurobiol. 2019, 266, 121–129. [Google Scholar] [CrossRef] [PubMed]
- Eichenwald, E.C.; Committee on Fetus and Newborn, American Academy of Pediatrics. Apnea of Prematurity. Pediatrics 2015, 137, e20153757. [Google Scholar] [CrossRef] [PubMed] [Green Version]
- Stokowski, L.A. A primer on Apnea of prematurity. Adv. Neonatal Care 2005, 5, 155–170. [Google Scholar] [CrossRef]
- Martin, R.J.; Di Fiore, J.M.; Macfarlane, P.M.; Wilson, C.G. Physiologic basis forintermittenthypoxic episodes in preterm infants. Adv. Exp. Med. Biol. 2012, 758, 351–358. [Google Scholar]
- Pillekamp, F.; Hermann, C.; Keller, T.; Von Gontard, A.; Kribs, A.; Roth, B. Factors Influencing Apnea and Bradycardia of Prematurity—Implications for Neurodevelopment. Neonatology 2006, 91, 155–161. [Google Scholar] [CrossRef]
- Janvier, A.; Khairy, M.; Kokkotis, A.; Cormier, C.; Messmer, D.; Barrington, K.J. Apnea Is Associated with Neurodevelopmental Impairment in Very Low Birth Weight Infants. J. Perinatol. 2004, 24, 763–768. [Google Scholar] [CrossRef] [Green Version]
- Oorschot, D.E.; Voss, L.; Covey, M.V.; Goddard, L.; Huang, W.; Birchall, P.; Bilkey, D.K.; Kohe, S.E. Spectrum of Short- and Long-Term Brain Pathology and Long-Term Behavioral Deficits in Male Repeated Hypoxic Rats Closely Resembling Human Extreme Prematurity. J. Neurosci. 2013, 33, 11863–11877. [Google Scholar] [CrossRef] [Green Version]
- Cai, J.; Tuong, C.M.; Zhang, Y.; Shields, C.B.; Guo, G.; Fu, H.; Gozal, D. Mouse intermittent hypoxia mimicking apnoea of prematurity: Effects on myelinogenesis and axonal maturation. J. Pathol. 2011, 226, 495–508. [Google Scholar] [CrossRef] [PubMed] [Green Version]
- Juliano, C.; Sosunov, S.; Niatsetskaya, Z.; Isler, J.A.; Utkina-Sosunova, I.; Jang, I.; Ratner, V.; Ten, V. Mild intermittent hy-poxemia in neonatal mice causes permanent neurofunctional deficit and white matter hypomyelination. Exp. Neurol. 2015, 264, 33–42. [Google Scholar] [CrossRef] [PubMed]
- Torres-Cuevas, I.; Parra-Llorca, A.; Sánchez-Illana, A.; Nuñez-Ramiro, A.; Kuligowski, J.; Cháfer-Pericás, C.; Cernada, M.; Escobar, J.; Vento, M. Oxygen and oxidative stress in the perinatal period. Redox Biol. 2017, 12, 674–681. [Google Scholar] [CrossRef]
- Perez, M.; Robbins, M.E.; Revhaug, C.; Saugstad, O.D. Oxygen radical disease in the newborn, revisited: Oxidative stress and disease in the newborn period. Free. Radic. Biol. Med. 2019, 142, 61–72. [Google Scholar] [CrossRef]
- Back, S.A. White matter injury in the preterm infant: Pathology and mechanisms. Acta Neuropathol. 2017, 134, 331–349. [Google Scholar] [CrossRef] [PubMed]
- Panfoli, I.; Candiano, G.; Malova, M.; De Angelis, L.; Cardiello, V.; Buonocore, G.; Ramenghi, L.A. Oxidative Stress as a Primary Risk Factor for Brain Damage in Preterm Newborns. Front. Pediatr. 2018, 6, 369. [Google Scholar] [CrossRef] [Green Version]
- Piccirillo, S.; Castaldo, P.; Macrì, M.L.; Amoroso, S.; Magi, S. Glutamate as a potential “survival factor” in an in vitro model of neuronal hypoxia/reoxygenation injury: Leading role of the Na+/Ca2+ exchanger. Cell Death Dis. 2018, 9, 1–14. [Google Scholar] [CrossRef] [PubMed]
- Boutilier, R.G. Mechanisms of cell survival in hypoxia and hypothermia. J. Exp. Biol. 2001, 204, 3171–3181. [Google Scholar]
- Matsushita, Y.; Shima, K.; Nawashiro, H.; Wada, K. Real-Time Monitoring of Glutamate Following Fluid Percussion Brain Injury With Hypoxia in the Rat. J. Neurotrauma 2000, 17, 143–153. [Google Scholar] [CrossRef]
- Dale, N.; Pearson, T.; Frenguelli, B.G. Direct measurement of adenosine release during hypoxia in the CA1 region of the rat hippocampal slice. J. Physiol. 2000, 526, 143–155. [Google Scholar] [CrossRef]
- Pedata, F.; Corsi, C.; Melani, A.; Bordoni, F.; Latini, S. Adenosine extracellular brain concentrations and role of A2A receptors in ischemia. Ann. N. Y. Acad. Sci. 2006, 939, 74–84. [Google Scholar] [CrossRef]
- Koos, B.J. Adenosine A2a receptors and O2 sensing in development. Am. J. Physiol. Integr. Comp. Physiol. 2011, 301, R601–R622. [Google Scholar] [CrossRef] [PubMed] [Green Version]
- Ouyang, X.; Ghani, A.; Malik, A.; Wilder, T.; Colegio, O.R.; Flavell, R.A.; Cronstein, B.N.; Mehal, W.Z. Adenosine is required for sustained inflammasome activation via the A₂A receptor and the HIF-1α pathway. Nat. Commun. 2013, 4, 2909. [Google Scholar] [CrossRef] [Green Version]
- Colella, M.; Zinni, M.; Pansiot, J.; Cassanello, M.; Mairesse, J.; Ramenghi, L.; Baud, O. Modulation of Microglial Activation by Adenosine A2a Receptor in Animal Models of Perinatal Brain Injury. Front. Neurol. 2018, 9, 605. [Google Scholar] [CrossRef]
- Yang, Z.-J.; Wang, B.; Kwansa, H.; Heitmiller, K.D.; Hong, G.; Carter, E.L.; Jamrogowicz, J.L.; Larson, A.C.; Martin, L.J.; Koehler, R.C. Adenosine A2A Receptor Contributes to Ischemic Brain Damage in Newborn Piglet. Br. J. Pharmacol. 2013, 33, 1612–1620. [Google Scholar] [CrossRef] [PubMed] [Green Version]
- Laudignon, N.; Farri, E.; Beharry, K.; Rex, J.; Aranda, J.V. Influence of adenosine on cerebral blood flow during hypoxic hypoxia in the newborn piglet. J. Appl. Physiol. 1990, 68, 1534–1541. [Google Scholar] [CrossRef]
- Yang, Z.; Zhao, T.-Z.; Zou, Y.-J.; Zhang, J.H.; Feng, H. Hypoxia Induces Autophagic Cell Death through Hypoxia-Inducible Factor 1α in Microglia. PLoS ONE 2014, 9, e96509. [Google Scholar] [CrossRef] [PubMed]
- Aranda, J.V.; Gorman, W.; Bergsteinsson, H.; Gunn, T. Efficacy of caffeine in treatment of apnea in the low-birth-weight infant. J. Pediatr. 1977, 90, 467–472. [Google Scholar] [CrossRef]
- Stevenson, D.K. On the Caffeination of Prematurity. N. Engl. J. Med. 2007, 357, 1967–1968. [Google Scholar] [CrossRef]
- Schmidt, B.; Roberts, R.S.; Davis, P.; Doyle, L.W.; Barrington, K.J.; Ohlsson, A.; Solimano, A.; Tin, W.; Caffeine for Apnea of Prematurity Trial Group. Caffeine therapy for apnea of prematurity. N. Engl. J. Med. 2006, 354, 2112–2121. [Google Scholar] [CrossRef] [Green Version]
- Schmidt, B.; Roberts, R.S.; Davis, P.; Doyle, L.W.; Barrington, K.J.; Ohlsson, A.; Solimano, A.; Tin, W. Long-Term Effects of Caffeine Therapy for Apnea of Prematurity. N. Engl. J. Med. 2007, 357, 1893–1902. [Google Scholar] [CrossRef] [Green Version]
- Schmidt, B.; Roberts, R.S.; Anderson, P.J.; Asztalos, E.V.; Costantini, L.; Davis, P.G.; Dewey, D.; D’Ilario, J.; Doyle, L.W.; Grunau, R.E.; et al. Caffeine for Apnea of Prematurity Trial Group. Academic performance, motor function, and behavior 11 years after neonatal caffeine citrate therapy for apnea of prematurity: An 11-year follow-up of the CAP randomized clinical trial. JAMA Pediatr. 2017, 171, 564–572. [Google Scholar] [CrossRef] [PubMed]
- Daly, J.W.; Shi, D.; Nikodijevic, O.; Jacobson, K.A. The role of adenosine receptors in the central action of caffeine. Pharmacopsychoecologia 2015, 7, 201–213. [Google Scholar]
- Fredholm, B.B.; Arslan, G.; Halldner, L.; Kull, B.; Schulte, G.; Wasserman, W. Structure and function of adenosine receptors and their genes. Naunyn Schmiedeberg. Arch. Pharmacol. 2000, 362, 364–374. [Google Scholar] [CrossRef]
- Kolahdouzan, M.; Hamadeh, M.J. The neuroprotective effects of caffeine in neurodegenerative diseases. CNS Neurosci. Ther. 2017, 23, 272–290. [Google Scholar] [CrossRef]
- Bowser, J.L.; Lee, J.W.; Yuan, X.; Eltzschig, H.K. The hypoxia-adenosine link during inflammation. J. Appl. Physiol. 2017, 123, 1303–1320. [Google Scholar] [CrossRef] [PubMed] [Green Version]
- Li, H.-L.; Zaghloul, N.; Ahmed, I.; Omelchenko, A.; Firestein, B.L.; Huang, H.; Collins, L. Caffeine inhibits hypoxia-induced nuclear accumulation in HIF-1α and promotes neonatal neuronal survival. Exp. Neurol. 2019, 317, 66–77. [Google Scholar] [CrossRef] [PubMed]
- Fredholm, B.B.; Yang, J.; Wang, Y. Low, but not high, dose caffeine is a readily available probe for adenosine actions. Mol. Asp. Med. 2017, 55, 20–25. [Google Scholar] [CrossRef] [PubMed]
- Kerrigan, S.; Lindsey, T. Fatal caffeine overdose: Two case reports. Forensic Sci. Int. 2005, 153, 67–69. [Google Scholar] [CrossRef] [PubMed]
- Anderson, B.J.; Gunn, T.R.; Holford, N.H. Johnson R Caffeine overdose in a premature infant: Clinical course and pharmacokinetics. Anaesth Intensive Care 1999, 27, 307–311. [Google Scholar] [CrossRef] [PubMed] [Green Version]
- Perrin, C.; Debruyne, D.; Lacotte, J.; Laloum, D.; Bonte, J.-B.; Moulin, M. Treatment of Caffeine Intoxication by Exchange Transfusion in a Newborn. Acta Paediatr. 1987, 76, 679–681. [Google Scholar] [CrossRef]
- Atik, A.; Harding, R.; De Matteo, R.; Kondos-Devcic, D.; Cheong, J.; Doyle, L.W.; Tolcos, M. Caffeine for apnea of prematurity: Effects on the developing brain. Neurotoxicology 2017, 58, 94–102. [Google Scholar] [CrossRef]
- McPherson, C.; Neil, J.J.; Tjoeng, T.H.; Pineda, R.; Inder, T.E. A pilot randomized trial of high-dose caffeine therapy in preterm infants. Pediatr. Res. 2015, 78, 198–204. [Google Scholar] [CrossRef] [PubMed] [Green Version]
- Steer, P.; Flenady, V.; Shearman, A.; Charles, B.; Gray, P.H.; Henderson-Smart, D.; Bury, G.; Fraser, S.; Hegarty, J.; Rogers, Y.; et al. Caffeine Collaborative Study Group Steering Group. High dose caf-feine citrate for extubation of preterm infants: A randomised controlled trial. Arch. Dis. Child. Fetal Neonatal Ed. 2004, 89, F499–F503. [Google Scholar] [CrossRef] [Green Version]
- Aranda, J.V.; Beharry, K.D. Pharmacokinetics, pharmacodynamics and metabolism of caffeine in newborns. Semin. Fetal Neonatal Med. 2020, 25, 101183. [Google Scholar] [CrossRef] [PubMed]
- Volpe, J.J. Cerebral White Matter Injury of the Premature Infant—More Common Than You Think. Pediatrics 2003, 112, 176–180. [Google Scholar] [CrossRef]
- Montine, K.S.; Quinn, J.F.; Zhang, J.; Fessel, J.P.; Roberts, L.J., 2nd; Morrow, J.D.; Montine, T.J. Isoprostanes and related products of lipid peroxidation in neurodegenerative diseases. Chem. Phys. Lipids 2004, 128, 117–124. [Google Scholar] [CrossRef]
- Coviello, C.; Perrone, S.; Buonocore, G.; Negro, S.; Longini, M.; Dani, C.; de Vries, L.S.; Groenendaal, F.; Vijlbrief, D.C.; Benders, M.J.N.L.; et al. Isoprostanes as Biomarker for White Matter Injury in Extremely Preterm Infants. Front. Pediatr. 2021, 8. [Google Scholar] [CrossRef] [PubMed]
- Back, S.A.; Luo, N.L.; Mallinson, R.A.; O’Malley, J.P.; Wallen, L.D.; Frei, B.; Morrow, J.D.; Petito, C.K.; Roberts, C.T., Jr.; Murdoch, G.H.; et al. Selective vulnerability of preterm white matter to oxidative damage defined by F2-isoprostanes. Ann. Neurol. 2005, 58, 108–120. [Google Scholar] [CrossRef]
- Van ‘t Erve, T.J.; Lih, F.B.; Kadiiska, M.B.; Deterding, L.J.; Eling, T.E.; Mason, R.P. Reinterpreting the best biomarker of oxidative stress: The 8-iso-PGF2α/PGF2α ratio distinguishes chemical from enzymatic lipid peroxidation. Free Radic. Biol. Med. 2015, 83, 245–251. [Google Scholar] [CrossRef] [Green Version]
- Beharry, K.D.; Cai, C.L.; Ahmad, T.; Guzel, S.; Valencia, G.B.; Aranda, J.V. Impact of Chronic Neonatal Intermittent Hypoxia on Severity of Retinal Damage in a Rat Model of Oxygen-Induced Retinopathy. J. Nat. Sci. 2018, 4, 488. [Google Scholar]
- Beharry, K.D.; Cai, C.L.; Valencia, G.B.; Valencia, A.M.; Lazzaro, D.R.; Bany-Mohammed, F.; Aranda, J.V. Neonatal Inter-mittent Hypoxia, Reactive Oxygen Species, and Oxygen-Induced Retinopathy. React. Oxyg Species Apex 2017, 3, 12–25. [Google Scholar]
- Morken, T.S.; Nyman, A.K.; Sandvig, I.; Torp, S.H.; Skranes, J.; Goa, P.E.; Brubakk, A.M.; Widerøe, M. Brain development after neonatal intermittent hyperoxia-hypoxia in the rat studied by longitudinal MRI and immunohistochemistry. PLoS ONE 2013, 8, e84109. [Google Scholar]
- Ikonomidou, C. Triggers of apoptosis in the immature brain. Brain Dev. 2009, 31, 488–492. [Google Scholar] [CrossRef] [PubMed]
- Higuchi, Y. Chromosomal DNA fragmentation in apoptosis and necrosis induced by oxidative stress. Biochem. Pharmacol. 2003, 66, 1527–1535. [Google Scholar] [CrossRef]
- Beharry, K.D.; Cai, C.L.; Valencia, G.B.; Lazzaro, U.; Valencia, A.M.; Salomone, F.; Aranda, J.V. Human retinal endothelial cells and astrocytes cultured on 3-D scaffolds for ocular drug discovery and development. Prostaglandins Other Lipid Mediat. 2018, 134, 93–107. [Google Scholar] [CrossRef] [PubMed]
- Aranda, J.V.; Cai, C.L.; Ahmad, T.; Bronshtein, V.; Sadeh, J.; Valencia, G.B.; Lazzaro, D.R.; Beharry, K.D. Pharmacologic synergism of ocular ketorolac and systemic caffeine citrate in rat oxygen-induced retinopathy. Pediatr. Res. 2016, 80, 554–565. [Google Scholar] [CrossRef] [PubMed] [Green Version]
- Endesfelder, S.; Weichelt, U.; Strauß, E.; Schlör, A.; Sifringer, M.; Scheuer, T.; Bührer, C.; Schmitz, T. Neuroprotection by Caffeine in Hyperoxia-Induced Neonatal Brain Injury. Int. J. Mol. Sci. 2017, 18, 187. [Google Scholar] [CrossRef] [Green Version]
- Liu, H.; Zhou, Y.; Tang, L. Caffeine induces sustained apoptosis of human gastric cancer cells by activating the caspa-se 9/caspase 3 signalling pathway. Mol. Med. Rep. 2017, 16, 2445–2454. [Google Scholar] [CrossRef] [Green Version]
- Andiné, P.; Thordstein, M.; Kjellmer, I.; Nordborg, C.; Thiringer, K.; Wennberg, E.; Hagberg, H. Evaluation of brain damage in a rat model of neonatal hypoxic-ischemia. J. Neurosci. Methods 1990, 35, 253–260. [Google Scholar] [CrossRef]
- Bailey, S.A.; Zidell, R.H.; Perry, R.W. Relationships between organ weight and body/brain weight in the rat: What is the best analytical endpoint? Toxicol. Pathol. 2004, 32, 448–466. [Google Scholar] [CrossRef]
- Beharry, K.D.; Cai, C.L.; Skelton, J.; Siddiqui, F.; D’Agrosa, C.; Calo, J.; Valencia, G.B.; Aranda, J.V. Oxygen-Induced reti-nopathy from recurrent intermittent hypoxia is not dependent on resolution with room air or oxygen, in neonatal rats. Int. J. Mol. Sci. 2018, 19, 1337. [Google Scholar] [CrossRef] [PubMed] [Green Version]
- Beharry, K.D.; Cai, C.L.; Sharma, P.; Bronshtein, V.; Valencia, G.B.; Lazzaro, D.R.; Aranda, J.V. Hydrogen peroxide accu-mulation in the choroid during intermittent hypoxia increases risk of severe oxygen-induced retinopathy in neonatal rats. Invest. Ophthalmol. Vis. Sci. 2013, 54, 7644–7657. [Google Scholar] [CrossRef] [PubMed] [Green Version]
- Letinic, K.; Zoncu, R.; Rakic, P. Origin of GABAergic neurons in the human neocortex. Nat. Cell Biol. 2002, 417, 645–649. [Google Scholar] [CrossRef] [PubMed]
- Luhmann, H.J.; Kirischuk, S.; Sinning, A.; Kilb, W. Early GABAergic circuitry in the cerebral cortex. Curr. Opin. Neurobiol. 2014, 26, 72–78. [Google Scholar] [CrossRef] [PubMed]
- Xu, W.; Chi, L.; Row, B.W.; Xu, R.; Ke, Y.; Xu, B.; Luo, C.; Kheirandish, L.; Gozal, D.; Liu, R. Increased oxidative stress is as-sociated with chronic intermittent hypoxia-mediated brain cortical neuronal cell apoptosis in a mouse model of sleep ap-nea. Neuroscience 2004, 126, 313–323. [Google Scholar] [CrossRef]
- Robinson, S.; Li, Q.; Dechant, A.; Cohen, M.L. Neonatal loss of gamma-aminobutyric acid pathway expression after human perinatal brain injury. J. Neurosurg. 2006, 104, 396–408. [Google Scholar]
- Nilnumkhum, A.; Kanlaya, R.; Yoodee, S.; Thongboonkerd, V. Caffeine inhibits hypoxia-induced renal fibroblast activation by antioxidant mechanism. Cell Adhes. Migr. 2019, 13, 259–271. [Google Scholar] [CrossRef] [Green Version]
- Endesfelder, S.; Strauß, E.; Scheuer, T.; Schmitz, T.; Bührer, C. Antioxidative effects of caffeine in a hyperoxia-based rat model of bronchopulmonary dysplasia. Respir. Res. 2019, 20, 1–13. [Google Scholar] [CrossRef] [Green Version]
- Valavanidis, A.; Vlachogianni, T.; Fiotakis, C. 8-hydroxy-2′ -deoxyguanosine (8-OHdG): A Critical Biomarker of Oxidative Stress and Carcinogenesis. J. Environ. Sci. Health Part C 2009, 27, 120–139. [Google Scholar] [CrossRef] [Green Version]
- Sakamoto, W.; Isomura, H.; Fujie, K.; Takahashi, K.; Nakao, K.; Izumi, H. Relationship of Coffee Consumption with Risk Factors of Atherosclerosis in Rats. Ann. Nutr. Metab. 2005, 49, 149–154. [Google Scholar] [CrossRef]
- Eayrs, J.T.; Goodhead, B. Postnatal development of the cerebral cortex in the rat. J. Anat. 1959, 93, 385–402. [Google Scholar]
- Gerstner, B.; DeSilva, T.M.; Genz, K.; Armstrong, A.; Brehmer, F.; Neve, R.L.; Felderhoff-Mueser, U.; Volpe, J.J.; Rosenberg, P.A. Hyperoxia Causes Maturation-Dependent Cell Death in the Developing White Matter. J. Neurosci. 2008, 28, 1236–1245. [Google Scholar] [CrossRef]
- Ahdab-Barmada, M.; Moossy, J.; Nemoto, E.M.; Lin, M.R. Hyperoxia produces neuronal necrosis in the rat. J. Neuropathol. Exp. Neurol. 1986, 45, 233–246. [Google Scholar] [CrossRef]
- Delivoria-Papadopoulos, M. Mechanism of caspase-9 activation during hypoxia in the cerebral cortex of newborn piglets: The role of Src kinase. Neurosci. Lett. 2012, 523, 19–23. [Google Scholar] [CrossRef] [Green Version]
- Bröker, L.E.; Kruyt, F.A.; Giaccone, G. Cell Death Independent of Caspases: A Review. Clin. Cancer Res. 2005, 11, 3155–3162. [Google Scholar] [CrossRef] [PubMed] [Green Version]
- Grütter, M.G. Caspases: Key players in programmed cell death. Curr. Opin. Struct. Biol. 2000, 10, 649–655. [Google Scholar] [CrossRef]
- Wang, J.; Lenardo, M.J. Roles of caspases in apoptosis, development, and cytokine maturation revealed by homozygous gene deficiencies. J. Cell Sci. 2000, 113, 753–757. [Google Scholar]
- Rybnikova, E.; Samoilov, M. Current insights into the molecular mechanisms of hypoxic pre- and postconditioning using hypobaric hypoxia. Front. Neurosci. 2015, 9, 388. [Google Scholar] [CrossRef] [PubMed] [Green Version]
- Zhang, W.; Meng, A. MicroRNA-124 expression in the brains of rats during early cerebral ischemia and reperfusion injury is associated with cell apoptosis involving STAT3. Exp. Ther. Med. 2019, 17, 2870–2876. [Google Scholar] [CrossRef] [Green Version]
- D’Amelio, M.; Cavallucci, V.; Cecconi, F. Neuronal caspase-3 signaling: Not only cell death. Cell Death Differ. 2009, 17, 1104–1114. [Google Scholar] [CrossRef]
- Hyman, B.T.; Yuan, J. Apoptotic and non-apoptotic roles of caspases in neuronal physiology and pathophysiology. Nat. Rev. Neurosci. 2012, 13, 395–406. [Google Scholar] [CrossRef]
- Adén, U.; Halldner, L.; Lagercrantz, H.; Dalmau, I.; Ledent, C.; Fredholm, B.B. Aggravated Brain Damage After Hypoxic Ischemia in Immature Adenosine A 2A Knockout Mice. Stroke 2003, 34, 739–744. [Google Scholar] [CrossRef] [Green Version]
- Kaster, M.P.; Machado, N.J.; Silva, H.B.; Nunes, A.; Ardais, A.P.; Santana, M.; Baqi, Y.; Müller, C.E.; Rodrigues, A.L.; Porciúncula, L.O.; et al. Caffeineacts through neuronal adenosine A2A receptors to prevent mood and memory dysfunction triggered by chronic stress. Proc. Natl. Acad. Sci. USA 2015, 112, 7833–7838. [Google Scholar] [CrossRef] [PubMed] [Green Version]
- Gomes, C.V.; Kaster, M.P.; Tomé, A.R.; Agostinho, P.M.; Cunha, R.A. Adenosine receptors and brain diseases: Neuroprotection and neurodegeneration. Biochim. Biophys. Acta BBA Biomembr. 2011, 1808, 1380–1399. [Google Scholar] [CrossRef] [PubMed] [Green Version]
- Chen, J.-F.; Eltzschig, H.K.; Fredholm, B.B. Adenosine receptors as drug targets—What are the challenges? Nat. Rev. Drug Discov. 2013, 12, 265–286. [Google Scholar] [CrossRef] [PubMed] [Green Version]
- Wang, T.; Xi, N.N.; Chen, Y.; Shang, X.F.; Hu, Q.; Chen, J.F.; Zheng, R.Y. Chroniccaffeinetreatment protects against experi-mental autoimmune encephalomyelitis in mice: Therapeutic window and receptor subtype mechanism. Neuropharmacology 2014, 86, 203–211. [Google Scholar] [CrossRef]
- Cao, T.; Ma, T.; Xu, Y.; Tian, Y.; Cai, Q.; Li, B.; Li, H. Caffeine Treatment Promotes Differentiation and Maturation of Hypoxic Oligodendrocytes via Counterbalancing Adenosine 1 Adenosine Receptor-Induced Calcium Overload. Med. Sci. Monit. 2019, 25, 1729–1739. [Google Scholar] [CrossRef] [PubMed]
- Mrzljak, L.; Uylings, H.B.; Van Eden, G.G.; Judáš, M. Neuronal development in human prefrontal cortex in prenatal and postnatal stages. Prog. Brain Res. 1990, 85, 185–222. [Google Scholar]
- Aldridge, A.; Aranda, J.V.; Neims, A.H. Caffeinemetabolismin thenewborn. Clin. Pharmacol. Ther. 1979, 25, 447–453. [Google Scholar] [CrossRef] [PubMed]
- Abdel-Hady, H.; Nasef, N.; Shabaan, A.E.; Nour, I. Caffeine therapy in preterm infants. World J. Clin. Pediatr. 2015, 4, 81–93. [Google Scholar] [CrossRef] [PubMed]
- Kasala, S.; Briyal, S.; Prazad, P.; Ranjan, A.K.; Stefanov, G.; Donovan, R.; Gulati, A. Exposure to Morphine and Caffeine In-duces Apoptosis and Mitochondrial Dysfunction in a Neonatal Rat Brain. Front. Pediatr. 2020, 8, 593. [Google Scholar] [CrossRef]
- Yager, J.Y.; Ashwal, S. Animal Models of Perinatal Hypoxic-Ischemic Brain Damage. Pediatr. Neurol. 2009, 40, 156–167. [Google Scholar] [CrossRef] [PubMed]
- Morrow, J.D. The Isoprostanes—Unique Products of Arachidonate Peroxidation: Their Role as Mediators of Oxidant Stress. Curr. Pharm. Des. 2006, 12, 895–902. [Google Scholar] [CrossRef] [PubMed]
- Dobbing, J.; Sands, J. Comparative aspects of the brain growth spurt. Early Hum. Dev. 1979, 3, 79–83. [Google Scholar] [CrossRef]


| Groups | pH | PCO2 | PO2 | SO2 |
|---|---|---|---|---|
| RA: | ||||
| Saline | 7.593 ± 0.03 | 31.1 ± 1.9 | 83.3 ± 7.9 | 97.5 ± 0.65 |
| LoC | 7.526 ± 0.01 | 34.0 ± 0.42 | 69.0 ± 5.6 | 96.0 ± 0.87 |
| HiC | 7.568 ± 0.03 | 31.7 ± 1.8 | 122.5 ± 22.5 | 98.8 ± 0.48 |
| 50% O2: | ||||
| Saline | 7.584 ± 0.006 | 37.5 ± 0.49 * | 130.5 ± 6.5 ** | 99.3 ± 0.18 * |
| LoC | 7.58 ± 0.013 # | 39.1 ± 1.14 ## | 115.5 ± 11.5 ## | 98.5 ± 0.61 # |
| HiC | 7.523 ± 0.017 §§ | 41.8 ± 0.79 ‡§§ | 88.8 ± 12.7 § | 97.0 ± 0.91 § |
| Neonatal IH: | ||||
| Saline | 7.562 ± 0.037 | 34.9 ± 2.4 | 94.0 ± 4.7 | 98.0 ± 0.41 |
| LoC | 7.528 ± 0.02 | 38.6 ± 1.2 ## | 101.5 ± 12.3 | 98.0 ± 0.71 |
| HiC | 7.55 ± 0.026 | 37.8 ± 1.0 ‡ | 93.5 ± 20.1 | 96.8 ± 1.5 |
| Groups | Total Brain Width (µm) | Layer 1 Width (µm) | Layer 2 Width (µm) |
|---|---|---|---|
| RA: | |||
| Saline | 6161.5 ± 98.1 | 129.7 ± 3.6 | 55.0 ± 2.1 |
| LoC | 8534.4 ± 69.5 ** | 130.7 ± 3.9 | 57.6 ± 1.6 |
| HiC | 8216.7 ± 58.4 ** | 125.4 ± 7.3 | 101.0 ± 14.1 ** |
| 50% O2: | |||
| Saline | 6864.6 ± 71.9 * | 134.9 ± 16.8 | 104.8 ± 16.1 * |
| LoC | 9166.6 ± 194.1 ##§§ | 233.1 ± 11.6 ## | 119.1 ± 13.6 ## |
| HiC | 7588.9 ± 51.6 | 114.9 ± 12.8 | 102.9 ± 11.6 |
| Neonatal IH: | |||
| Saline | 7240.9 ± 263.9 ** | 169.8 ± 17.9 | 120.0 ± 16.3 ** |
| LoC | 7905.9 ± 62.5 ## | 147.5 ± 17.9 | 115.7 ± 15.4 ## |
| HiC | 7009.2 ± 212.1 ‡ | 109.4 ± 14.8 † | 105.3 ± 14.2 |
| Groups | Total No. Neurons (n = 20 Measurements/Group) | Dendritic LengthµM (n = 25 Measurements/Group) | No. Dendrites per Neuron (n = 25 Measurements/Group) |
|---|---|---|---|
| RA: | |||
| Saline | 7.2 ± 0.29 | 22.3 ± 0.49 | 2.9 ± 0.2 |
| LoC | 22.0 ± 0.43 ** | 21.9 ± 0.12 | 4.4 ± 0.02 ** |
| HiC | 17.7 ± 0.36 ** | 12.8 ± 0.08 ** | 3.8 ± 0.18 ** |
| 50% O2: | |||
| Saline | 0.1 ± 0.07 ** | 0.0 ± 0.0 ** | 0.0 ± 0.0 ** |
| LoC | 2.5 ± 0.3 ##§§ | 0.04 ± 0.04 ## | 0.04 ± 0.04 ## |
| HiC | 8.9 ± 0.26 ‡§§ | 0.02 ± 0.01 ‡ | 0.08 ± 0.06 ‡ |
| Neonatal IH: | |||
| Saline | 4.0 ± 0.25 ** | 9.9 ± 0.06 ** | 3.2 ± 0.16 |
| LoC | 15.2 ± 0.34 ##§§ | 14.3 ± 0.12 ##§§ | 3.5 ± 0.20 ## |
| HiC | 14.4 ± 0.23 ‡§§ | 11.9 ± 0.06 ‡§§ | 3.2 ± 0.16 ‡ |
Publisher’s Note: MDPI stays neutral with regard to jurisdictional claims in published maps and institutional affiliations. |
© 2021 by the authors. Licensee MDPI, Basel, Switzerland. This article is an open access article distributed under the terms and conditions of the Creative Commons Attribution (CC BY) license (http://creativecommons.org/licenses/by/4.0/).
Share and Cite
Soontarapornchai, K.; Cai, C.L.; Ahmad, T.; Aranda, J.V.; Hand, I.; Beharry, K.D. Pharmacodynamic Effects of Standard versus High Caffeine Doses in the Developing Brain of Neonatal Rats Exposed to Intermittent Hypoxia. Int. J. Mol. Sci. 2021, 22, 3473. https://doi.org/10.3390/ijms22073473
Soontarapornchai K, Cai CL, Ahmad T, Aranda JV, Hand I, Beharry KD. Pharmacodynamic Effects of Standard versus High Caffeine Doses in the Developing Brain of Neonatal Rats Exposed to Intermittent Hypoxia. International Journal of Molecular Sciences. 2021; 22(7):3473. https://doi.org/10.3390/ijms22073473
Chicago/Turabian StyleSoontarapornchai, Kutilda, Charles L. Cai, Taimur Ahmad, Jacob V. Aranda, Ivan Hand, and Kay D. Beharry. 2021. "Pharmacodynamic Effects of Standard versus High Caffeine Doses in the Developing Brain of Neonatal Rats Exposed to Intermittent Hypoxia" International Journal of Molecular Sciences 22, no. 7: 3473. https://doi.org/10.3390/ijms22073473