Delayed Exercise Training Improves Obesity-Induced Chronic Kidney Disease by Activating AMPK Pathway in High-Fat Diet-Fed Mice

 ,
,  , ,
, ,  ,
, 
Abstract
:1. Introduction
2. Materials and Methods
2.1. Animals and Diet
2.2. Exercise Training Protocol
2.3. Sample Collection
2.4. Urine Collection and Measurement of Urinary Markers
2.5. Glucose Tolerance Test
2.6. Biochemical Assays
2.7. Morphological Analysis
2.8. Immunohistochemistry
2.9. Quantitative Real-Time PCR
2.10. Western Blot Analysis
2.11. Statistical Analysis
3. Results
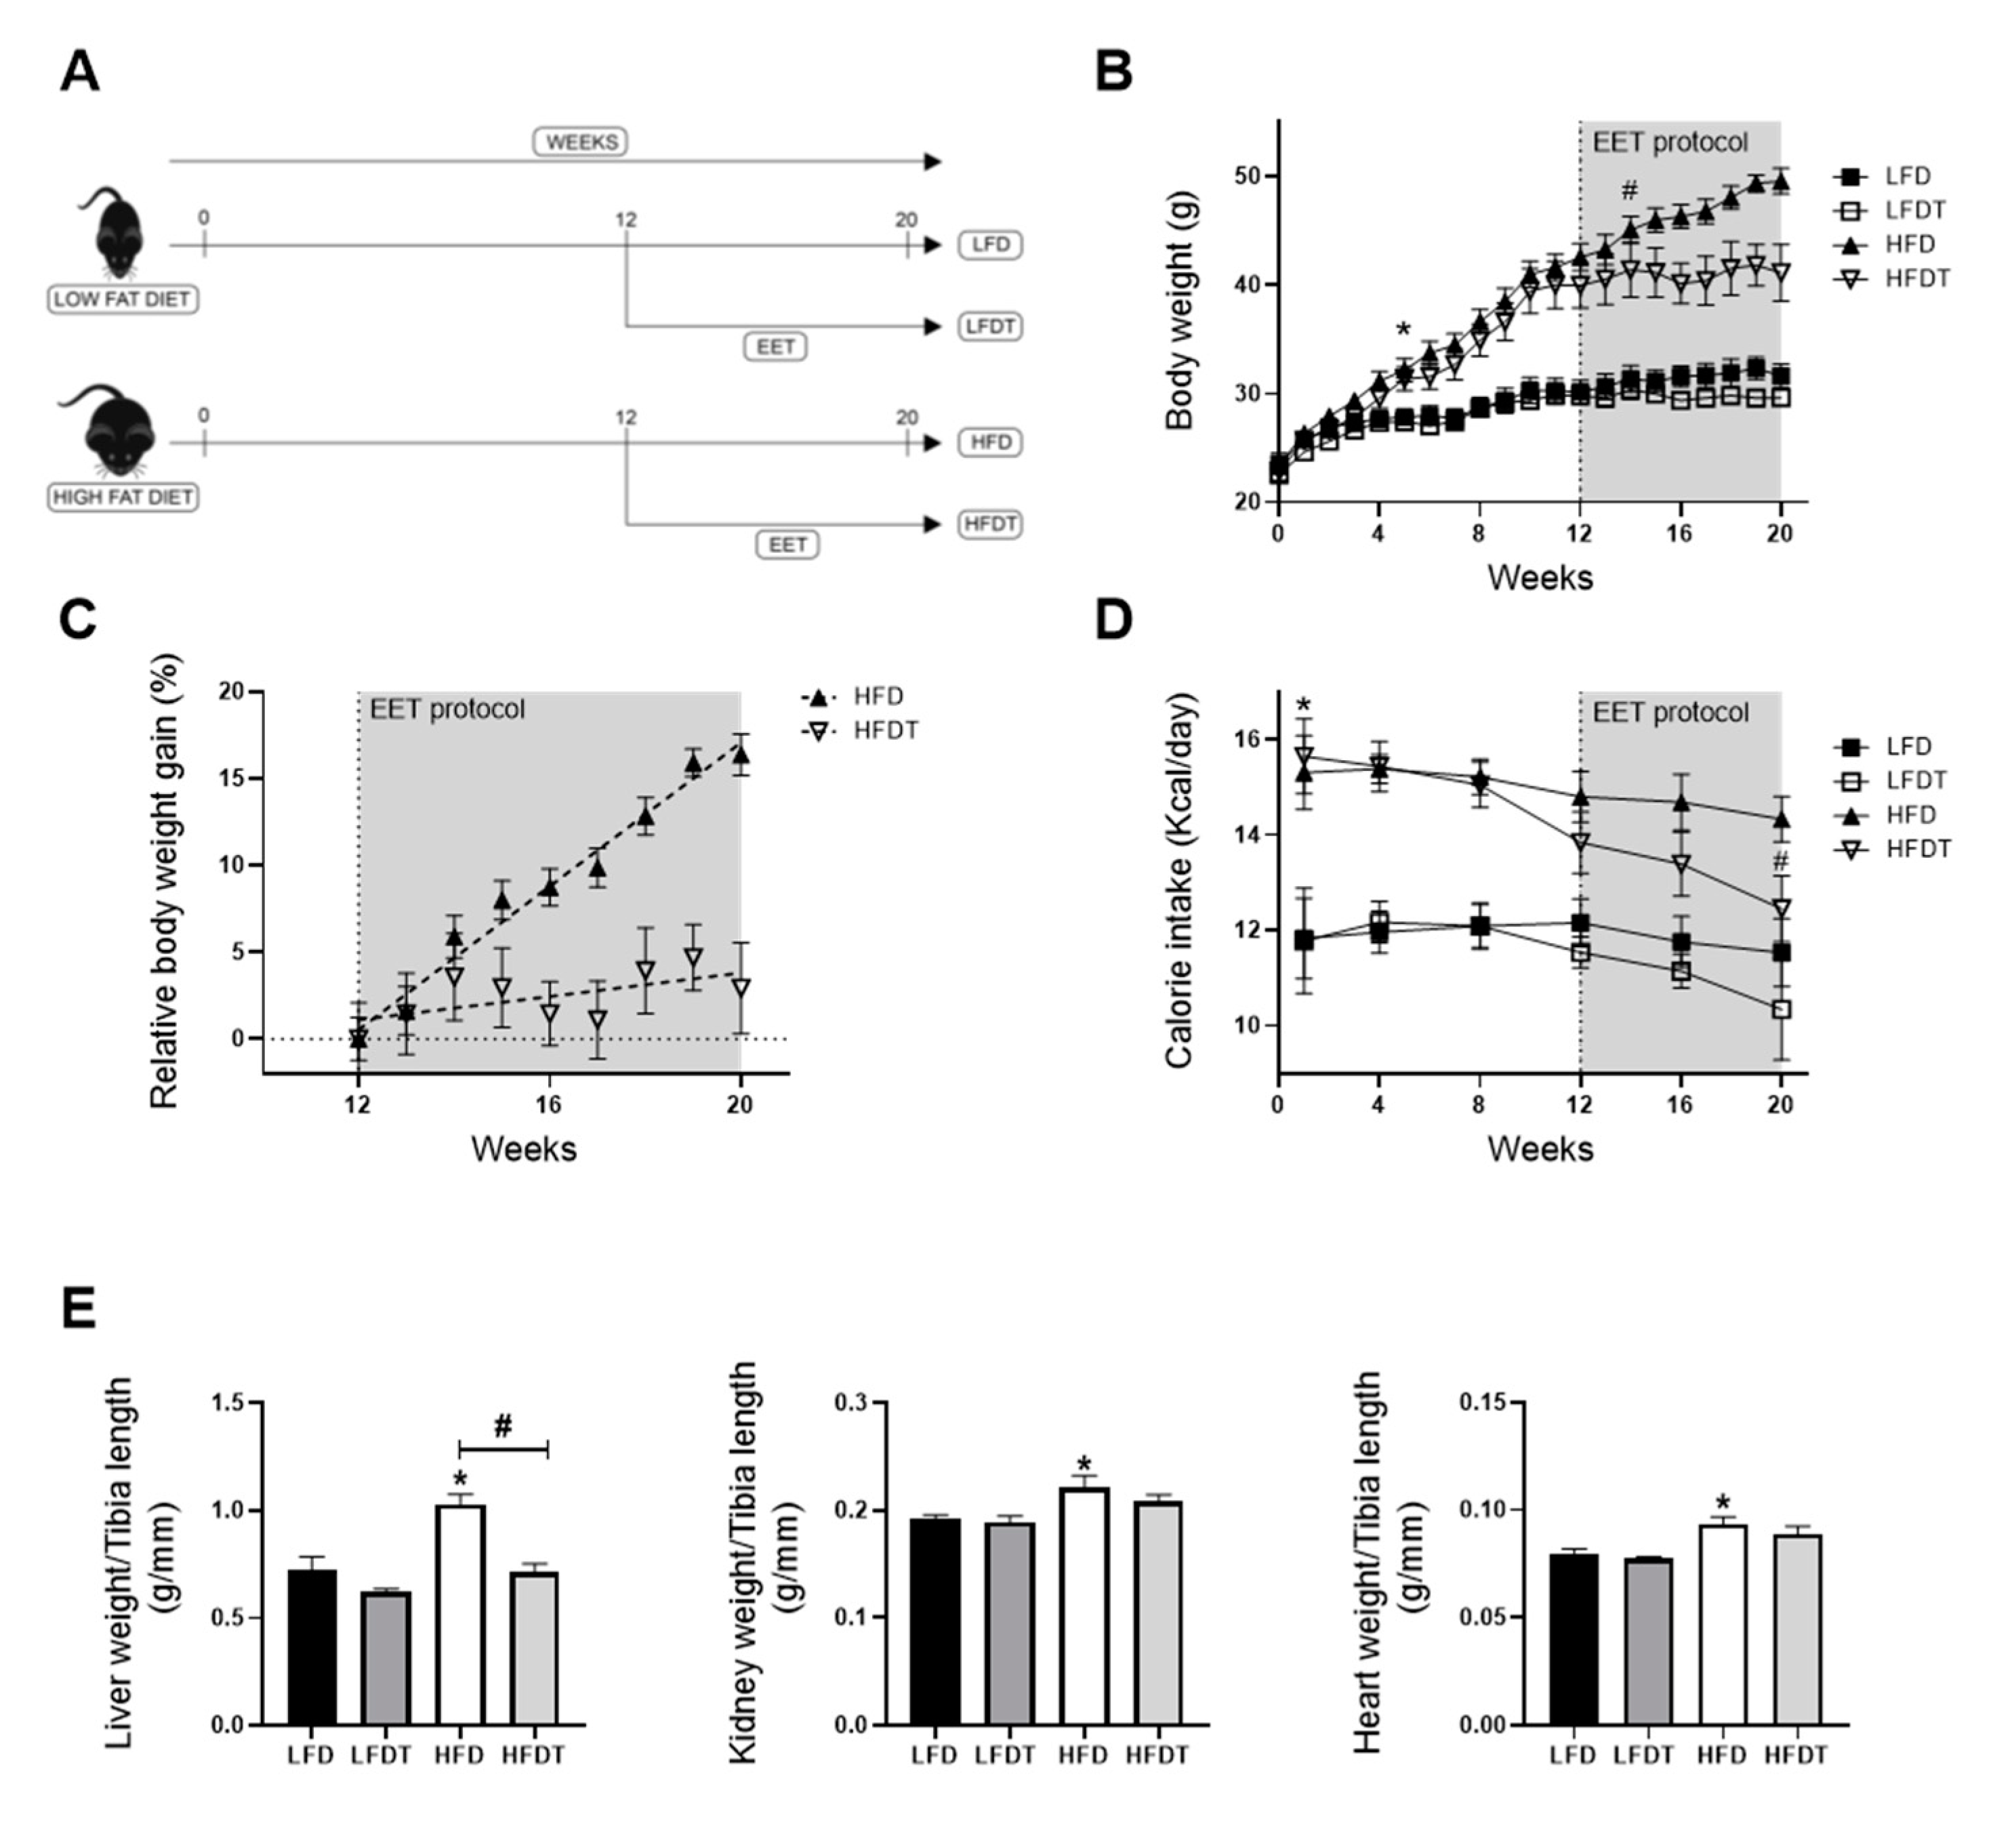
3.1. Delayed Endurance Exercise Training Limits Calorie Intake and Prevents Body and Tissue Weight Gain in HFD Mice
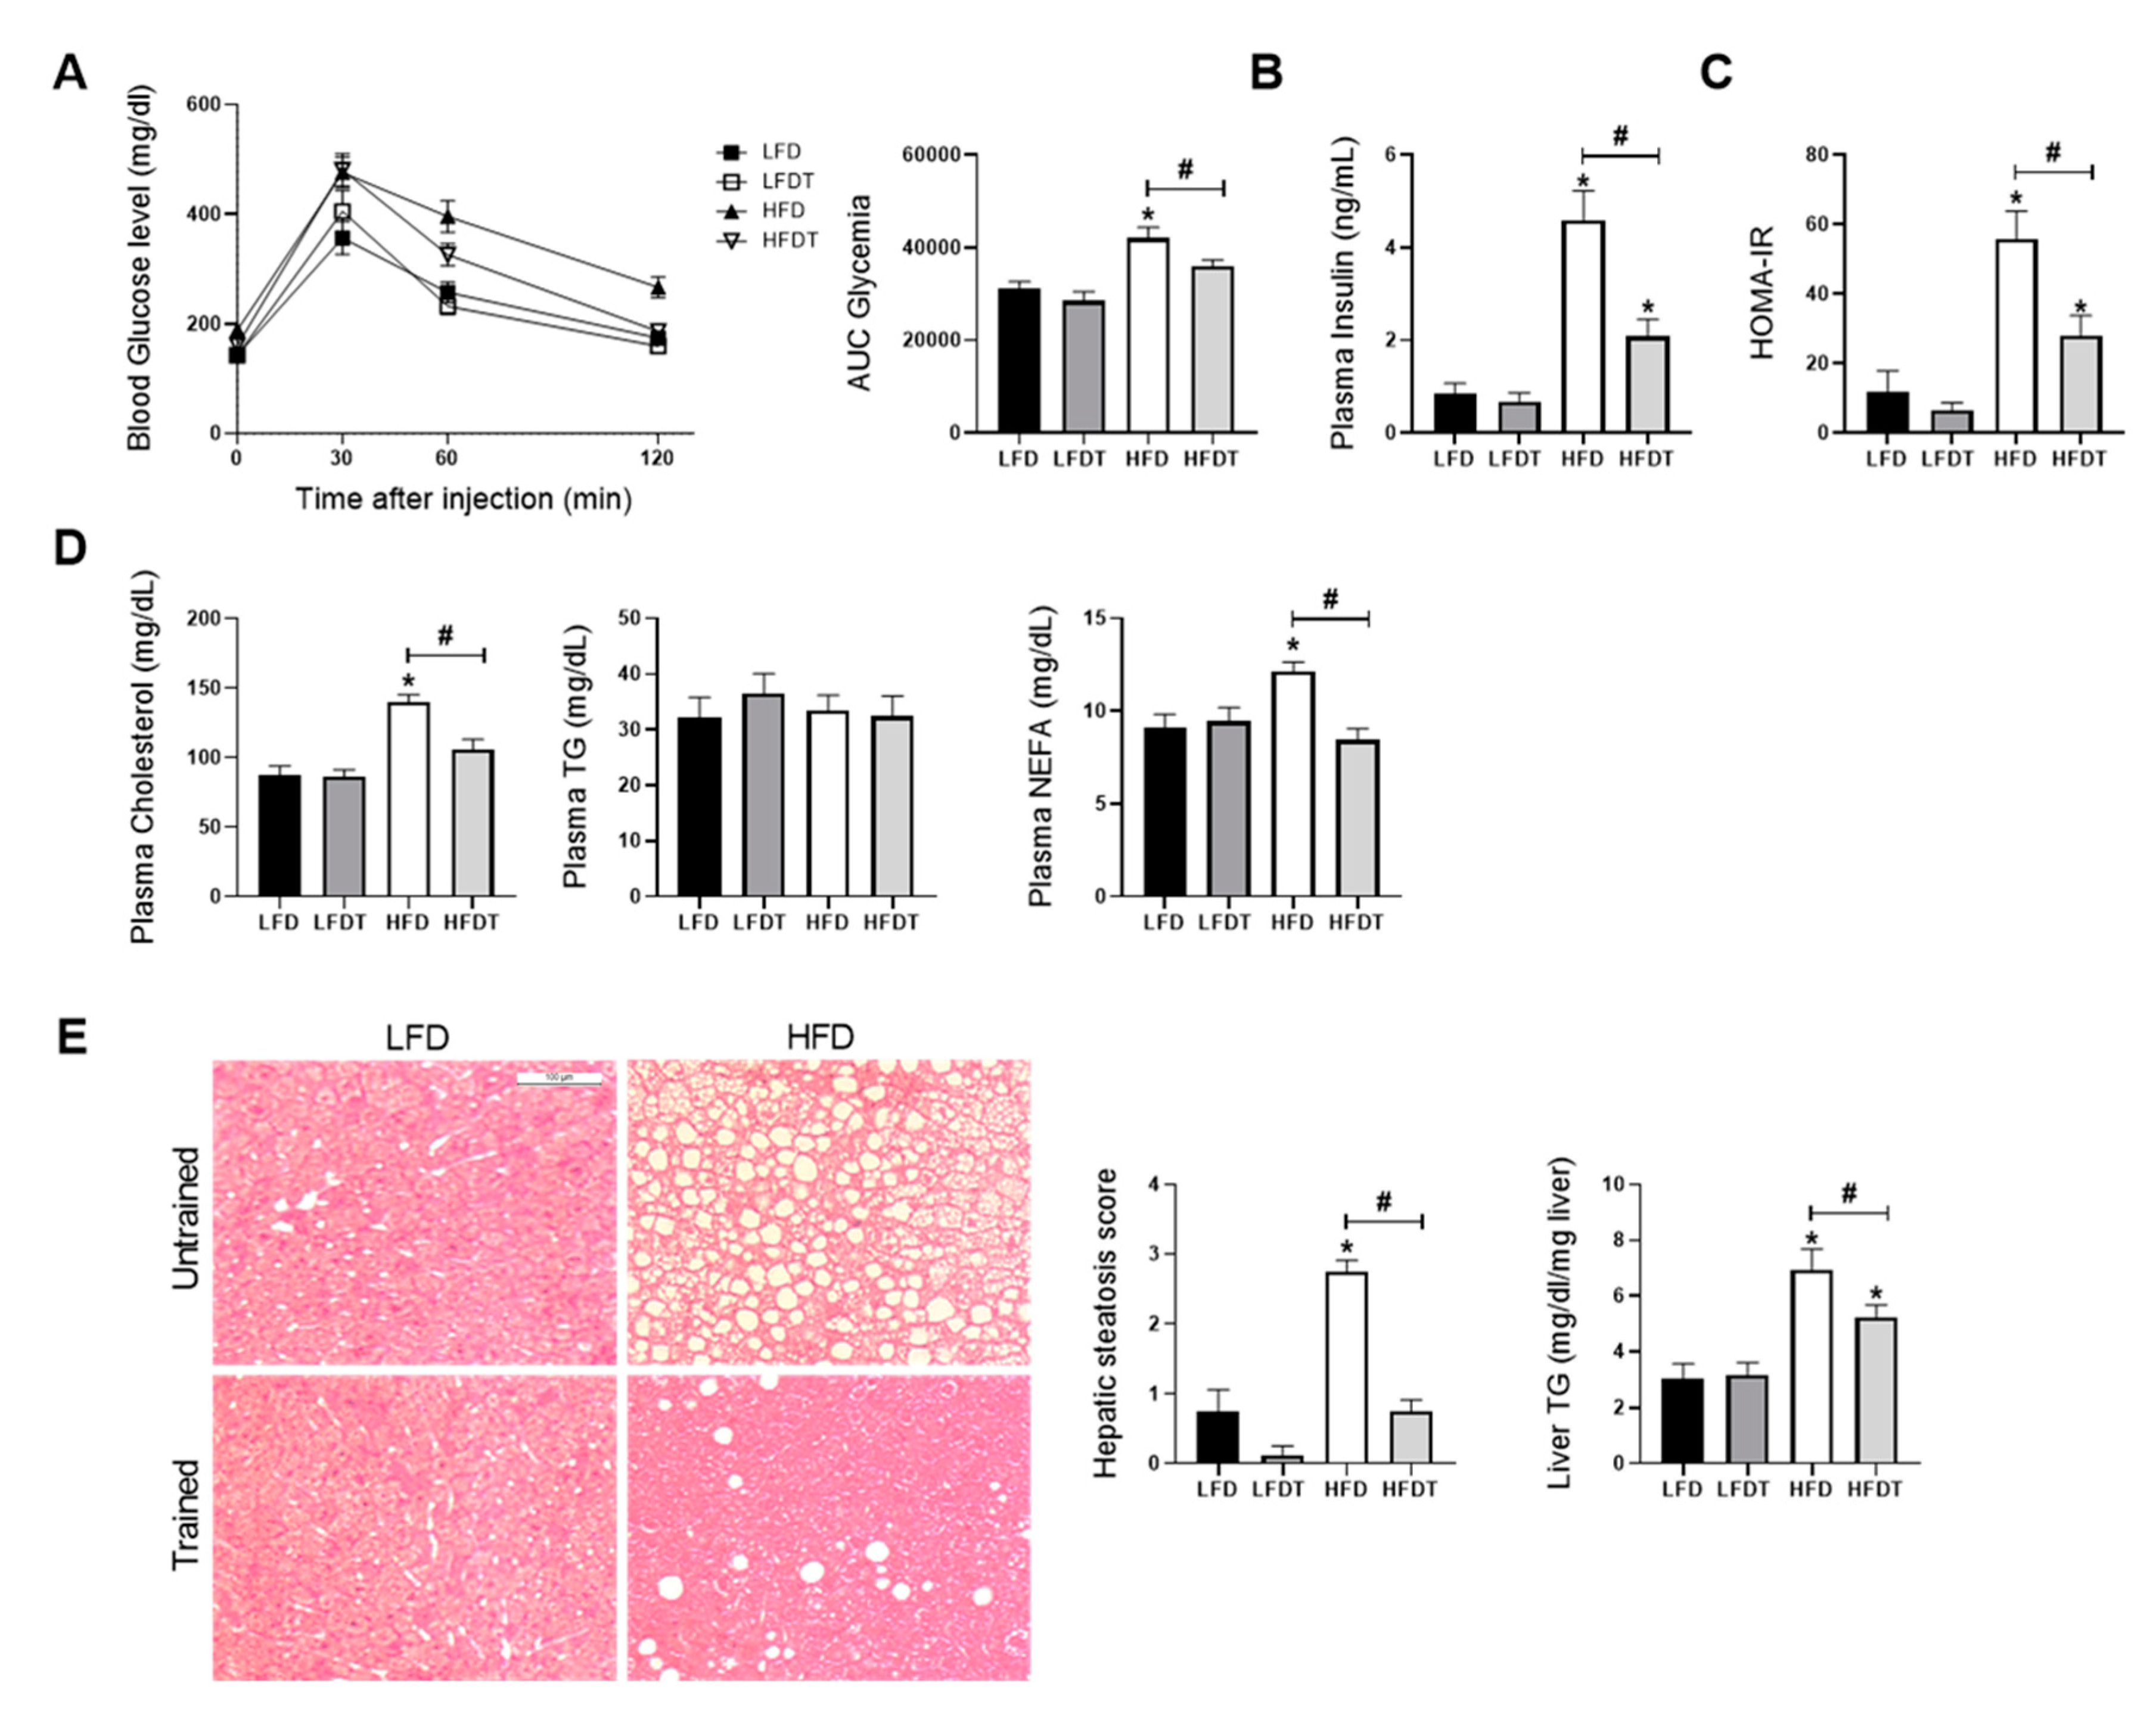
3.2. Delayed EET Improves Obesity-Related Metabolic Disorders in HFD Mice
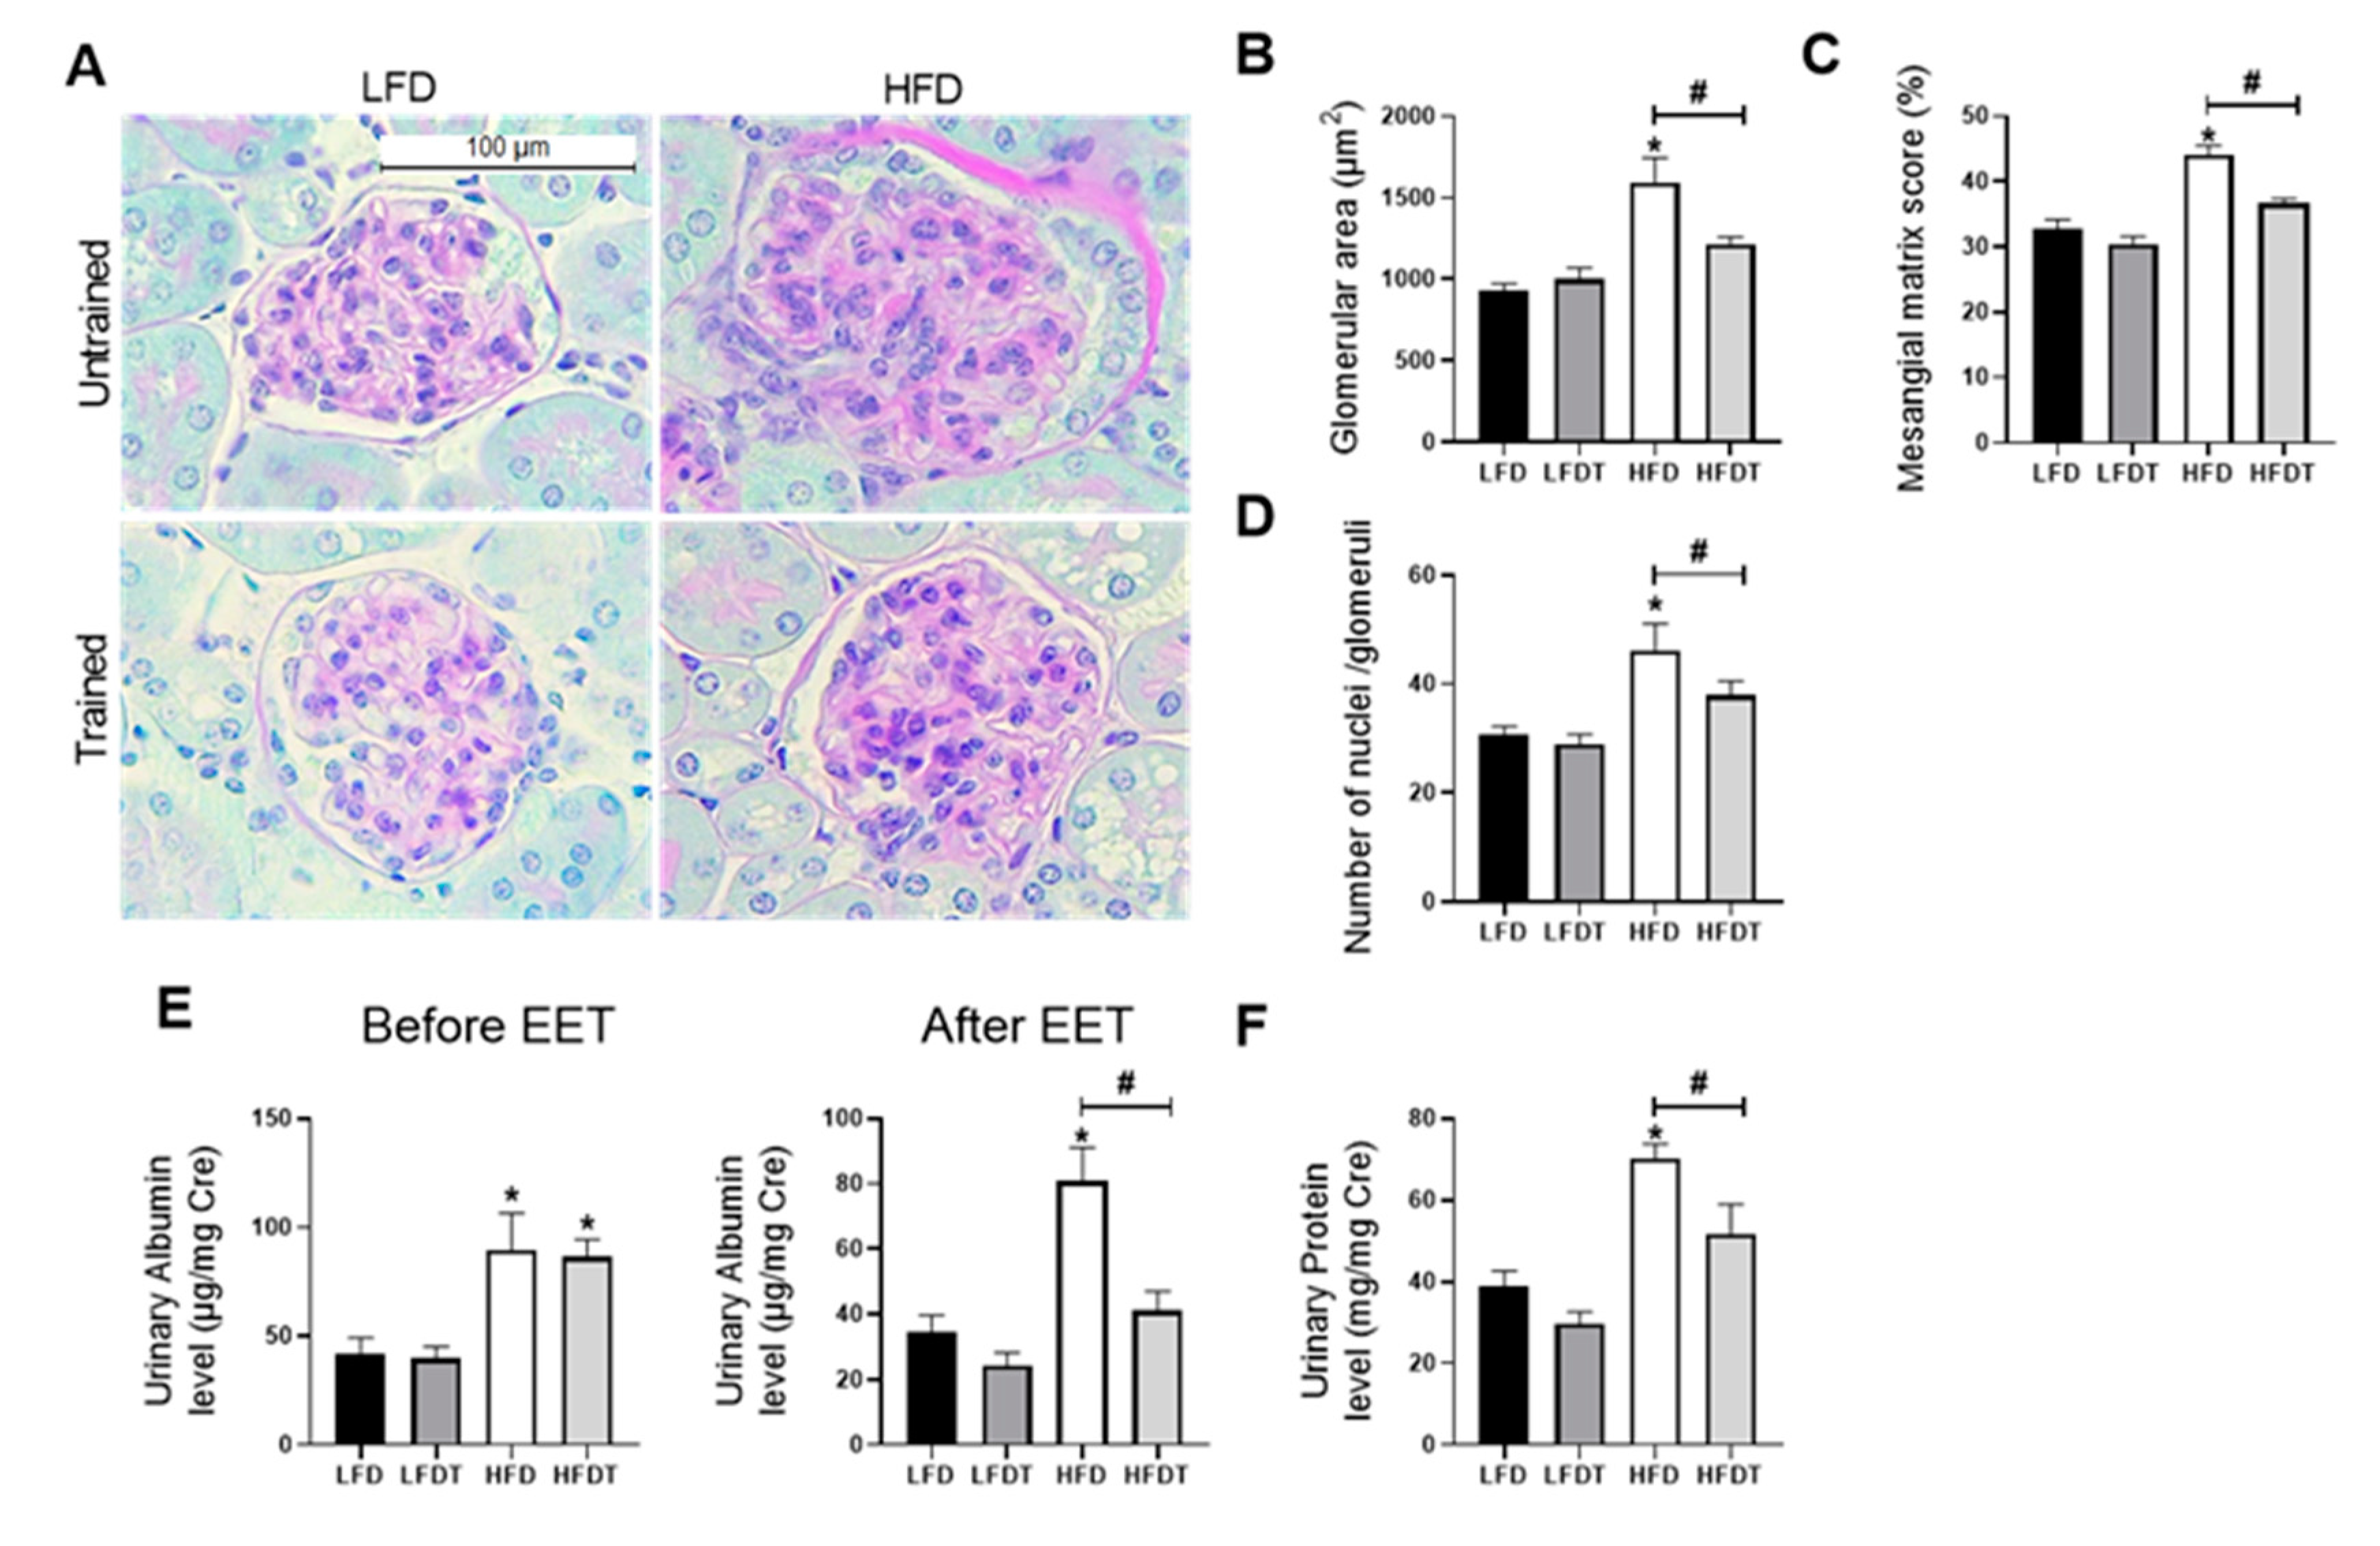
3.3. Delayed EET Improves Obesity-Related Glomerulopathy and Renal Function
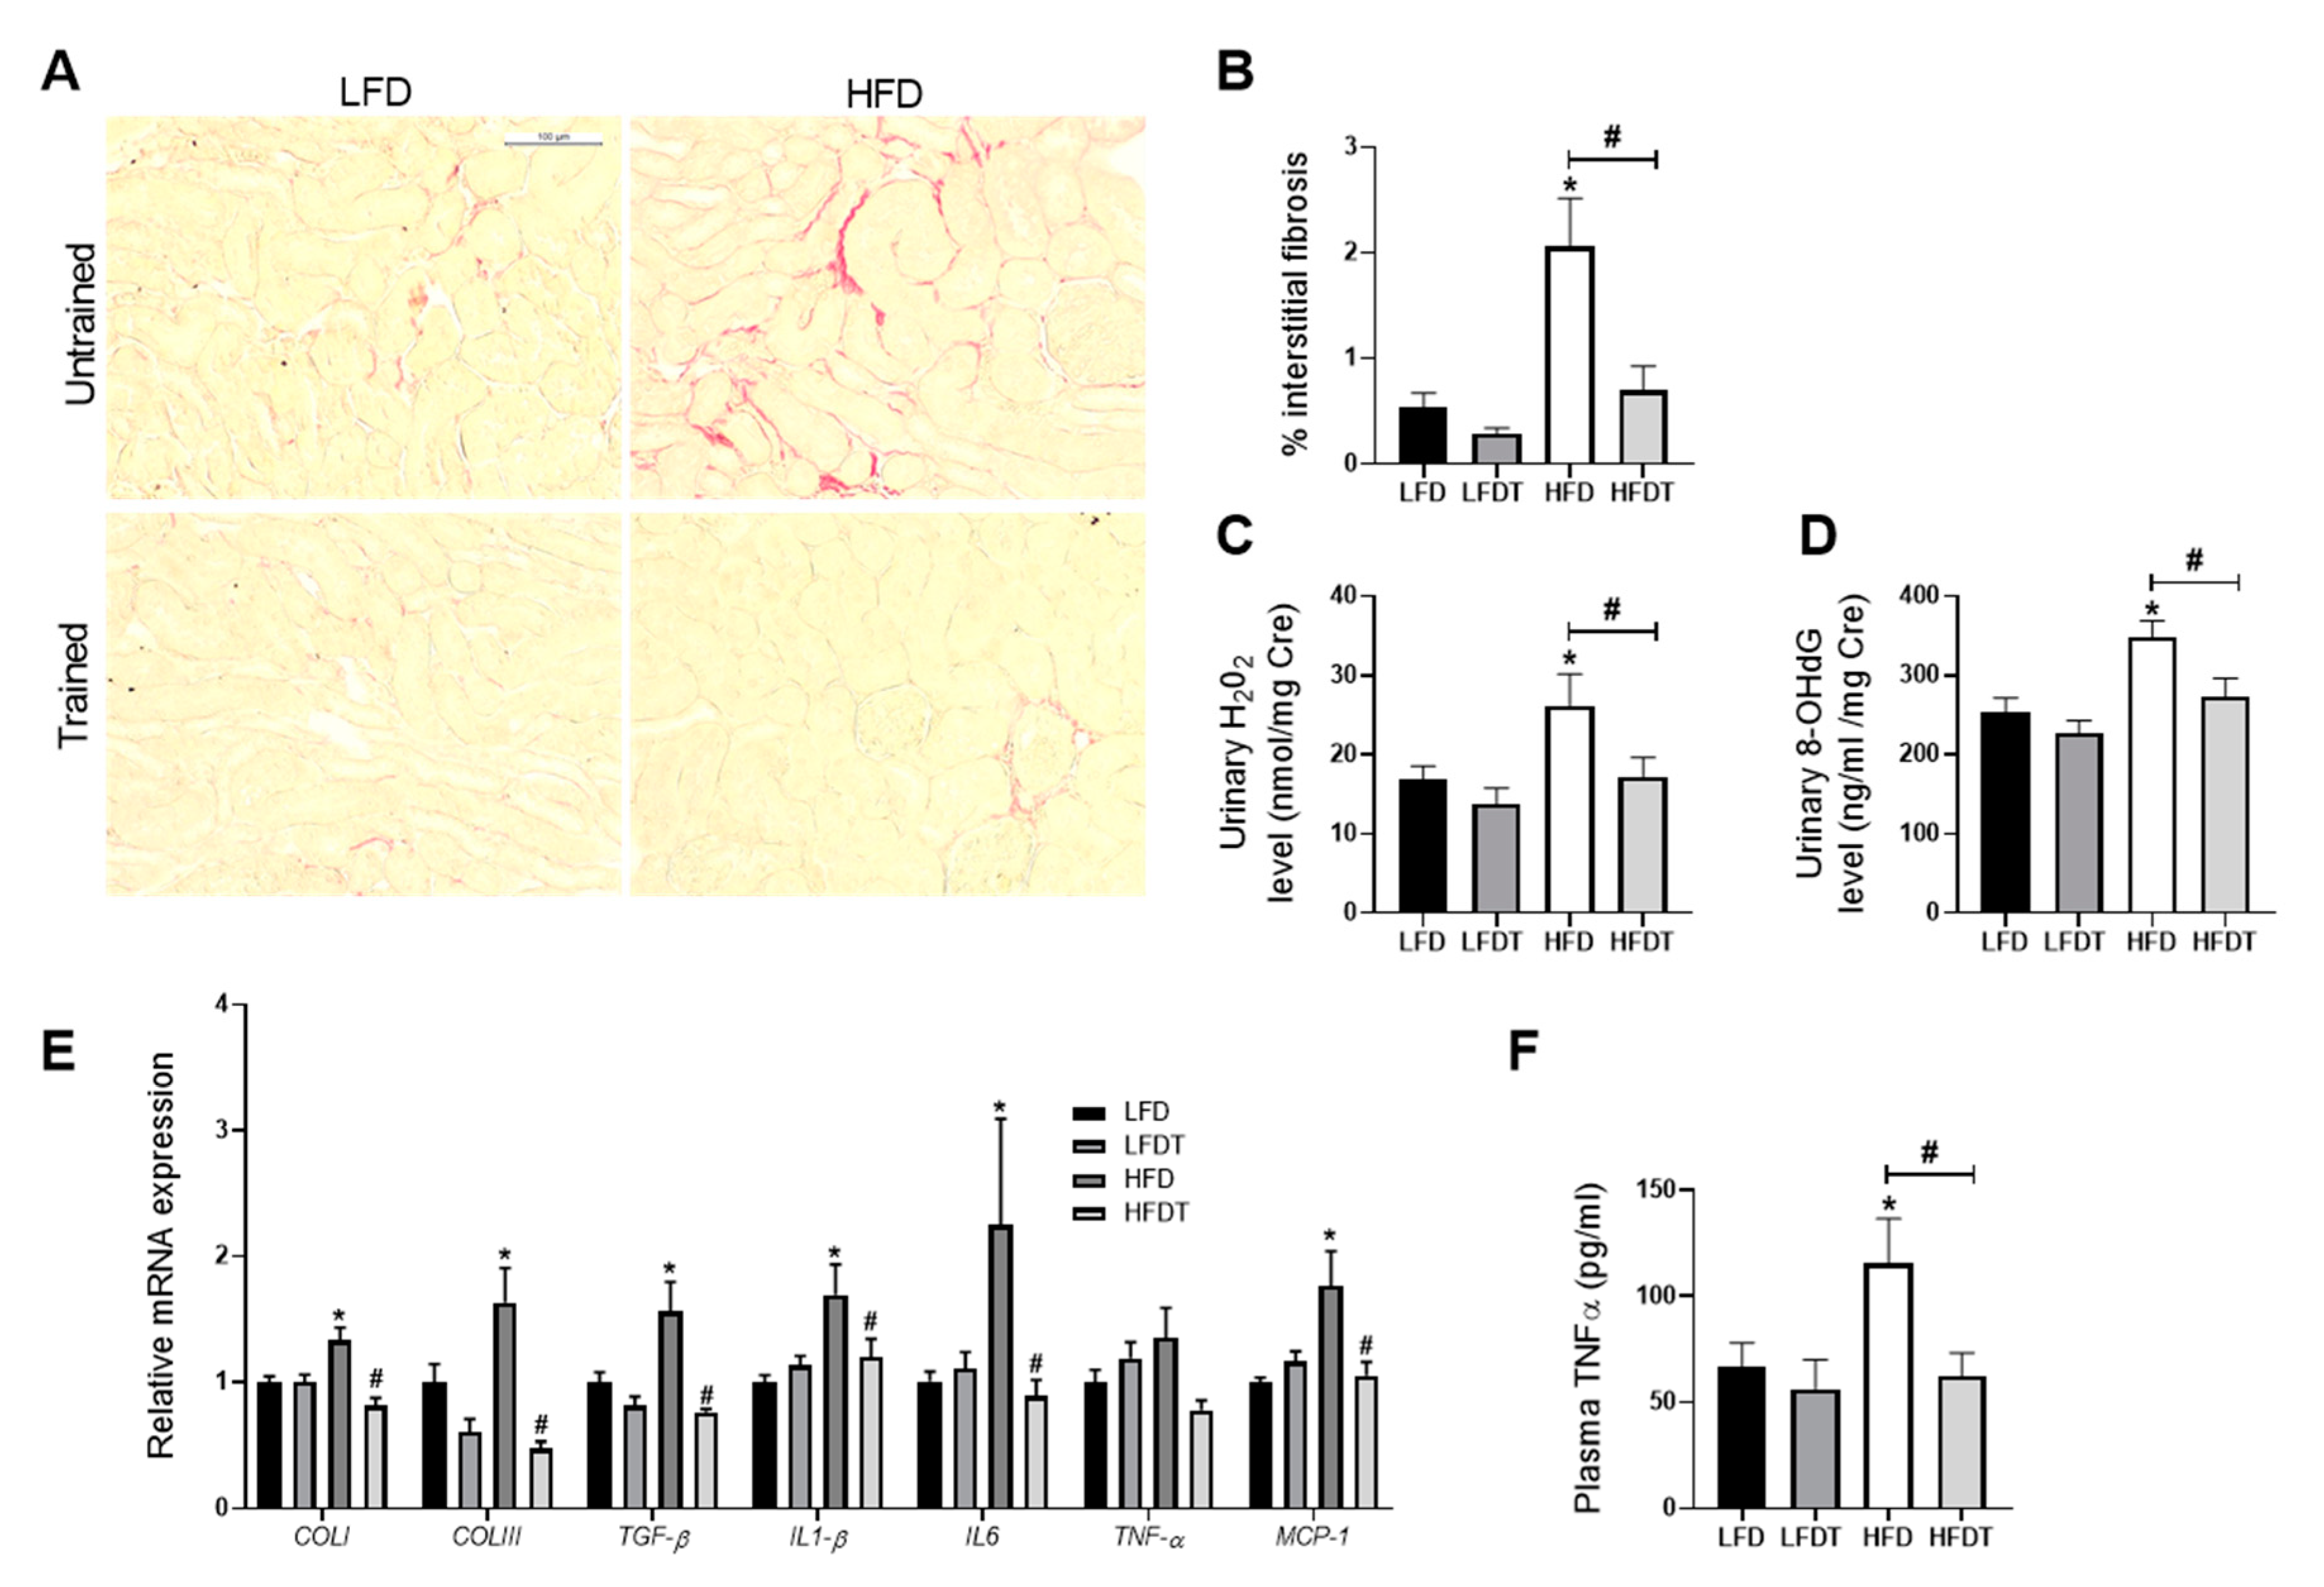
3.4. Delayed EET Ameliorates Renal Fibrosis, Inflammation and Oxidative Stress
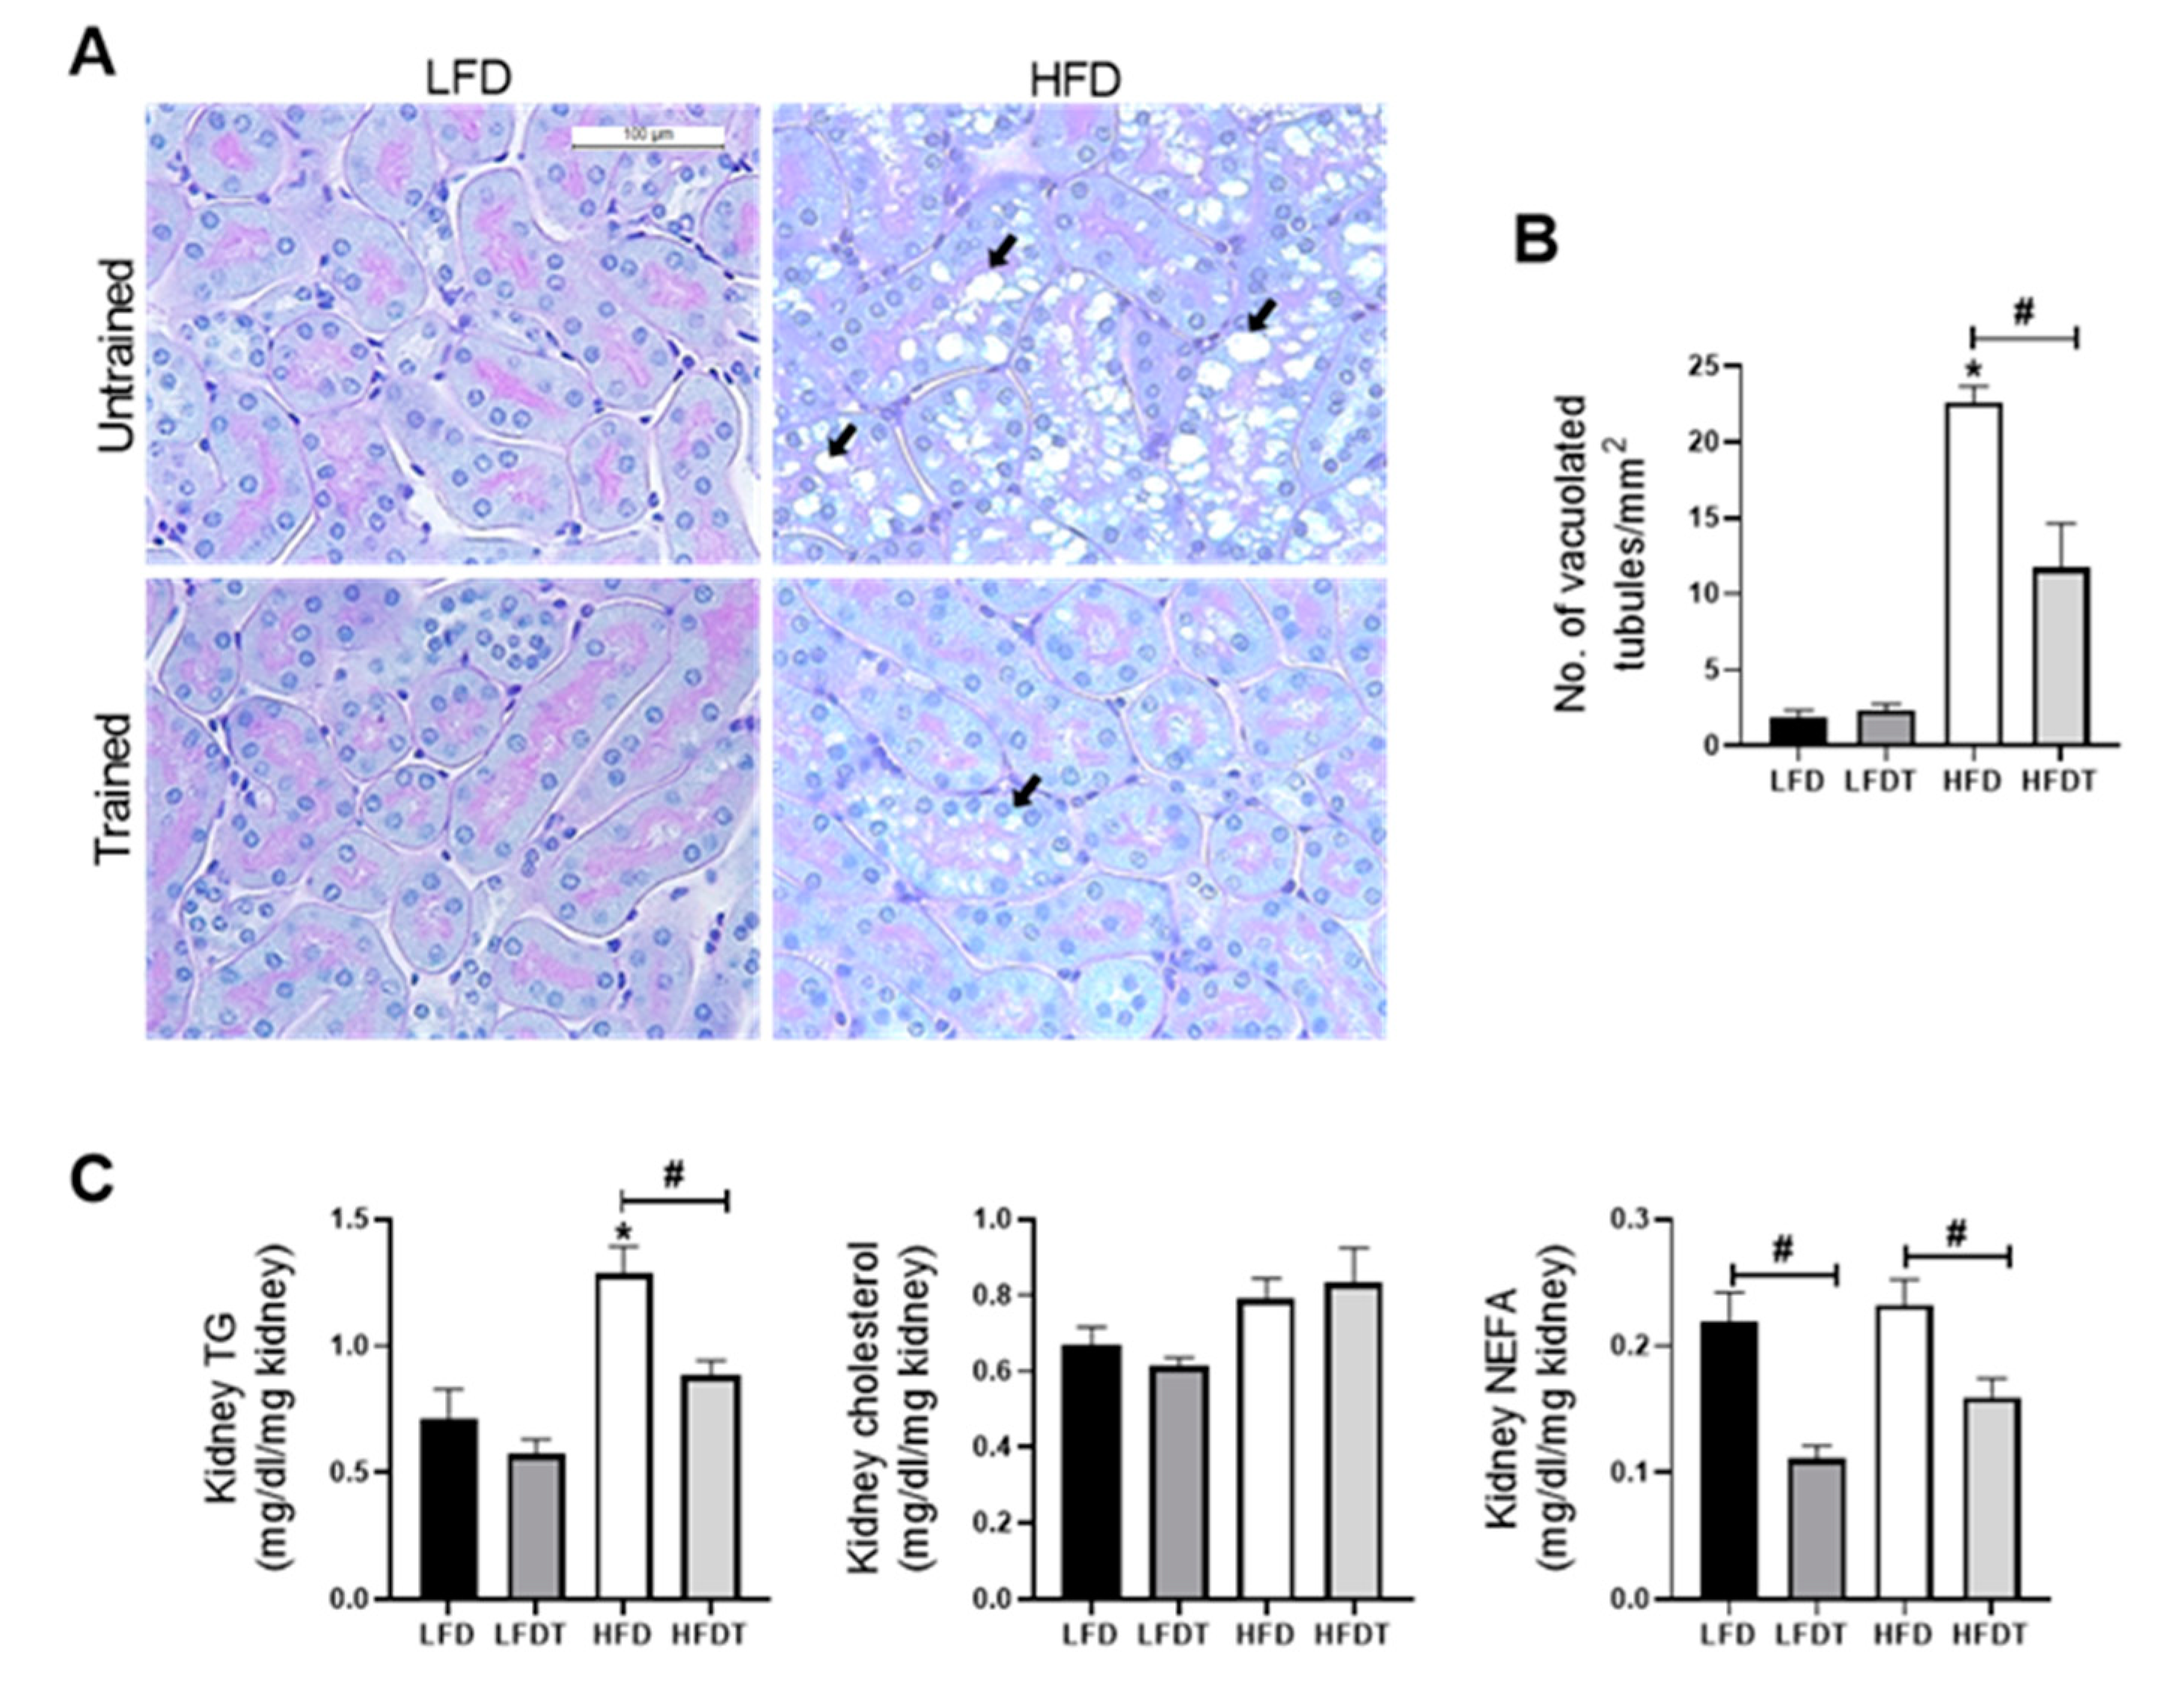
3.5. Delayed EET Reduces Renal Ectopic Lipid Accumulations
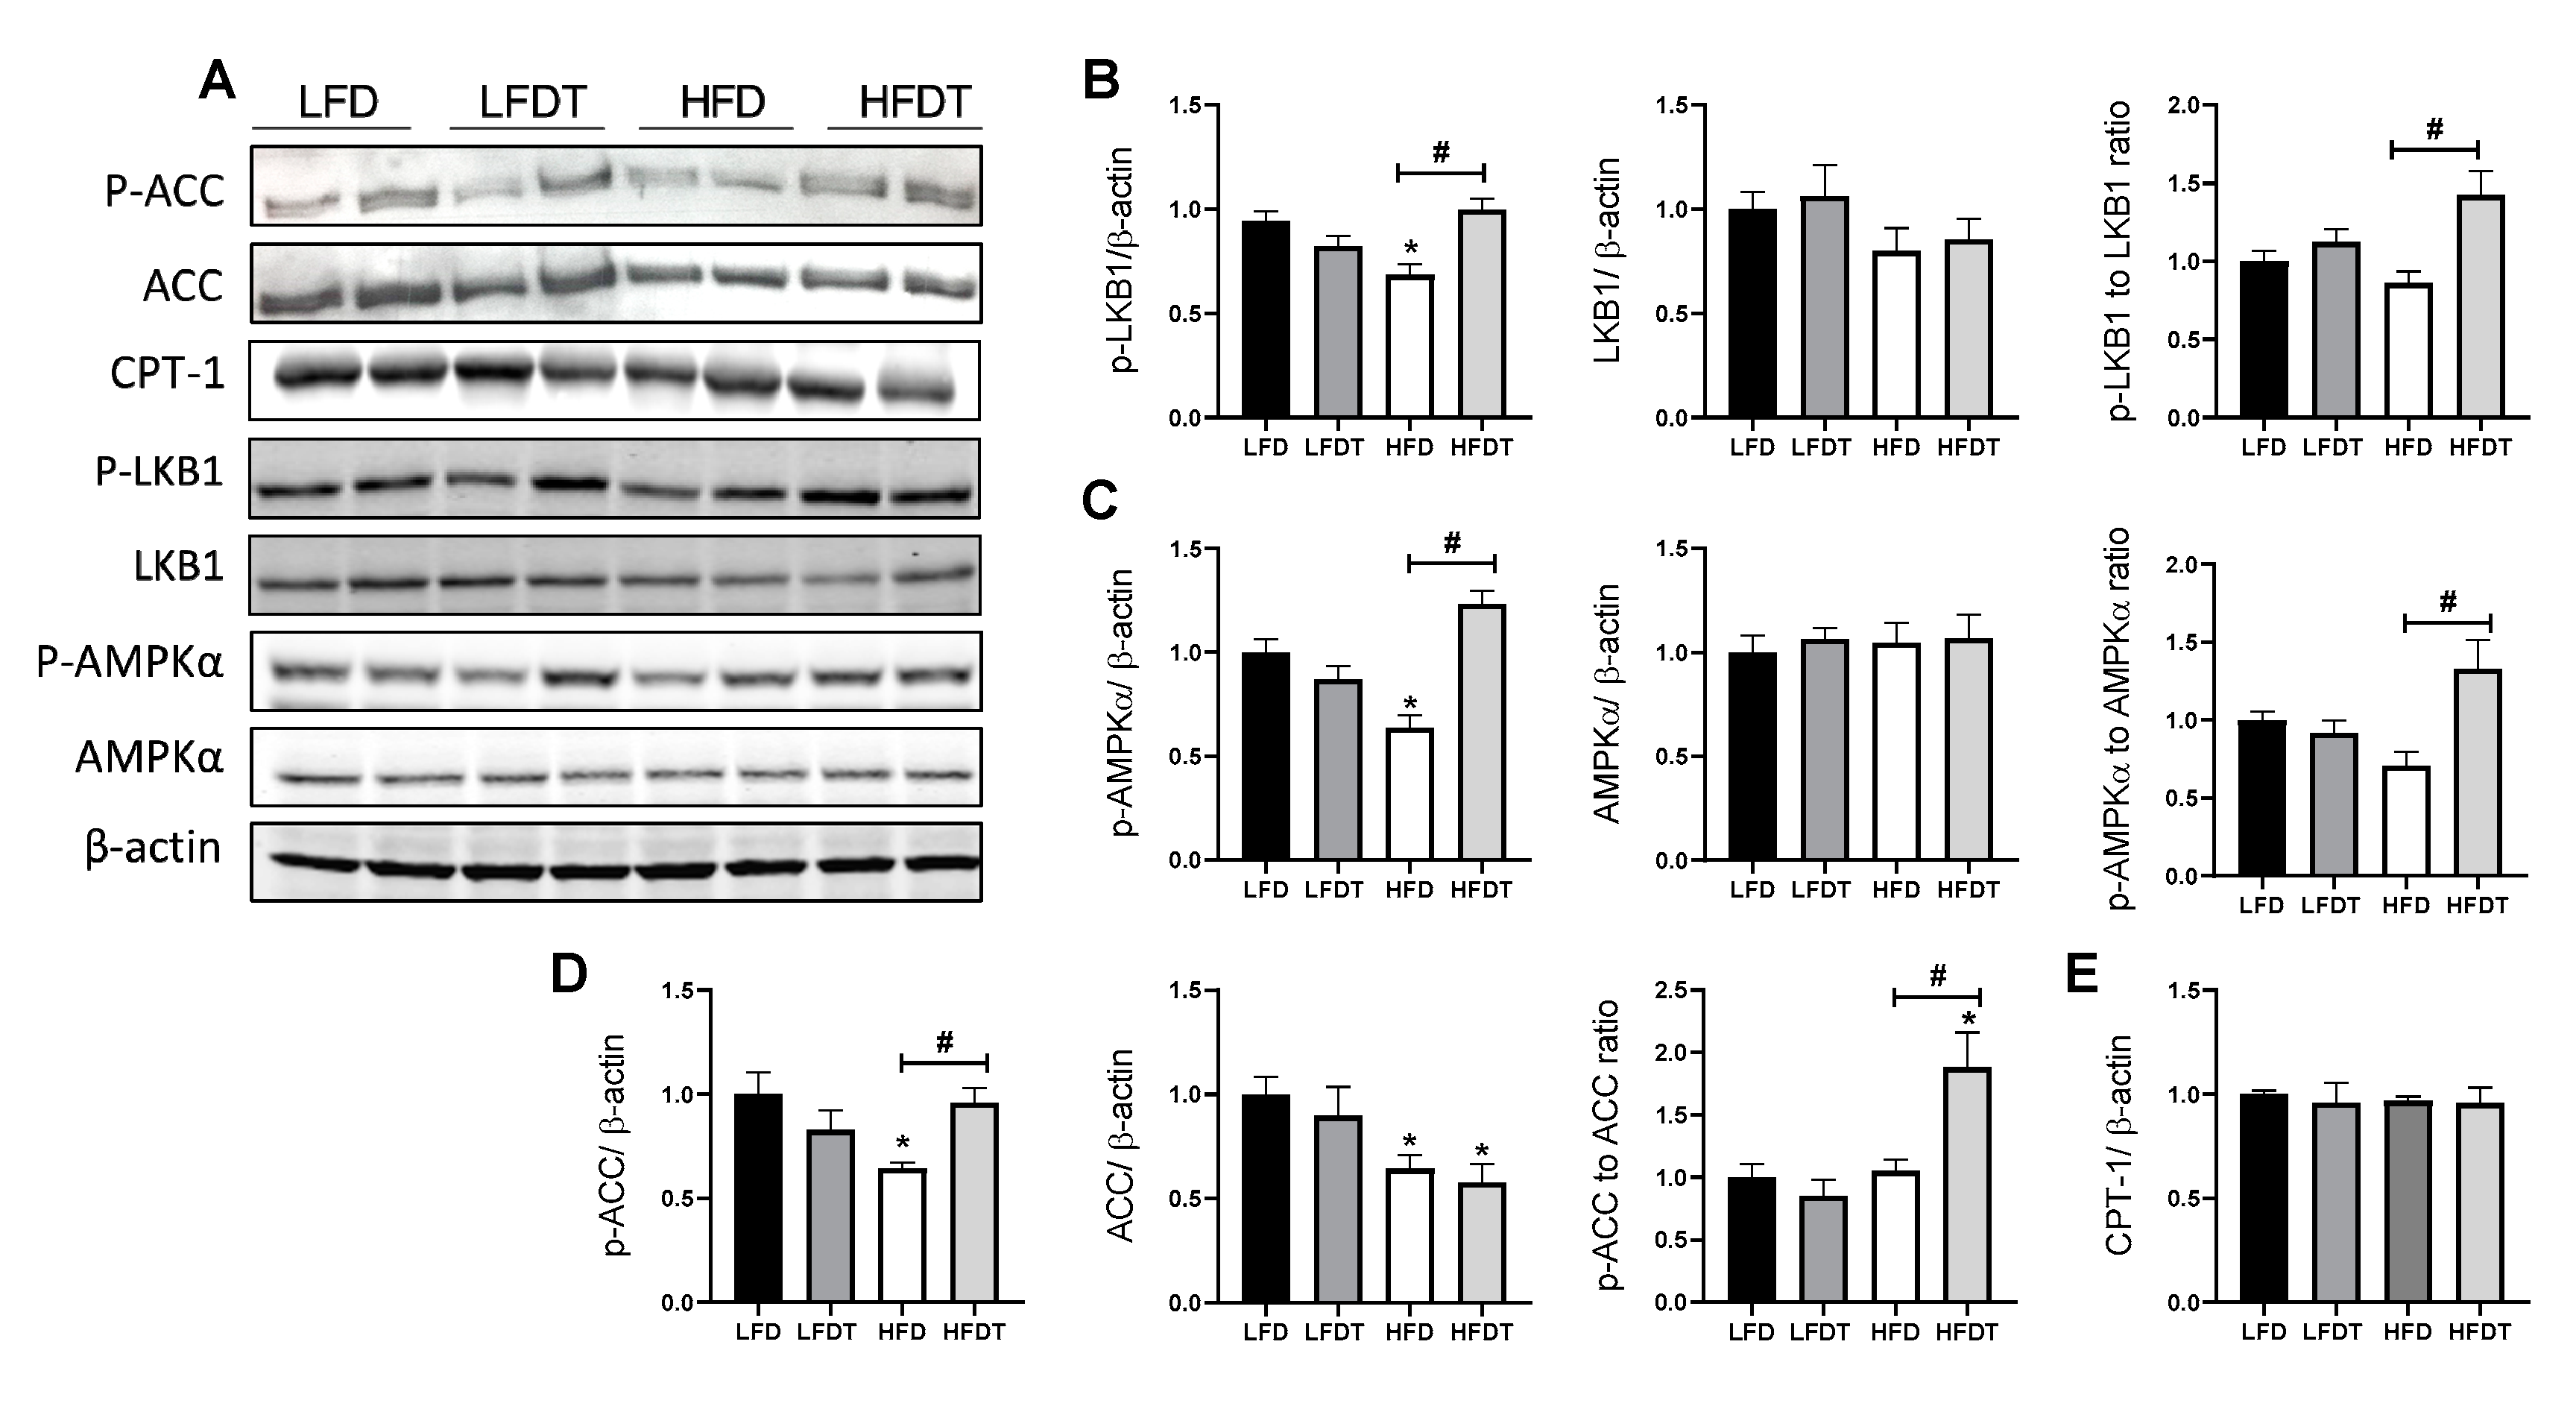
3.6. Delayed EET Enhances AMPK Activity in Renal Tissue of Obese Mice
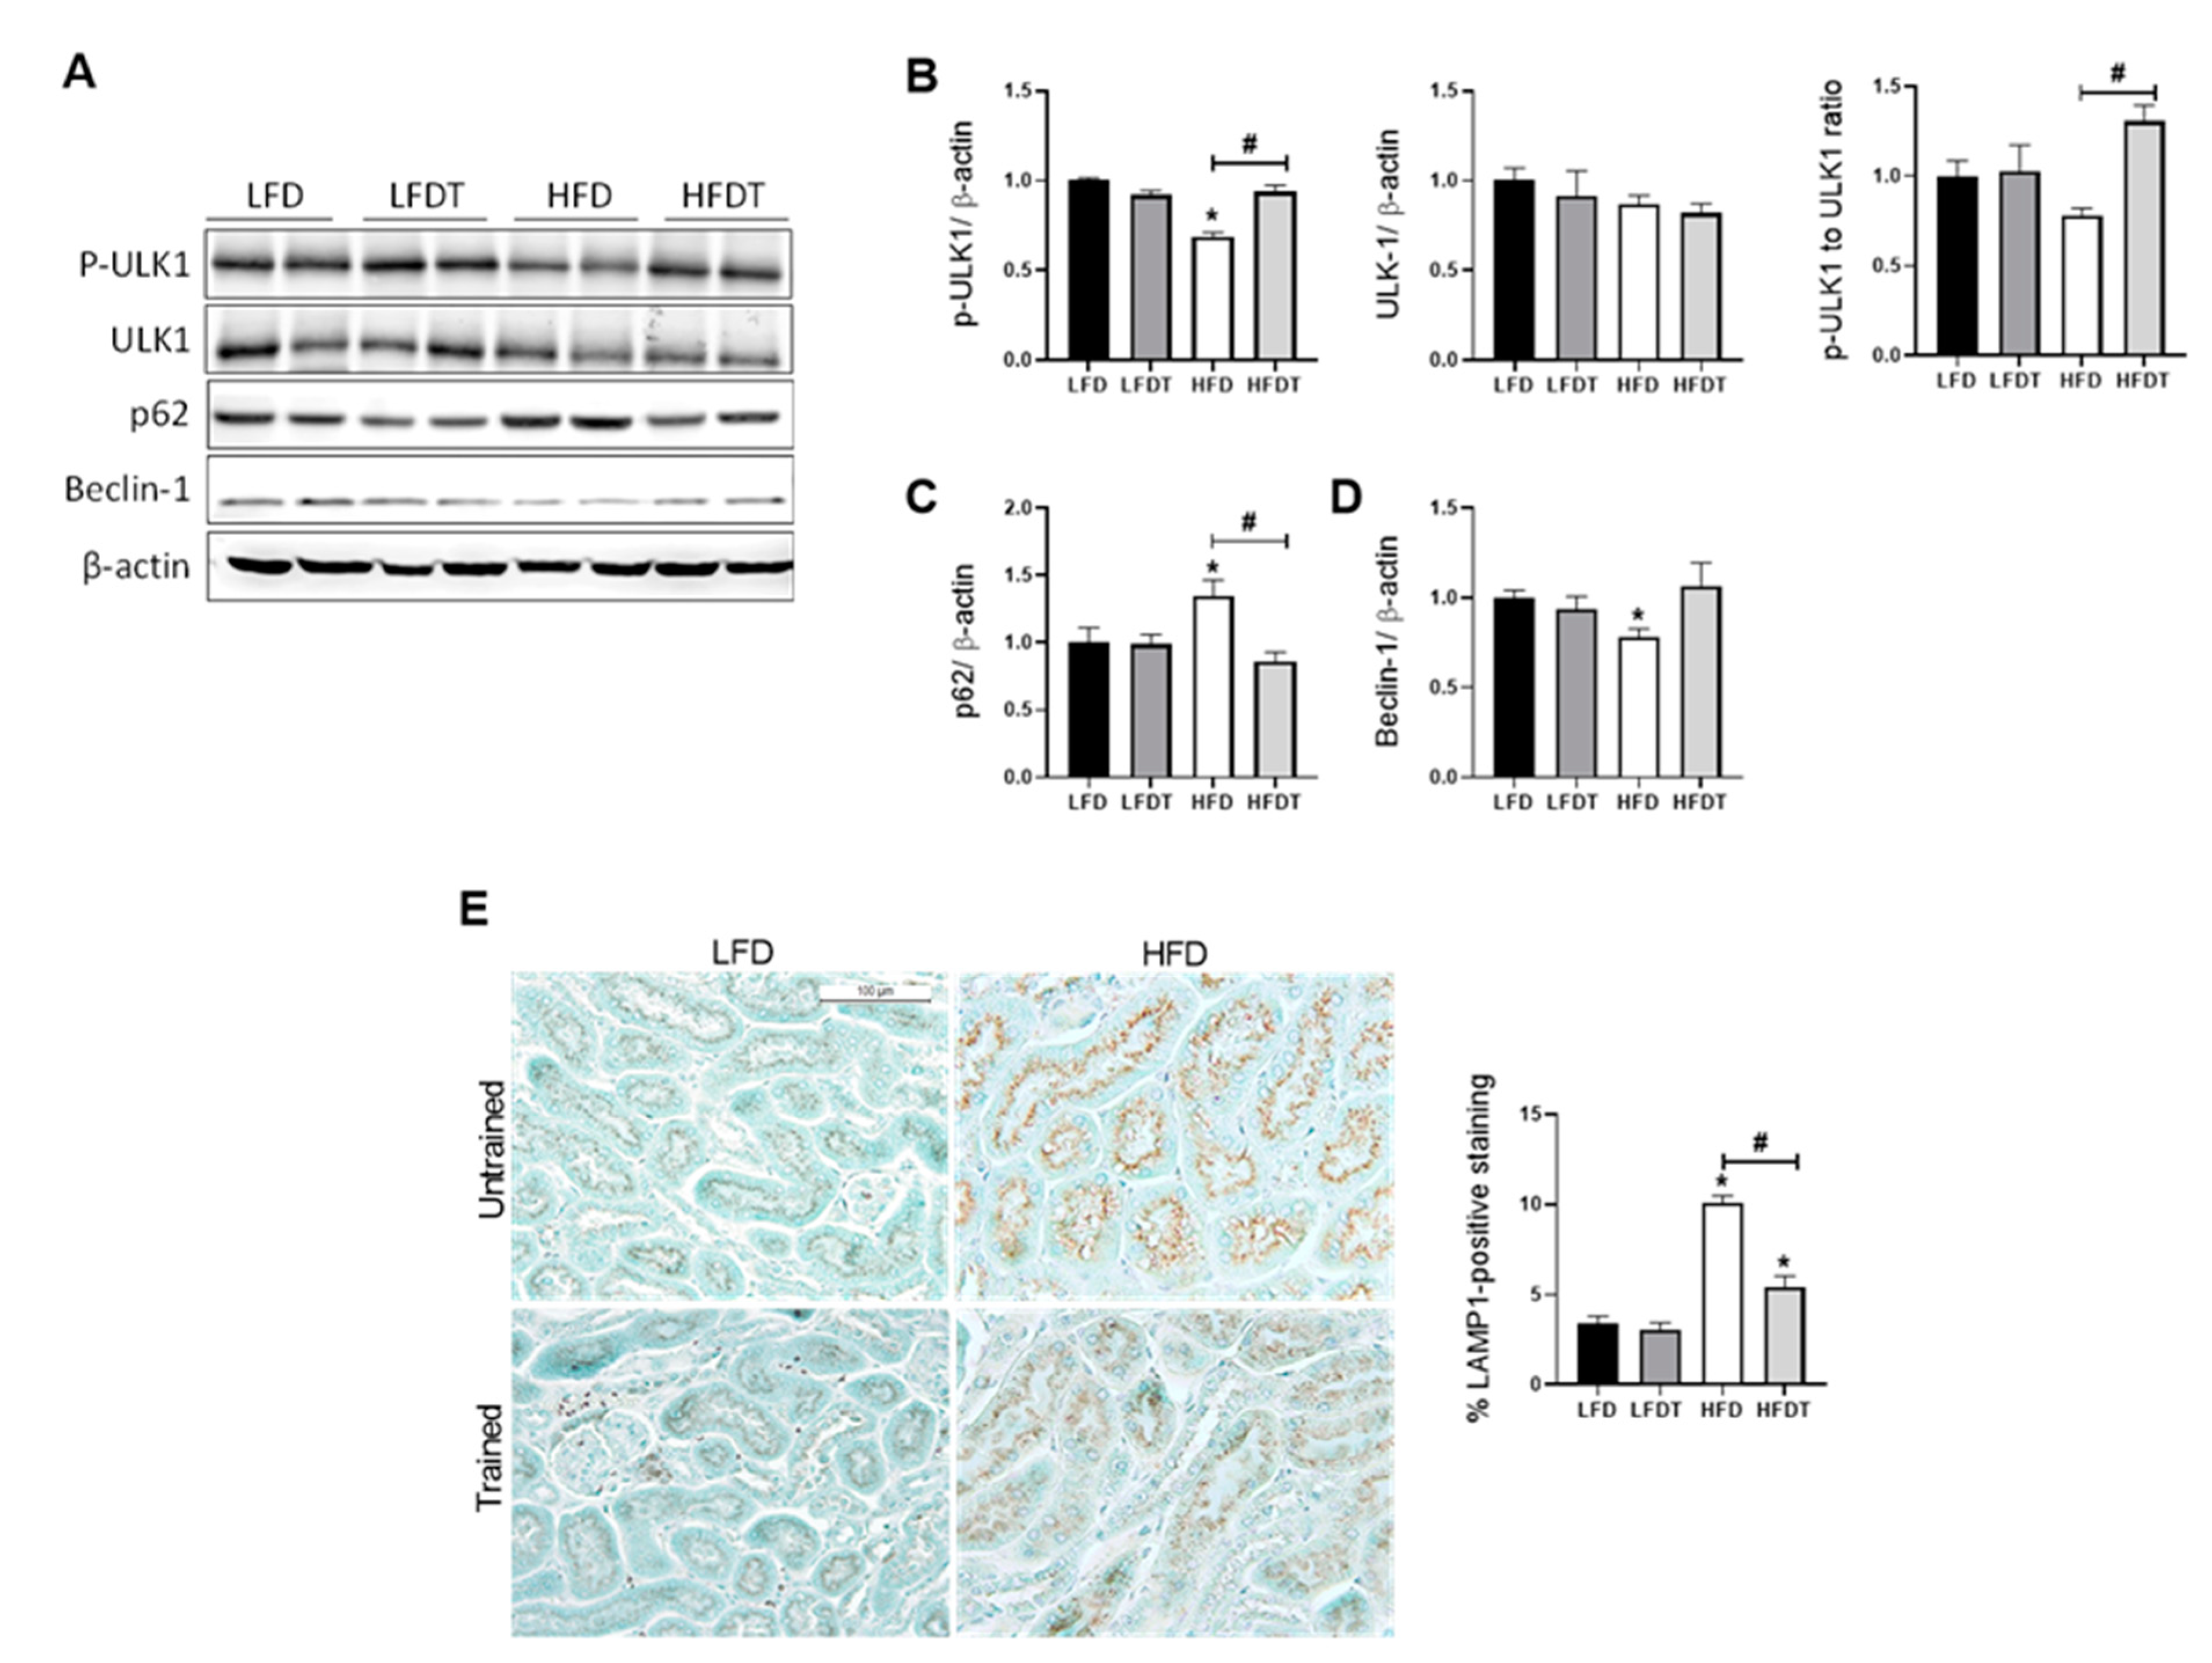
3.7. Delayed EET Improves Autophagy Flux in Obese Mice by AMPK-Mediated ULK1 Activation
4. Discussion
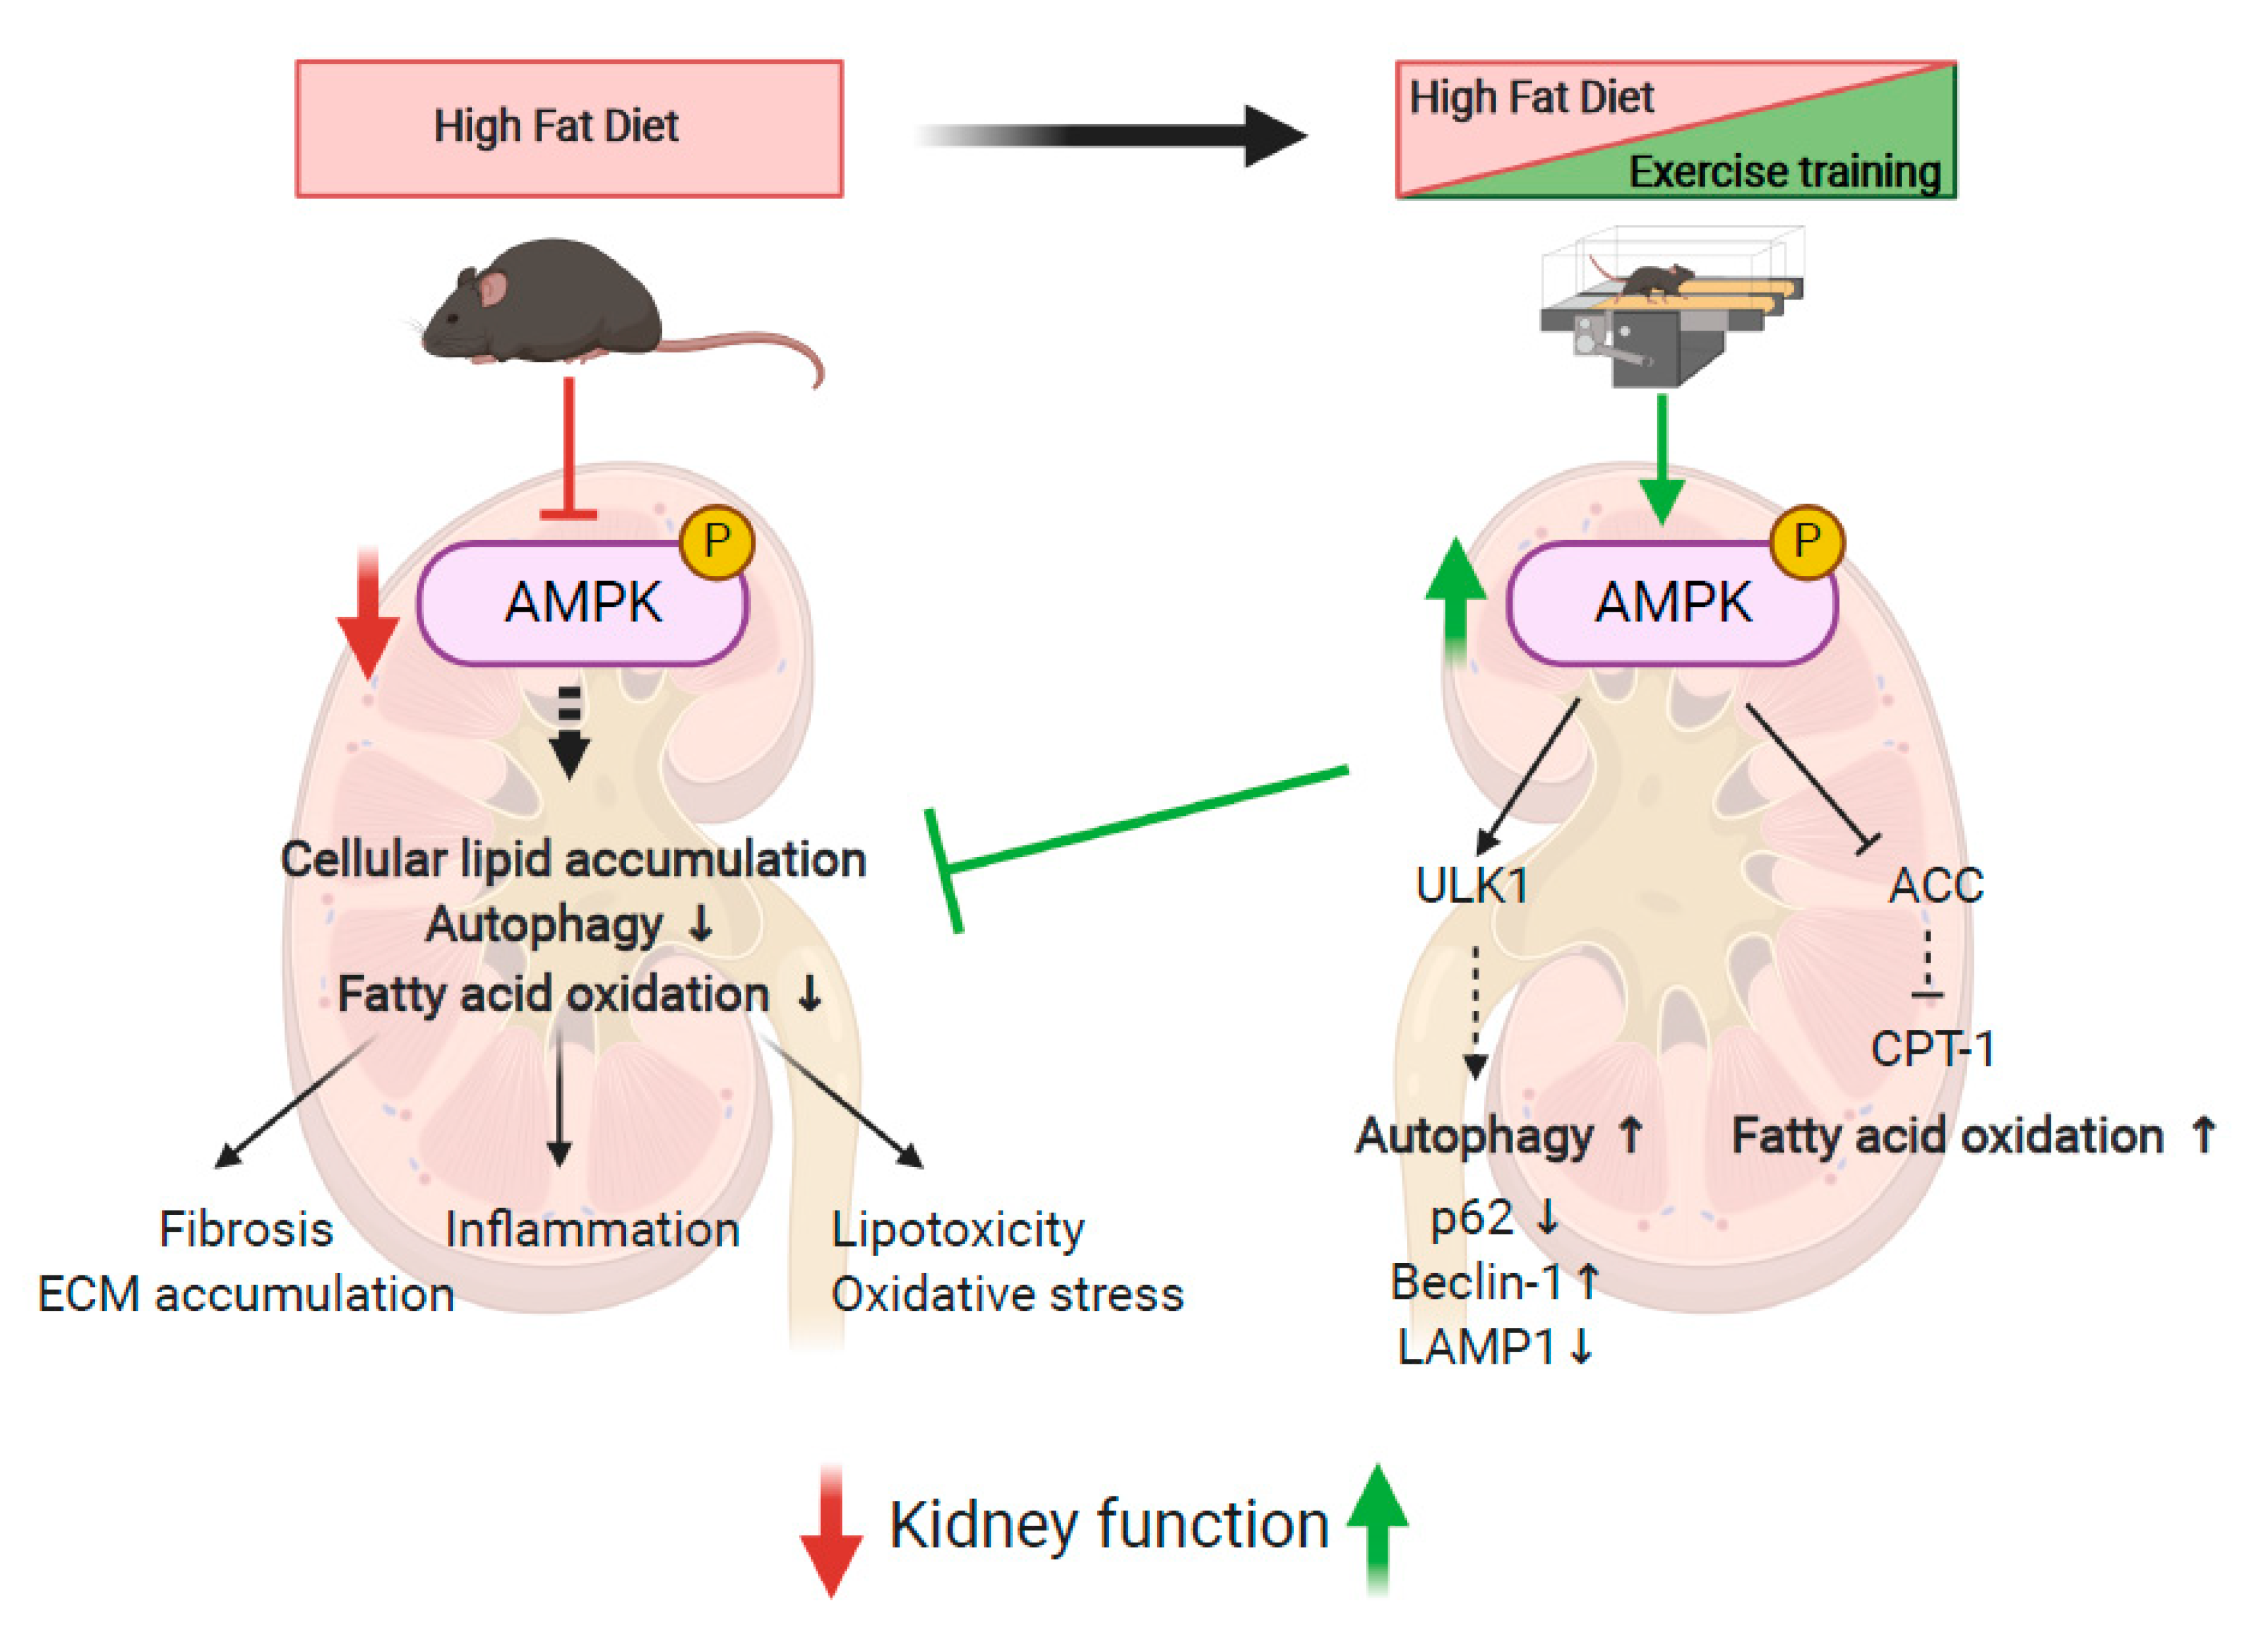
5. Conclusions
Supplementary Materials
Author Contributions
Funding
Institutional Review Board Statement
Data Availability Statement
Acknowledgments
Conflicts of Interest
References
- Garofalo, C.; Borrelli, S.; Minutolo, R.; Chiodini, P.; de Nicola, L.; Conte, G. A systematic review and meta-analysis suggests obesity predicts onset of chronic kidney disease in the general population. Kidney Int. 2017, 91, 1224–1235. [Google Scholar] [CrossRef] [PubMed]
- Després, J.-P.; Lemieux, I. Abdominal obesity and metabolic syndrome. Nature 2006, 444, 881–887. [Google Scholar] [CrossRef] [PubMed]
- Blüher, M. Obesity: Global epidemiology and pathogenesis. Nat. Rev. Endocrinol. 2019, 15, 288–298. [Google Scholar] [CrossRef] [PubMed]
- Ward, Z.J.; Bleich, S.N.; Cradock, A.L.; Barrett, J.L.; Giles, C.M.; Flax, C.; Long, M.W.; Gortmaker, S.L. Projected, U.S. State-Level Prevalence of Adult Obesity and Severe Obesity. N. Engl. J. Med. 2019, 381, 2440–2450. [Google Scholar] [CrossRef]
- Kovesdy, C.P.; Furth, S.; Zoccali, C. Obesity and kidney disease: Hidden consequences of the epidemic. Physiol. Int. Hung. 2017, 104, 1–14. [Google Scholar] [CrossRef] [Green Version]
- Tonelli, M. Effect of Pravastatin on Loss of Renal Function in People with Moderate Chronic Renal Insufficiency and Cardiovascular Disease. J. Am. Soc. Nephrol. 2003, 14, 1605–1613. [Google Scholar] [CrossRef] [Green Version]
- Deji, N.; Kume, S.; Araki, S.I.; Soumura, M.; Sugimoto, T.; Isshiki, K.; Kanasaki, M.C.; Sakaguchi, M.; Koya, D.; Haneda, M.; et al. Structural and functional changes in the kidneys of high-fat diet-induced obese mice. Am. J. Physiol. Renal Physiol. 2009, 296, 118–126. [Google Scholar] [CrossRef] [Green Version]
- D’Agati, V.D.; Chagnac, A.; de Vries, A.P.J.; Levi, M.; Porrini, E.; Herman-Edelstein, M.; Praga, M. Obesity-related glomerulopathy: Clinical and pathologic characteristics and pathogenesis. Nat. Rev. Nephrol. 2016, 12, 453–471. [Google Scholar] [CrossRef]
- Foster, M.C.; Hwang, S.-J.; Porter, S.A.; Massaro, J.M.; Hoffmann, U.; Fox, C.S. Fatty kidney, hypertension, and chronic kidney disease: The Framingham Heart Study. Hypertens 2011, 58, 784–790. [Google Scholar] [CrossRef] [Green Version]
- Declèves, A.E.; Zolkipli, Z.; Satriano, J.; Wang, L.; Nakayama, T.; Rogac, M.; Le, T.P.; Nortier, J.L.; Farquhar, M.G.; Naviaux, R.K.; et al. Regulation of lipid accumulation by AMP-activated kinase [corrected] in high fat diet-induced kidney injury. Kidney Int. 2014, 85, 611–623. [Google Scholar] [CrossRef] [Green Version]
- Kume, S.; Uzu, T.; Araki, S.I.; Sugimoto, T.; Isshiki, K.; Kanasaki, M.C.; Sakaguchi, M.; Kubota, N.; Terauchi, Y.; Kadowaki, T.; et al. Role of Altered Renal Lipid Metabolism in the Development of Renal Injury Induced by a High-Fat Diet. J. Am. Soc. Nephrol. 2007, 18, 2715–2723. [Google Scholar] [CrossRef] [PubMed] [Green Version]
- De Vries, A.P.J.; Ruggenenti, P.; Ruan, X.Z.; Praga, M.; Cruzado, J.M.; Bajema, I.M.; D’Agati, V.D.; Lamb, H.J.; Barlovic, D.P.; Hojs, R.; et al. Fatty kidney: Emerging role of ectopic lipid in obesity-related renal disease. Lancet Diabetes Endocrinol 2014, 2, 417–426. [Google Scholar] [CrossRef]
- Kang, H.M.; Ahn, S.H.; Choi, P.; Ko, Y.A.; Han, S.H.; Chinga, F.; Park, A.S.D.; Tao, J.; Sharma, K.; Pullman, J. Defective fatty acid oxidation in renal tubular epithelial cells has a key role in kidney fibrosis development. Nat. Med. 2014, 21, 37–46. [Google Scholar] [CrossRef] [PubMed]
- Szrejder, M.; Piwkowska, A. AMPK signalling: Implications for podocyte biology in diabetic nephropathy. Biol. Cell 2019, 111, 109–120. [Google Scholar] [CrossRef] [PubMed]
- Declèves, A.-E.; Mathew, A.V.; Cunard, R.; Sharma, K. AMPK Mediates the Initiation of Kidney Disease Induced by a High-Fat Diet. J. Am. Soc. Nephrol. 2011, 22, 1846–1855. [Google Scholar] [CrossRef] [PubMed] [Green Version]
- Stapleton, D.; Mitchelhill, K.I.; Gao, G.; Widmer, J.; Michell, B.J.; Teh, T.; House, C.M.; Fernandez, C.S.; Cox, T.; Witters, L.A.; et al. Mammalian AMP-activated protein kinase subfamily. J. Biol. Chem. 1996, 271, 611–614. [Google Scholar] [CrossRef] [Green Version]
- Herzig, S.; Shaw, R.J. AMPK: Guardian of metabolism and mitochondrial homeostasis. Nat. Rev. Mol. Cell Biol. 2017, 19, 121–135. [Google Scholar] [CrossRef] [Green Version]
- Bork, T.; Liang, W.; Yamahara, K.; Lee, P.; Tian, Z.; Liu, S.; Schell, C.; Thedieck, K.; Patel, B.H.K.; Louis, T.P.; et al. Podocytes maintain high basal levels of autophagy independent of mtor signaling. Autophagy 2019, 16, 1932–1948. [Google Scholar] [CrossRef] [PubMed] [Green Version]
- Yamahara, K.; Kume, S.; Koya, D.; Tanaka, Y.; Morita, Y.; Chin-Kanasaki, M.; Araki, H.; Isshiki, K.; Araki, S.; Haneda, M. Obesity-mediated autophagy insufficiency exacerbates proteinuria-induced tubulointerstitial lesions. J. Am. Soc. Nephrol. 2013, 24, 1769–1781. [Google Scholar] [CrossRef] [PubMed] [Green Version]
- Kang, J.G.; Park, C.-Y. Anti-Obesity Drugs: A Review about Their Effects and Safety. Diabetes Metab. J. 2012, 36, 13–25. [Google Scholar] [CrossRef] [PubMed] [Green Version]
- Srivastava, R.A.K.; Pinkosky, S.L.; Filippov, S.; Hanselman, J.C.; Cramer, C.T.; Newton, R.S. AMP-activated protein kinase: An emerging drug target to regulate imbalances in lipid and carbohydrate metabolism to treat cardio-metabolic diseases. J. Lipid Res. 2012, 53, 2490–2514. [Google Scholar] [CrossRef] [PubMed] [Green Version]
- Olivier, S.; Foretz, M.; Viollet, B. Promise and challenges for direct small molecule AMPK activators. Biochem. Pharmacol. 2018, 153, 147–158. [Google Scholar] [CrossRef] [PubMed]
- Katzmarzyk, P.T.; Leon, A.S.; Wilmore, J.H.; Skinner, J.S.; Rao, D.C.; Rankinen, T.; Bouchard, C. Targeting the metabolic syndrome with exercise: Evidence from the HERITAGE Family Study. Med. Sci. Sports Exerc. 2003, 35, 1703–1709. [Google Scholar] [CrossRef] [PubMed] [Green Version]
- Ross, R.; Després, J.-P. Abdominal Obesity, Insulin Resistance, and the Metabolic Syndrome: Contribution of Physical Activity/Exercise. Obesity 2009, 17, S1–S2. [Google Scholar] [CrossRef]
- Hiraki, K.; Shibagaki, Y.; Izawa, K.P.; Hotta, C.; Wakamiya, A.; Sakurada, T.; Yasuda, T.; Kimura, K. Effects of home-based exercise on pre-dialysis chronic kidney disease patients: A randomized pilot and feasibility trial. BMC Nephrol. 2017, 18, 198. [Google Scholar] [CrossRef] [Green Version]
- Heiwe, S.; Jacobson, S.H. Exercise training for adults with chronic kidney disease. Cochrane Database Syst. Rev. 2011, 10, CD003236. [Google Scholar] [CrossRef]
- Qiu, Z.; Zheng, K.; Zhang, H.; Feng, J.; Wang, L.; Zhou, H. Physical Exercise and Patients with Chronic Renal Failure: A Meta-Analysis. BioMed Res. Int. 2017, 2017, 7191826. [Google Scholar] [CrossRef]
- Ikizler, T.A.; Cohen, C.R.; Ellis, C.; Headley, S.A.E.; Tuttle, K.; Wood, R.J.; Evans, E.E.; Milch, C.M.; Moody, K.A.; Germain, M.; et al. Metabolic Effects of Diet and Exercise in Patients with Moderate to Severe CKD: A Randomized Clinical Trial. J. Am. Soc. Nephrol. 2018, 9, 250–259. [Google Scholar] [CrossRef]
- Pierard, M.; Conotte, S.; Tassin, A.; Boutry, S.; Uzureau, P.; Boudjeltia, K.Z.; Legrand, A. Interactions of exercise training and high-fat diet on adiponectin forms and muscle receptors in mice. Nutr. Metab. (Lond.) 2016, 13, 75. [Google Scholar] [CrossRef]
- Debelle, F.D.; Nortier, J.L.; de Prez, E.G.; Garbar, C.H.; Vienne, A.R.; Salmon, I.J.; Deschodt-Lanckman, M.M.; Vanherweghem, L.J. Aristolochic acids induce chronic renal failure with interstitial fibrosis in salt-depleted rats. J. Am. Soc. Nephrol. 2002, 13, 431–436. [Google Scholar]
- Sheehan, S.M.; Korstanje, R. Automatic glomerular identification and quantification of histological phenotypes using image analysis and machine learning. Am. J. Physiol. Renal Physiol. 2018, 315, F1644–F1651. [Google Scholar] [CrossRef] [PubMed] [Green Version]
- Ryu, R.-E.; Jo, W.; Choi, H.; Jang, S.; Lee, H.; Woo, D.C.; Kim, J.K.; Kim, K.W.; Yu, E.S.; Son, W. Evaluation of Nonalcoholic Fatty Liver Disease in C57BL/6J Mice by Using MRI and Histopathologic Analyses. Comp. Med. 2015, 65, 409–415. [Google Scholar] [PubMed]
- Aleidi, S.; Issa, A.; Bustanji, H.; Khalil, M.; Bustanji, Y. Adiponectin serum levels correlate with insulin resistance in type 2 diabetic patients. Saudi Pharm. J. 2015, 23, 250–256. [Google Scholar] [CrossRef] [PubMed] [Green Version]
- Pajvani, B.; Hawkins, M.; Combs, T.P.; Rajala, M.W.; Doebber, T.; Berger, J.P.; Wagner, J.A.; Wu, M.; Knopps, A.; Xiang, A.H.; et al. Complex distribution, not absolute amount of adiponectin, correlates with thiazolidinedione-mediated improvement in insulin sensitivity. J. Biol. Chem. 2004, 279, 12152–12162. [Google Scholar] [CrossRef] [PubMed] [Green Version]
- Alex, S.; Boss, A.; Heerschap, A.; Kersten, S. Exercise training improves liver steatosis in mice. Nutr. Metab. (Lond.) 2015, 12, 29. [Google Scholar] [CrossRef] [PubMed] [Green Version]
- Lavie, C.J.; Pandey, A.; Lau, D.H.; Alpert, M.A.; Sanders, P. Obesity and Atrial Fibrillation Prevalence, Pathogenesis, and Prognosis: Effects of Weight Loss and Exercise. J. Am. Coll. Cardiol. 2017, 70, 2022–2035. [Google Scholar] [CrossRef]
- Lee, S.; Kuk, J.L.; Davidson, L.E.; Hudson, R.; Kilpatrick, K.; Graham, T.; Ross, R. Exercise without weight loss is an effective strateg.y for obesity reduction in obese individuals with and without Type 2 diabetes. J. Appl. Physiol. 2005, 99, 1220–1225. [Google Scholar] [CrossRef]
- Petridou, A.; Siopi, A.; Mougios, V. Exercise in the management of obesity. Metabolism 2019, 92, 163–169. [Google Scholar] [CrossRef] [Green Version]
- De Carvalho, F.P.; Moretto, T.L.; Benfato, I.D.; Barthichoto, M.; Ferreira, S.M.; Júnior, J.M.C.; de Oliveira, C.A.M. Central and peripheral effects of physical exercise without weight reduction in obese and lean mice. Biosci. Rep. 2018, 38, BSR20171033. [Google Scholar] [CrossRef] [Green Version]
- Chaar, L.J.; Coelho, A.; Silva, N.M.; Festuccia, W.L.; Antunes, V.R. High-fat diet-induced hypertension and autonomic imbalance are associated with an upregulation of CART in the dorsomedial hypothalamus of mice. Physiol. Rep. 2016, 4, e12811. [Google Scholar] [CrossRef] [Green Version]
- Hariri, N.; Thibault, L. High-fat diet-induced obesity in animal models. Nutr. Res. Rev. 2010, 23, 270–299. [Google Scholar] [CrossRef] [PubMed] [Green Version]
- Farzanegi, P.; Dana, A.; Ebrahimpoor, Z.; Asadi, M.; Azarbayjani, M.A. Mechanisms of beneficial effects of exercise training on non-alcoholic fatty liver disease (NAFLD): Roles of oxidative stress and inflammation. Eur. J. Sport Sci. 2019, 19, 994–1003. [Google Scholar] [CrossRef] [PubMed]
- Castaneda, C.; Layne, J.E.; Munoz-Orians, L.; Gordon, P.L.; Walsmith, J.; Foldvari, M.; Roubenoff, R.; Tucker, K.L.; Nelson, M.E. A randomized controlled trial of resistance exercise training to improve glycemic control in older adults with type 2 diabetes. Diabetes Care 2002, 25, 2335–2341. [Google Scholar] [CrossRef] [Green Version]
- Ivy, J.L. Role of exercise training in the prevention and treatment of insulin resistance and non-insulin-dependent diabetes mellitus. Sports Med. 1997, 24, 321–336. [Google Scholar] [CrossRef] [PubMed]
- Bird, S.R.; Hawley, J.A. Update on the effects of physical activity on insulin sensitivity in humans. BMJ Open Sport Exerc. Med. 2016, 2, e000143. [Google Scholar] [CrossRef] [PubMed] [Green Version]
- O’Neill, H.M. AMPK and Exercise: Glucose Uptake and Insulin Sensitivity. Diabetes Metab. J. 2013, 37, 1–21. [Google Scholar] [CrossRef] [PubMed] [Green Version]
- Zhu, N.; Pankow, J.S.; Ballantyne, C.M.; Couper, D.; Hoogeveen, R.C.; Pereira, M.; Duncan, B.B.; Schmidt, M.I. High-molecular-weight adiponectin and the risk of type 2 diabetes in the ARIC study. J. Clin. Endocrinol. Metab. 2010, 95, 5097–5104. [Google Scholar] [CrossRef]
- Glass, O.K.; Radia, A.; Kraus, W.E.; Abdelmalek, M.F. Exercise Training as Treatment of Nonalcoholic Fatty Liver Disease. J. Funct. 2017, 2, 35. [Google Scholar] [CrossRef]
- Chun, S.K.; Lee, S.; Yang, M.-J.; Leeuwenburgh, C.; Kim, J.-S. Exercise-Induced Autophagy in Fatty Liver Disease. Exerc. Sport Sci. Rev. 2017, 45, 181–186. [Google Scholar] [CrossRef]
- Takahashi, H.; Kotani, K.; Tanaka, K.; Egucih, Y.; Anzai, K. Therapeutic Approaches to Nonalcoholic Fatty Liver Disease: Exercise Intervention and Related Mechanisms. Front. Endocrinol. 2018, 9, 588. [Google Scholar] [CrossRef]
- Mendizábal, Y.; Llorens, S.; Nava, E. Hypertension in metabolic syndrome: Vascular pathophysiology. Int. J. Hypertens. 2013, 2013, 230868. [Google Scholar] [CrossRef] [PubMed] [Green Version]
- Sakamoto, S. Prescription of exercise training for hypertensives. Hypertens. Res. 2020, 43, 155–161. [Google Scholar] [CrossRef] [PubMed]
- Nascimento, T.B.; Ekeledo, O.J.; Anderson, R.; Le, H.B.; de Chantemèle, E.J.B. Long Term High Fat Diet Treatment: An Appropriate Approach to Study the Sex-Specificity of the Autonomic and Cardiovascular Responses to Obesity in Mice. Front. Physiol. 2017, 8, 32. [Google Scholar]
- Stump, C.S. Physical Activity in the Prevention of Chronic Kidney Disease. Cardiorenal Med. 2011, 1, 164–173. [Google Scholar] [CrossRef] [Green Version]
- Muller, C.R.; Americo, A.L.V.; Fiorino, P.; Evangelista, F.S. Aerobic exercise training prevents kidney lipid deposition in mice fed a cafeteria diet. Life Sci. 2018, 211, 140–146. [Google Scholar] [CrossRef]
- Fassett, R.G.; Venuthurupalli, S.K.; Gobem, G.C.; Coombes, J.S.; Cooper, M.A.; Hoy, W.E. Biomarkers in chronic kidney disease: A review. Kidney Int. 2011, 80, 806–821. [Google Scholar] [CrossRef] [PubMed] [Green Version]
- Viollet, B.; Horman, S.; Leclerc, J.; Lantier, L.; Foretz, M.; Billaud, M.; Giri, S.; Andreelli, F. AMPK inhibition in health and disease. Crit. Rev. Biochem. Mol. Biol. 2010, 45, 276–295. [Google Scholar] [CrossRef] [PubMed] [Green Version]
- Jeon, S.-M. Regulation and function of AMPK in physiology and diseases. Exp. Mol. Med. 2016, 48, e245. [Google Scholar] [CrossRef] [PubMed]
- Dugan, L.L.; You, Y.H.; Ali, S.S.; Stanic, M.D.; Miyamoto, S.; de Cleves, A.E.; Andreyev, A.; Quach, T.; Ly, S.; Shekhtman, G.; et al. AMPK dysregulation promotes diabetes-related reduction of superoxide and mitochondrial function. J. Clin. Investig. 2013, 123, 4888–4899. [Google Scholar] [CrossRef] [Green Version]
- Al-Rasheed, N.M.; Al-Rasheed, N.M.; Attia, H.A.; Al-Amin, M.A.; Al-Ajmi, H.N.; Hasan, I.H.; Mohamad, R.A.; Sinjilawi, N.A. Renoprotective Effects of Fenofibrate via Modulation of LKB1/AMPK mRNA Expression and Endothelial Dysfunction in a Rat Model of Diabetic Nephropathy. Pharmacology 2015, 95, 229–239. [Google Scholar] [CrossRef]
- Rogacka, D.; Audzeyenka, I.; Rychłowski, M.; Rachubik, P.; Szrejder, M.; Angielski, S.; Piwkowsk, A. Metformin overcomes high glucose-induced insulin resistance of podocytes by pleiotropic effects on SIRT1 and AMPK. Biochim. Biophys. Acta Mol. Basis Dis. 2018, 1864, 115–125. [Google Scholar] [CrossRef] [PubMed]
- Zhou, Y.; Lin, S.; Zhang, L.; Li, Y. Resveratrol prevents renal lipotoxicity in high-fat diet-treated mouse model through regulating PPAR-α pathway. Mol. Cell Biochem. 2016, 411, 143–150. [Google Scholar] [CrossRef] [PubMed]
- Choi, S.R.; Lim, J.H.; Kim, M.Y.; Kim, E.N.; Kim, Y.; Choi, B.S.; Kim, Y.; Kim, H.W.; Lim, K.M.; Kim, M.J. Adiponectin receptor agonist AdipoRon decreased ceramide, and lipotoxicity, and ameliorated diabetic nephropathy. Metabolism 2018, 85, 348–360. [Google Scholar] [CrossRef] [PubMed]
- Juszczak, F.; Caron, N.; Mathew, A.V.; Declèves, A.-E. Critical Role for AMPK in Metabolic Disease-Induced Chronic Kidney Disease. Int. J. Mol. Sci. 2020, 21, 7994. [Google Scholar] [CrossRef]
- Lin, T.-A.; Wu, V.C.-C.; Wang, C.-Y. Autophagy in Chronic Kidney Diseases. Cells 2019, 8, 61. [Google Scholar] [CrossRef] [Green Version]
- Dikic, I.; Elazar, Z. Mechanism and medical implications of mammalian autophagy. Nat. Rev. Mol. Cell Biol. 2018, 19, 349–364. [Google Scholar] [CrossRef]
- Satriano, J.; Sharma, K. Autophagy and metabolic changes in obesity-related chronic kidney disease. Nephrol. Dial. Transplant. 2013, 28, iv29–iv36. [Google Scholar] [CrossRef] [Green Version]
- Yamamoto, T.; Takabatake, Y.; Takahashi, A.; Kimura, T. High-Fat Diet-Induced Lysosomal Dysfunction and Impaired Autophagic Flux Contribute to Lipotoxicity in the Kidney. J. Am. Soc. Nephrol. 2016, 1–18. [Google Scholar] [CrossRef]
- He, C.; Bassik, M.C.; Moresi, V.; Sun, K.; Wei, Y.; Zou, Z.; An, Z.; Loh, J.; Fisher, J.; Sun, Q. Exercise-induced BCL2-regulated autophagy is required for muscle glucose homeostasis. Nature 2012, 481, 511–515. [Google Scholar] [CrossRef] [Green Version]
- Klionsky, D.J.; Abdelmohsen, K.; Abe, A.; Abedin, M.J.; Abeliovich, H.; Arozena, A.A.; Adachi, H.; Adams, C.M.; Adams, P.D.; Adeli, K.; et al. Guidelines for the use and interpretation of assays for monitoring autophagy (3rd edition). Autophagy 2016, 12, 1–222. [Google Scholar] [CrossRef] [Green Version]
- Peng, H.; Wang, Q.; Lou, T.; Qin, J.; Jung, S.; Shetty, V.; Li, F.; Wang, Y.; Feng, X.H.; Mitch, W.E.; et al. Myokine mediated muscle-kidney crosstalk suppresses metabolic reprogramming and fibrosis in damaged kidneys. Nat. Commun. 2017, 8, 1493. [Google Scholar] [CrossRef] [PubMed] [Green Version]
- Xin, C.; Liu, J.; Zhang, J.; Zhu, D.; Wang, H.; Xiong, L.; Lee, Y.; Ye, J.; Lian, K.; Xu, C.; et al. Irisin improves fatty acid oxidation and glucose utilization in type 2 diabetes by regulating the AMPK signaling pathway. Int. J. Obes. (Lond.) 2016, 40, 443–451. [Google Scholar] [CrossRef] [PubMed]


Publisher’s Note: MDPI stays neutral with regard to jurisdictional claims in published maps and institutional affiliations. |
© 2020 by the authors. Licensee MDPI, Basel, Switzerland. This article is an open access article distributed under the terms and conditions of the Creative Commons Attribution (CC BY) license (http://creativecommons.org/licenses/by/4.0/).
Share and Cite
Juszczak, F.; Vlassembrouck, M.; Botton, O.; Zwakhals, T.; Decarnoncle, M.; Tassin, A.; Caron, N.; Declèves, A.-E. Delayed Exercise Training Improves Obesity-Induced Chronic Kidney Disease by Activating AMPK Pathway in High-Fat Diet-Fed Mice. Int. J. Mol. Sci. 2021, 22, 350. https://doi.org/10.3390/ijms22010350
Juszczak F, Vlassembrouck M, Botton O, Zwakhals T, Decarnoncle M, Tassin A, Caron N, Declèves A-E. Delayed Exercise Training Improves Obesity-Induced Chronic Kidney Disease by Activating AMPK Pathway in High-Fat Diet-Fed Mice. International Journal of Molecular Sciences. 2021; 22(1):350. https://doi.org/10.3390/ijms22010350
Chicago/Turabian StyleJuszczak, Florian, Maud Vlassembrouck, Olivia Botton, Thomas Zwakhals, Morgane Decarnoncle, Alexandra Tassin, Nathalie Caron, and Anne-Emilie Declèves. 2021. "Delayed Exercise Training Improves Obesity-Induced Chronic Kidney Disease by Activating AMPK Pathway in High-Fat Diet-Fed Mice" International Journal of Molecular Sciences 22, no. 1: 350. https://doi.org/10.3390/ijms22010350