Article

Genome-Wide Survey and Expression Analysis of the KT/HAK/KUP Family in Brassica napus and Its Potential Roles in the Response to K+ Deficiency

1
College of Agronomy and Biotechnology, Southwest University, Chongqing 400716, China
2
Academy of Agricultural Sciences, Southwest University, Chongqing 400716, China
*
Authors to whom correspondence should be addressed.
Int. J. Mol. Sci. 2020, 21(24), 9487; https://doi.org/10.3390/ijms21249487
Submission received: 20 November 2020 / Revised: 10 December 2020 / Accepted: 11 December 2020 / Published: 13 December 2020
(This article belongs to the Collection Feature Papers in Molecular Plant Sciences)

Abstract

:
The KT/HAK/KUP (HAK) family is the largest potassium (K+) transporter family in plants, which plays key roles in K+ uptake and homeostasis, stress resistance, and root and embryo development. However, the HAK family has not yet been characterized in Brassica napus. In this study, 40 putative B. napus HAK genes (BnaHAKs) are identified and divided into four groups (Groups I–III and V) on the basis of phylogenetic analysis. Gene structure analysis revealed 10 conserved intron insertion sites across different groups. Collinearity analysis demonstrated that both allopolyploidization and small-scale duplication events contributed to the large expansion of BnaHAKs. Transcription factor (TF)-binding network construction, cis-element analysis, and microRNA prediction revealed that the expression of BnaHAKs is regulated by multiple factors. Analysis of RNA-sequencing data further revealed extensive expression profiles of the BnaHAKs in groups II, III, and V, with limited expression in group I. Compared with group I, most of the BnaHAKs in groups II, III, and V were more upregulated by hormone induction based on RNA-sequencing data. Reverse transcription-quantitative polymerase reaction analysis revealed that the expression of eight BnaHAKs of groups I and V was markedly upregulated under K+-deficiency treatment. Collectively, our results provide valuable information and key candidate genes for further functional studies of BnaHAKs.

1. Introduction

Potassium (K+) is the most abundant nutrient element in plants, accounting for 10% of the dry weight [1], and plays essential roles in protein synthesis [2], phloem transport [3], osmoregulation [4], and plant development [5]. K+ can also enhance the resistance to biotic and abiotic stress for improving the plant growth status. Therefore, plants often exhibit signs of chlorosis and necrosis under a state of K+ deficiency, resulting in a functional decline in leaf photosynthesis, and consequently compromising crop yield and quality [6,7]. The soil K+ concentration is generally considered to vary between 0.1 and 1 mM [8]; however, a large portion of cultivated land worldwide remains K+-deficient [9,10]. Consequently, the proper use of K+ fertilizer and increasing utilization of K+ will contribute to sustainable crop production and high-quality crops. Brassica napus is an important oil crop that requires abundant K+ to sustain its growth and yield, with a K+ demand of 290–373 kg per hectare [11,12]. However, Ren et al. [12] found that K+ deficiency in soil remains a long-neglected problem in China. Therefore, it is meaningful to elucidate the mechanism of K+ uptake in B. napus.
The KT/HAK/KUP (HAK) gene family encodes the most well-known high-affinity K+ transporters [13,14], which play important roles in diverse plant bioprocesses, especially in K+ uptake and transport. For example, HvHAK1 from Hordeum vulgare (barley) [15], AtHAK5 from Arabidopsis [16], LeHAK5 from Lycopersicon esculentum (tomato) [17], and OsHAK1 from Oryza sativa (rice) [18] are associated with high-affinity K+ uptake in the roots. Many genes such as AtKUP7 [19], AtKUP12 [20], OsHAK11 and OsHAK12 [21] are strongly induced under K+ deficiency. In addition, some other HAK genes (HAKs) have been proposed to encode low-affinity K+ transporters and complement K+ channels, such as HvHAK2 [22] and CnHAK1 [23]. Notably, various members of the HAK family play a crucial role in plant abiotic stress. For instance, AtKUP6 and OsHAK1 can enhance plant tolerance to drought [4,24], and OsHAK16 and ZmHAK4 can improve salt resistance [25,26]. Furthermore, HAKs participate in many plant growth and development processes. For example, AtKUP9 can regulate K+ and auxin homeostasis to maintain root development [27]; VvKUP1 and VvKUP2 are likely involved in K+-mediated cell expansion in Vitis vinifera [28]; and AtKUP2, AtKUP6, and AtKUP8 regulate K+ efflux to negatively affect lateral root formation [4]. Among these genes, AtKUP2 mutants were shown to contribute to the short hypocotyl phenotype [29] and the AtKUP4 mutant is responsible for the tiny root hair phenotype [30].
The HAK family is the largest gene family involved in K+ transport in plants, and has been widely identified in many plant species, including Arabidopsis [31], rice [14], Triticum aestivum (wheat) [32], and Saccharum (sugarcane) [33]. HAK proteins can be classified into the major facilitator superfamily of membrane transporters [34], and function as homodimers, with each monomer comprising 10–14 transmembrane (TM) domains [35,36]. In recent years, the HAK family was proposed to be classified into five groups (I–V) [37,38,39], with different numbers and attributes of HAKs identified in varied species or lineages.
In this study, we perform genome-wide identification and analysis of the HAK family in the B. napus genome, and identify 40 putative genes (BnaHAKs) belonging to four groups (I–III and V), with no HAKs identified in group IV. We further investigate the gene structure, chromosome localization, collinearity, transcription factors (TFs), cis-elements, microRNA (miRNA) targets, and protein tertiary structure for the identified BnaHAKs. We also analyze their expression profiles in 50 tissues at different stages throughout plant development and under five hormone treatments [abscisic acid (ABA), indoleacetic acid (IAA), gibberellin acid (GA3), cytokinin (6-BA), and 1-aminocyclopropanecarboxylic acid (ACC)] for 1, 3, 6, 12, and 24 h on the basis of published RNA-sequencing (RNA-Seq) datasets. Finally, the expression patterns of groups I and V BnaHAKs under K+-deficient conditions in B. napus seedling roots are investigated. Overall, our study provides a basis for studying the roles of BnaHAKs in B. napus in the future.

2. Results

2.1. Identification of HAK Family Members in the B. napus Genome

To identify the HAK-encoding genes in the B. napus genome, we performed a preliminary BLASTP search using the Arabidopsis HAK proteins (AtKUPs) [31] as queries. After removing the redundant and severely deleted/missing sequences, and verifying the sequences using the Pfam tool, we finally obtained a total of 40 putative BnaHAKs with complete functional domains. To distinguish the candidates, these genes were labeled BnaHAK01 to BnaHAK40 according to their chromosome locations. Using the same method, we also identified 21 and 23 non-redundant HAKs in B. rapa (BrHAKs) and B. oleracea (BoHAKs), respectively (Table S1).
Physicochemical property analysis showed that the length of BnaHAK proteins (BnaHAKs) ranged from 402 to 864 amino acids. The molecular weight of the BnaHAKs ranged from 44.40 to 171.55 kDa, and the isoelectric points were concentrated at 5.22–9.44. Subcellular localization analysis showed that all 40 BnaHAKs are present in the vacuoles, and approximately half of them were also localized on the cell membrane (Table 1), which is consistent with their role in K+ uptake and homeostasis.
Overall, we identified a relatively larger number of HAKs in the B. napus genome compared with that reported for many other species [38]. This might be attributed to the fact that B. napus (AACC. n = 19) is a “young” species, which was produced by the recent hybridization between B. rapa (AA. n = 10) and B. oleracea (CC. n = 9).

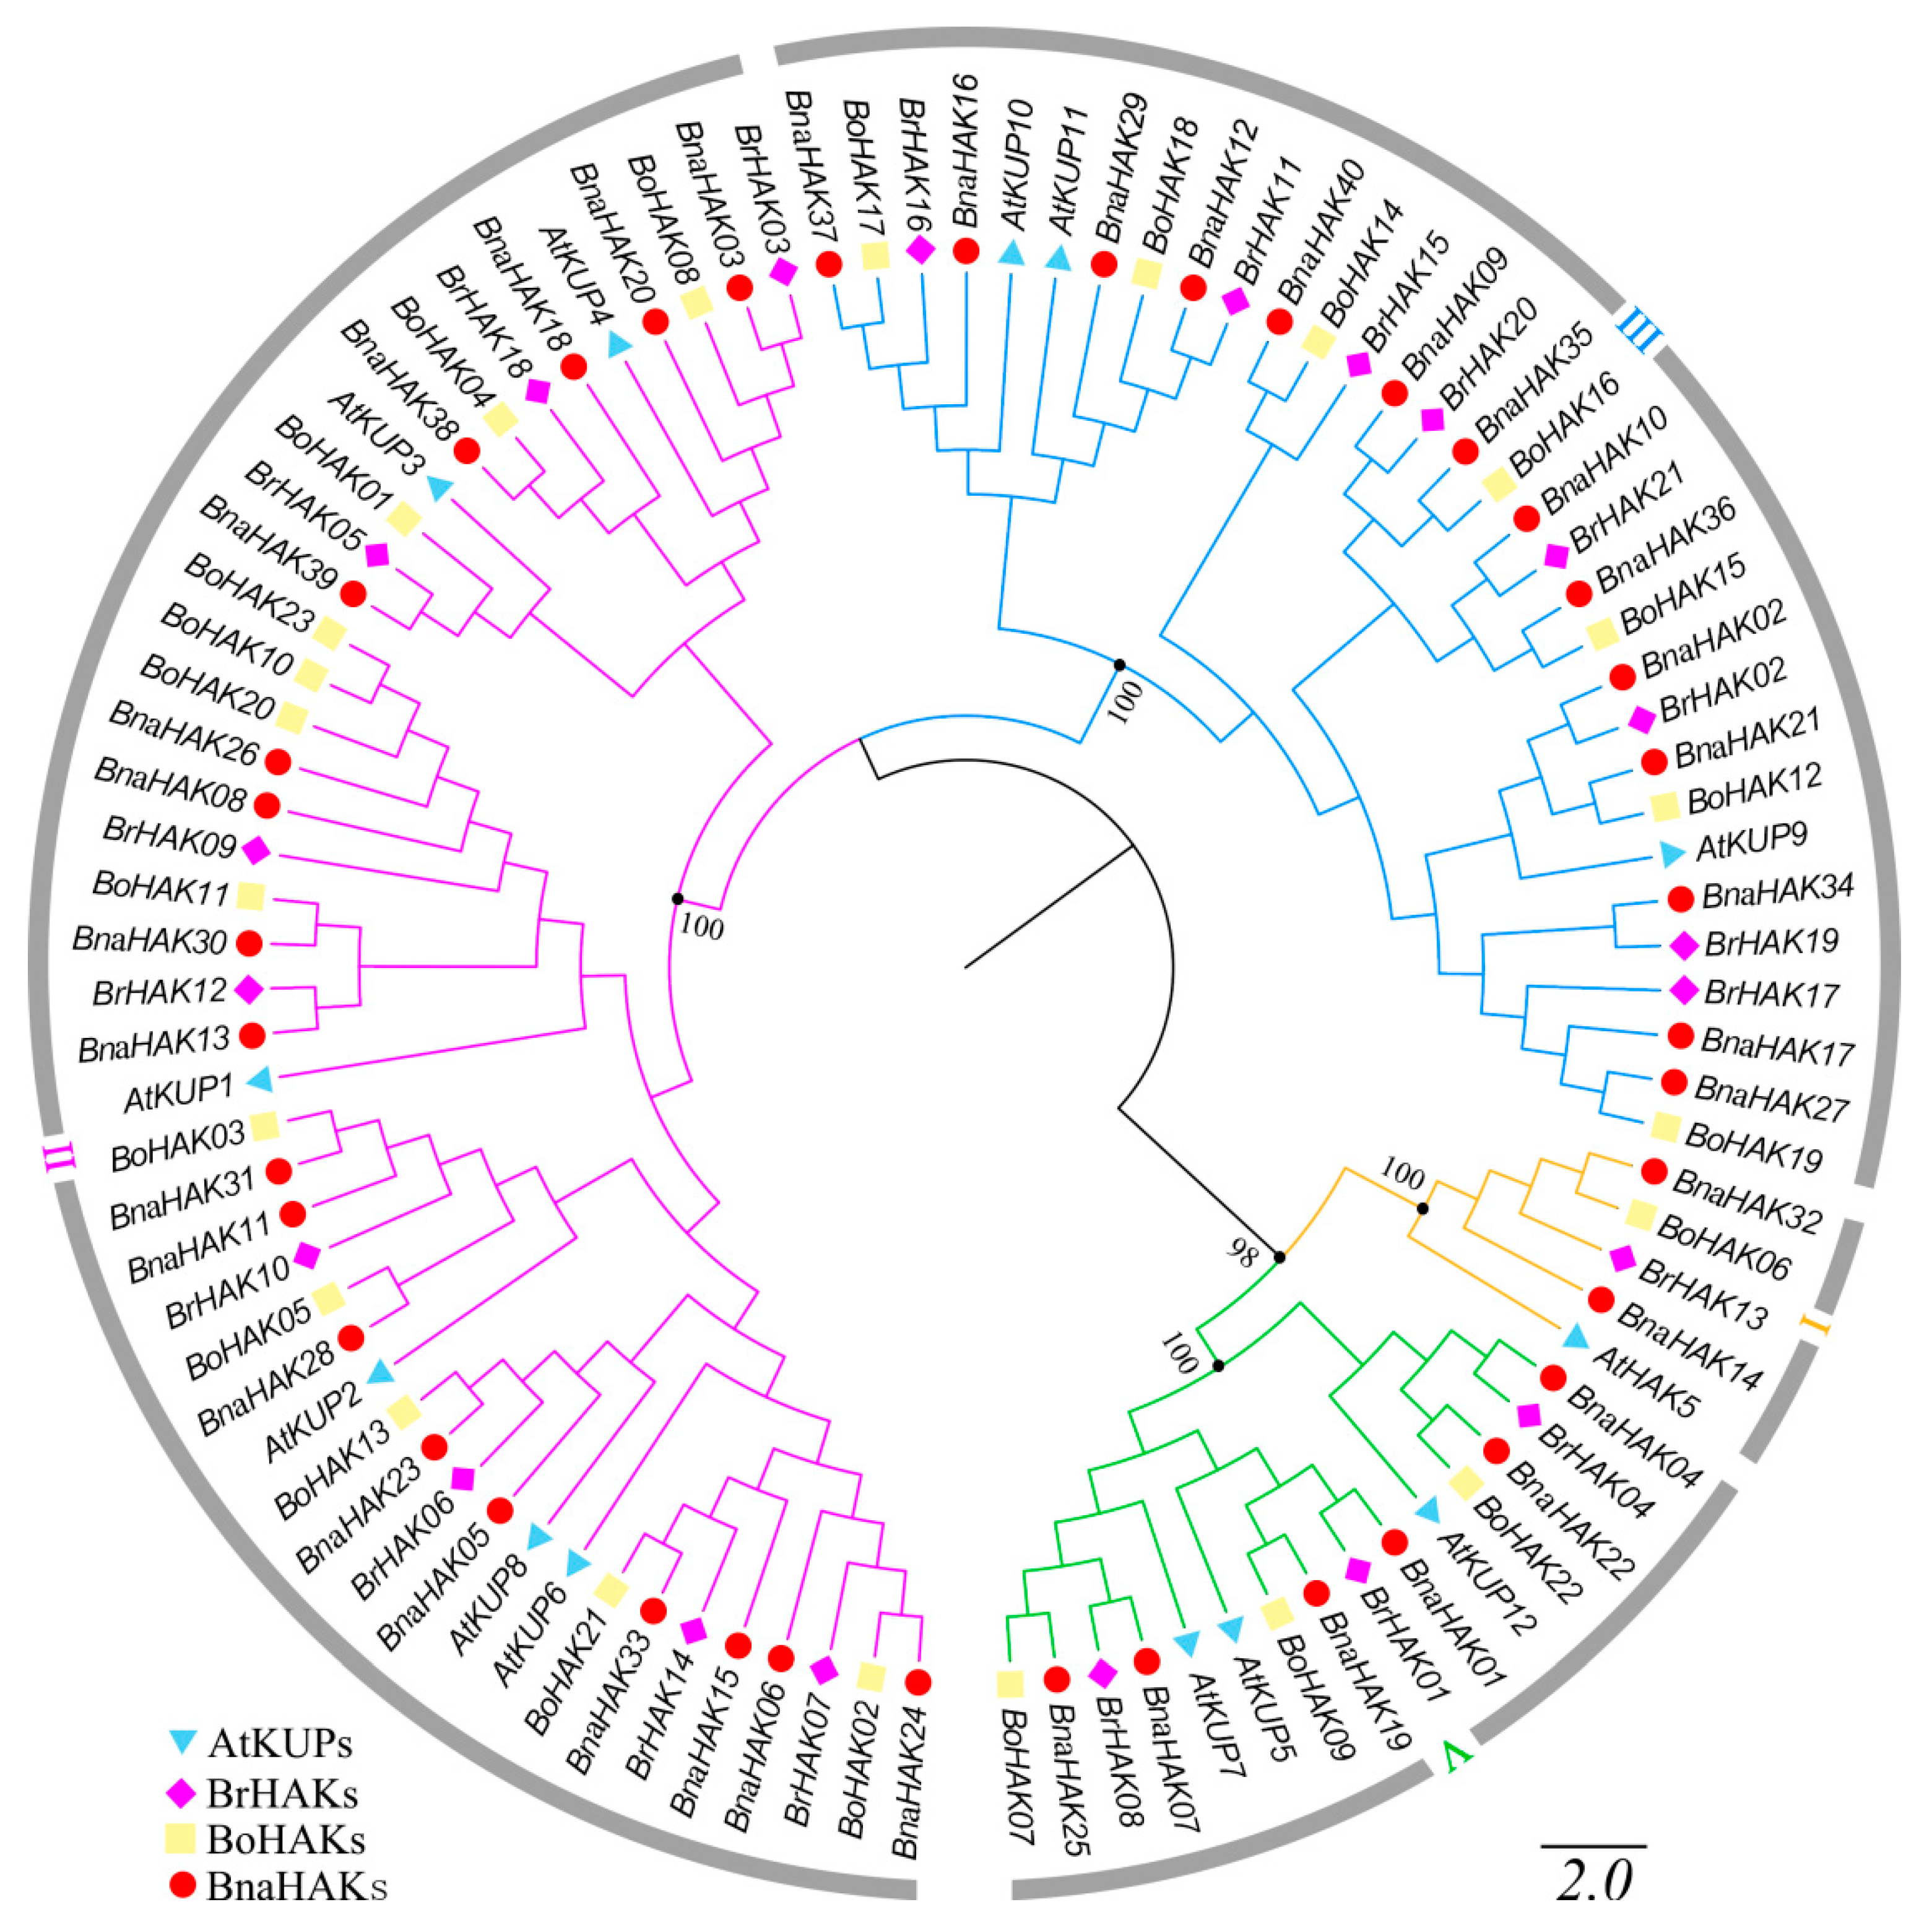
2.2. Phylogenetic Analysis of the BnaHAK Family

To explore the evolutionary relationship of the BnaHAKs, we constructed a neighbor-joining (NJ) phylogenetic tree based on multi-sequence alignment of the 97 full-length HAK protein sequences available, including from B. napus (40), B. rapa (21) (BrHAKs), B. oleracea (23) (BoHAKs), and Arabidopsis (13).
On the basis of the topology and bootstrap values of the NJ tree, HAK proteins from these four Brassicaceae species were classified into four groups: groups I–III and V (Figure 1). This confirmed that group IV was lost in the Brassicaceae lineage during evolution [38,39]. Group I consisted of two BnaHAKs (5%), one BrHAK, one BoHAK, and one AtKUP; group II was the largest, including 18 BnaHAKs (45%), nine BrHAKs, 12 BoHAKs, and six AtKUPs; group III had 14 BnaHAKs (35%), eight BrHAKs, seven BoHAKs, and three AtKUPs; and group V contained six BnaHAKs (15%), three BrHAKs, three BoHAKs, and three AtKUPs (Figure 1). In the phylogenetic tree, the number of BnaHAKs was double that of AtKUPs in groups I and V; however, it was three times that of AtKUPs in group II and was 4.5 times the number in group III. This suggested that the amplification rate in distinct groups varies, which might reflect the specific functional needs of each group during evolution.

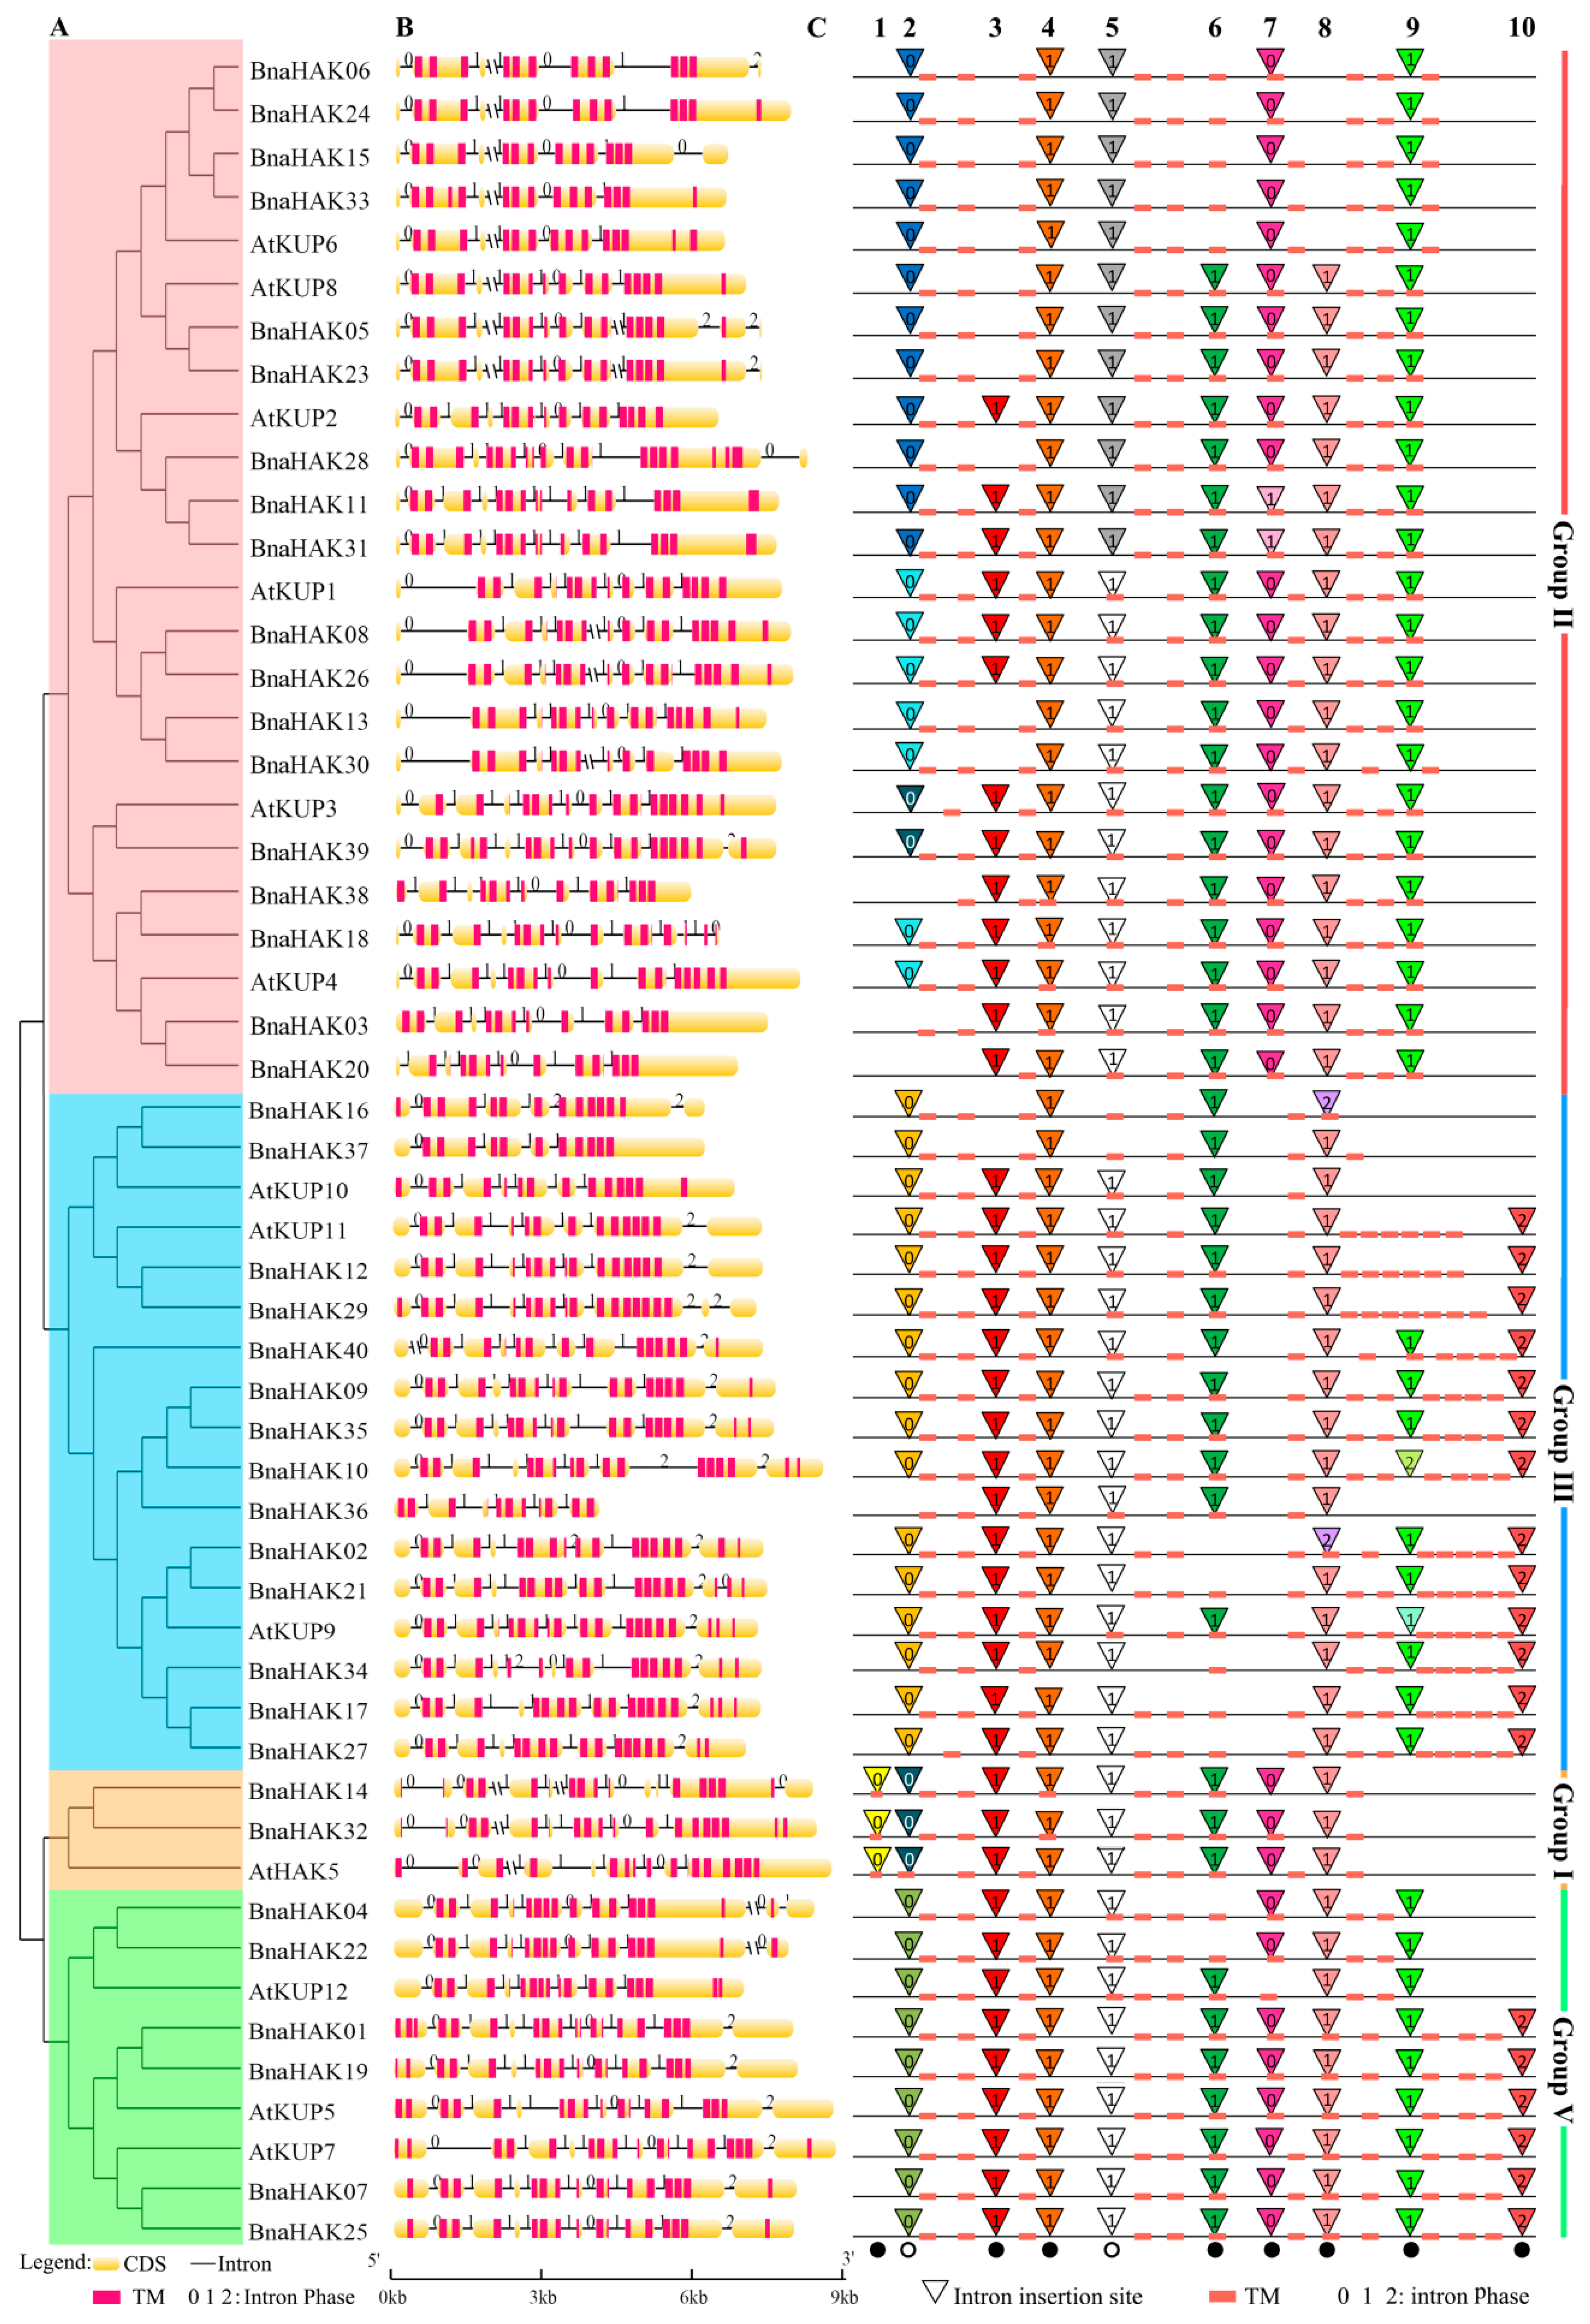
2.3. Gene Structure and Intron Pattern of BnaHAKs

Gene structural diversity provides an important clue into the function and evolutionary history of multi-gene families. Thus, we analyzed the gene structures of the identified BnaHAKs using the online software GSDS 2.0.
The intron number varied widely among the 40 BnaHAKs, ranging from 4 in BnaHAK37 to 11 in BnaHAK18 (Figure 2B). The exon-intron structures of groups I, III, and V were relatively conserved compared with those of group II, with only a few exceptions that might have been due to the low genome sequence quality. The two BnaHAKs in group I contained 10 and 8 introns, respectively; the members of group III generally possessed 7–9 introns, except for BnaHAK16, BnaHAK36, and BnaHAK37, which contained 4 or 5 introns; group V contained 8–9 introns; and 18 BnaHAKs in group II contained 5–11 introns (Figure 2B). Notably, although the intron number was variable, the intron insertion sites and phase of most introns (10 introns) were conserved across the different groups (Figure 2C). Among them, intron 4 was completely conserved in all four groups; introns 3 and 6–9 were highly conserved in the four groups; and introns 1 and 10 were only conserved in groups I, and III and V respectively (Figure 2C). The insertion site of intron 2 was slightly variable, resulting in independent conserved patterns in the four groups, with three typical types found in group II (Figure 2C). Similarly, intron 5 contained two insertion types in group II. Moreover, the intron insertion patterns of AtKUPs, BrHAKs, and BoHAKs further validated our results in BnaHAKs, indicating their conservation during evolution (Figure S1). Therefore, we speculated that these conserved intron insertion sites might exist in HAKs of plant species. In addition, these introns were commonly inserted outside of the TM domains, except for intron 6, which was highly conserved in the same TM domain across HAKs. In addition, there were some unconserved intron insertion sites identified that were generally concentrated on the C-terminal (Figure S2).
Overall, these results revealed that the intron number of BnaHAKs differs among different groups or even within a group, but that most of the intron insertion sites are highly conserved.

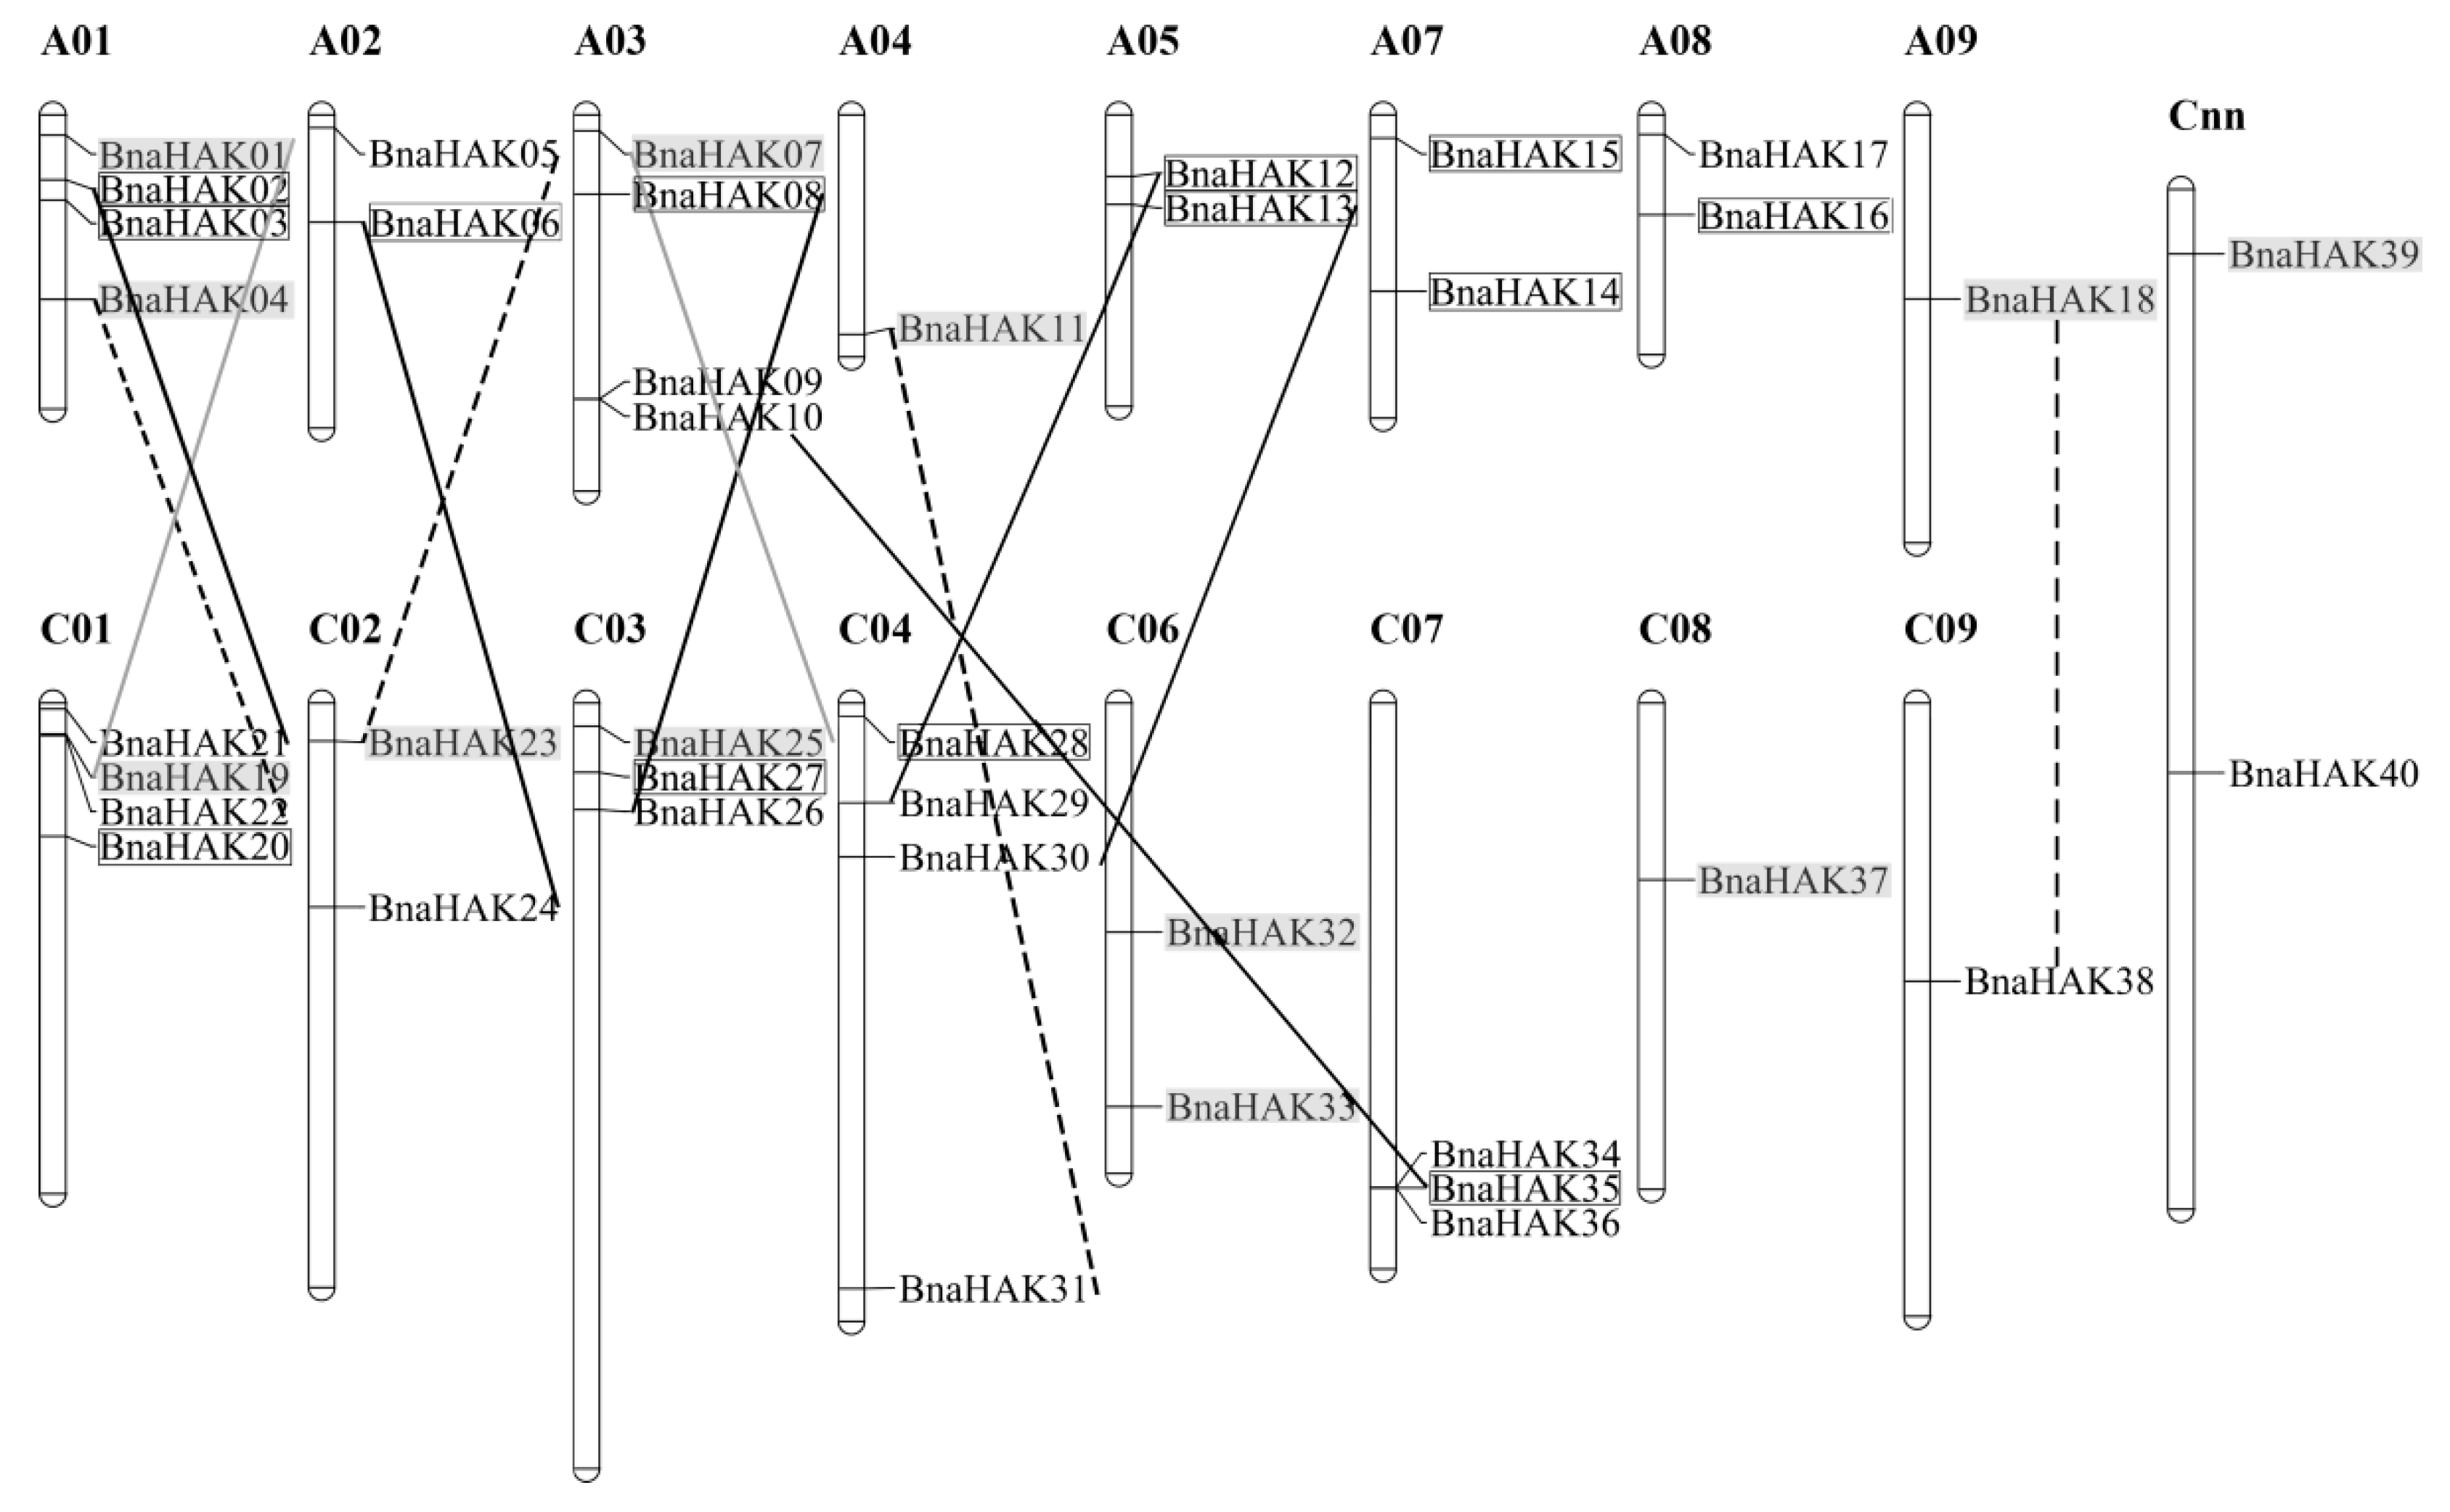
2.4. Chromosomal Distribution and Duplication of BnaHAKs

To understand the duplication relationship of the HAK gene family in B. napus, we analyzed the chromosomal location and collinearity relationship of the BnaHAKs.
Our results showed that 38 of the 40 BnaHAKs (the detailed locations of BnaHAK39 and BnaHAK40 are currently unknown) were distributed unevenly across 16 of the 19 B. napus chromosomes, except for An06, An10, and Cn05 (Figure 3). The chromosomes An01, An03, and Cn01 possessed the most BnaHAKs (4 genes), whereas chromosomes An04, An09, Cn08, and Cn09 only had one BnaHAK each. Moreover, the number of BnaHAKs between the An (18 genes) and Cn (12 genes) subgenomes also appeared to be uneven (Figure 3). Collinear relationship analysis showed that 35 of the 40 BnaHAKs had a collinear relationship with B. napus, B. rapa, and/or B. oleracea homologs (Table S2). Among these 35 BnaHAKs, 13 (37%) were derived from whole-genome duplication (WGD), with nine genes originating from B. rapa and four from B. oleracea. The remaining BnaHAKs (22) originated from small-scale duplication events in the B. napus genome, including 12 (34%), due to segmental exchange (SE) events, six (17%) from homologous exchange (HE) events, and four (12%) from segmental duplication (SD) events. No tandem duplication (TD) events were noted in the BnaHAKs. Interestingly, all members in group V were derived from small-scale duplications, displaying a special evolutionary law. Moreover, most of these small-scale duplicated genes were also dated from B. rapa, suggesting a bias demand and/or retention for the HAKs from B. rapa in B. napus. The non-synonymous (Ka) to synonymous (Ks) substitution rate ratios of the collinear gene pairs were all less than 1 (Table S3), indicating that the duplicated BnaHAKs mainly underwent purification selection during evolution.
In summary, these results demonstrated that both a WGD event and small-scale duplication events (SE, HE, and SD) were the major driving forces for the large HAK expansion in B. napus; in particular, the BnaHAKs derived from B. rapa tended to be retained in the B. napus genome.

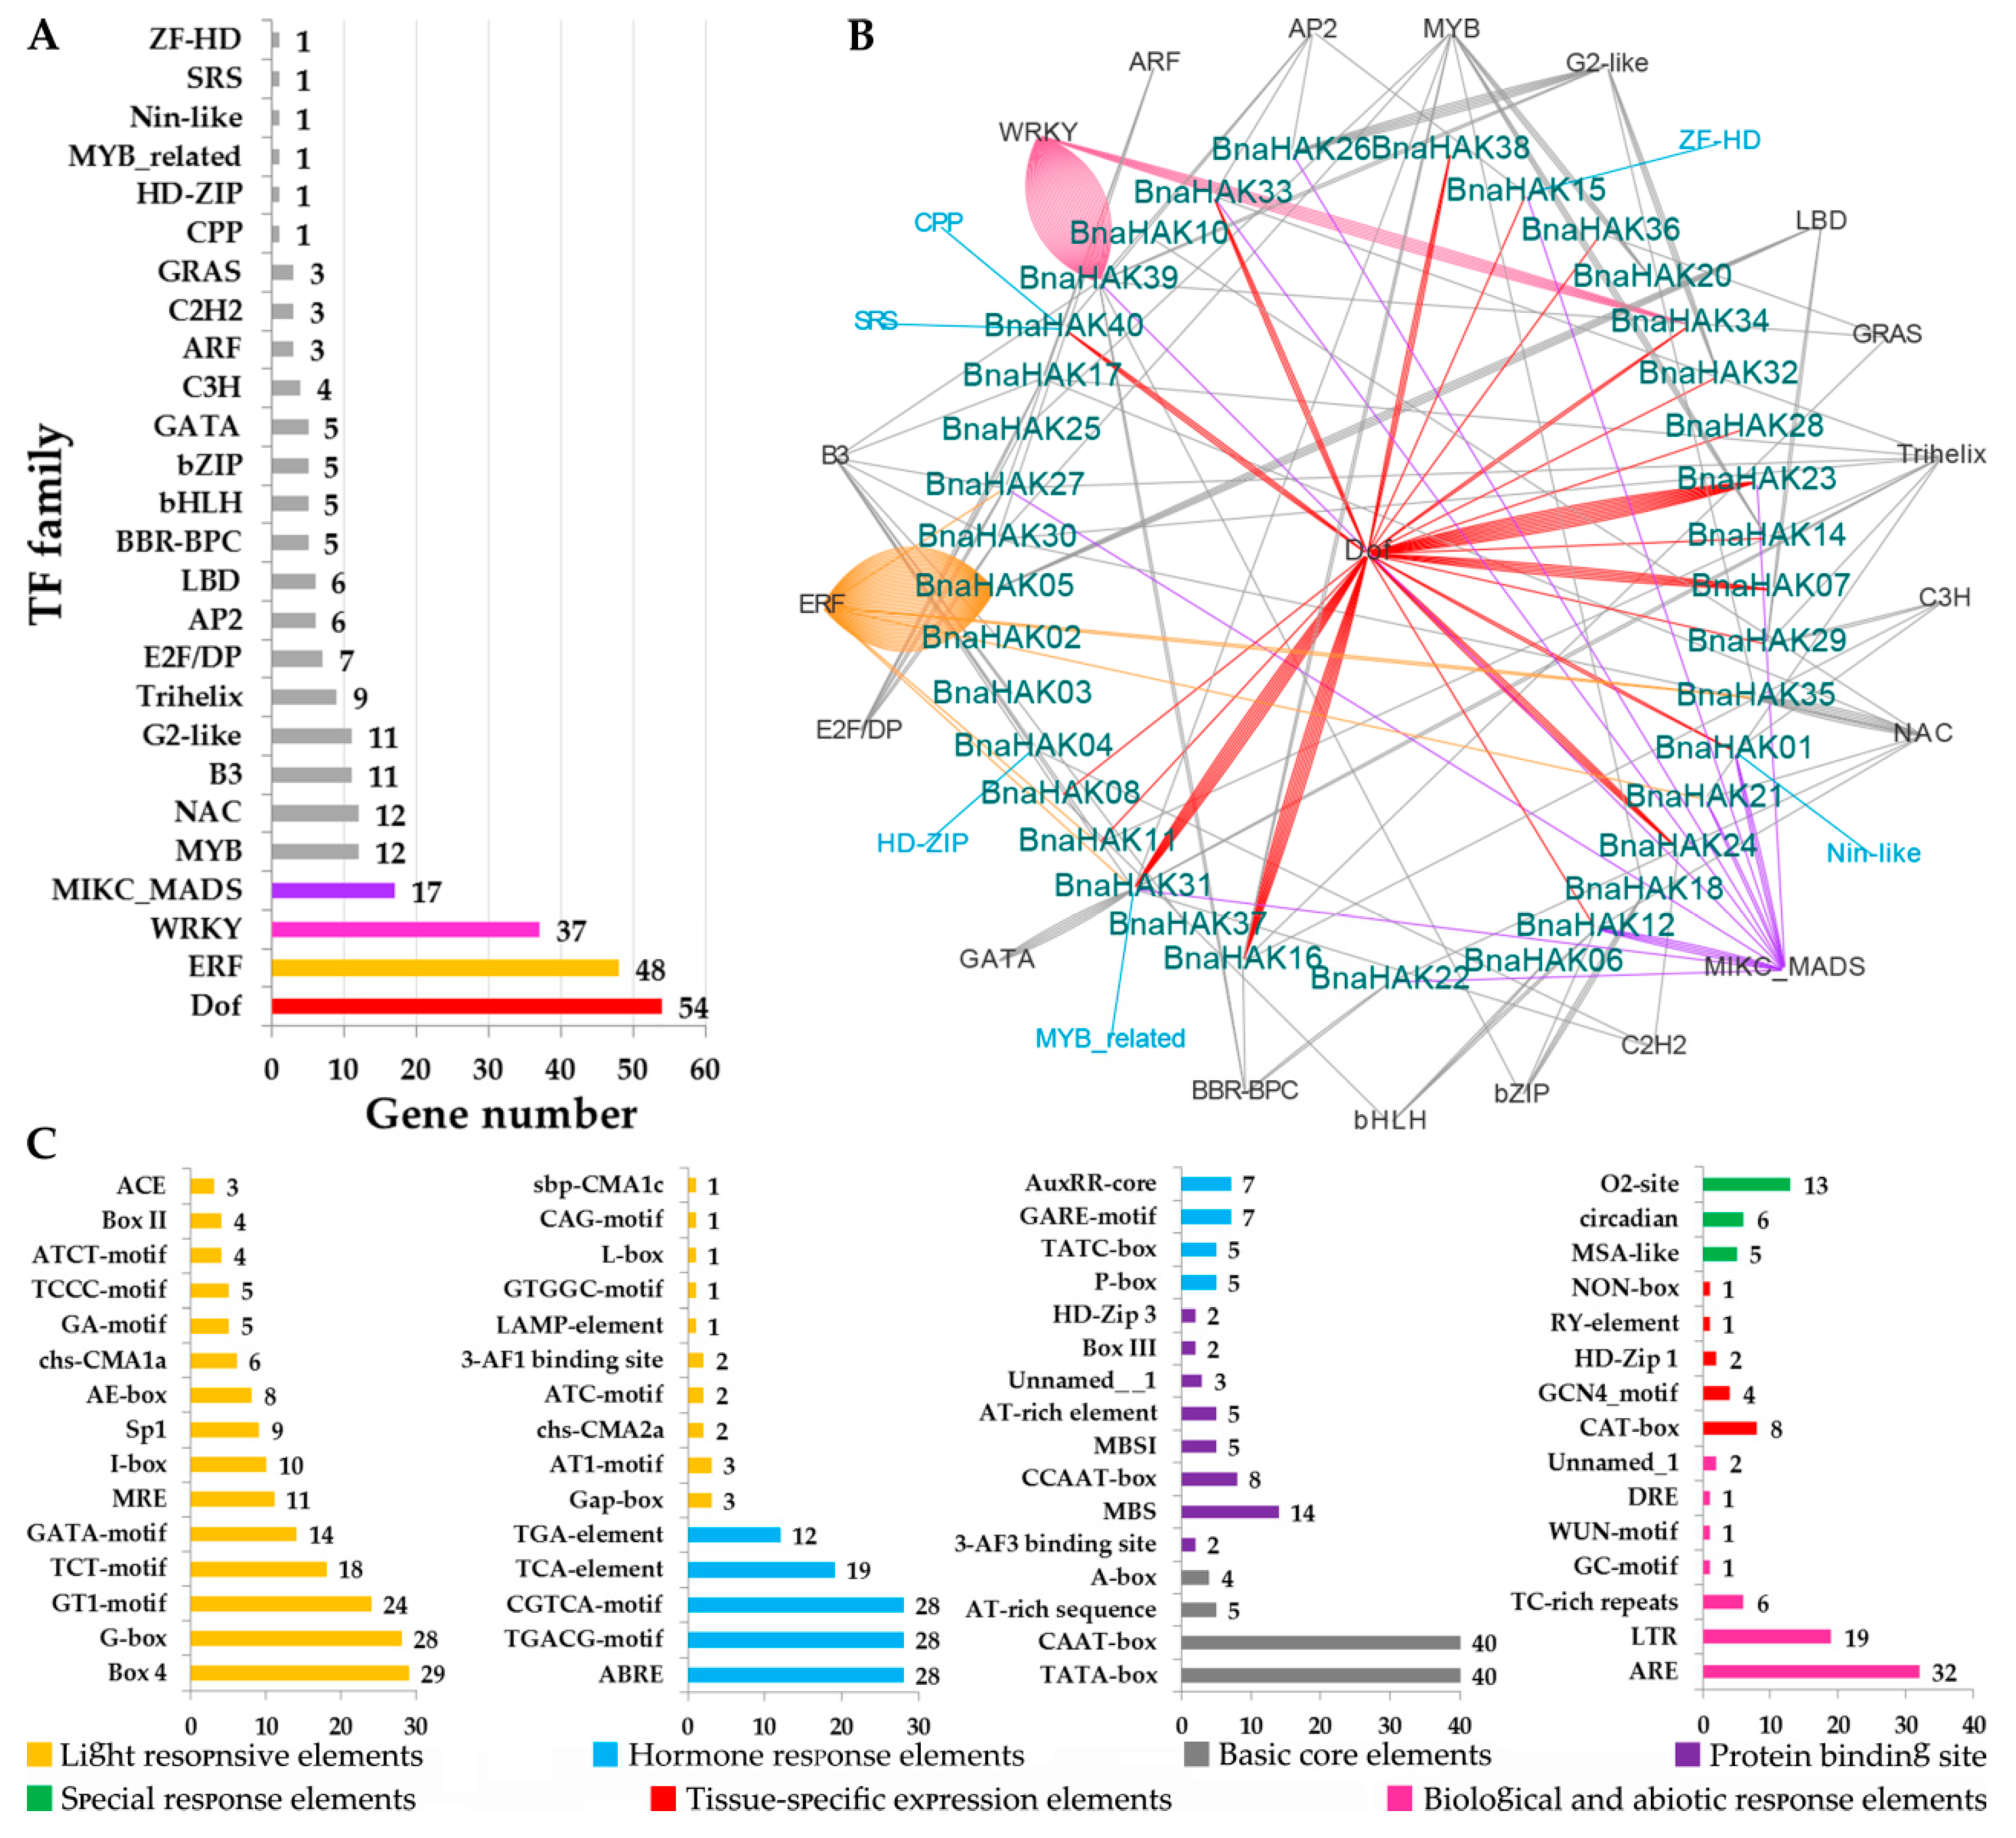
2.5. Regulation Mechanism in the Promoter Regions of BnaHAKs

We predicted the potential transcriptional regulators of the BnaHAKs in the PlantTFDB database using the promoter sequences (–1500 bp), and constructed a regulation network based on the results (Figure 4). Overall, we identified 269 potential TFs belonging to 26 TF families that might bind to the promoter regions of 37 BnaHAKs (no TF was predicted on the promoters of BnaHAK09, BnaHAK13, and BnaHAK19) (Table S4). The most abundant TFs belonged to the ERF (46 genes), Dof (45 genes), and WRKY (37 genes) families (Figure 4A). In addition, the Dof, MIKC_MADS, and B3 families regulated the most BnaHAKs, 19, 10, and 9, respectively (Figure 4B), suggesting their important roles in regulating the expression of BnaHAKs. The remaining TF families (including MYB, G2-like, and Trihelix) might be rare, and appear to regulate the expression of only a few BnaHAKs. In most cases, these TFs might bind to multiple potential BnaHAKs in different groups, with a few TFs only targeting a specific BnaHAK (Figure 4B). For instance, the ZF-HD TF might only bind to the promoter of BnaHAK15, SRS TF might only bind to BnaHAK40, and HD-ZIP TF might only bind to BnaHAK04 (Figure 4B).
To further explore the regulatory mechanism of BnaHAKs, we also analyzed the potential cis- elements in the promoter regions of BnaHAKs using PlantCARE online software. Accordingly, we identified a total of 61 types comprising 2717 cis-elements in the 40 BnaHAK promoters (Table S5). In addition to the most common basic core and light-responsive elements, we identified nine types of hormone-responsive cis-elements, including TGA-Element, ABRE, and P-Box, suggesting that the expression of BnaHAKs might be regulated by diverse hormones. Moreover, seven other types of cis-elements (e.g., LTRs, AREs, TC-rich repeats) were identified that are involved in biotic and abiotic responses such as low-temperature, anaerobic induction, defense and stress, and wound responses (Figure 4C).
These results showed that most BnaHAKs might be regulated by multiple TFs, implying a complex regulatory network for BnaHAKs in K+ uptake and transport in B. napus.

2.6. Comprehensive Analysis of miRNAs Targeting BnaHAKs

Several studies have shown that miRNAs play a significant role in targeting gene expression. Therefore, we predicted the potential miRNAs of BnaHAKs using the psRNATarget online software. The results indicated that 38 of the 40 BnaHAKs might be the targets of 145 miRNAs (no miRNA was predicted to target BnaHAK15 and BnaHAK27) (Table S6), revealing the important roles of these miRNAs in BnaHAKs expression. The candidate miRNAs belonged to 79 families. Among them, miR2673 appears to regulate the greatest number of BnaHAKs (11), with the others regulating 1–7 BnaHAKs. Moreover, in groups II, III, and V, an individual BnaHAK gene could be the target of multiple miRNAs. For example, BnaHAK05 in group II, BnaHAK16 in group III, and BnaHAK04 in group V might be the targets of eight, seven, and four miRNAs, respectively. Conversely, the two members in group I, BnaHAK14 and BnaHAK32, might be targeted only by a single miRNA, miR8001 and miR8024, respectively. In addition, the complementarity of the miRNAs and their targeted BnaHAKs in the four groups were all mainly between 70% and 85% (Table S5), indicating that the sequences of miRNAs had low rates of differentiation and mutation across distinct groups during evolution. These findings provide valuable information for further elucidating the function of miRNAs in regulating BnaHAKs expression.

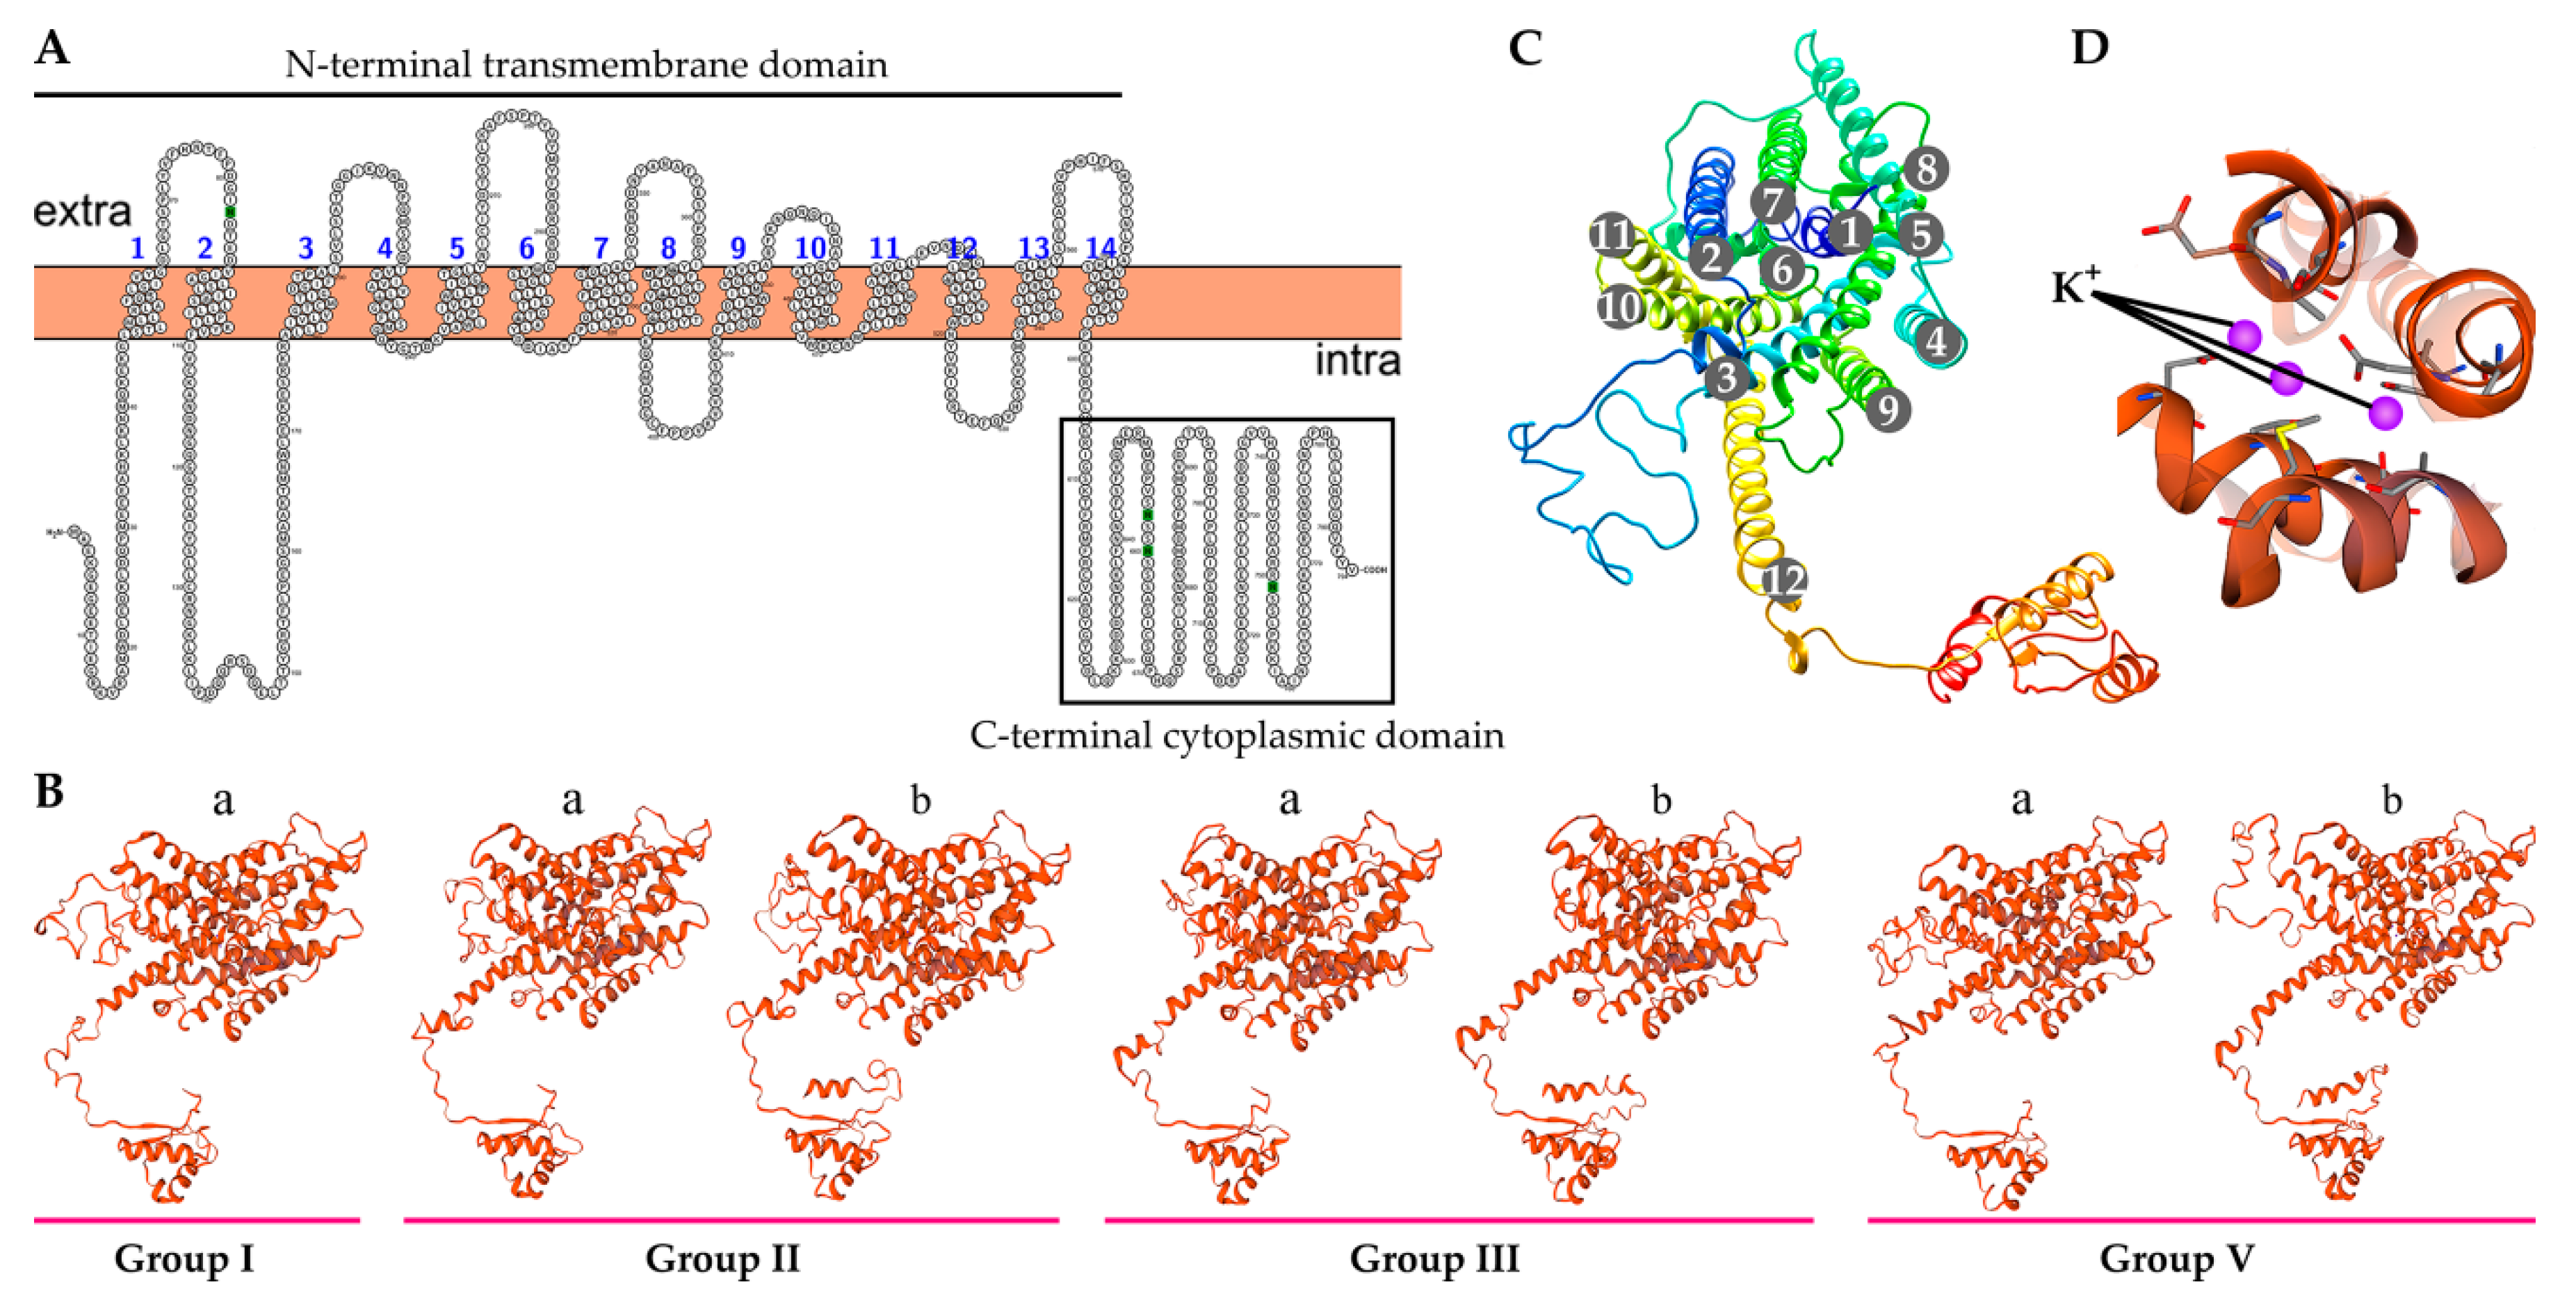
2.7. Characteristics of the Predicted BnaHAK Proteins

We next explored the dimensional structure characteristics of the BnaHAKs, using the Protter online tool and SWISSMODEL online server to predict the secondary and tertiary structures, respectively. All 40 BnaHAKs had highly conserved secondary structures, which were commonly equipped with a conserved N-terminal TM domain and a C-terminal cytoplasmic domain, with a few exceptions that might be attributed to the deletion or lack of protein sequences (Figure 5A). Coincident with the secondary structures, the tertiary structures of BnaHAKs were also highly conserved. Significantly, there were two conserved types of the C-terminal cytoplasmic domain in groups II, III, and V identified (type “a” and type “b”), whereas the members of group I had only the type “a” domain (Figure 5B), suggesting the common origin of type “a” during evolution. In most cases, each TM domain contained 12 typical TM helices with an obvious topologically inverted repeat. Consistent with a previous study [35], these helices traversed the intra- and extracellular sections of the membranes, and the final helix extended into the cytoplasm and connected to the cytoplasmic domain (Figure 5B,C). Moreover, each TM domain generally had three consecutive K+-binding sites that were highly conserved in groups I and V, but 1–3 K+-binding site(s) were lost in groups II and III due to one or more key amino acid residue substitution(s) in these regions (Figure 5D). Considering the crucial roles of the K+-binding sites for BnaHAKs in K+ absorption, we hypothesized that these substitutions might indicate functional diversity. Furthermore, introns 3, 6, and 9 of BnaHAKs were conservatively distributed in the three K+-binding sites, implying that they might affect the function of these regions.
Overall, our results suggested that the dimensional structures of the BnaHAKs are highly conserved, and substitutions in the K+-binding site(s) might reflect their structural and even functional diversity during evolution.

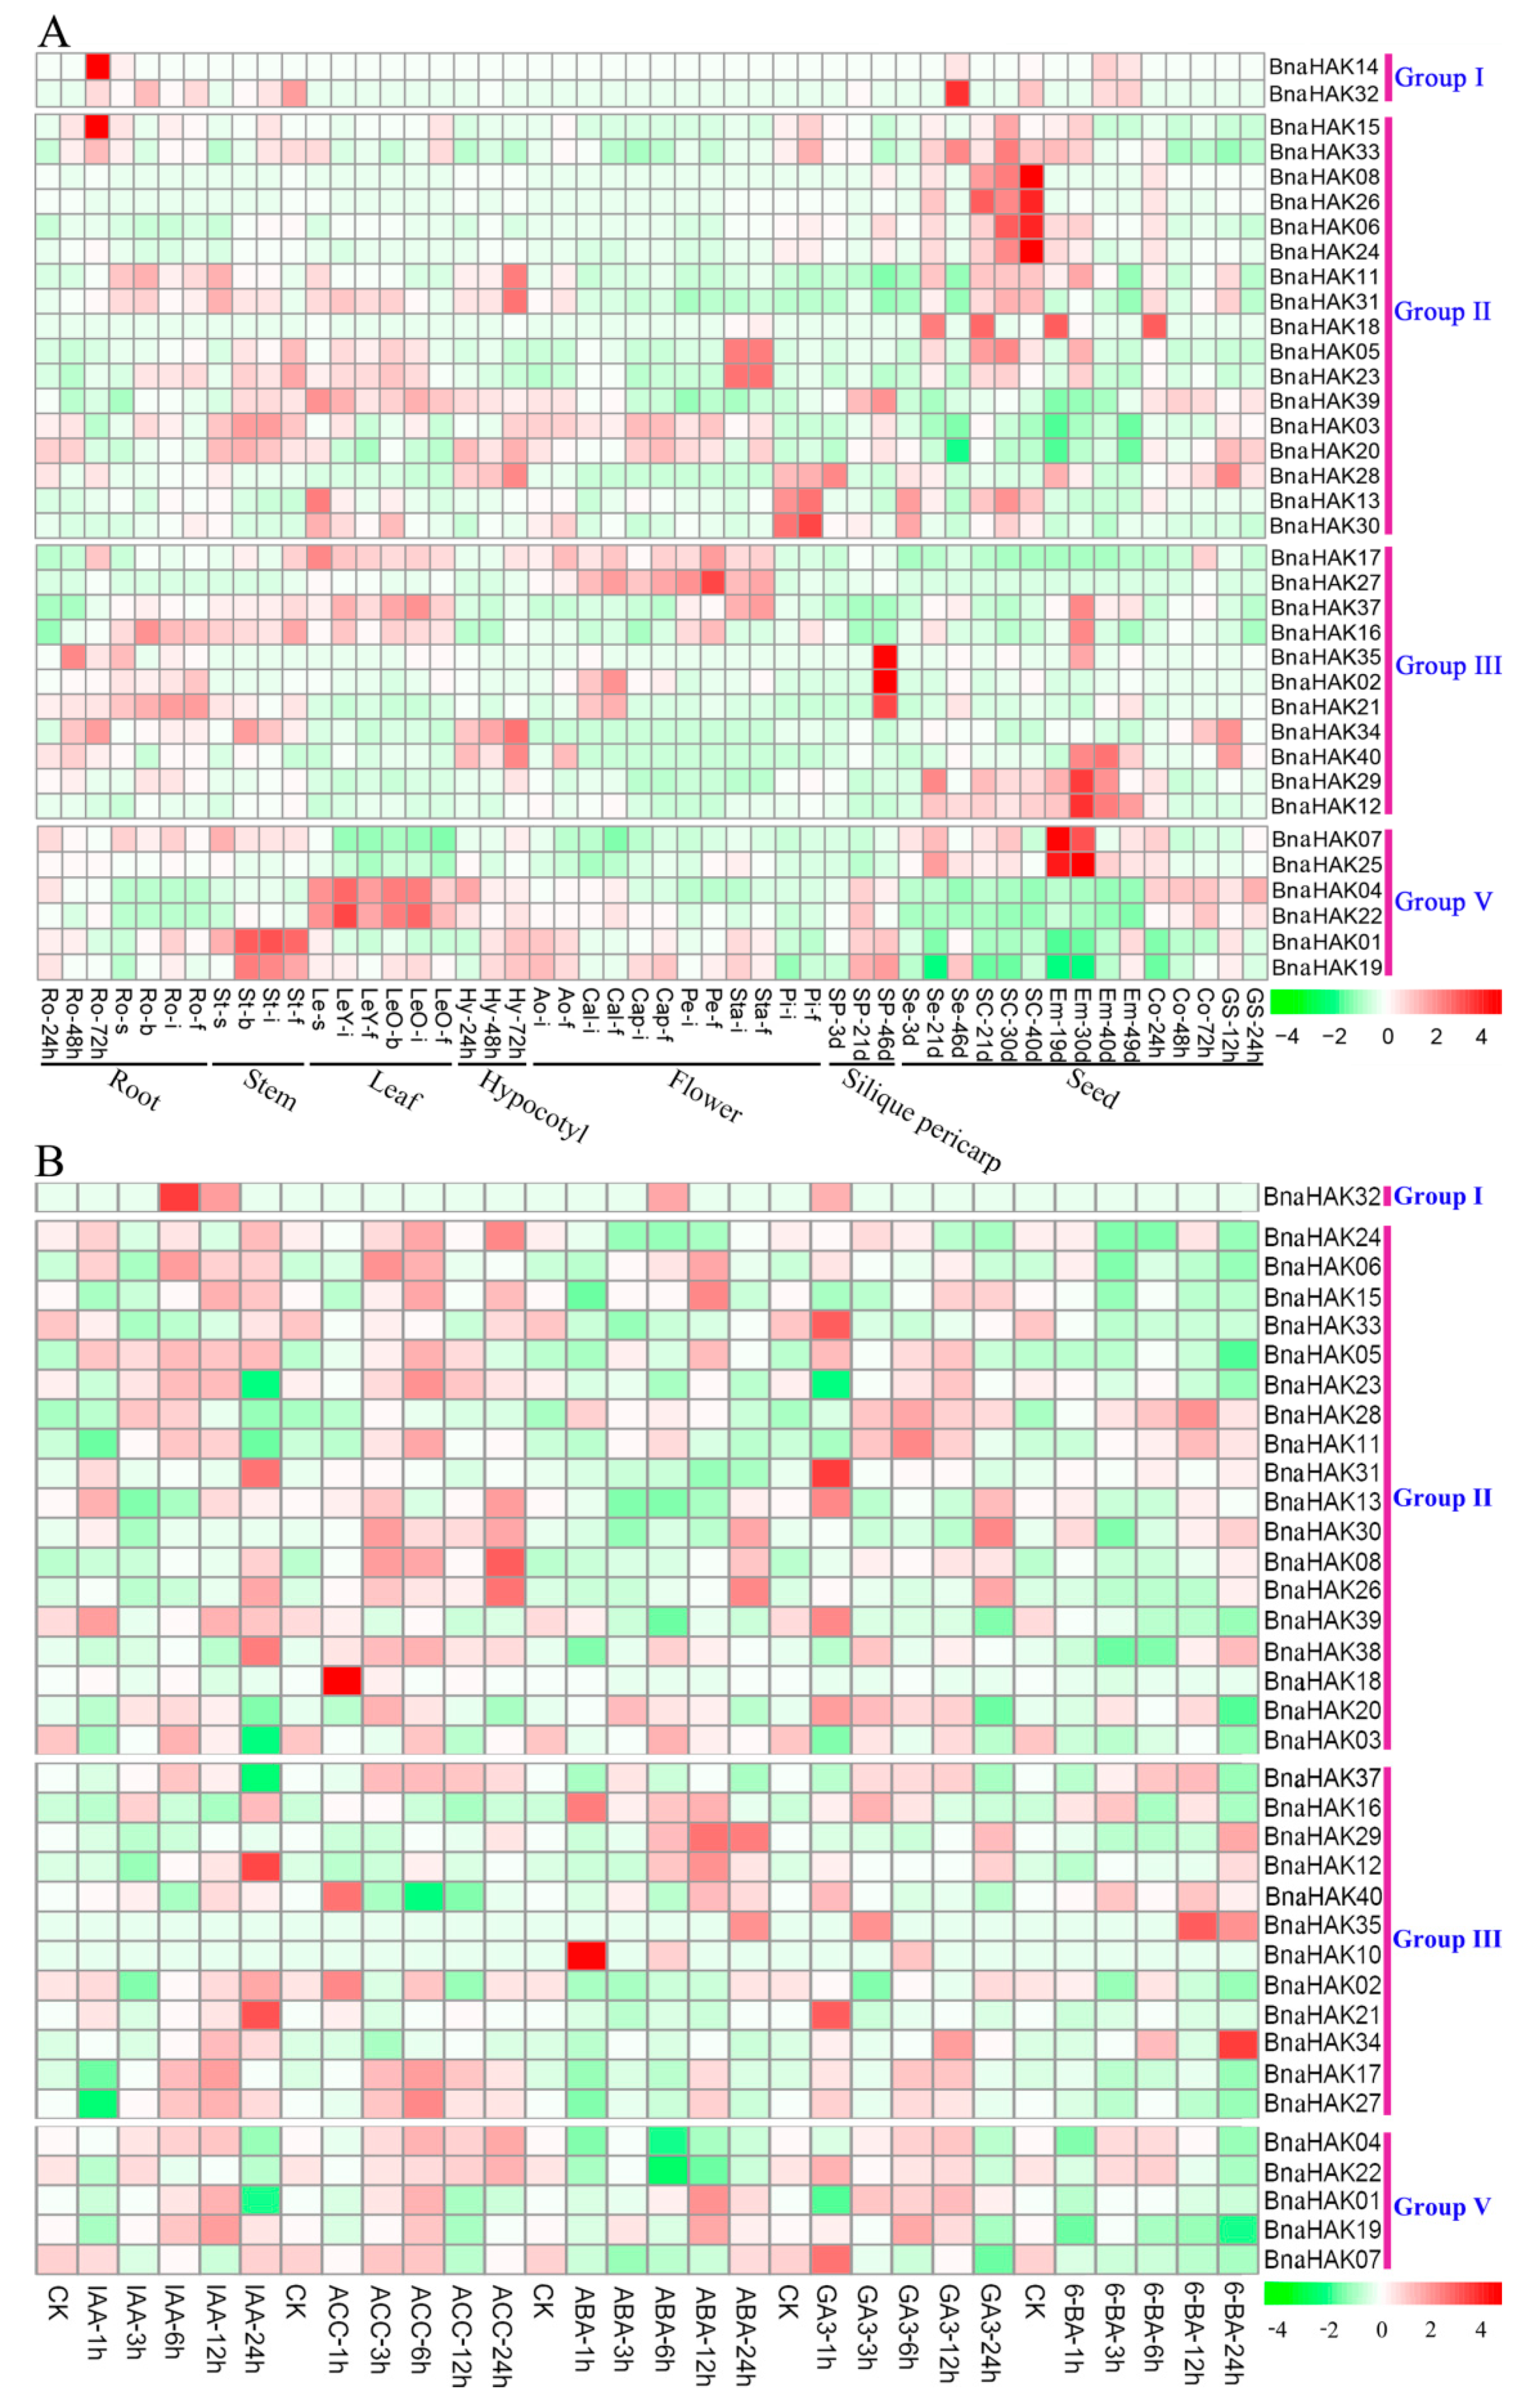
2.8. Spatiotemporal Expression Profiles of BnaHAKs across Different Developmental Stages

On the basis of published RNA-Seq data (BioProject: PRJNA358784), we examined the spatio-temporal expression of 40 BnaHAKs in 50 B. napus tissues from seven organs at five developmental stages (seeding, budding, initial flowering, full-bloom, and silique stages). We excluded four BnaHAKs from the heatmap with no detectable transcript or weak expression levels [fragments per kilobase of exon model per million reads mapped (FPKM) < 1].
All BnaHAKs showed clear spatial and temporal expression characteristics, and the expression patterns of the four groups were quite different. The expression profile of group I was relatively narrow; the two members of this group, BnaHAK14 and BnaHAK32, had detectable transcript levels in the root and/or seed tissues (Figure 6A). By contrast, most of the genes in groups II and III exhibited broad expression profiles among the 50 tissues investigated (Figure 6A), indicating their wide-reaching roles in B. napus. The expression patterns of group V were divided into three categories, which were highly expressed in the seed, leaf, and stem tissues (Figure 6A). In general, the expression patterns of the homologs in each group were generally different, such as BnaHAK14 and BnaHAK32 in group I, implying their functional divergence during evolution. However, the expression profiles of sister pair genes (i.e., homologs with collinear relationships) were generally similar, with Pearson correlation coefficients greater than 0.8 (Table S7), including BnaHAK08/BnaHAK26, BnaHAK12/BnaHAK29, and BnaHAK04/BnaHAK22 (Figure 6A), suggesting possible functional redundancy of these duplication pairs.
To explore the hormone-induced expression patterns of the 40 BnaHAKs, we examined their transcript levels in the seedling roots of the B. napus ZS11 ecotype under five exogenous hormone treatments (IAA, ACC, ABA, GA3, and 6-BA). Four BnaHAKs were excluded from the heatmap as they had no or weak expression levels (FPKM < 1). The members of group I were less sensitive to hormone treatments, as only BnaHAK32 was induced by IAA, ABA, and GA3 treatments to different degrees (Figure 6B). In contrast, the expression of the majority of members in groups II, III, and V was clearly upregulated under the five hormone treatments (Figure 6B). In groups II and V, the expression of more than half of the genes was upregulated by IAA, ACC, and GA3 treatments (Figure 6B). In group III, the expression of most of the genes was upregulated by IAA, ABA, and GA3 induction (Figure 6B). These results demonstrated that most of the BnaHAKs in these four groups were sensitive to exogenous IAA, ACC, and GA3, and a few genes could also be induced by ABA and 6-BA. In addition, the sensitivity of each group to the five hormone treatments was generally divergent.
In summary, most of the 40 BnaHAKs showed obvious temporal and spatial as well as hormone-induced expression profiles in B. napus.

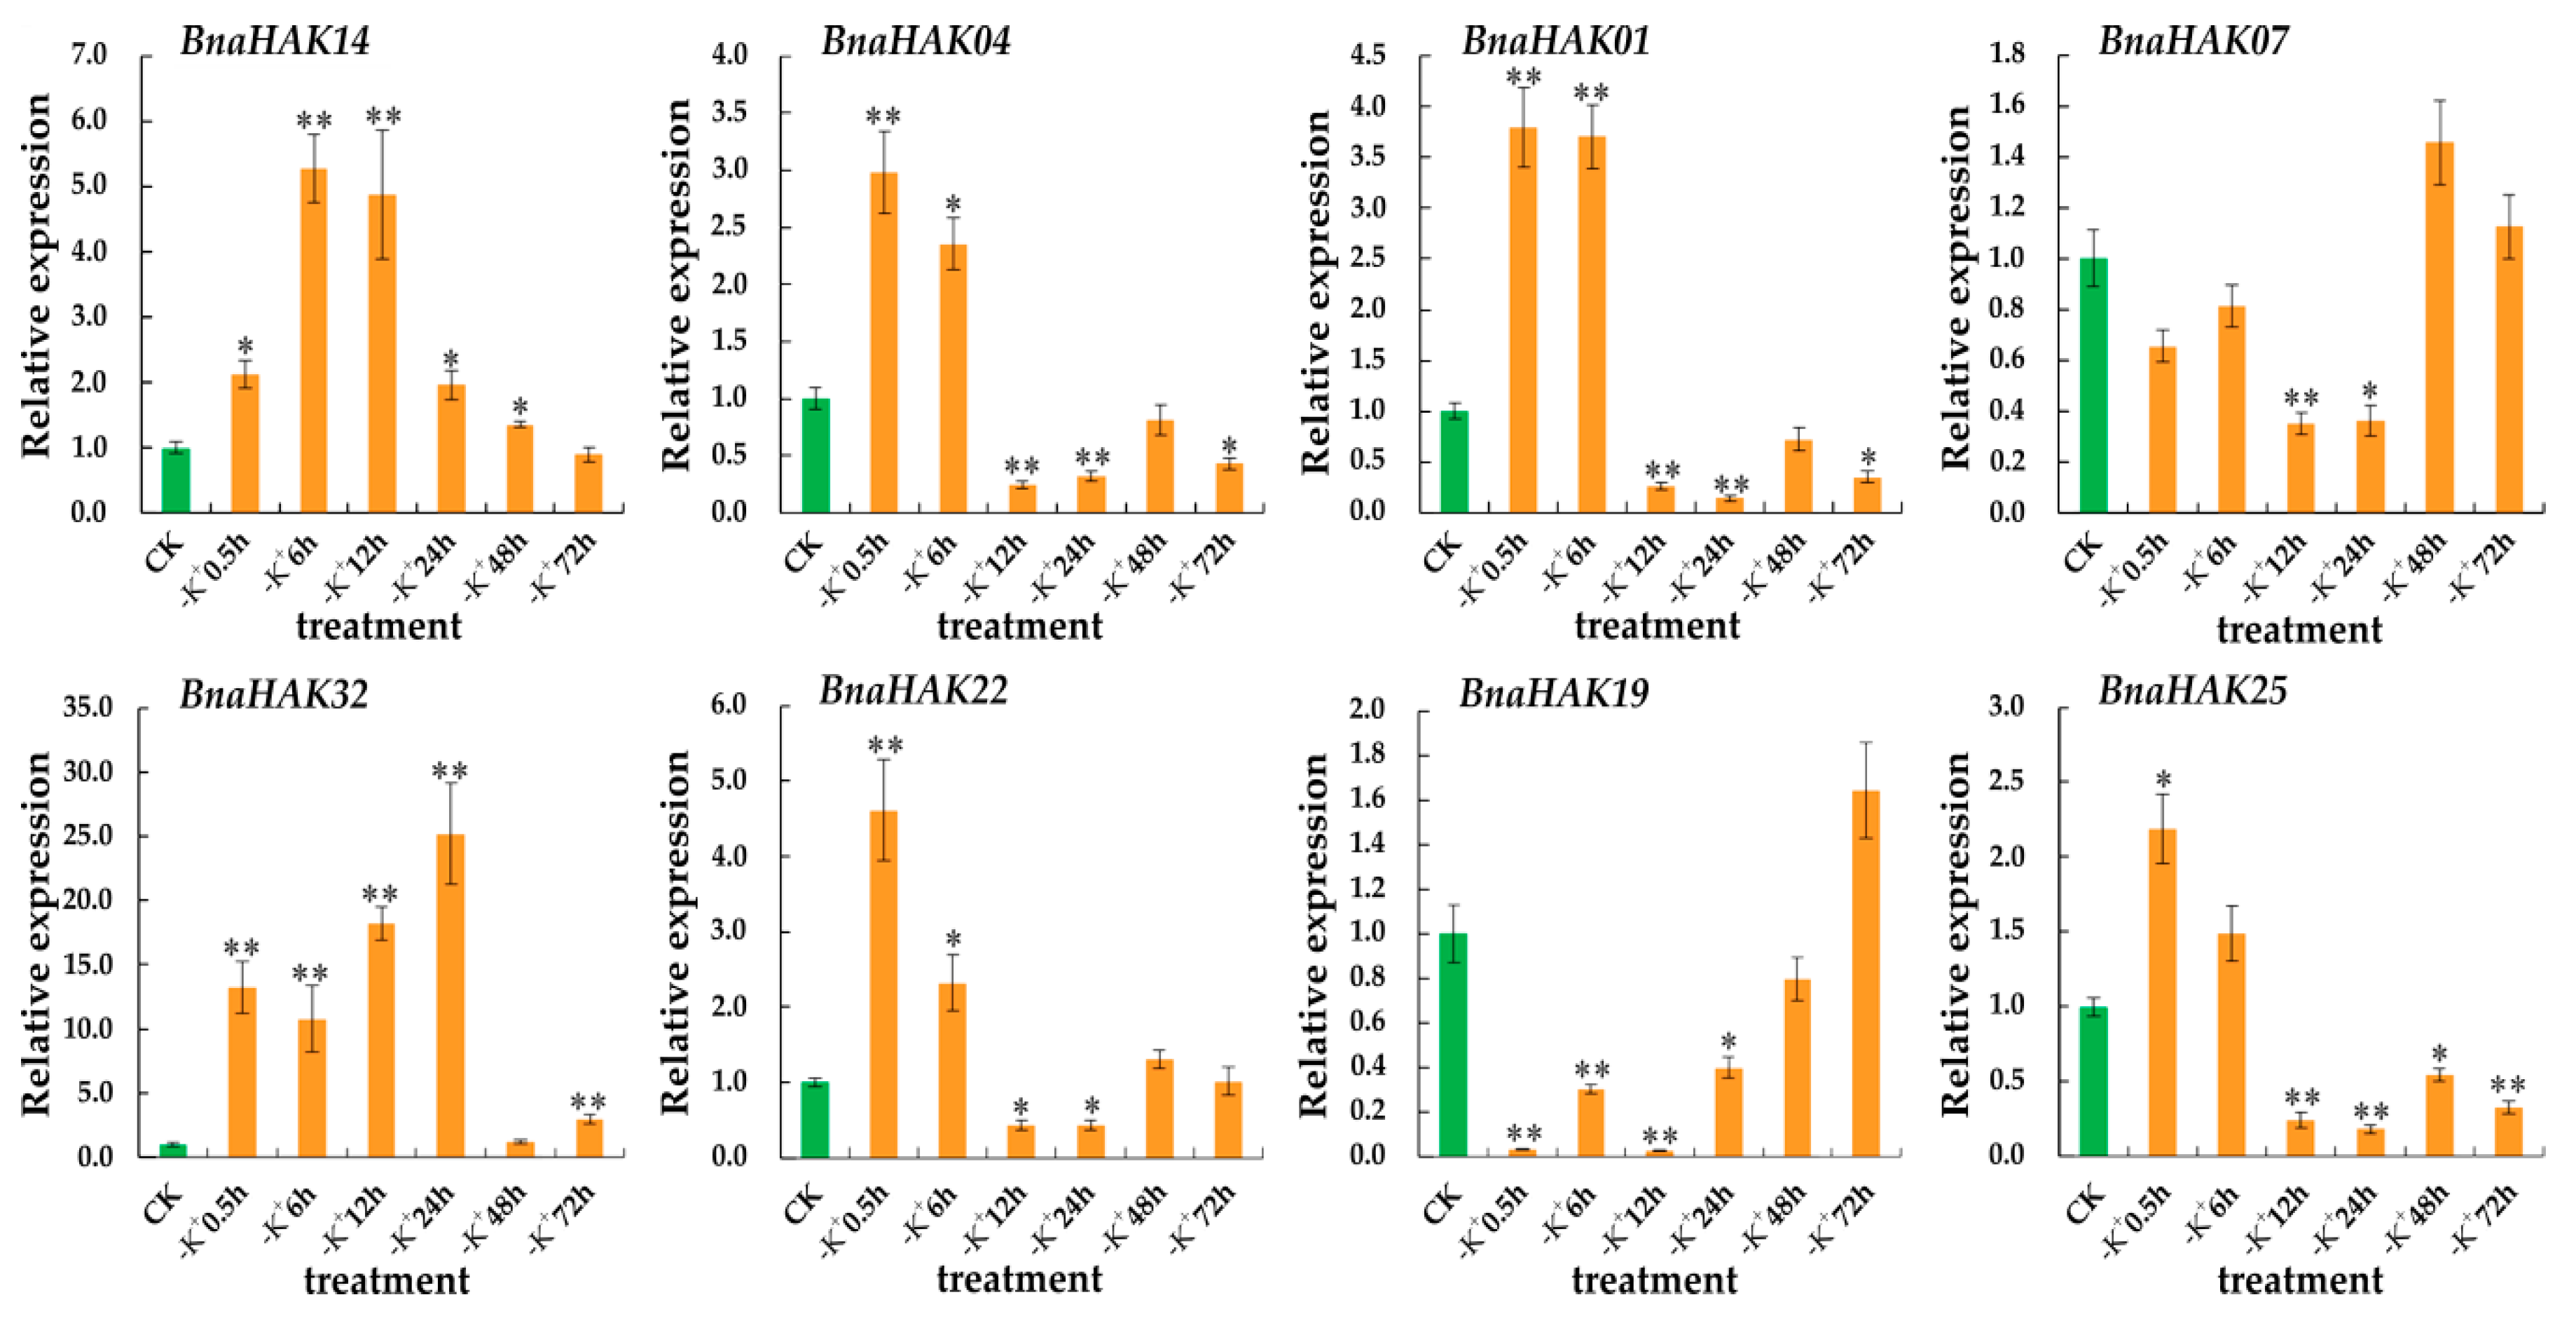
2.9. Expression Levels of BnaHAKs under Low-K+ Conditions

The expression levels of HAKs are generally regulated by the concentration of K+. Among the four groups, group I is mainly involved in high-affinity K+ uptake, whereas most of the genes in groups II and III encode low-affinity transporters. Several genes in group V have also been related to K+ uptake under low-K+ (–K+) conditions [20,31]. Thus, to gain insight into the potential roles of BnaHAKs in response to –K+ stress in B. napus seedling roots, eight BnaHAKs in group I (BnaHAK14/BnaHAK32) and V (BnaHAK07/BnaHAK25, BnaHAK04/BnaHAK22, and BnaHAK01/BnaHAK19) were selected for reverse transcription-quantitative polymerase chain reaction (RT-qPCR) assays.
As shown in Figure 7, the eight genes were all upregulated to varying degrees at different times under the –K+ condition. The expression patterns of these proteins could be divided into two main types: members of group I showed an upregulation trend at the six time points with significantly higher levels at the early stages, whereas members of group V exhibited a polarized pattern with a transient upregulation pattern under K+ starvation. This pattern indicated that group I might play an important role in K+ uptake under –K+ conditions. Notably, the expression profiles of the sister pairs of BnaHAK14/BnaHAK32 and BnaHAK04/BnaHAK22 were very similar, whereas those of BnaHAK07/BnaHAK25 and BnaHAK01/BnaHAK19 were quite different. This indicated the existence of functional differentiation of the duplicated genes during evolution in B. napus.
In summary, the expression of group I and V genes was sensitive to the –K+ environment, which provides a foundation for further exploration of their roles in K+ uptake in the roots.

3. Discussion

Given their key roles in plant K+ uptake, homeostasis, translocation, and stress resistance, the HAK family has been identified in many plant species such as Arabidopsis [31], rice [14], wheat [32], and Zea mays (maize) [40]. Previously, the plant HAK family was generally classified into four groups (I–IV), such as in rice and maize [14,40]. However, recent studies further divided HAKs into five groups, with the newly defined Group V separated from the old group III [38,39]. In this study, we first systematically identified the HAK family in an important oil crop, B. napus, and identified 40 members, which constitutes the second largest HAK family identified in plants to date [19,38]. Based on our phylogenetic, intron insertion pattern, and protein characteristic analyses, we confirmed the existence of group V, which supports this new classification of the plant HAK family.
In previous studies, SD and TD events were reported as the major contributors to the large HAK gene expansion in many plant genomes [40,41,42,43]. However, in this study, we found that not only small-scale duplication events (including SE, 34%; HE, 17%; and SD, 12%) but also genome-wide duplication (hybridization between B. rapa and B. oleracea) were the major contributors to the rapid gene expansion of the BnaHAK family. This same scenario was also recently demonstrated in the sugarcane HAK family [33]. Given that Brassicaceae species have experienced a common whole-genome triplication (WGT) event, the 13 AtKUPs should be expanded to ~40 and ~80 genes in the B. rapa/B. oleracea and B. napus genomes, respectively. However, we found that 48% (19) of the BrHAKs and 43% (17) of the BoHAKs were lost after the WGT event, while most of the duplicated BnaHAKs were retained after the WGD event (hybridization). This might be attributed to the fact that the WGD event between B. rapa and B. oleracea occurred only about ~7500 years ago [44], which might be too short for the loss of duplicates.
Since the first HAK gene was cloned from barley, many homologs have been identified and functionally analyzed in various plant species (Table S8). The HAK genes in groups I and V were proven to be mainly involved in high-affinity K+ uptake and translocation. For example, AtHAK5 (I) [16], HvHAK1 (I) [15], LeHAK5 (I) [17], and AtKUP7 (V) [19] can respond to K+ deficiency, maintaining K+ uptake and transport. Similarly, we found that the expression of BnaHAKs in groups I and V was upregulated under the –K+ condition, suggesting a similar function of these genes in K+ uptake and transport. Interestingly, according to their expression patterns, BnaHAK14 and BnaHAK32 seem to have complementary functions of K+ uptake with each other in the roots; namely, BnaHAK14 was highly expressed and absorbed K+ under control conditions, whereas the expression of BnaHAK32 was greatly upregulated to maintain K+ absorption in the –K+ environment.
Moreover, due to more extensive study of group I, other functions of group I members have also been identified. For instance, AtHAK5 [45], SIHAK5 [46], and OsHAK1 [47] in group I can mediate high-affinity Cs+ uptake because of the similarity between Cs+ and K+. Some genes can also enhance plant stress resistance; for example, OsHAK1 [24] and HvHAK1 [48] are involved in drought stress, and AtHAK5 [49] and OsHAK16 [25] play a role in the salt stress response. In contrast, most members of group II are generally engaged in low-affinity K+ absorption and complement K+ channels [22,23]; the genes in group III have been shown to participate in the maintenance of K+/Na+ homeostasis, such as AtKUP11, OsHAK11, and OsHAK12 [21]; and the genes in group IV are involved in Na+ uptake, such as PpHAK13 from Physcomitrella patens [50], PhaHAK5 from Phragmites australis [51], and ZmHAK4 from maize [26]. Remarkably, more genes in groups II, III, and IV have been reported to be associated with various plant developmental processes. For instance, AtKUP4 (II) is crucial for both gravitropic responses and root hair formation by mediating auxin efflux [30]; AtKUP2, AtKUP6, AtKUP8 [4], and CnHAK1 [23] in group II are involved in K+-dependent cell expansion and mediate K+ efflux in roots, which negatively regulate plant growth and cell size; AtKUP4 and OsHAK10 in group II play a role in seed maturation and reproductive processes, respectively [14,52]; AtKUP9 in group III can maintain root growth and meristem activity by regulating K+ and auxin homeostasis under low-K+ stress [27]; the cotton GhKT1 in group III plays a role in fiber elongation [53]; and LjKUP in group IV from Lotus japonicus is involved in nodulation development [54]. As mentioned above, group IV is absent in Brassicaceae [38]. On the basis of our findings, we suspected that this may be due to its functional redundancy with groups II and III. In summary, the five groups of the HAK family commonly play a role in plant K+ uptake and transport, as well as in the stress response, growth, and development.
This study provides a useful basis for future studies on the functions of the BnaHAKs and can contribute to the long-term goal of improving the K+ utilization efficiency of oil crops.

4. Materials and Methods

4.1. Identification and Phylogenetic Analysis of the HAK Family in B. napus

The AtKUPs were obtained from the TAIR database (http://www.arabidopsis.org). To identify the HAK-encoding genes in the B. napus genome, we performed a BLASTP [55] search in the GENOSCOPE database (http://www.genoscope.cns.fr/brassicanapus/), using the known AtKUPs as queries with a low-stringency criterion (cutoff p < 0.1). After deleting the redundant sequences, the remaining sequences were examined by the Pfam tool (http://pfam.xfam.org/search/sequence) to ensure that they contained the typical domains of the HAK family. We excluded the severely missing sequences from our dataset, and finally obtained 40 BnaHAKs. The DNA and coding sequences of the candidates were obtained from the GENOSCOPE database. Using the same method, we also identified BrHAKs and BoHAKs from the Phytozome v12.1 database (http://www.Phytozome.net) [56]. The biochemical properties of the candidates were predicted using the ExPASy tool (http://www.expasy.org/tools/) [57], and the subcellular localization was investigated using Plant-mPLoc (http://www.csbio.sjtu.edu.cn/bioinf/plant-multi/).
To explore the evolutionary relationship of the HAK family in B. napus, B. oleracea, B. rapa, and Arabidopsis, we performed multiple sequence alignment of the obtained protein sequences of BnaHAKs, BrHAKs, BoHAKs, and AtKUPs using the MAFFT version 7 tool with default parameters (https://mafft.cbrc.jp/alignment/server/). Subsequently, a phylogenetic tree was built using MEGA v5.2 with the NJ method based on the multiple sequence alignment. The parameters used in the phylogenetic analyses were as follows: Poisson correction, bootstrap with 1000 replicates, and pairwise deletion. Finally, FigTree v1.4.0 (http://tree.bio.ed.ac.uk/software/figtree/) was applied to view and edit the tree file.

4.2. Gene Structure Analysis of BnaHAKs

The gene structures of BnaHAKs and AtKUPs were analyzed using Gene Structure Display Server (GSDS) 2.0 using with the DNA and coding sequences (http://gsds.cbi.pku.edu.cn/) [58]. The TM regions of BnaHAKs and AtKUPs were predicted by SMART (http://smart.embl-heidelberg.de/). By comparing the DNA and coding sequences of each BnaHAK using MEGA v5.2, the intron insertion sites in the corresponding protein sequences were manually located, and the intron insertion information for the AtKUPs, BrHAKs, and BoHAKs was acquired from Phytozome v12.1 (https://phytozome.jgi.doe.gov/pz/portal.html).

4.3. Chromosomal Location and Collinearity Analysis of BnaHAKs

We acquired information on the chromosome locations of candidate BnaHAKs from the GENOSCOPE database. Mapchart v2.2 software was applied to draw the chromosome map of BnaHAKs. The cross-genome collinearity relationship of BnaHAKs, BrHAKs, BoHAKs, and AtKUPs was calculated and identified using the CoGe online tool (https://genomevolution.org/coge/). The duplication events of BnaHAKs were defined based on the collinearity relationship. The nucleotide substitution rate (Ka/Ks) of BnaHAKs was calculated using KaKs_Calculator2.0 software.

4.4. TF-Binding Network, Cis-Elements, and MiRNA Target Analysis

The network between BnaHAKs and their possible transcriptional regulators was constructed using the PlantTFDB database (http://planttfdb.cbi.pku.edu.cn/prediction.php) with the promoter region (upstream 0 to −1500 bp) of BnaHAKs. Only transcriptional regulators with a threshold p-value < 10−6 were retained for further analysis. Finally, the network was viewed using Cytoscape 3.6.1 software [59]. The potential cis-elements in the upstream promoter regions (−1500 bp) of BnaHAKs were predicted using PlantCARE online software (http://bioinformatics.psb.ugent.be/webtools/plantcare/html/). The potential regulatory miRNAs of BnaHAKs were predicted using the psRNATarget website (expectation ≤ 3) (http://plantgrn.noble.org/psRNATarget/).

4.5. Structure Prediction Analysis of BnaHAK Proteins

To explore the tertiary structure features, the protein sequences of BnaHAKs were submitted to SWISS-MODEL, a protein-modeling server (https://swissmodel.expasy.org/interactive). To validate the secondary structural information, further analysis was performed by submitting the protein sequences of BnaHAKs to the Protter v1.0 online tool (http://wlab.ethz.ch/protter/) [60].

4.6. Gene Expression Analysis

We used an RNA-Seq dataset in the National Center of Biotechnology Information (NCBI) (BioProject: PRJNA358784) to detect the temporal and spatial expression patterns of BnaHAKs across all developmental stages of the B. napus cultivar ‘Zhongshuang 11′ (ZS11). Similarly, an RNA-Seq dataset of B. napus ZS11 seedling roots under five hormone inductions (IAA, GA3, 6-BA, ABA, and ACC) was obtained from NCBI (BioProject ID PRJNA608211) to explore the hormone-responsive expression patterns of BnaHAKs. The R package v3.5.3 [61] was used to analyze and draw a heatmap based on log2-transformed data. Genes with FPKM < 1 might be pseudogenes or only expressed under specific conditions; thus, they were excluded from the heatmap. The Pearson correlation coefficient was obtained by calculating the expression levels of homologous genes in different tissues/organs.

4.7. Plant Materials and Growth Condition

Seeds of ZS11 were obtained from the College of Agriculture and Biotechnology, Southwest University. The seeds were germinated in individual plastic pots filled with vermiculite, grown in an artificial climatic chamber at 25 °C with a 16:8 h photoperiod (day:night), and watered with 1/2-strength Hoagland solution every four days. Then, seedlings at the four-leaf stage were changed from soil culture to hydroponic culture with 1/2-strength Hoagland solution. The solutions were changed every three days. The seedlings at the five-leaf stage were used for the –K+ treatment. In this treatment, three independent repeated trials were performed, each with three plants harvested at each sampling. The normal nutrient solution comprised 1.25 mM KNO3, 1.5 mM Ca(NO3)2, 0.75 mM MgSO4, 0.5 mM KH2PO4, 75 µM FeEDTA, 50 µM H3BO3, 10 µM MnCl2, 2 µM ZnSO4, 1.5 µM CuSO4, and 0.075 µM (NH4)6Mo7O24 (control, CK), whereas for the –K+ treatment, 1.25 mM KNO3 and 0.5 mM KH2PO4 were replaced by 0.5 mM phosphoric acid [31]. The pH was adjusted to 5.8 with Tris. The root tissues were harvested at 0.5, 6, 12, 24, 48, and 72 h after the treatments, immediately frozen in liquid nitrogen, and then stored at −80 °C for RNA isolation.

4.8. RT-qPCR Analysis of BnaHAKs under Low-K+ Conditions

The EASYspin total RNA Extraction kit (Biomed, Beijing, China) was used to extract the total RNA from each sample. The concentration and quality of the total RNA were tested using gel electrophoresis and a NanoDrop 2000 spectrophotometer to confirm that the A260/280 ratio remained at 1.8–2.1, and that the A260/230 ratio exceeded 2.0. The RNA sample was treated with DNase I (Promega, Beijing, China), and was then used for cDNA synthesis by reverse transcription in a 20-µL reaction system according to the manufacturer’s instructions of the M-MuLV RT kit (Takara Biotechnology, Beijing, China). The primers used in this experiment were designed using Primer Premier 5 software and are listed in Table S9. BnaActin7 (GenBank accession no. AF024716) and BnaUBI (GenBank accession no. NC027770) served as double reference genes. The SYBR-Green PrimeScript RT-PCR Kit (Takara Biotechnology, Beijing, China) was used for real-time PCR analysis using the CFX Connect™ Real-Time System (Bio-Rad, Chongqing, China), and every reaction system consisted of three technical replicates. The thermocycling parameters included initial denaturation at 95 °C for 5 min, followed by 45 cycles of denaturation at 95 °C for 15 s and annealing at 60 °C for 15 s (the annealing temperature of BnaHAK32 and BnaHAK19 was 55 °C). Finally, we obtained the data (mean ± standard deviation) of all three independent repeated trials and calculated the relative expression of BnaHAKs using the 2(−∆∆Ct) method. Error bars represent standard errors from three independent repeated trials. Differences in expression levels in BnaHAKs according to K+ treatments were assessed by one-way analysis of variance (* p < 0.05; ** p < 0.01) using Excel 2010.

Supplementary Materials

The following are available online at https://www.mdpi.com/1422-0067/21/24/9487/s1.

Author Contributions

Conceptualization, H.D.; methodology, J.Z.; software, J.Y.; formal analysis, H.-J.Z.; investigation, P.-F.L.; resources, P.C. and H.-J.Z.; data curation, Y.-Z.K. and L.-L.Z.; writing—original draft preparation, J.-T.Z.; writing—review and editing, H.D.; supervision, H.D.; project administration, J.-N.L.; funding acquisition, H.D. and Y.-H.Z. All authors have read and agreed to the published version of the manuscript.

Funding

This work was supported by the National Key Research and Development Program of China (2018YFD1000900) and the Fundamental Research Funds for the Central Universities of China (SWU118109 and XDJK2020B031).

Conflicts of Interest

The authors declare no conflict of interest.

References

  1. Véry, A.A.; Sentenac, H. Molecular mechanisms and regulation of K+ transport in higher plants. Annu. Rev. Plant Biol. 2003, 54, 575–603. [Google Scholar] [CrossRef] [PubMed]
  2. Marschner, P. Marschner’s Mineral Nutrition of Higher Plants, 3rd ed.; Academic Press: London, UK, 2012; pp. 178–189. [Google Scholar]
  3. Zörb, C.; Senbayram, M.; Peiter, E. Potassium in agriculture--status and perspectives. J. Plant Physiol. 2014, 171, 656–669. [Google Scholar] [CrossRef] [PubMed]
  4. Osakabe, Y.; Arinaga, N.; Umezawa, T.; Katsura, S.; Nagamachi, K.; Tanaka, H.; Ohiraki, H.; Yamada, K.; Seo, S.U.; Abo, M.; et al. Osmotic stress responses and plant growth controlled by potassium transporters in Arabidopsis. Plant Cell 2013, 25, 609–624. [Google Scholar] [CrossRef] [PubMed] [Green Version]
  5. Lebaudy, A.; Véry, A.A.; Sentenac, H. K+ channel activity in plants: Genes, regulations and functions. FEBS Lett. 2007, 581, 2357–2366. [Google Scholar] [CrossRef]
  6. Lu, Z.; Pan, Y.; Hu, W.; Cong, R.; Ren, T.; Guo, S.; Lu, J. The photosynthetic and structural differences between leaves and siliques of Brassica napus exposed to potassium deficiency. BMC Plant Biol. 2017, 17, 240. [Google Scholar] [CrossRef] [Green Version]
  7. Hasanuzzaman, M.; Bhuyan, M.H.M.B.; Nahar, K.; Hossain, M.S.; Mahmud, J.A.; Hossen, M.S.; Masud, A.A.C.; Moumita; Fujita, M. Potassium: A Vital Regulator of Plant Responses and Tolerance to Abiotic Stresses. Agronomy 2018, 8, 31. [Google Scholar] [CrossRef] [Green Version]
  8. Maathuis, F.J. Physiological functions of mineral macronutrients. Curr. Opin. Plant Biol. 2009, 12, 250–258. [Google Scholar] [CrossRef]
  9. Rengel, Z.; Damon, P.M. Crops and genotypes differ in efficiency of potassium uptake and use. Physiol. Plant 2008, 133, 624–636. [Google Scholar] [CrossRef]
  10. Römheld, V.; Kirkby, E.A. Research on potassium in agriculture: Needs and prospects. Plant Soil. 2010, 335, 155–180. [Google Scholar] [CrossRef]
  11. Lu, Z.; Ren, T.; Pan, Y.; Li, X.; Cong, R.; Lu, J. Differences on photosynthetic limitations between leaf margins and leaf centers under potassium deficiency for Brassica napus L. Sci. Rep. 2016, 6, 21725. [Google Scholar] [CrossRef] [Green Version]
  12. Ren, T.; Lu, J.; Li, H.; Zou, J.; Xu, H.; Liu, X.; Li, X. Potassium-fertilizer management in winter oilseed-rape production in China†. J. Plant Nutr. Soil Sci. 2013, 176, 429–440. [Google Scholar] [CrossRef]
  13. Mäser, P.; Thomine, S.; Schroeder, J.I.; Ward, J.M.; Hirschi, K.; Sze, H.; Talke, I.N.; Amtmann, A.; Maathuis, F.J.; Sanders, D.; et al. Phylogenetic relationships within cation transporter families of Arabidopsis. Plant Physiol. 2001, 126, 1646–1667. [Google Scholar] [CrossRef] [PubMed] [Green Version]
  14. Gupta, M.; Qiu, X.; Wang, L.; Xie, W.; Zhang, C.; Xiong, L.; Lian, X.; Zhang, Q. KT/HAK/KUP potassium transporters gene family and their whole-life cycle expression profile in rice (Oryza sativa). Mol. Genet. Genom. 2008, 280, 437–452. [Google Scholar] [CrossRef] [PubMed]
  15. Santa-María, G.E.; Rubio, F.; Dubcovsky, J.; Rodríguez-Navarro, A. The HAK1 gene of barley is a member of a large gene family and encodes a high-affinity potassium transporter. Plant Cell 1997, 9, 2281–2289. [Google Scholar] [CrossRef] [Green Version]
  16. Gierth, M.; Mäser, P.; Schroeder, J.I. The potassium transporter AtHAK5 functions in K(+) deprivation-induced high-affinity K(+) uptake and AKT1 K(+) channel contribution to K(+) uptake kinetics in Arabidopsis roots. Plant Physiol. 2005, 137, 1105–1114. [Google Scholar] [CrossRef] [Green Version]
  17. Wang, Y.H.; Garvin, D.F.; Kochian, L.V. Rapid induction of regulatory and transporter genes in response to phosphorus, potassium, and iron deficiencies in tomato roots. Evidence for cross talk and root/rhizosphere-mediated signals. Plant Physiol. 2002, 130, 1361–1370. [Google Scholar] [CrossRef] [Green Version]
  18. Bañuelos, M.A.; Garciadeblas, B.; Cubero, B.; Rodríguez-Navarro, A. Inventory and functional characterization of the HAK potassium transporters of rice. Plant Physiol. 2002, 130, 784–795. [Google Scholar] [CrossRef] [Green Version]
  19. Han, M.; Wu, W.; Wu, W.H.; Wang, Y. Potassium Transporter KUP7 Is Involved in K(+) Acquisition and Translocation in Arabidopsis Root under K(+)-Limited Conditions. Mol. Plant 2016, 9, 437–446. [Google Scholar] [CrossRef] [Green Version]
  20. Armengaud, P.; Breitling, R.; Amtmann, A. The potassium-dependent transcriptome of Arabidopsis reveals a prominent role of jasmonic acid in nutrient signaling. Plant Physiol. 2004, 136, 2556–2576. [Google Scholar] [CrossRef] [Green Version]
  21. Okada, T.; Nakayama, H.; Shinmyo, A.; Yoshida, K. Expression of OsHAK genes encoding potassium ion transporters in rice. Plant Biotechnol. 2008, 25, 241–245. [Google Scholar] [CrossRef] [Green Version]
  22. Senn, M.E.; Rubio, F.; Bañuelos, M.A.; Rodríguez-Navarro, A. Comparative functional features of plant potassium HvHAK1 and HvHAK2 transporters. J. Biol. Chem. 2001, 276, 44563–44569. [Google Scholar] [CrossRef] [PubMed] [Green Version]
  23. Garciadeblas, B.; Benito, B.; Rodríguez-Navarro, A. Molecular cloning and functional expression in bacteria of the potassium transporters CnHAK1 and CnHAK2 of the seagrass Cymodocea nodosa. Plant Mol. Biol. 2002, 50, 623–633. [Google Scholar] [CrossRef] [PubMed]
  24. Chen, G.; Liu, C.; Gao, Z.; Zhang, Y.; Jiang, H.; Zhu, L.; Ren, D.; Yu, L.; Xu, G.; Qian, Q. OsHAK1, a High-Affinity Potassium Transporter, Positively Regulates Responses to Drought Stress in Rice. Front. Plant Sci. 2017, 8, 1885. [Google Scholar] [CrossRef] [PubMed]
  25. Feng, H.; Tang, Q.; Cai, J.; Xu, B.; Xu, G.; Yu, L. Rice OsHAK16 functions in potassium uptake and translocation in shoot, maintaining potassium homeostasis and salt tolerance. Planta 2019, 250, 549–561. [Google Scholar] [CrossRef] [PubMed]
  26. Zhang, M.; Liang, X.; Wang, L.; Cao, Y.; Song, W.; Shi, J.; Lai, J.; Jiang, C. A HAK family Na+ transporter confers natural variation of salt tolerance in maize. Nat. Plants 2019, 5, 1297–1308. [Google Scholar] [CrossRef]
  27. Zhang, M.L.; Huang, P.P.; Ji, Y.; Wang, S.; Wang, S.S.; Li, Z.; Guo, Y.; Ding, Z.; Wu, W.H.; Wang, Y. KUP9 maintains root meristem activity by regulating K+ and auxin homeostasis in response to low K. EMBO Rep. 2020, 21, e50164. [Google Scholar] [CrossRef]
  28. Davies, C.; Shin, R.; Liu, W.; Thomas, M.R.; Schachtman, D.P. Transporters expressed during grape berry (Vitis vinifera L.) development are associated with an increase in berry size and berry potassium accumulation. J. Exp. Bot. 2006, 57, 3209–3216. [Google Scholar] [CrossRef] [Green Version]
  29. Elumalai, R.P.; Nagpal, P.; Reed, J.W. A mutation in the Arabidopsis KT2/KUP2 potassium transporter gene affects shoot cell expansion. Plant Cell 2002, 14, 119–131. [Google Scholar] [CrossRef] [Green Version]
  30. Rigas, S.; Debrosses, G.; Haralampidis, K.; Vicente-Agullo, F.; Feldmann, K.A.; Grabov, A.; Dolan, L.; Hatzopoulos, P. TRH1 encodes a potassium transporter required for tip growth in Arabidopsis root hairs. Plant Cell 2001, 13, 139–151. [Google Scholar] [CrossRef] [Green Version]
  31. Ahn, S.J.; Shin, R.; Schachtman, D.P. Expression of KT/KUP genes in Arabidopsis and the role of root hairs in K+ uptake. Plant Physiol. 2004, 134, 1135–1145. [Google Scholar] [CrossRef] [Green Version]
  32. Cheng, X.; Liu, X.; Mao, W.; Zhang, X.; Chen, S.; Zhan, K.; Bi, H.; Xu, H. Genome-Wide Identification and Analysis of HAK/KUP/KT Potassium Transporters Gene Family in Wheat (Triticum aestivum L.). Int. J. Mol. Sci. 2018, 19, 3969. [Google Scholar] [CrossRef] [PubMed] [Green Version]
  33. Feng, X.; Wang, Y.; Zhang, N.; Wu, Z.; Zeng, Q.; Wu, J.; Wu, X.; Wang, L.; Zhang, J.; Qi, Y. Genome-wide systematic characterization of the HAK/KUP/KT gene family and its expression profile during plant growth and in response to low-K+ stress in Saccharum. BMC Plant Biol. 2020, 20, 20. [Google Scholar] [CrossRef] [PubMed] [Green Version]
  34. Rivetta, A.; Allen, K.E.; Slayman, C.W.; Slayman, C.L. Coordination of K+ transporters in neurospora: TRK1 is scarce and constitutive, while HAK1 is abundant and highly regulated. Eukaryot. Cell 2013, 12, 684–696. [Google Scholar] [CrossRef] [PubMed] [Green Version]
  35. Tascón, I.; Sousa, J.S.; Corey, R.A.; Mills, D.J.; Griwatz, D.; Aumüller, N.; Mikusevic, V.; Stansfeld, P.J.; Vonck, J.; Hänelt, I. Structural basis of proton-coupled potassium transport in the KUP family. Nat. Commun. 2020, 11, 626. [Google Scholar] [CrossRef]
  36. Gierth, M.; Mäser, P. Potassium transporters in plants--involvement in K+ acquisition, redistribution and homeostasis. FEBS Lett. 2007, 581, 2348–2356. [Google Scholar] [CrossRef] [Green Version]
  37. Gomez-Porras, J.L.; Riaño-Pachón, D.M.; Benito, B.; Haro, R.; Sklodowski, K.; Rodríguez-Navarro, A.; Dreyer, I. Phylogenetic analysis of k(+) transporters in bryophytes, lycophytes, and flowering plants indicates a specialization of vascular plants. Front. Plant Sci. 2012, 3, 167. [Google Scholar] [CrossRef] [Green Version]
  38. Nieves-Cordones, M.; Ródenas, R.; Chavanieu, A.; Rivero, R.M.; Martinez, V.; Gaillard, I.; Rubio, F. Uneven HAK/KUP/KT Protein Diversity among Angiosperms: Species Distribution and Perspectives. Front. Plant Sci. 2016, 7, 127. [Google Scholar] [CrossRef] [Green Version]
  39. Santa-María, G.E.; Oliferuk, S.; Moriconi, J.I. KT-HAK-KUP transporters in major terrestrial photosynthetic organisms: A twenty years tale. J. Plant Physiol. 2018, 226, 77–90. [Google Scholar] [CrossRef]
  40. Zhang, Z.; Zhang, J.; Chen, Y.; Li, R.; Wang, H.; Wei, J. Genome-wide analysis and identification of HAK potassium transporter gene family in maize (Zea mays L.). Mol. Biol. Rep. 2012, 39, 8465–8473. [Google Scholar] [CrossRef]
  41. He, C.; Cui, K.; Duan, A.; Zeng, Y.; Zhang, J. Genome-wide and molecular evolution analysis of the Poplar KT/HAK/KUP potassium transporter gene family. Ecol. Evol. 2012, 2, 1996–2004. [Google Scholar] [CrossRef]
  42. Rehman, H.M.; Nawaz, M.A.; Shah, Z.H.; Daur, I.; Khatoon, S.; Yang, S.H.; Chung, G. In-Depth Genomic and Transcriptomic Analysis of Five K+ Transporter Gene Families in Soybean Confirm Their Differential Expression for Nodulation. Front. Plant Sci. 2017, 8, 804. [Google Scholar] [CrossRef] [PubMed] [Green Version]
  43. Wang, Y.; Lü, J.; Chen, D.; Zhang, J.; Qi, K.; Cheng, R.; Zhang, H.; Zhang, S. Genome-wide identification, evolution, and expression analysis of the KT/HAK/KUP family in pear. Genome 2018, 61, 755–765. [Google Scholar] [CrossRef] [PubMed]
  44. Chalhoub, B.; Denoeud, F.; Liu, S.; Parkin, I.A.; Tang, H.; Wang, X.; Chiquet, J.; Belcram, H.; Tong, C.; Samans, B. Plant genetics. Early allopolyploid evolution in the post-Neolithic Brassica napus oilseed genome. Science 2014, 345, 950–953. [Google Scholar] [CrossRef] [PubMed] [Green Version]
  45. Qi, Z.; Hampton, C.R.; Shin, R.; Barkla, B.J.; White, P.J.; Schachtman, D.P. The high affinity K+ transporter AtHAK5 plays a physiological role in planta at very low K+ concentrations and provides a caesium uptake pathway in Arabidopsis. J. Exp. Bot. 2008, 59, 595–607. [Google Scholar] [CrossRef] [Green Version]
  46. Nieves-Cordones, M.; Mohamed, S.; Tanoi, K.; Kobayashi, N.I.; Takagi, K.; Vernet, A.; Guiderdoni, E.; Périn, C.; Sentenac, H.; Véry, A.A. Production of low-Cs+ rice plants by inactivation of the K+ transporter OsHAK1 with the CRISPR-Cas system. Plant J. 2017, 92, 43–56. [Google Scholar] [CrossRef] [Green Version]
  47. Ródenas, R.; Nieves-Cordones, M.; Rivero, R.M.; Martinez, V.; Rubio, F. Pharmacological and gene regulation properties point to the SlHAK5 K+ transporter as a system for high-affinity Cs+ uptake in tomato plants. Physiol. Plant 2018, 162, 455–466. [Google Scholar] [CrossRef] [Green Version]
  48. Feng, X.; Liu, W.; Qiu, C.W.; Zeng, F.; Wang, Y.; Zhang, G.; Chen, Z.H.; Wu, F. HvAKT2 and HvHAK1 confer drought tolerance in barley through enhanced leaf mesophyll H+ homoeostasis. Plant Biotechnol. J. 2020, 18, 1683–1696. [Google Scholar] [CrossRef] [Green Version]
  49. Nieves-Cordones, M.; Alemán, F.; Martínez, V.; Rubio, F. The Arabidopsis thaliana HAK5 K+ transporter is required for plant growth and K+ acquisition from low K+ solutions under saline conditions. Mol. Plant 2010, 3, 326–333. [Google Scholar] [CrossRef]
  50. Benito, B.; Garciadeblas, B.; Rodriguez-Navarro, A. HAK transporters from Physcomitrella patens and Yarrowia lipolytica mediate sodium uptake. Plant Cell Physiol. 2012, 53, 1117–1123. [Google Scholar] [CrossRef]
  51. Takahashi, R.; Nishio, T.; Ichizen, N.; Takano, T. High-affinity K+ transporter PhaHAK5 is expressed only in salt-sensitive reed plants and shows Na+ permeability under NaCl stress. Plant Cell Rep. 2007, 26, 1673–1679. [Google Scholar] [CrossRef]
  52. Tenorio-Berrío, R.; Pérez-Alonso, M.M.; Vicente-Carbajosa, J.; Martín-Torres, L.; Dreyer, I.; Pollmann, S. Identification of Two Auxin-Regulated Potassium Transporters Involved in Seed Maturation. Int. J. Mol. Sci. 2018, 19, 2132. [Google Scholar] [CrossRef] [PubMed] [Green Version]
  53. Ruan, Y.L.; Llewellyn, D.J.; Furbank, R.T. The control of single-celled cotton fiber elongation by developmentally reversible gating of plasmodesmata and coordinated expression of sucrose and K+ transporters and expansin. Plant Cell 2001, 13, 47–60. [Google Scholar] [CrossRef] [PubMed] [Green Version]
  54. Desbrosses, G.; Kopka, C.; Ott, T.; Udvardi, M.K. Lotus japonicus LjKUP is induced late during nodule development and encodes a potassium transporter of the plasma membrane. Mol. Plant-Microbe Interact. MPMI 2004, 17, 789–797. [Google Scholar] [CrossRef] [PubMed] [Green Version]
  55. Camacho, C.; Coulouris, G.; Avagyan, V.; Ma, N.; Papadopoulos, J.; Bealer, K.; Madden, T.L. BLAST+: Architecture and applications. BMC Bioinform. 2009, 10, 421. [Google Scholar] [CrossRef] [Green Version]
  56. Goodstein, D.M.; Shu, S.; Howson, R.; Neupane, R.; Hayes, R.D.; Fazo, J.; Mitros, T.; Dirks, W.; Hellsten, U.; Putnam, N.; et al. Phytozome: A comparative platform for green plant genomics. Nucleic Acids Res. 2012, 40, D1178–D1186. [Google Scholar] [CrossRef]
  57. Artimo, P.; Jonnalagedda, M.; Arnold, K.; Baratin, D.; Csardi, G.; De Castro, E.; Duvaud, S.; Flegel, V.; Fortier, A.; Gasteiger, E.; et al. ExPASy: SIB bioinformatics resource portal. Nucleic Acids Res. 2012, 40, W597–W603. [Google Scholar] [CrossRef]
  58. Hu, B.; Jin, J.; Guo, A.Y.; Zhang, H.; Luo, J.; Gao, G. GSDS 2.0: An upgraded gene feature visualization server. Bioinformatics 2015, 31, 1296–1297. [Google Scholar] [CrossRef] [Green Version]
  59. Shannon, P.; Markiel, A.; Ozier, O.; Baliga, N.S.; Wang, J.T.; Ramage, D.; Amin, N.; Schwikowski, B.; Ideker, T. Cytoscape: A software environment for integrated models of biomolecular interaction networks. Genome Res. 2003, 13, 2498–2504. [Google Scholar] [CrossRef]
  60. Omasits, U.; Ahrens, C.H.; Müller, S.; Wollscheid, B. Protter: Interactive protein feature visualization and integration with experimental proteomic data. Bioinformatics 2014, 30, 884–886. [Google Scholar] [CrossRef] [Green Version]
  61. Galili, T.; O’Callaghan, A.; Sidi, J.; Sievert, C. Heatmaply: An R package for creating interactive cluster heatmaps for online publishing. Bioinformatics 2018, 34, 1600–1602. [Google Scholar] [CrossRef]
Figure 1. Phylogenetic analysis of KT/HAK/KUP (HAK) family proteins in Brassica napus, Arabidopsis, Brassica rapa, and Brassica oleracea. The phylogenetic tree was generated on the basis of the alignment of 97 HAK protein sequences from the four species with 1000 bootstrap replicates. The proteins belonging to the four species are represented by different shapes and colors. The HAK proteins were divided into four groups (I–III and V), which are indicated with different colored lines.
Ijms 21 09487 g001
Figure 2. Gene structures of the candidate HAK genes (HAKs) in B. napus and Arabidopsis across different HAK family groups. (A) Phylogenetic analysis of HAKs in B. napus and Arabidopsis (AtKUPs). The color of the background indicates that the genes belong to different groups. (B) Gene structures of BnaHAKs and AtKUPs. Exons are indicated by yellow boxes, transmembrane (TM) domains are indicated by red boxes, and the spaces between the colored boxes correspond to the introns. Numbers 0, 1, and 2 represent introns in phase 0, 1, and 2, respectively. (C) Intron insertion patterns of BnaHAKs and AtKUPs. Each column represents an intron at the same or similar sites. Introns with the same phase and splice site are filled with the same color. The top number (1–10) is the order of the 10 introns. The black dots and black circles at the bottom indicate the highly and less conserved intron insertion sites, respectively.
Ijms 21 09487 g002
Figure 3. Distribution of BnaHAKs on B. napus chromosomes. The 40 BnaHAKs were mapped onto 16 chromosomes, except for BnaHAK39 and BnaHAK40 whose chromosomal locations are currently unclear. The Cnn chromosomes represent chromosomal fragments mapped to the Cn subgenome, but the detailed locations are still unclear. A black frame represents the genes that originated from a whole-genome duplication event; the grey lines and grey background represent the genes that originated from segmental exchange duplication; the black lines represent the genes that originated from homologous exchange; and the dashed lines represent the genes that originated from segmental duplication.
Ijms 21 09487 g003
Figure 4. Transcription factor (TF) binding network and cis-element analysis in the promoter regions of the 40 BnaHAKs. (A) The TF gene families with potential binding sites in the promoter regions of 40 BnaHAKs. (B) The potential TF binding network of the BnaHAKs predicted using the PlantTFDB tool. (C) The cis-elements in the promoter regions of BnaHAKs. The abscissa represents the number of BnaHAKs.
Ijms 21 09487 g004
Figure 5. Overview of the structures of HAK proteins in B. napus (BnaHAKs). (A) Representatives of the BnaHAK tertiary structure in each group. (B) Topology of the BnaHAK secondary structure. (C) The 12 helices in the N-terminal transmembrane domain of the BnaHAKs. (D) The three K+-binding sites in the BnaHAKs.
Ijms 21 09487 g005
Figure 6. Expression pattern of 40 BnaHAKs. (A) The expression pattern of the BnaHAKs in 50 tissues at five developmental stages in B. napus determined by RNA-seq. Ro = root, St = stem, Le = leaf, Hy = hypocotyl, Ao = anthocaulus, Cal = calyx, Cap = capillament, Pe = petal, Sta = stamen, Pi = pistil, Sp = silique pericarp, Se = seed, Sc = seed coat, Em = embryo, Co = cotyledon, GS = germination seeds; “h,” “d,” “s,” “b,” “i,” “f,” and “s” indicate hour, day, seeding, budding, initial flowering, full-bloom, and silique stage, respectively. (B) The expression profiles of the BnaHAKs under five hormone treatments in B. napus seedling roots determined by RNA-seq. IAA: indoleacetic acid, ACC: 1-aminocyclopropanecarboxylic acid, ABA: abscisic acid, GA3: gibberellin acid 3, 6-BA: cytokinin. “1 h,” “3 h,” “6 h,” “12 h,” and “24 h” represent the hours after treatment. The BnaHAKs with no or weak expression levels (FPKM < 1) were removed from the heatmap. The color bar at the bottom side of each figure indicates the expression levels of the candidate genes.
Ijms 21 09487 g006
Figure 7. Expression levels of eight BnaHAKs under low-K+ (–K+) treatment determined by RT-qPCR. The relative expression levels of candidates in B. napus seedling roots were measured by RT-qPCR under the –K+ condition. CK: normal K+ condition; –K+ 0.5 h to –K+ 72 h: –K+ condition for 0.5 h–72 h. The B. napus Actin7 (BnaActin7) (GenBank accession no. AF024716) and UBI (BnaUBI) (GenBank accession no. NC027770) were used as the reference genes. The orange bars represent the expression levels of BnaHAKs under low-K+ conditions, and the green bars represent the expression levels of BnaHAKs under normal K+ conditions (CK). Error bars represent the standard deviation of three independent experiments. *: Significant difference (0.05 > p > 0.01); **: Extremely significant difference (p < 0.01).
Ijms 21 09487 g007
Table 1. Features of the 40 KT/HAK/KUP genes (BnaHAKs) identified in Brassica napus.
Gene NameGenome IDChromosomeProtein Length (aa)CDS LengthDNA LengthpIMolecular WeightSubcellular Localization
BnaHAK01BnaA01g03380DchrA01856257136305.2294.66Vacuole
BnaHAK02BnaA01g10310DchrA01812243932386.7890.71Vacuole
BnaHAK03BnaA01g13320DchrA01782234937799.3787.82Cell membrane, Vacuole
BnaHAK04BnaA01g22220DchrA01834286850055.61106.49Cell membrane, Vacuole
BnaHAK05BnaA02g02340DchrA02710429989198.48161.23Vacuole
BnaHAK06BnaA02g14820DchrA02665199838318.7574.33Cell membrane, Vacuole
BnaHAK07BnaA03g02700DchrA03864259538065.3096.22Vacuole
BnaHAK08BnaA03g13690DchrA03711213655338.0378.97Cell membrane, Vacuole
BnaHAK09BnaA03g44320DchrA03808242734767.0491.09Vacuole
BnaHAK10BnaA03g44330DchrA03810243337616.2891.26Cell membrane, Vacuole
BnaHAK11BnaA04g23330DchrA04776233138476.9787.06Vacuole
BnaHAK12BnaA05g08850DchrA05787236437528.6588.09Vacuole
BnaHAK13BnaA05g12300DchrA05714214533387.5479.24Cell membrane, Vacuole
BnaHAK14BnaA07g16500DchrA07747224470468.0084.14Cell membrane, Vacuole
BnaHAK15BnaA07g38760DchrA07700210333928.8678.23Cell membrane, Vacuole
BnaHAK16BnaA08g08020DchrA08757227427248.3885.19Cell membrane, Vacuole
BnaHAK17BnaA08g30510DchrA08808242732596.6190.57Vacuole
BnaHAK18BnaA09g21950DchrA09489147628219.2555.07Cell membrane, Vacuole
BnaHAK19BnaC01g04660DchrC01850255338315.2794.31Vacuole
BnaHAK20BnaC01g15360DchrC01705211836259.3478.82Cell membrane, Vacuole
BnaHAK21BnaC01g41320DchrC01789237335847.5988.43Vacuole
BnaHAK22BnaC01g43090DchrC01832270040415.7599.91Cell membrane, Vacuole
BnaHAK23BnaC02g05800DchrC02775458110,9888.37171.55Vacuole
BnaHAK24BnaC02g19780DchrC02777233441638.6886.67Vacuole
BnaHAK25BnaC03g03790DchrC03864259537555.3096.21Vacuole
BnaHAK26BnaC03g16580DchrC03710213339848.2178.89Vacuole
BnaHAK27BnaC03g76940DchrC03804241531886.8990.16Vacuole
BnaHAK28BnaC04g01430DchrC04784382562986.23142.58Vacuole
BnaHAK29BnaC04g10260DchrC04728218739789.0381.62Cell membrane, Vacuole
BnaHAK30BnaC04g14750DchrC04712213943927.8179.02Cell membrane, Vacuole
BnaHAK31BnaC04g47240DchrC04777233438986.8387.16Vacuole
BnaHAK32BnaC06g15440DchrC06784235589817.6488.06Cell membrane, Vacuole
BnaHAK33BnaC06g31400DchrC06785235834678.4787.48Vacuole
BnaHAK34BnaC07g36080DchrC07709213032216.6179.36Cell membrane, Vacuole
BnaHAK35BnaC07g36130DchrC07798239734626.5189.55Vacuole
BnaHAK36BnaC07g36140DchrC07402120928678.9844.40Vacuole
BnaHAK37BnaC08g09300DchrC08794238535638.6589.18Vacuole
BnaHAK38BnaC09g24170DchrC09539162051349.4475.90Vacuole
BnaHAK39BnaCnng05490DchrCnn_random770231335469.1985.60Vacuole
BnaHAK40BnaCnng46720DchrCnn_random794238541568.5388.49Cell membrane, Vacuole
Abbreviations: aa, amino acids; CDS, coding sequence; pI, isoelectric point.
Publisher’s Note: MDPI stays neutral with regard to jurisdictional claims in published maps and institutional affiliations.

