Soft Nanoonions: A Dynamic Overview onto Catanionic Vesicles Temperature-Driven Transition


1
Department of Chemical and Pharmaceutical Sciences, University of Trieste, via L. Giorgieri 1, 34127 Trieste, Italy
2
School of Chemical Sciences, Dublin City University (DCU), Dublin 9, Ireland
3
Coimbra Chemistry Centre, Department of Chemistry, University of Coimbra, 3004-535 Coimbra, Portugal
4
Department of Engineering and Architecture, University of Trieste, via A. Valerio 6/A, 34127 Trieste, Italy
*
Author to whom correspondence should be addressed.
Int. J. Mol. Sci. 2020, 21(18), 6804; https://doi.org/10.3390/ijms21186804
Submission received: 13 July 2020
/
Revised: 7 September 2020
/
Accepted: 10 September 2020
/
Published: 16 September 2020
(This article belongs to the Special Issue The Self-Assembly and Design of Polyfunctional Nanosystems)
Abstract
:Catanionic vesicles are emerging interesting structures for bioapplications. They self-generate by a pairing of oppositely charged ionic surfactants that assemble into hollow structures. Specifically, the anionic-cationic surfactant pair assumes a double-tailed zwitterionic behavior. In this work, the multilamellar-to-unilamellar thermal transition of several mixed aqueous systems, with a slight excess of the anionic one, were investigated. Interestingly, it was found that the anionic counterion underwent a dissociation as a consequence of a temperature increase, leading to the mentioned thermal transition. The present work proposed the spectroscopic techniques, specifically multinuclear NMR and PGSTE (pulsed gradient stimulated echo), as a key tool to study such systems, with high accuracy and effectiveness, while requiring a small amount of the sample. The results presented herein evidence encouraging perspectives, forecasting the application of the studied vesicular nanoreservoirs, for e.g., drug delivery.
1. Introduction
Catanionic vesicles can be easily developed, thanks to the self-assembly of oppositely charged ionic amphiphiles, leading to the formation of colloidal hollow structures. Indeed, a double-tailed zwitterionic behavior is responsible for the pairing of the anionic-cationic surfactants. Therefore, the above-mentioned zwitterionic double-chained structure self-generates by the association of oppositely charged single-tailed surfactants [1,2,3]. Nowadays, these vesicular systems are of increasing interest as they are widely employed in the pharmaceutical/biotechnological field (e.g., targeted gene therapy, medicated syrups, eye drop products, etc.) [4,5,6,7]. They mimic biological membranes and their related compartmentalization properties, while noteworthily, their preparation is quite cheap and easy [1,8]. Catanionic mixed systems tend to spontaneously aggregate into multi-walled vesicular structures [8], specifically in the presence of a slight excess of the anionic counterpart [9]. Those mixtures can undergo a multi-to-unilamellar transition due to different parameters’ changes, e.g., temperature, salt/co-solutes addition, and surfactant chain length [10,11]. Thus, the mentioned transition can be triggered by a temperature increase, which enhances the anionic counterion dissociation.
In this work, spectroscopic techniques (NMR, UV-Vis), fluorescence microscopy, and polarized light microscopy were used to further understand the dynamics of the temperature effects. Particularly, a powerful NMR experimental setup was applied, namely PGSTE (pulsed gradient stimulated echo), which is able to discriminate signals for multicomponent mixtures spectra, taking advantage of a different diffusion attitude of the molecular species [12]. In addition, another useful NMR tool for biological/chemical investigation used therein was the transverse relaxation rate R2 [13]. The sodium transverse relaxation rates (23Na-R2) were studied, as Na+ corresponds to the counterion of the anionic component in excess. The 23Na isotope was characterized by a high NMR sensitivity, a spin of I = 3/2, and a natural abundance of 100%. Therefore, the quadrupolar mechanism was mainly responsible for the rule out of its relaxation, and the self-assembly properties of catanionic systems could be easily studied by the NMR dynamic parameters [14,15]. In terms of approach, the following comparison sequence sodium dodecyl sulfate/cetyltrimethylammonium bromide (SDS/CTAB) > SDS/cetylpyridinium bromide (CPB) > sodium decyl sulfate (SdS)/CPB was used, bearing in mind their molecular solubility scales and their critical micellar concentration (See Table 1 below).
Therefore, these kinds of systems and their investigation through NMR techniques propose an elegant approach to encompass the use of a very small amount of the bioactive molecules to be included, both for basic research and future scale-up. The study and optimization of these nanoreservoirs are of increasing interest for the scientific community, thanks to several advantages they can provide for different applications, such as the drug delivery sector. The preparation of the cationic vesicles is quick and simple, the raw materials required are not expensive, and the nanoreservoirs can be used either on their multilamellar or their unilamellar form due to their irreversible thermal transition. Furthermore, their soft nature allows them to include both hydrophilic and hydrophobic bioactive molecules. To the best of our knowledge, this report represents the first strategic approach of multinuclear NMR applied as a powerful tool to optimize and study soft nanoshuttles for innovative use in the future use in the bioactive molecules delivery field.
2. Results and Discussion
2.1. SDS/CTAB System
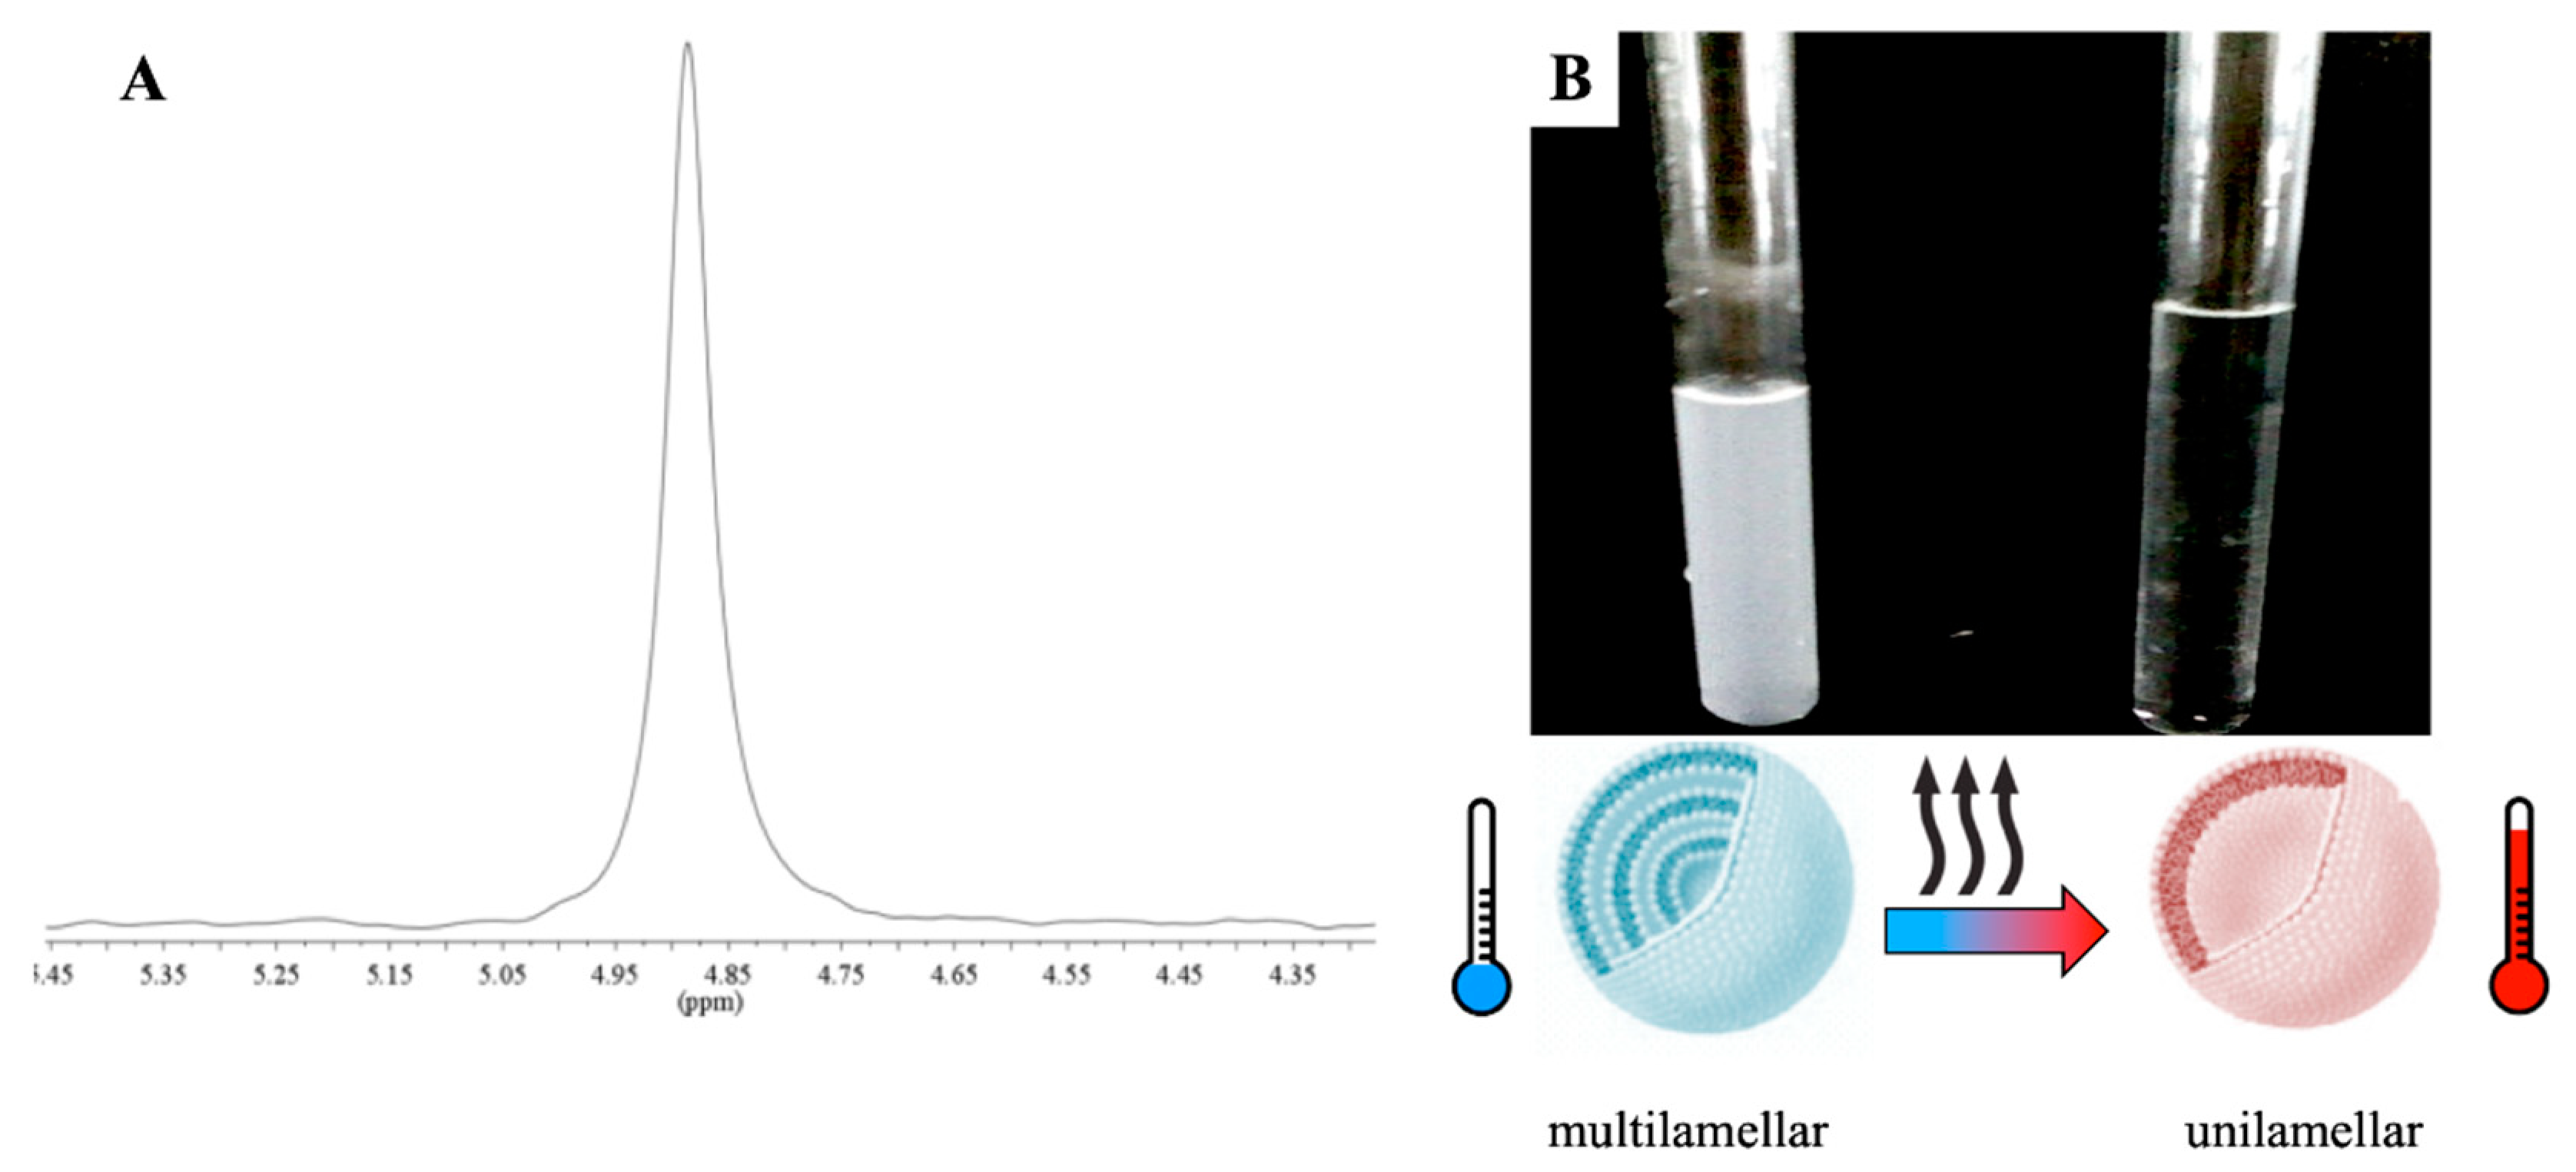
A constant CTOT = 6 mM was kept (i.e., about 0.2% wt) in aqueous solution, whereas the surfactant molar ratios (R) were changed (see Materials and Methods Section). According to the literature and to obtain a fluid-like state for the alkyl chains, a temperature slightly higher than 25 °C was set. To avoid multiple phases/micelles in vesicular samples, highly diluted solutions were used, as previously mentioned (see Materials and Methods, Section 3.1). With reference to Equation (1), catanionic vesicles effectively self-assembled at R ≠ 1 (negatively or positively). The focus of the present experimental work involved just the anionic side of the phase diagram, as both at R = 1 and in the cationic region of the ternary phase diagram led to precipitation (see Materials and Methods, Section 3.1). Moreover, vesicles solutions with R = 1 exhibit a Krafft point above 100 °C [19], which makes them not suitable for biological applications. Single-walled nanoreservoirs kept their unilamellar state for months, should a temperature close to 25.0 °C be provided. Otherwise, phase separation could occur due to the CTAB Krafft point, which lied in the 25–27 °C range, as mentioned in Materials and Methods, Section 3.1. Considering that a negative charge allows vesicles to be stable, an excess of sodium dodecyl sulfate was used, i.e., R > 1 (see Equation (1), Materials and Methods Section). Vesicular solutions appeared milky as soon as they self-stabilized due to the presence of multilamellar structures. On the other hand, straight after the thermal transition, their characteristic turbidity completely vanished (Figure 1), leading to their conversion into unilamellar aggregates, with a lower hydrodynamic radius [8]. The thermal transition was found to be irreversible within the 46–47 °C thermal range for catanionic vesicles characterized by an R = 1.7 and R = 1.85, respectively. Anisotropic lamellar phases occurrence had been ruled out, both prior and after the thermal transition, due to a lack of the water signal splitting in the 2H-NMR spectrum (see below Figure 1). The mentioned finding was also confirmed by the complete absence of birefringence in the polarized light microscopy observations.
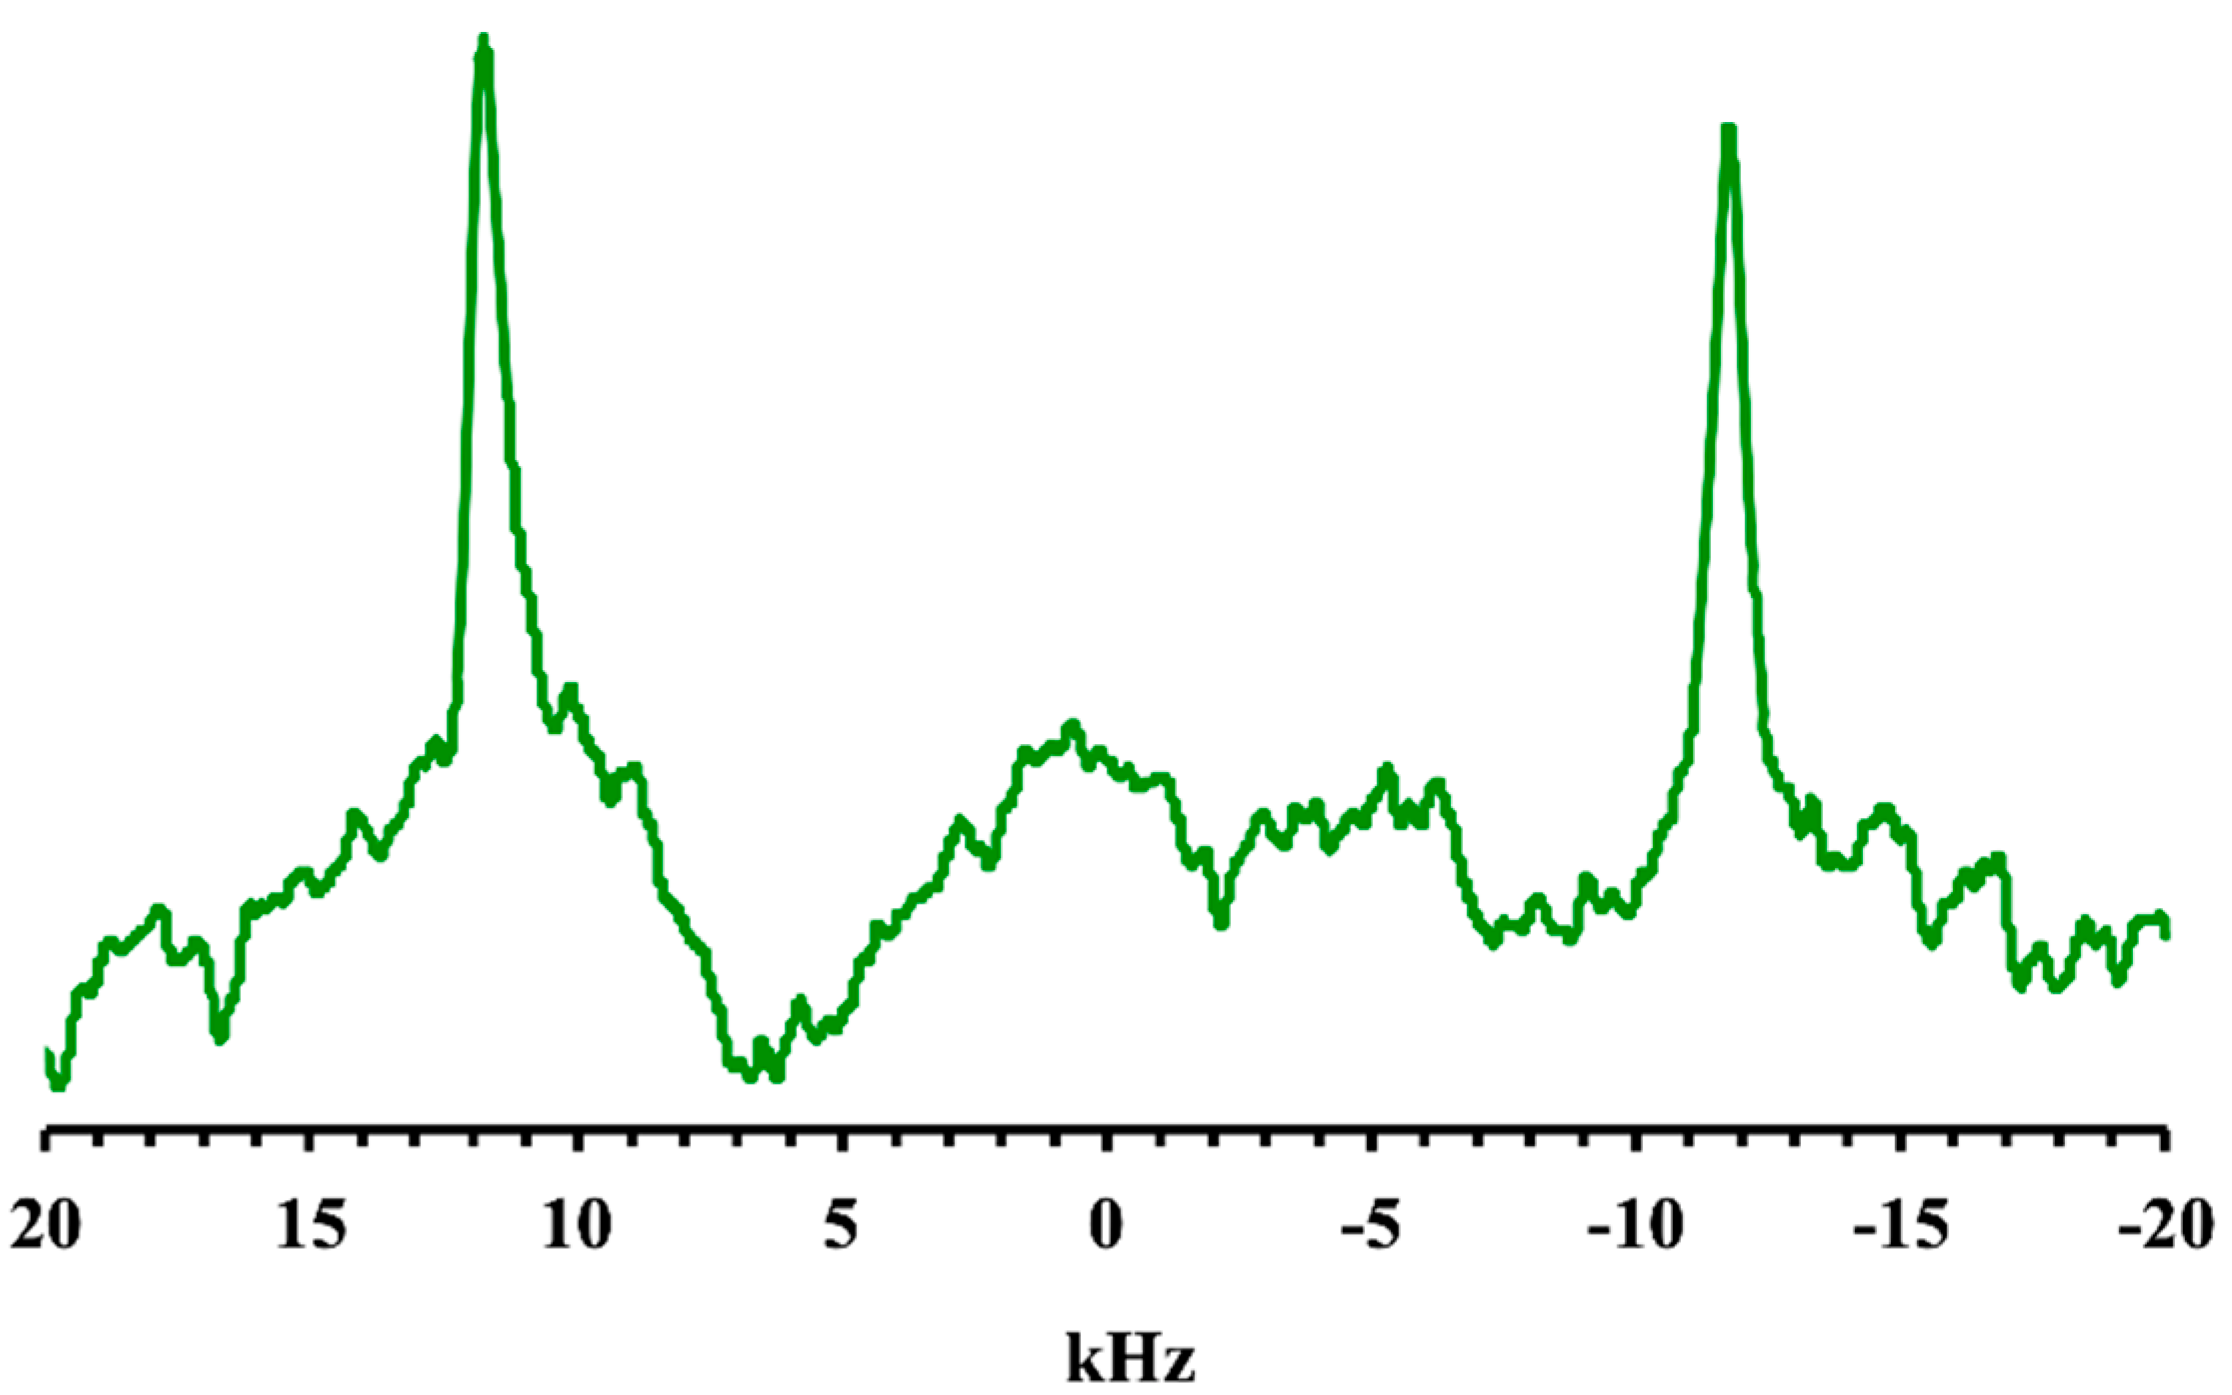
The 14N NMR spectrum (14N nucleus has I = 1) of the tetraalkylammonium head group provided for consistent information into the bilayers ordering, as it refers to the molecular moiety with the lowest mobility (CTAB). The residual quadrupolar splitting (23.5 kHz) could be compared to the same splitting, which defines diluted lyotropic liquid crystals (Figure 2) [20]. The line width was rather small due to an orientational effect caused by the magnetic field, as already known for liposomes [21,22].
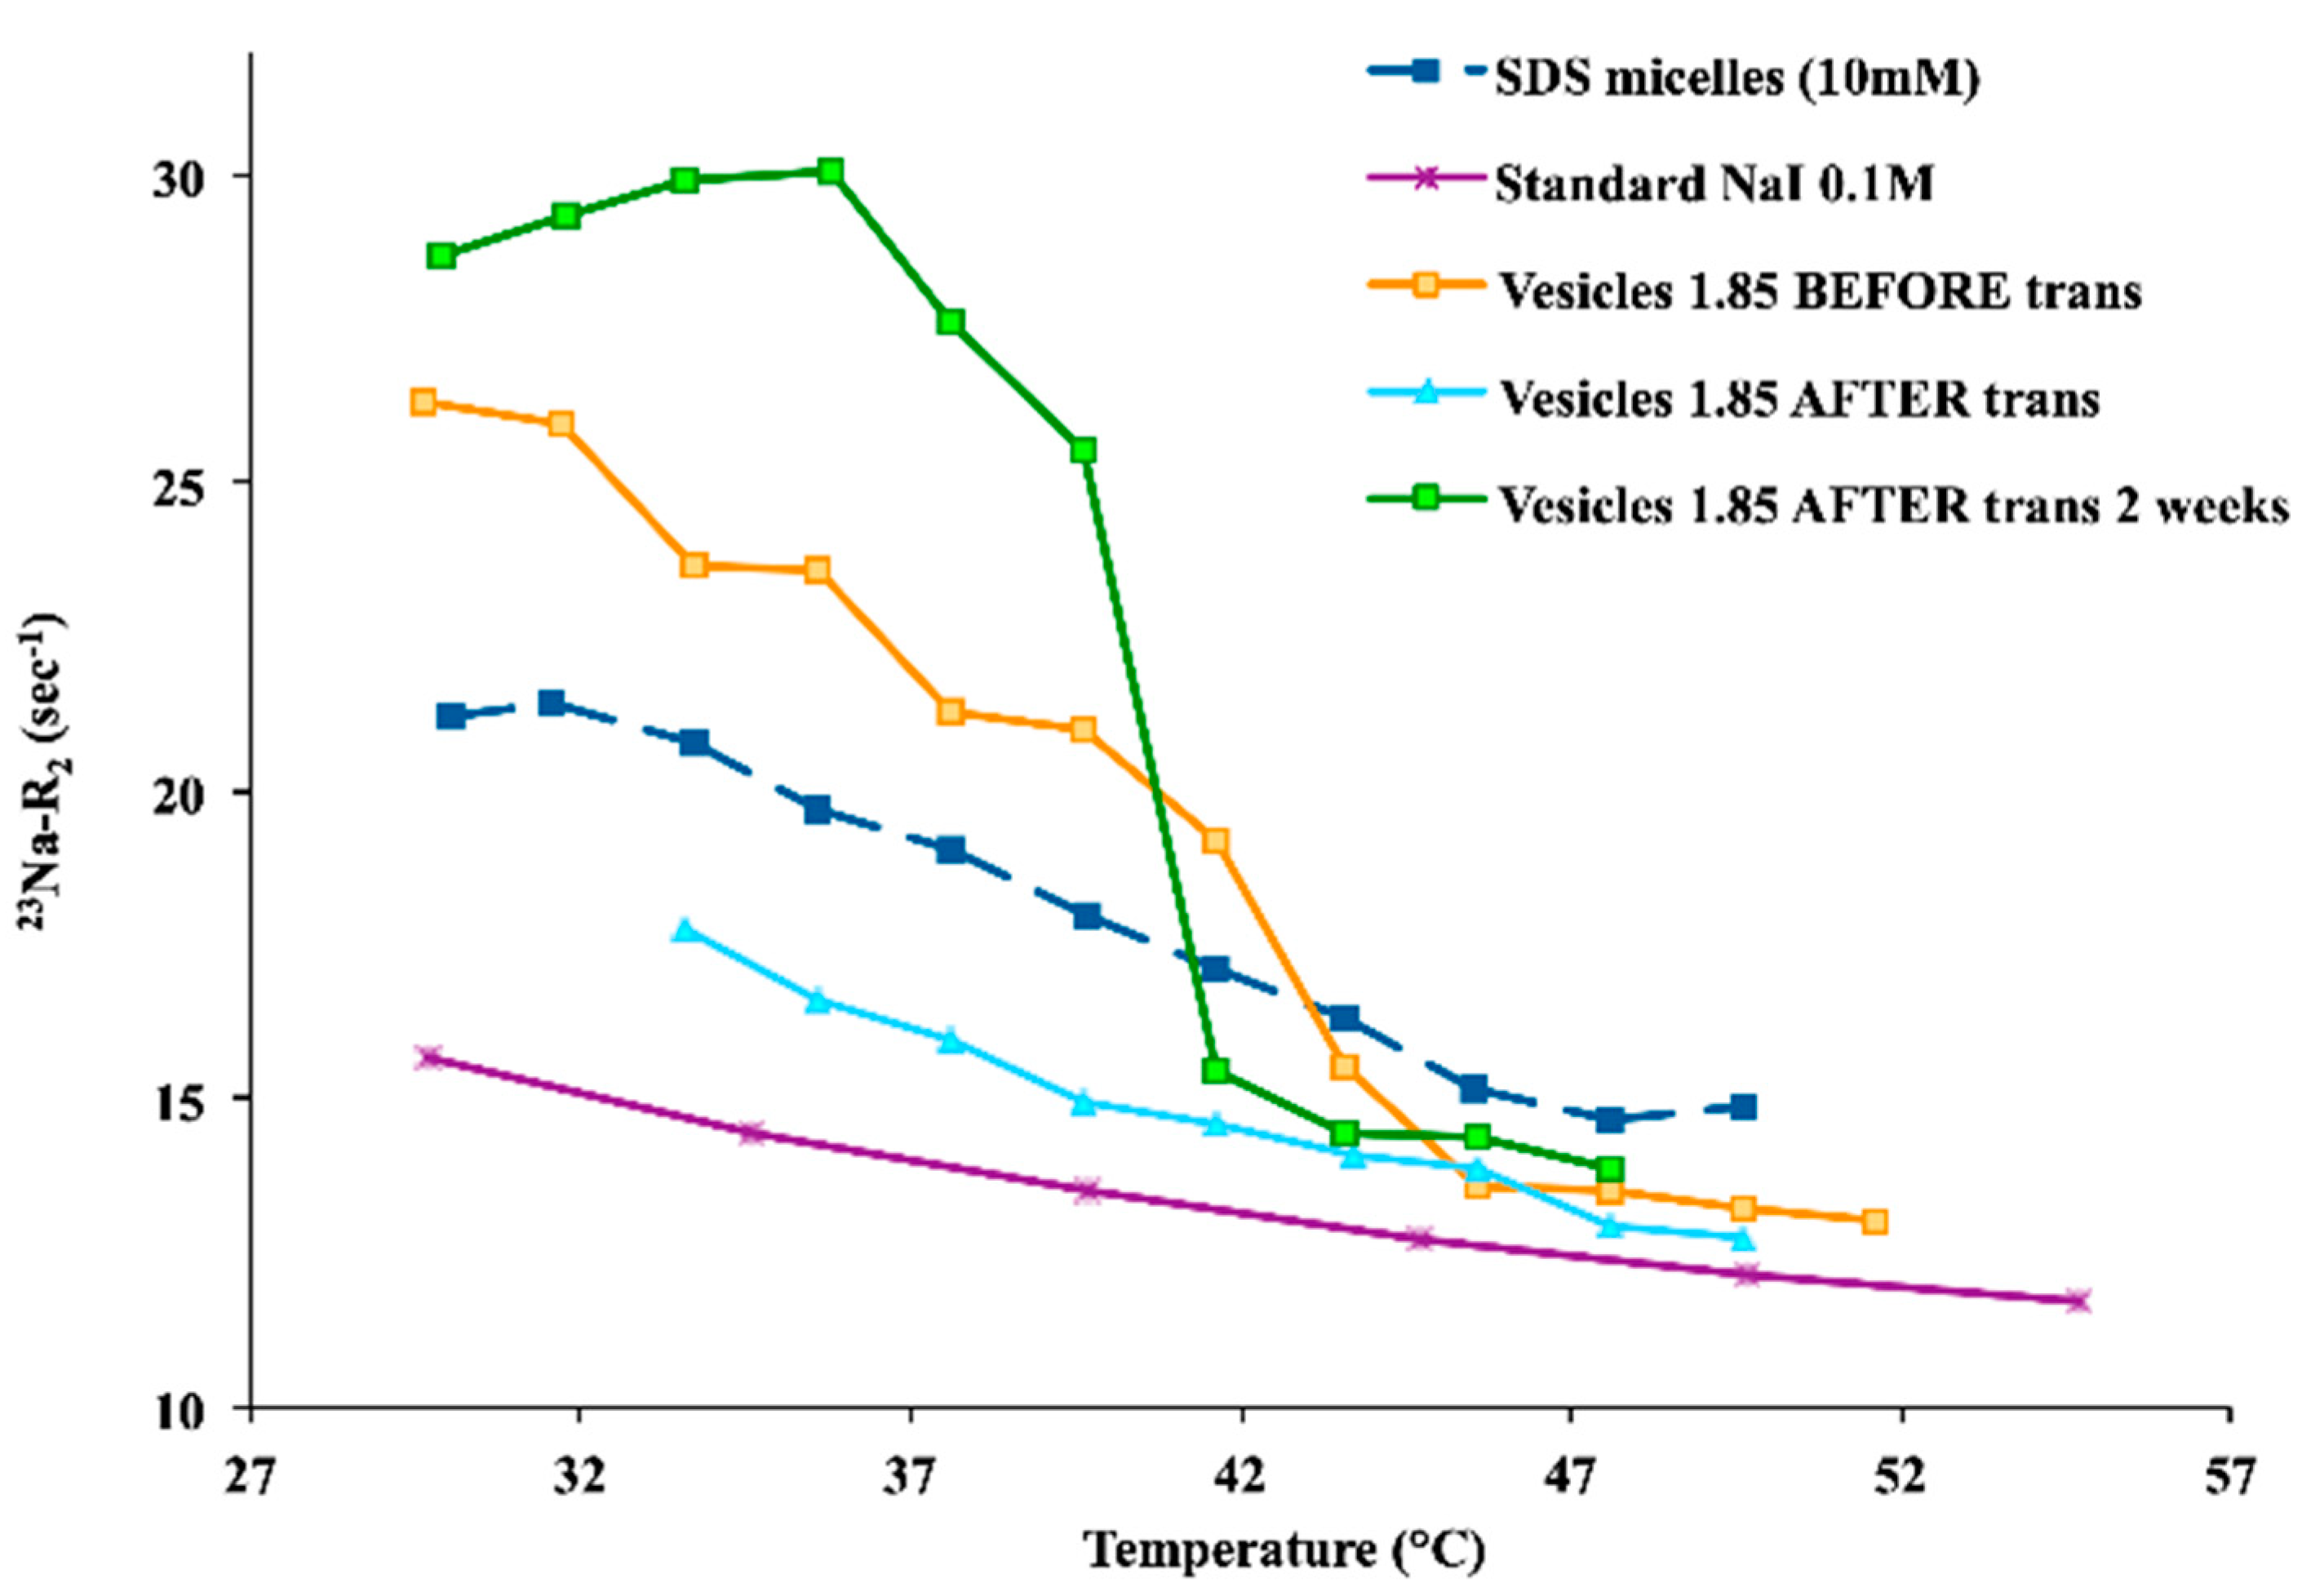
On the other hand, longitudinal relaxation rates, R1, were remarkably less sensitive to slow motions than 23Na transverse relaxation rates, R2. The echo decay complied with a single exponential both before and after the thermal transition. No significant deviations from the single exponential were present, according to the application of very diluted catanionic systems. Therefore, R2 values refer to averages related to central and satellite transitions [23]. By comparing the 23Na R2 trends, it was possible to observe a remarkable difference within the free Na+, with reference to the negatively charged vesicles. Indeed, the interaction of the counterion with negatively charged catanionic vesicles showed to be higher than for free Na+ (e.g., NaI 0.1 M standard solution). Conversely, the 23Na R1 trends did not demonstrate a significant difference among the catanionic aggregates and the free Na+. Moreover, higher molar ratios R resulted in larger 23Na R2 values. A 23Na R2 decrease was observed with increasing temperature, reaching the 23Na R2 range values for the standard free Na+, after the critical transition temperature (Figure 3). Therefore, the 23Na R2 values decreased when the temperature increase was consistent with the main dissociation of Na+ from the vesicular aggregates. Additionally, the mentioned phenomena affected the packing parameter, which was the driving force for the spontaneous interfacial curvature. This was due to a screening decrease of the repulsive interactions among head groups of the same charge, affecting the tail mobility, as well as enhancing the related volume.
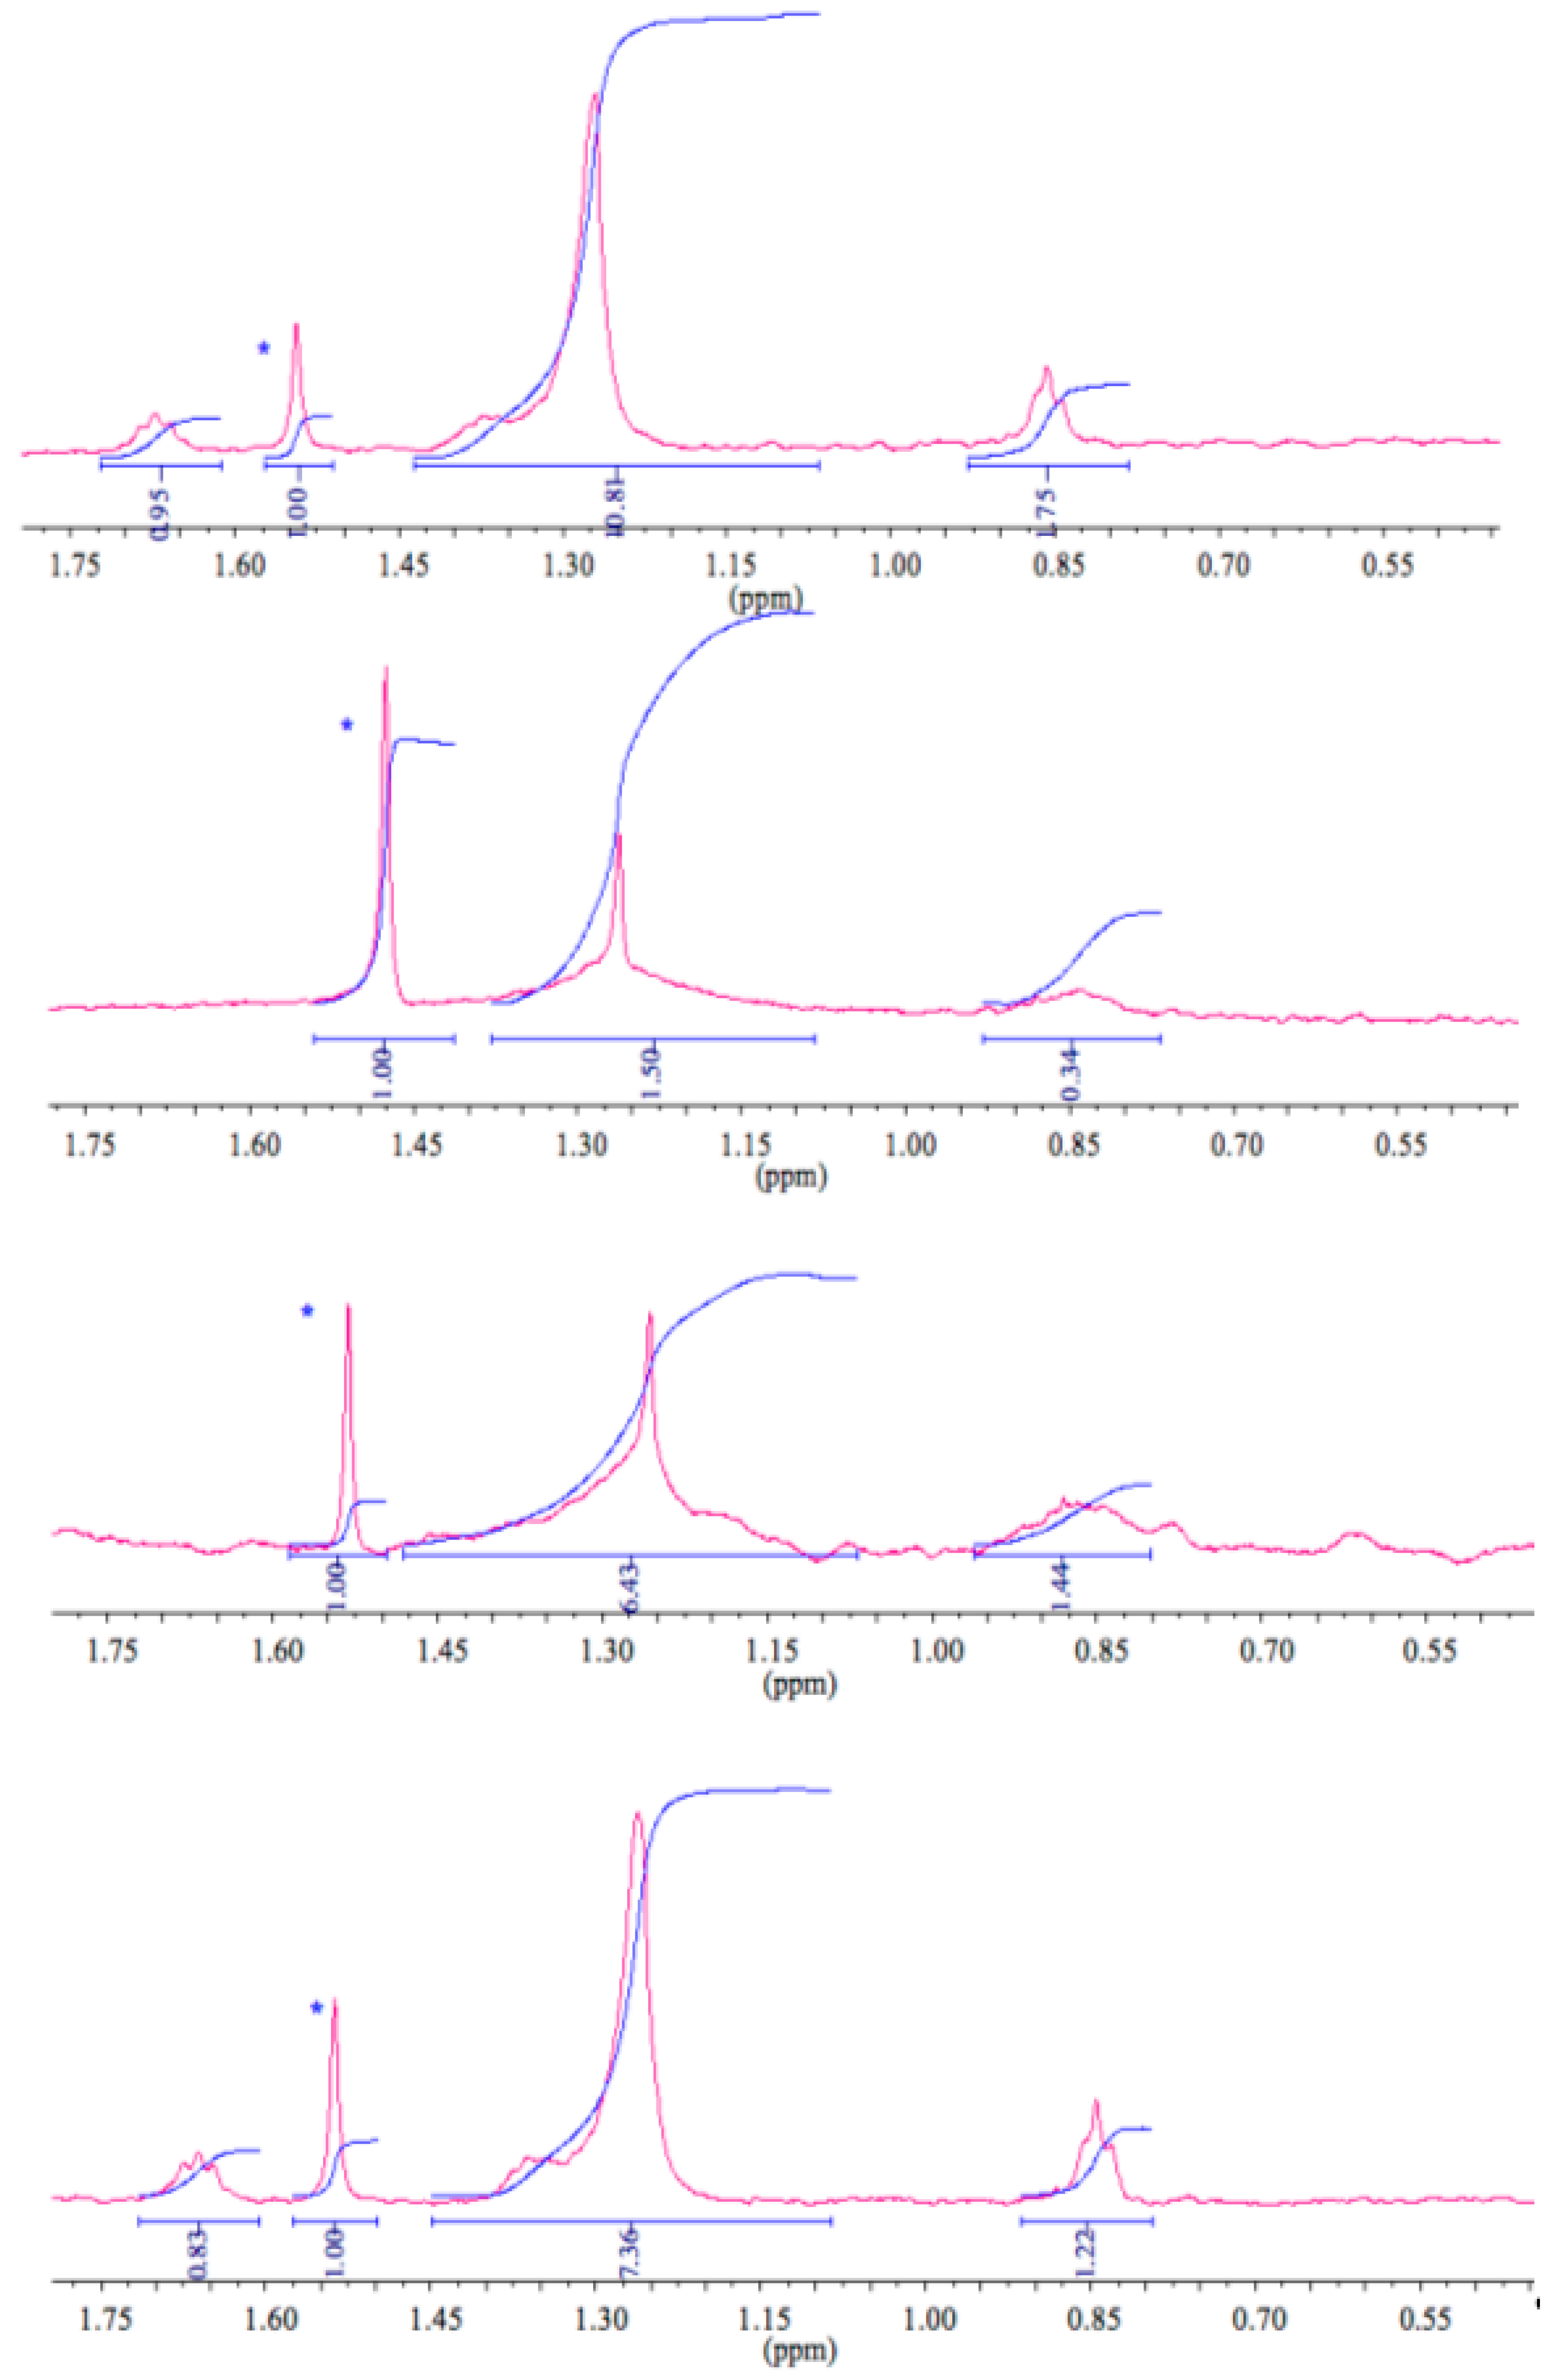
Interestingly, when the 23Na R2 measurements were acquired some days after samples were brought back to room temperature, higher 23Na R2 values were recorded (especially for the higher molar ratio R samples) due to changes in the correlation times of the motions modulating the quadrupolar interaction. The lower sodium dissociation led the process, confirming the rise in the dodecyl sulfate vesicles content after the transition, as endorsed by the 1H-NMR spectra (Figure 4). As expected, all detectable 1H-NMR signals corresponded to the monomeric anionic surfactant, showing no signal for the cationic counterpart. The faster dodecyl sulfate exchange among bulk and vesicles was responsible for the line width broadening for the 1H dodecyl sulfate resonances, together with the heating cycle. According to the 23Na R2 values, 1H-NMR integrals analyses indicated lower values at high temperatures too. These findings demonstrated the dynamic uptake of the anionic component into the vesicular aggregates, confirming a higher dodecyl sulfate amount in the composition of the vesicles.
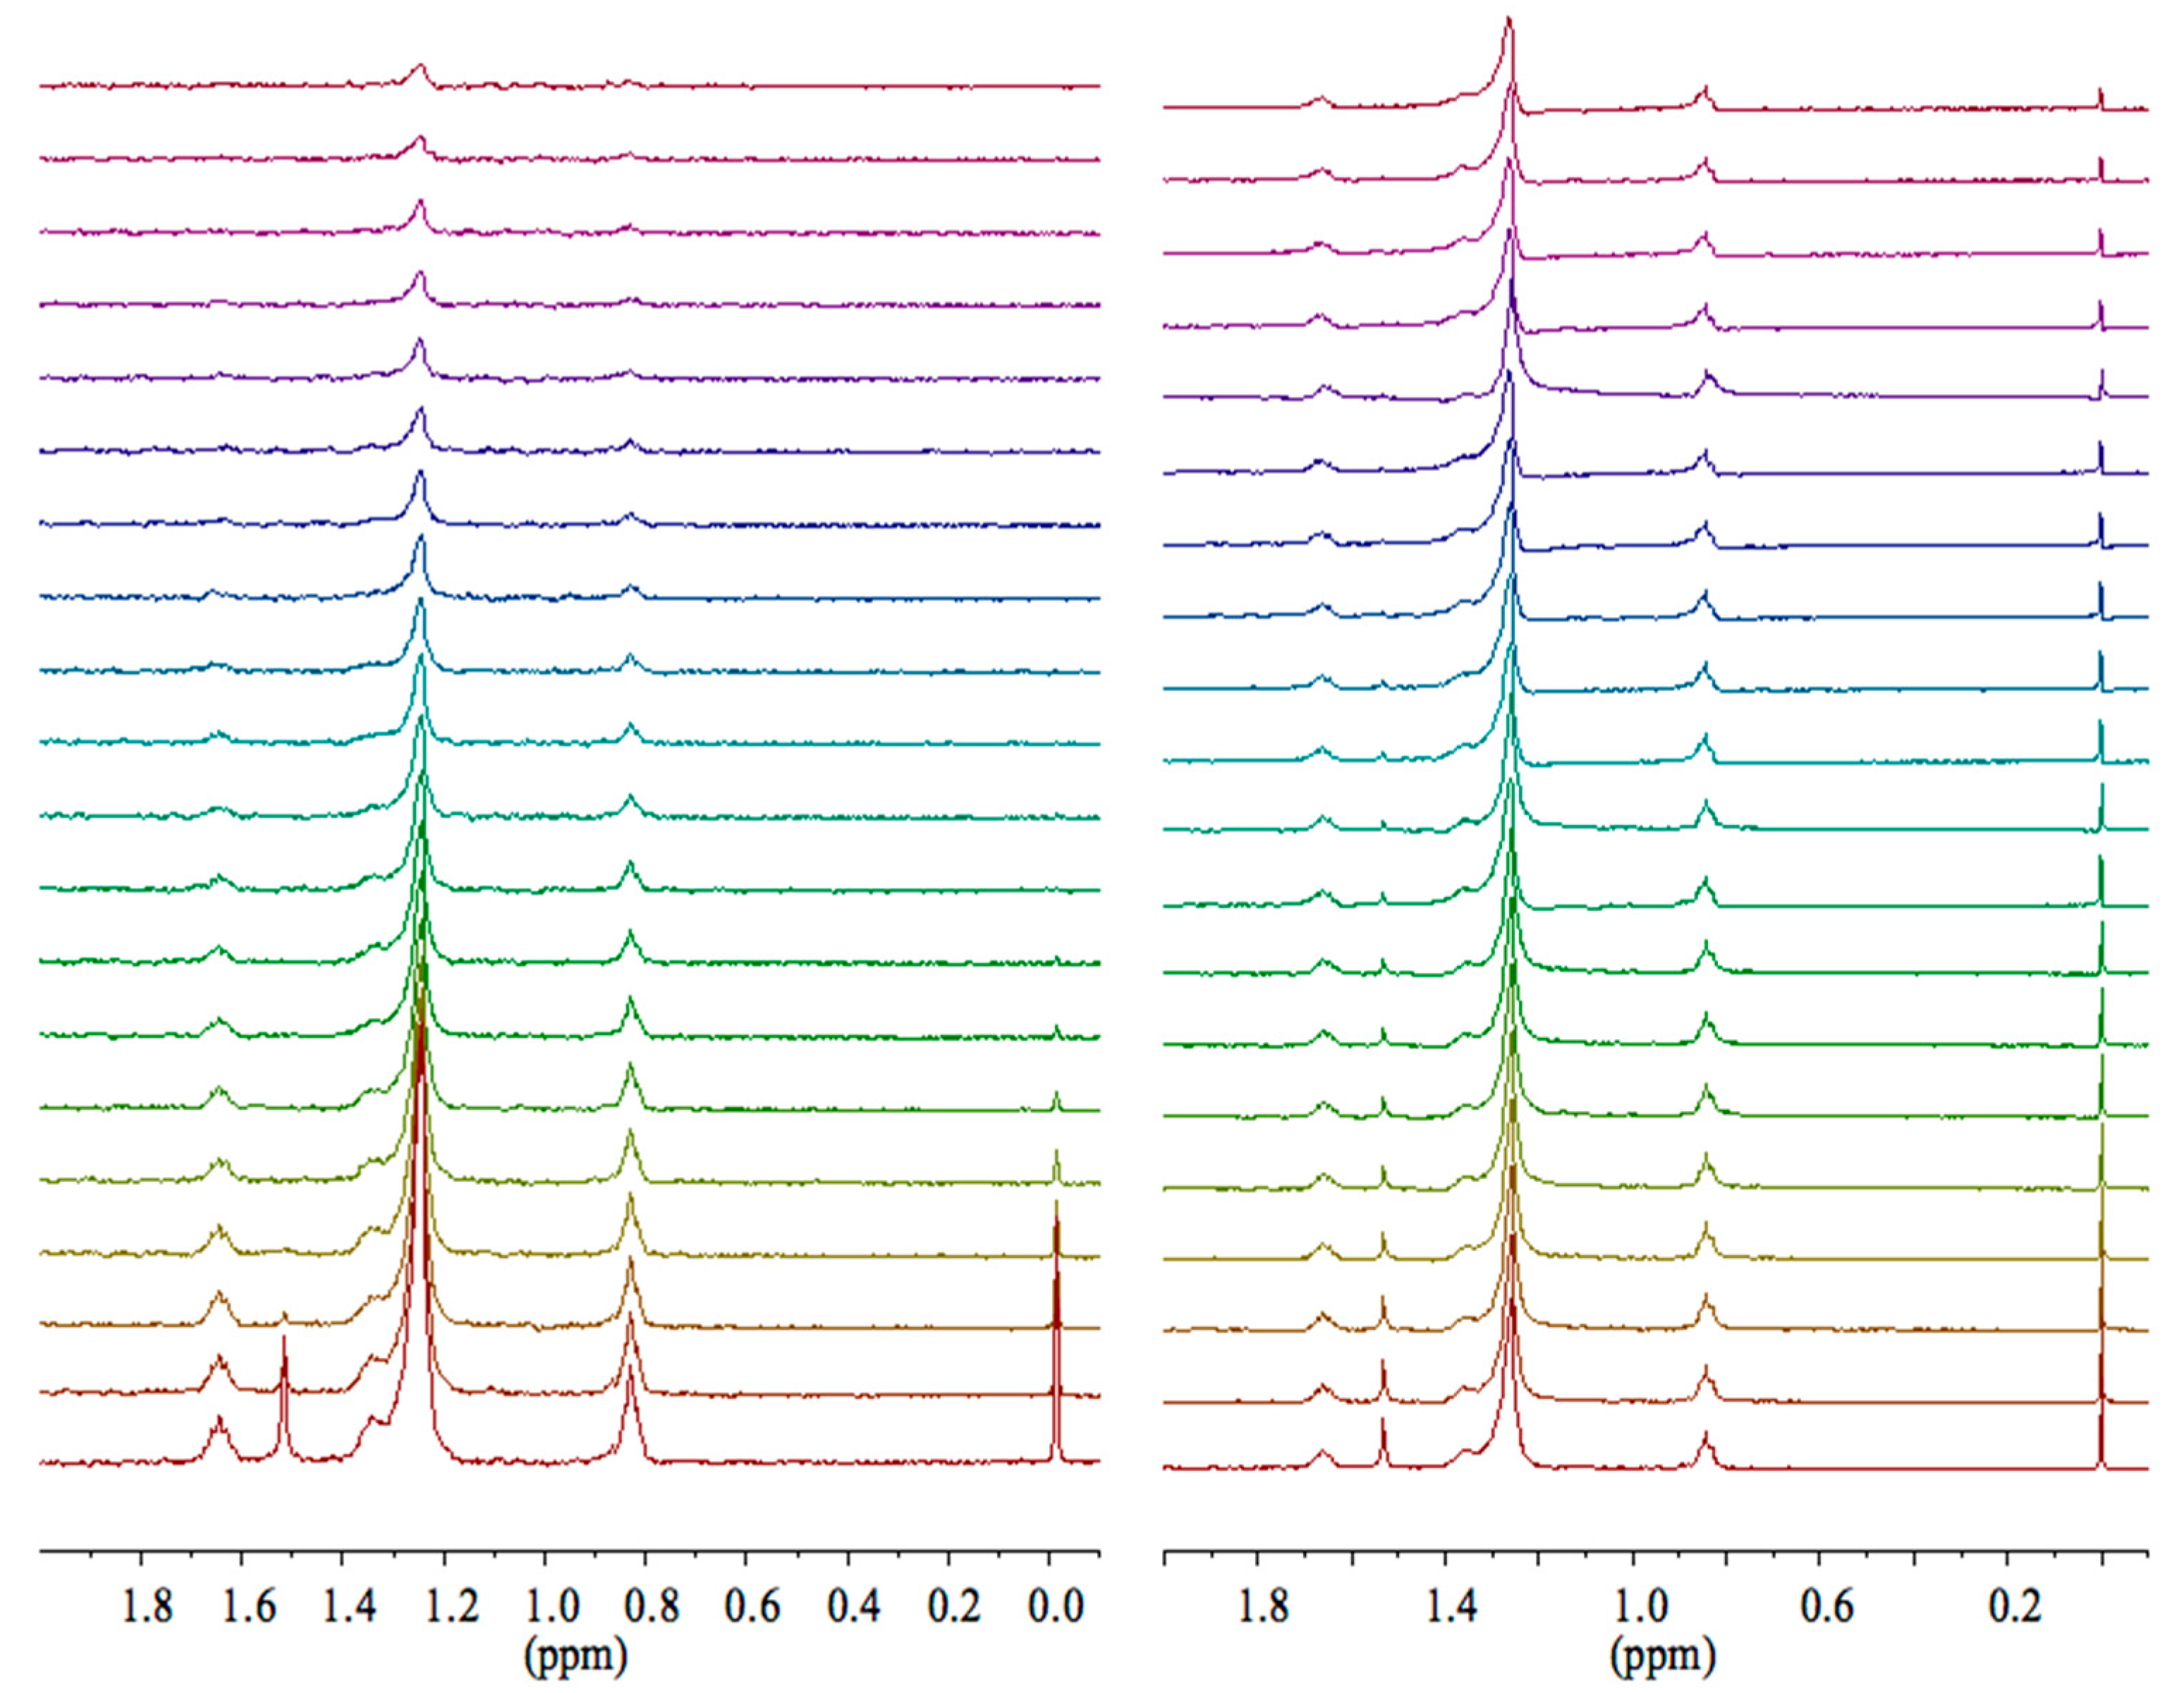
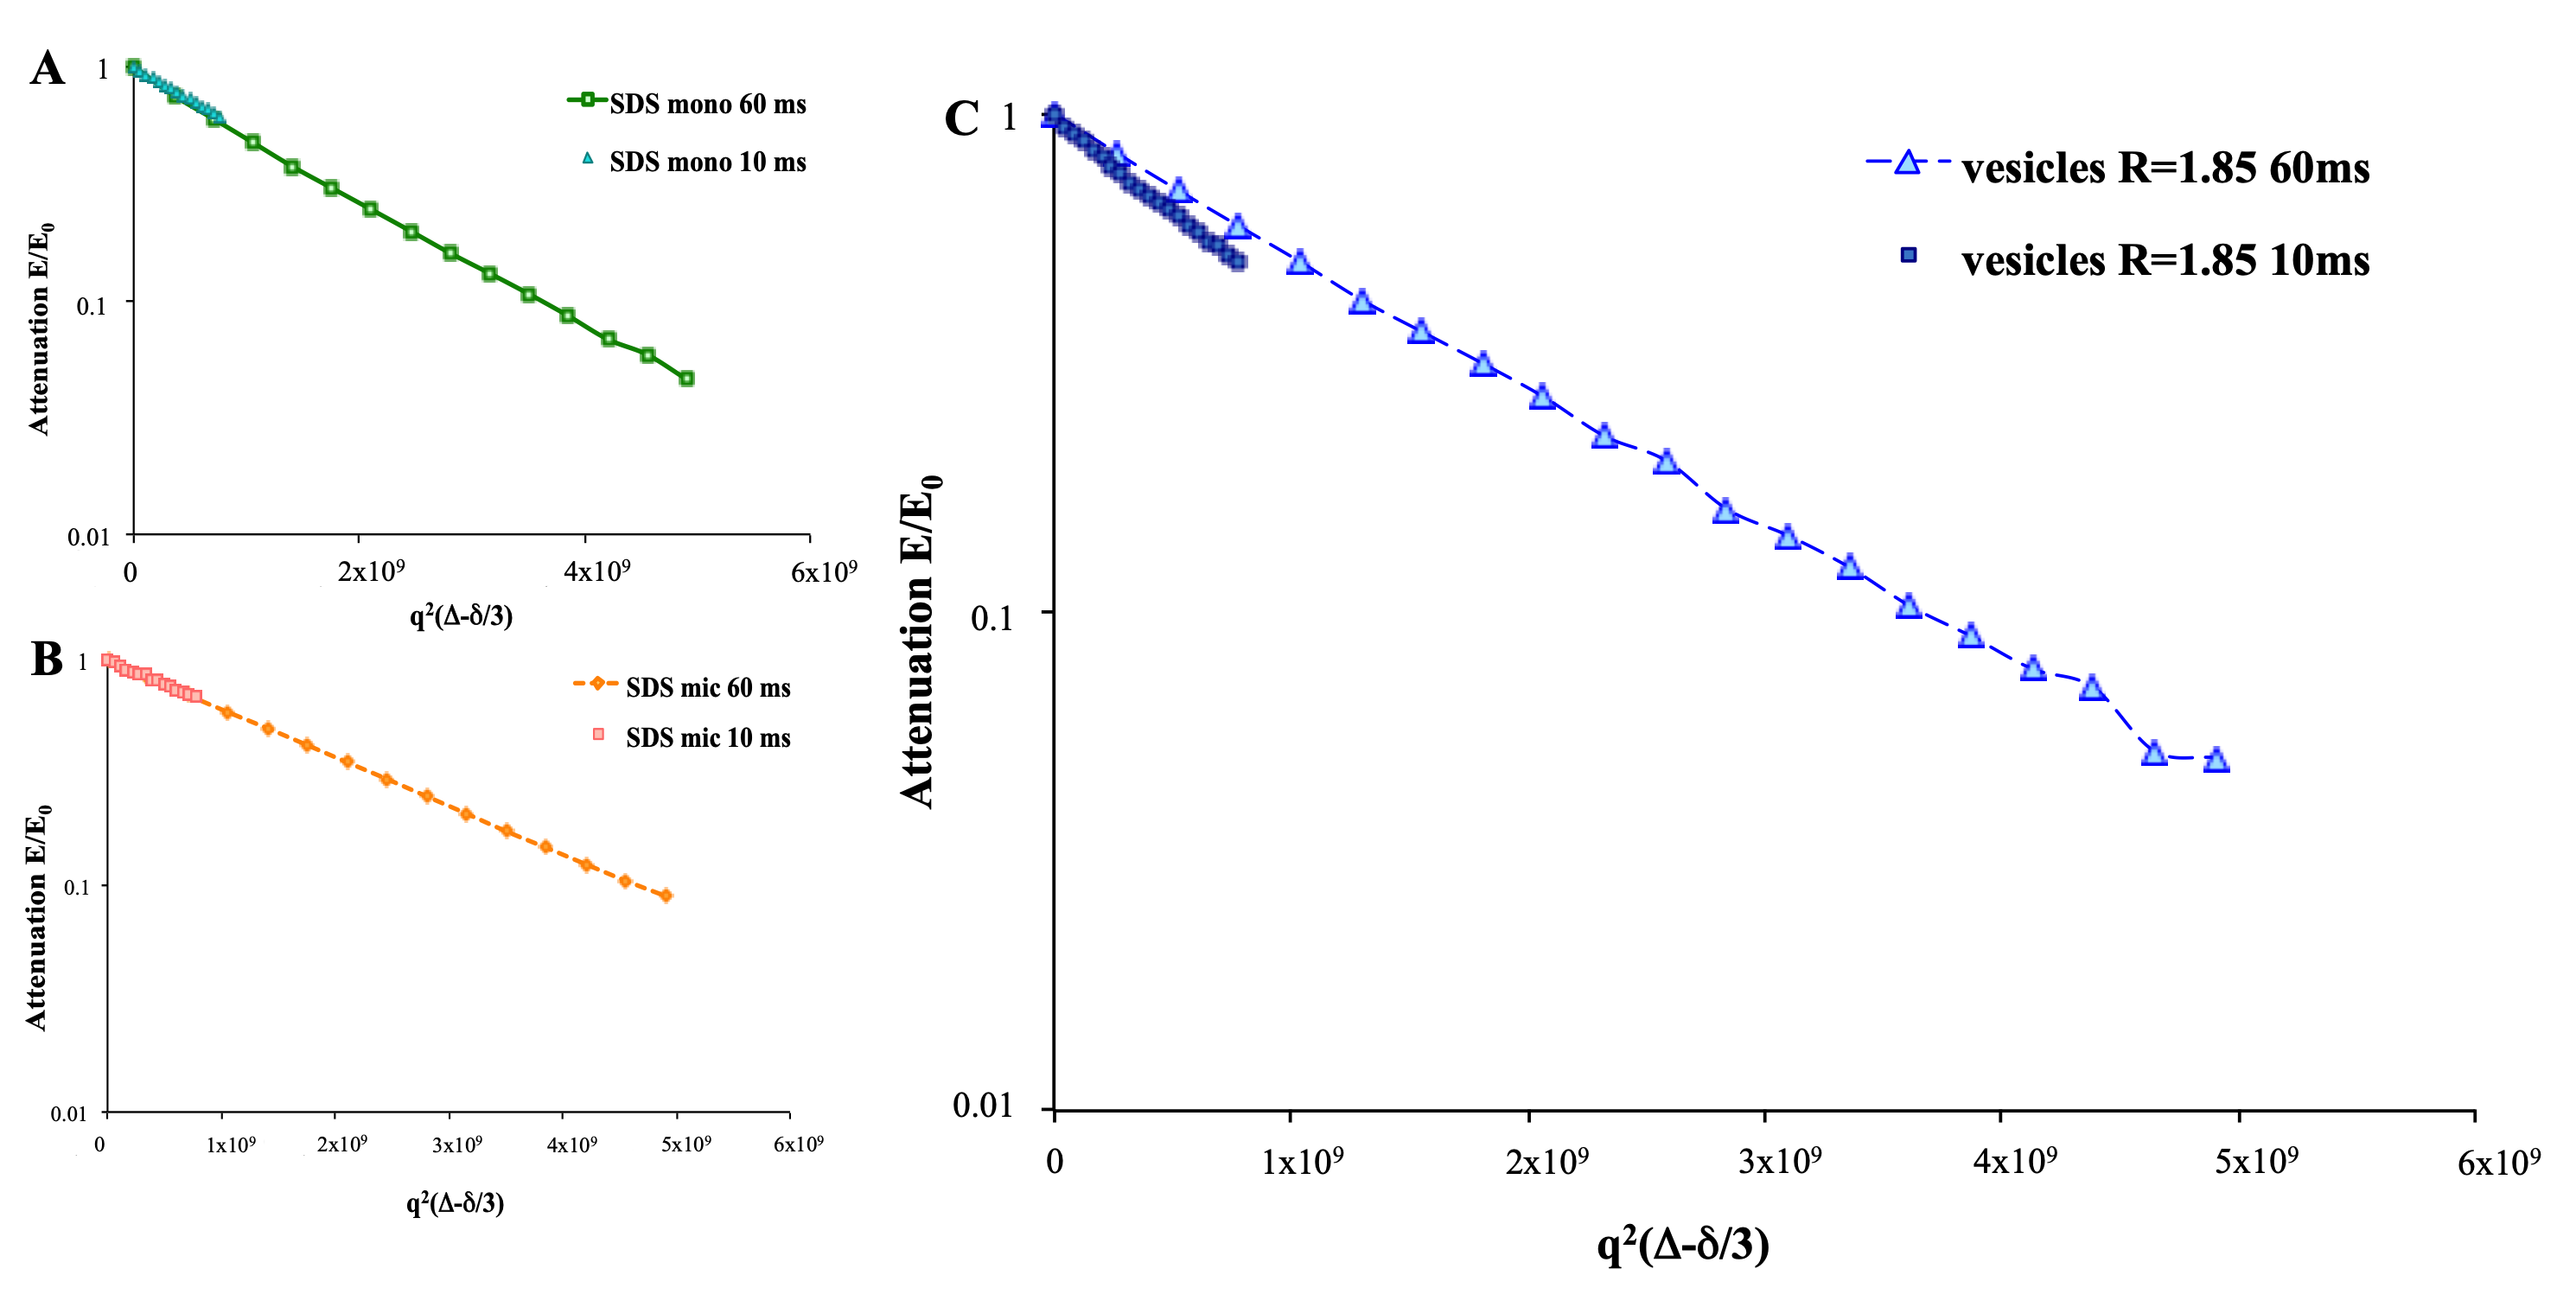
The isotropy of the solutions was endorsed by the application of PGSTE experiments at different diffusion intervals and related analysis for the trends of the echo intensity: no shift changes were observed at the strongest gradients (Figure 5). Moreover, by plotting PGSTE echo decays at different diffusion delays (Δ = 10 ms, Δ = 60 ms) for vesicular samples, an interesting slope difference was detected, whereas no slope deviations were present both in monomeric and micellar dodecyl sulfate samples. A slow exchange (~3 Hz) between the vesicular aggregates and the bulk was noticed for the dodecyl sulfate in vesicles. On the other hand, a fast exchange (104 Hz) with the bulk in micellar samples was noticed for the dodecyl sulfate. According to Johnson [12], the PGSTE data, at different delta intervals (Δ), demonstrated a dependence of the echo decays on delta intervals (Δ in vesicular solutions). Viceversa, no relationship among echo decays and diffusion delays were detected for both micellar and monomeric dodecyl sulfate samples (Figure 6).
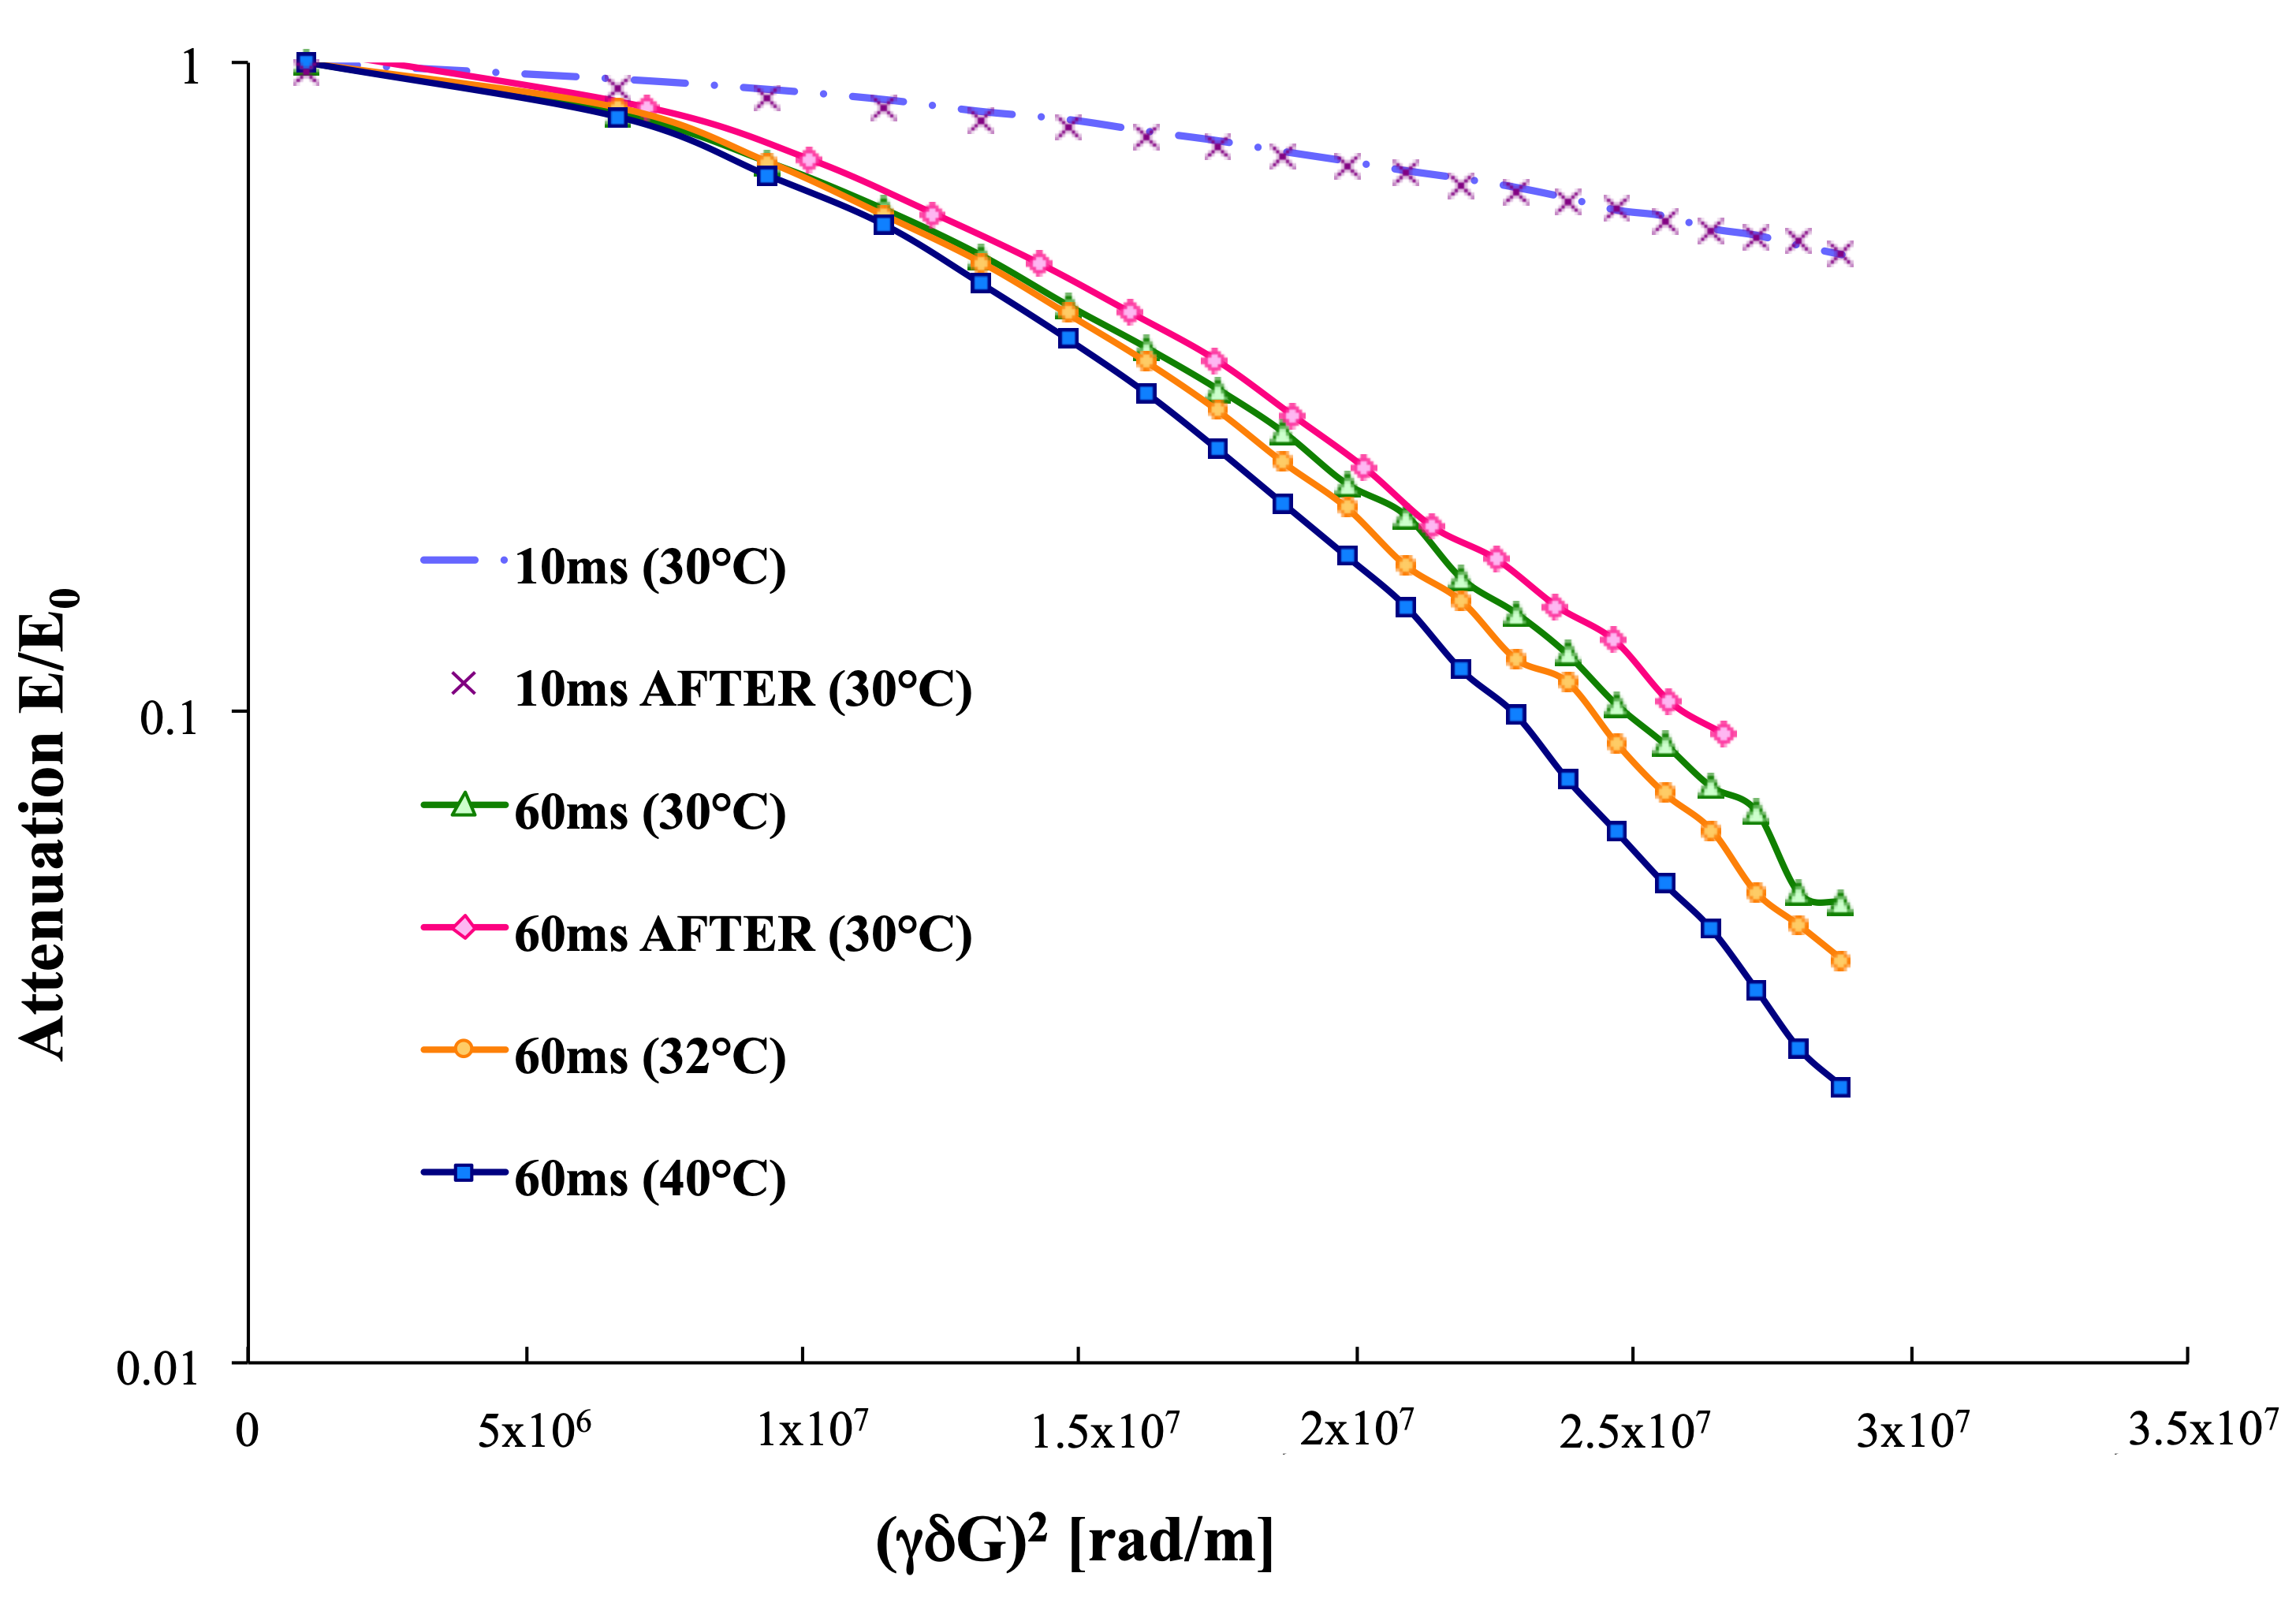
According to polarized light microscopy results, as well as confirmed by the PGSTE analysis, no liquid crystals were present in any sample, where only one diffusion coefficient D was detected. Moreover, both micellar and monomeric dodecyl sulfate samples did not exhibit any difference in the attenuation slope, at different diffusion intervals Δ with an extremely fast exchange between the studied species and the bulk. Conversely, at different diffusion intervals Δ, the analysis of the diffusion coefficient D for dodecyl sulfate in vesicles showed a remarkable difference in the slopes, specifically between the Δ = 10 ms and Δ = 60 ms. Therefore, the exchange constant was found to be slow, in the range of few hertz. In the first stage of PGSTE experiments after the thermal transition, a Δ = 10 ms diffusion interval was applied to follow the vesicles’ thermal transition, with an R = 1.85 sample. Unfortunately, the spectrometer could not detect any changes before/after the thermal ramp with the mentioned experimental setup, whereas, at Δ = 60 ms, both a slightly faster exchange between the vesicular aggregates and the bulk and a slower echo decays were detected (Figure 7). Thus, a pseudo-phase transition (from multilamellar to unilamellar vesicles), involving thermodynamic changes in the system, took place [5].
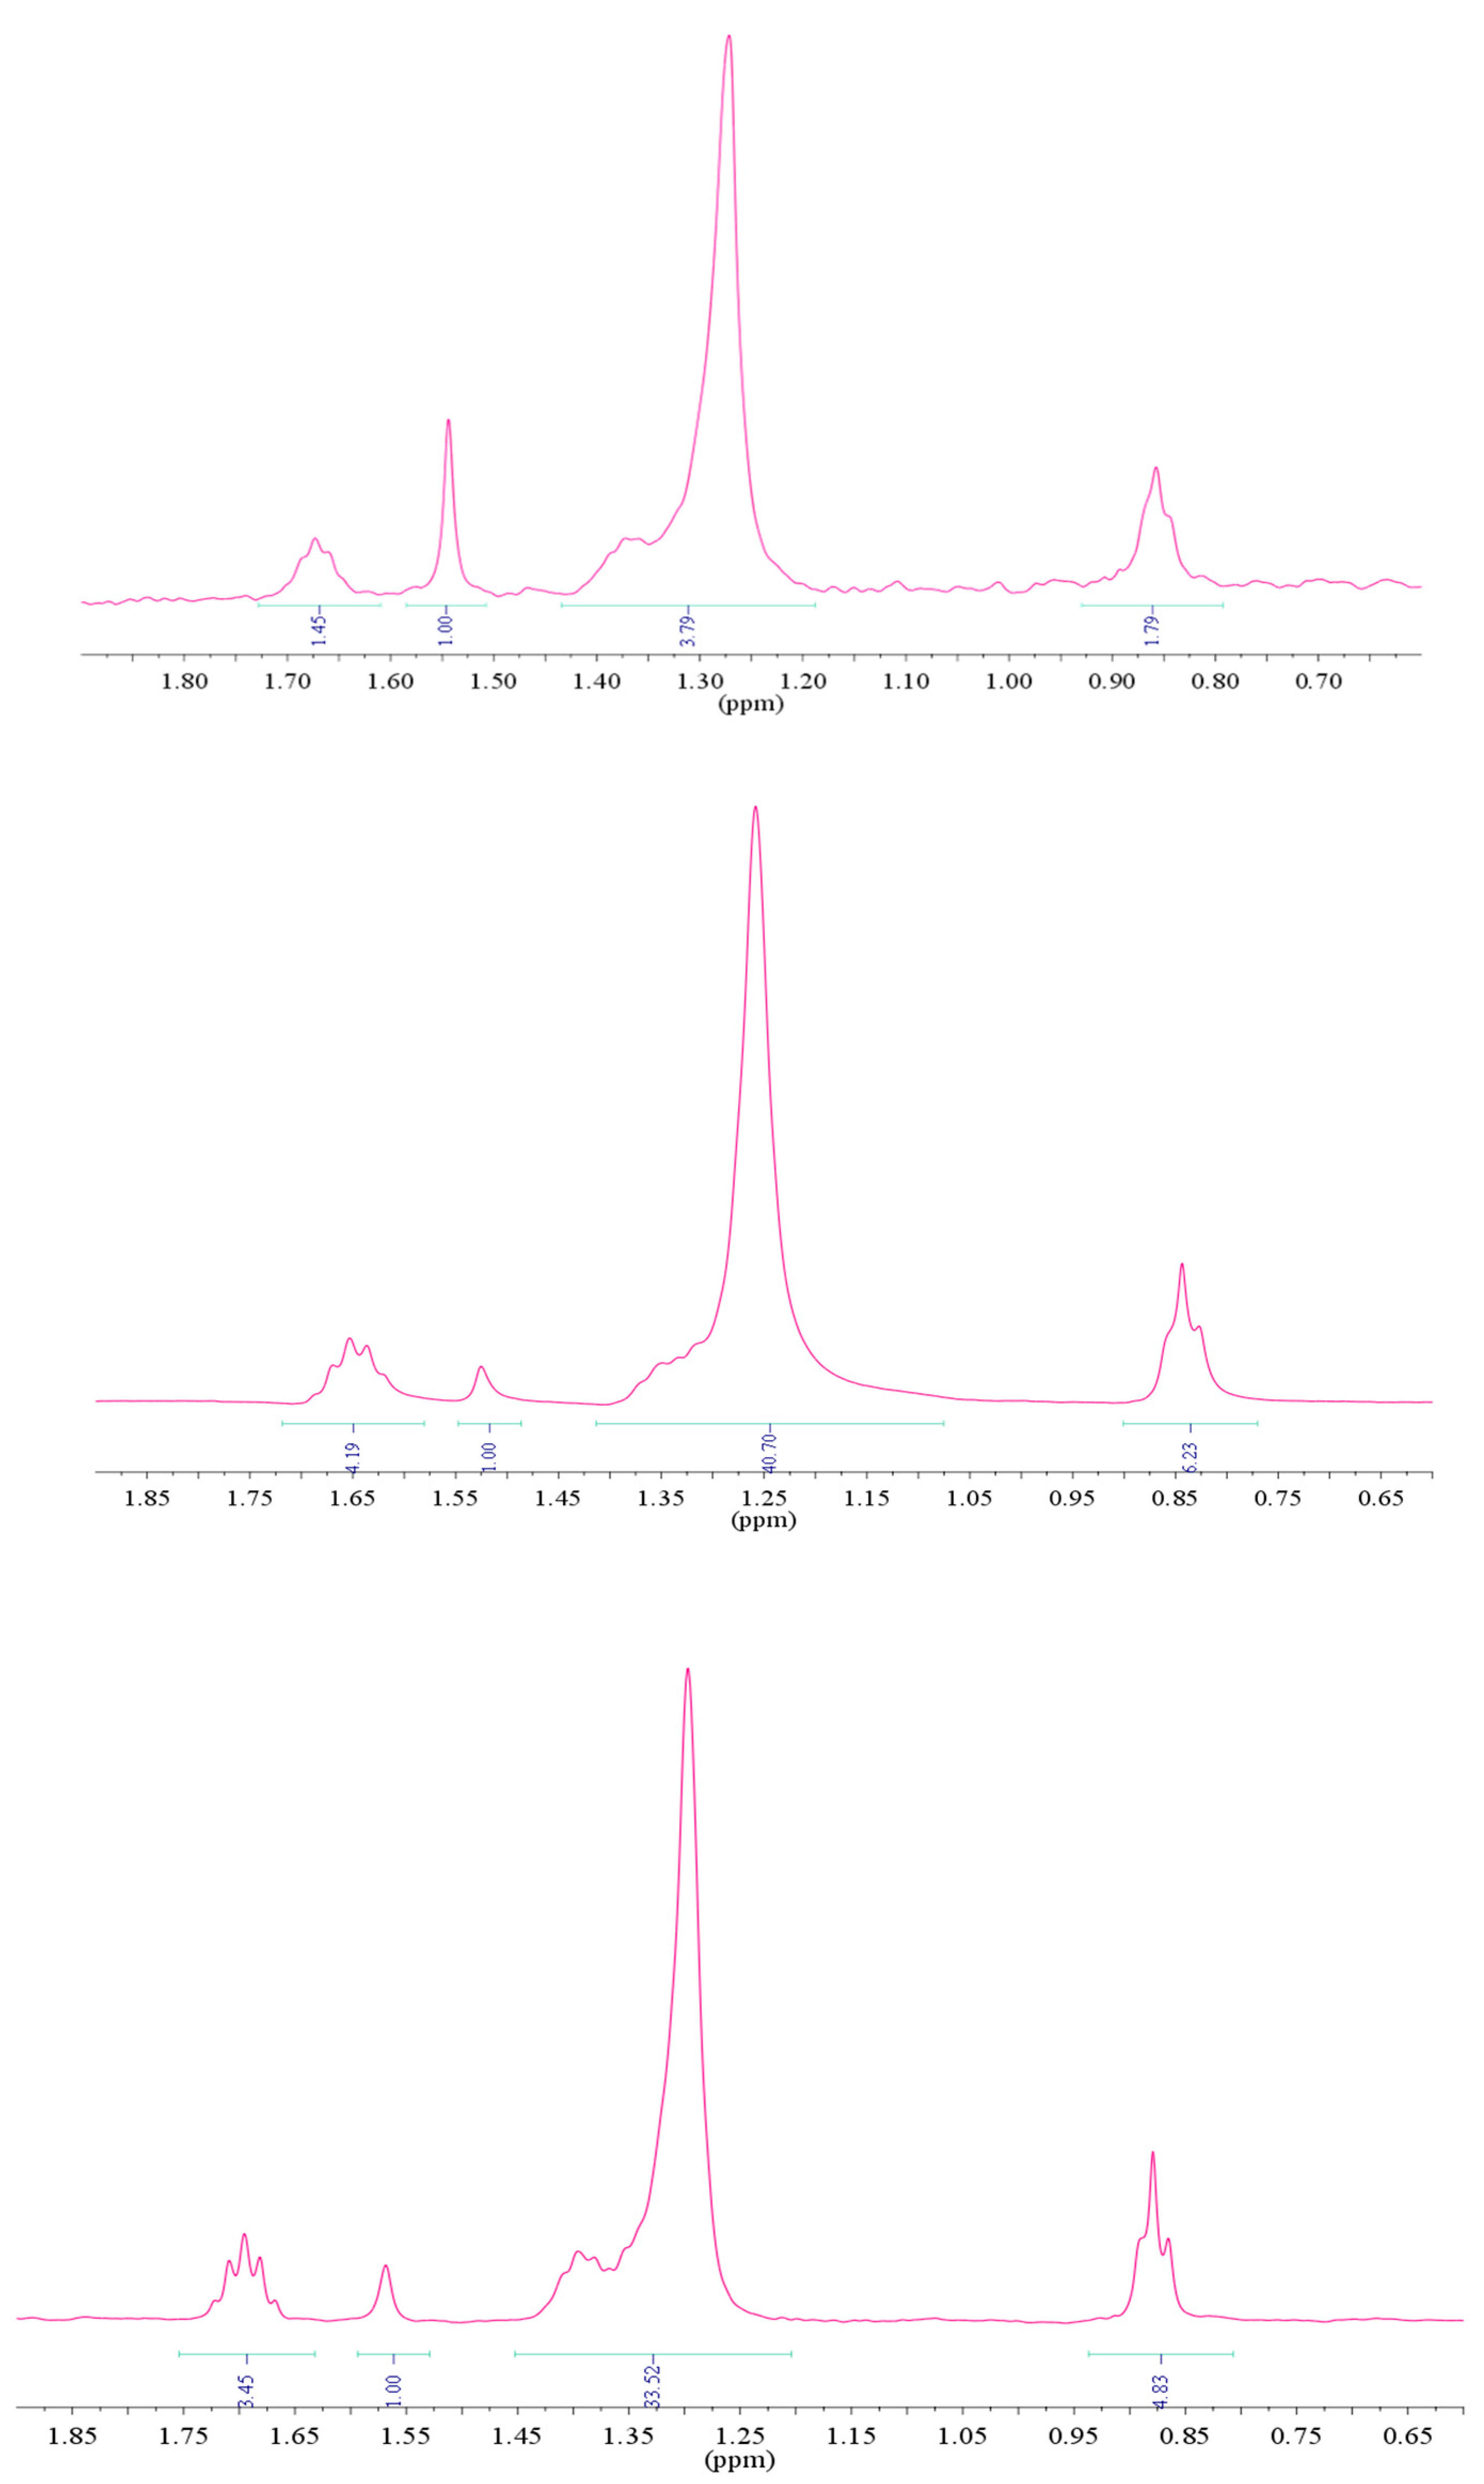
Comparing 1H-NMR dodecyl sulfate integrals of monomeric (6 mM), micellar (10 mM), and vesicular solutions (3.9 mM for R = 1.85), it was possible to understand the relative populations in the vesicular aggregates (free component and included). A small amount of dodecyl sulfate in vesicular aggregates was available for detection, whereas the overall concentration of dodecyl sulfate was partitioned both in dodecyl sulfate monomeric (6 mM) and micellar (10 mM) forms, as per 1H-NMR integrals (Figure 8).
2.2. SDS/CPB Versus Sodium Decyl Sulfate (SdS)/CPB Systems
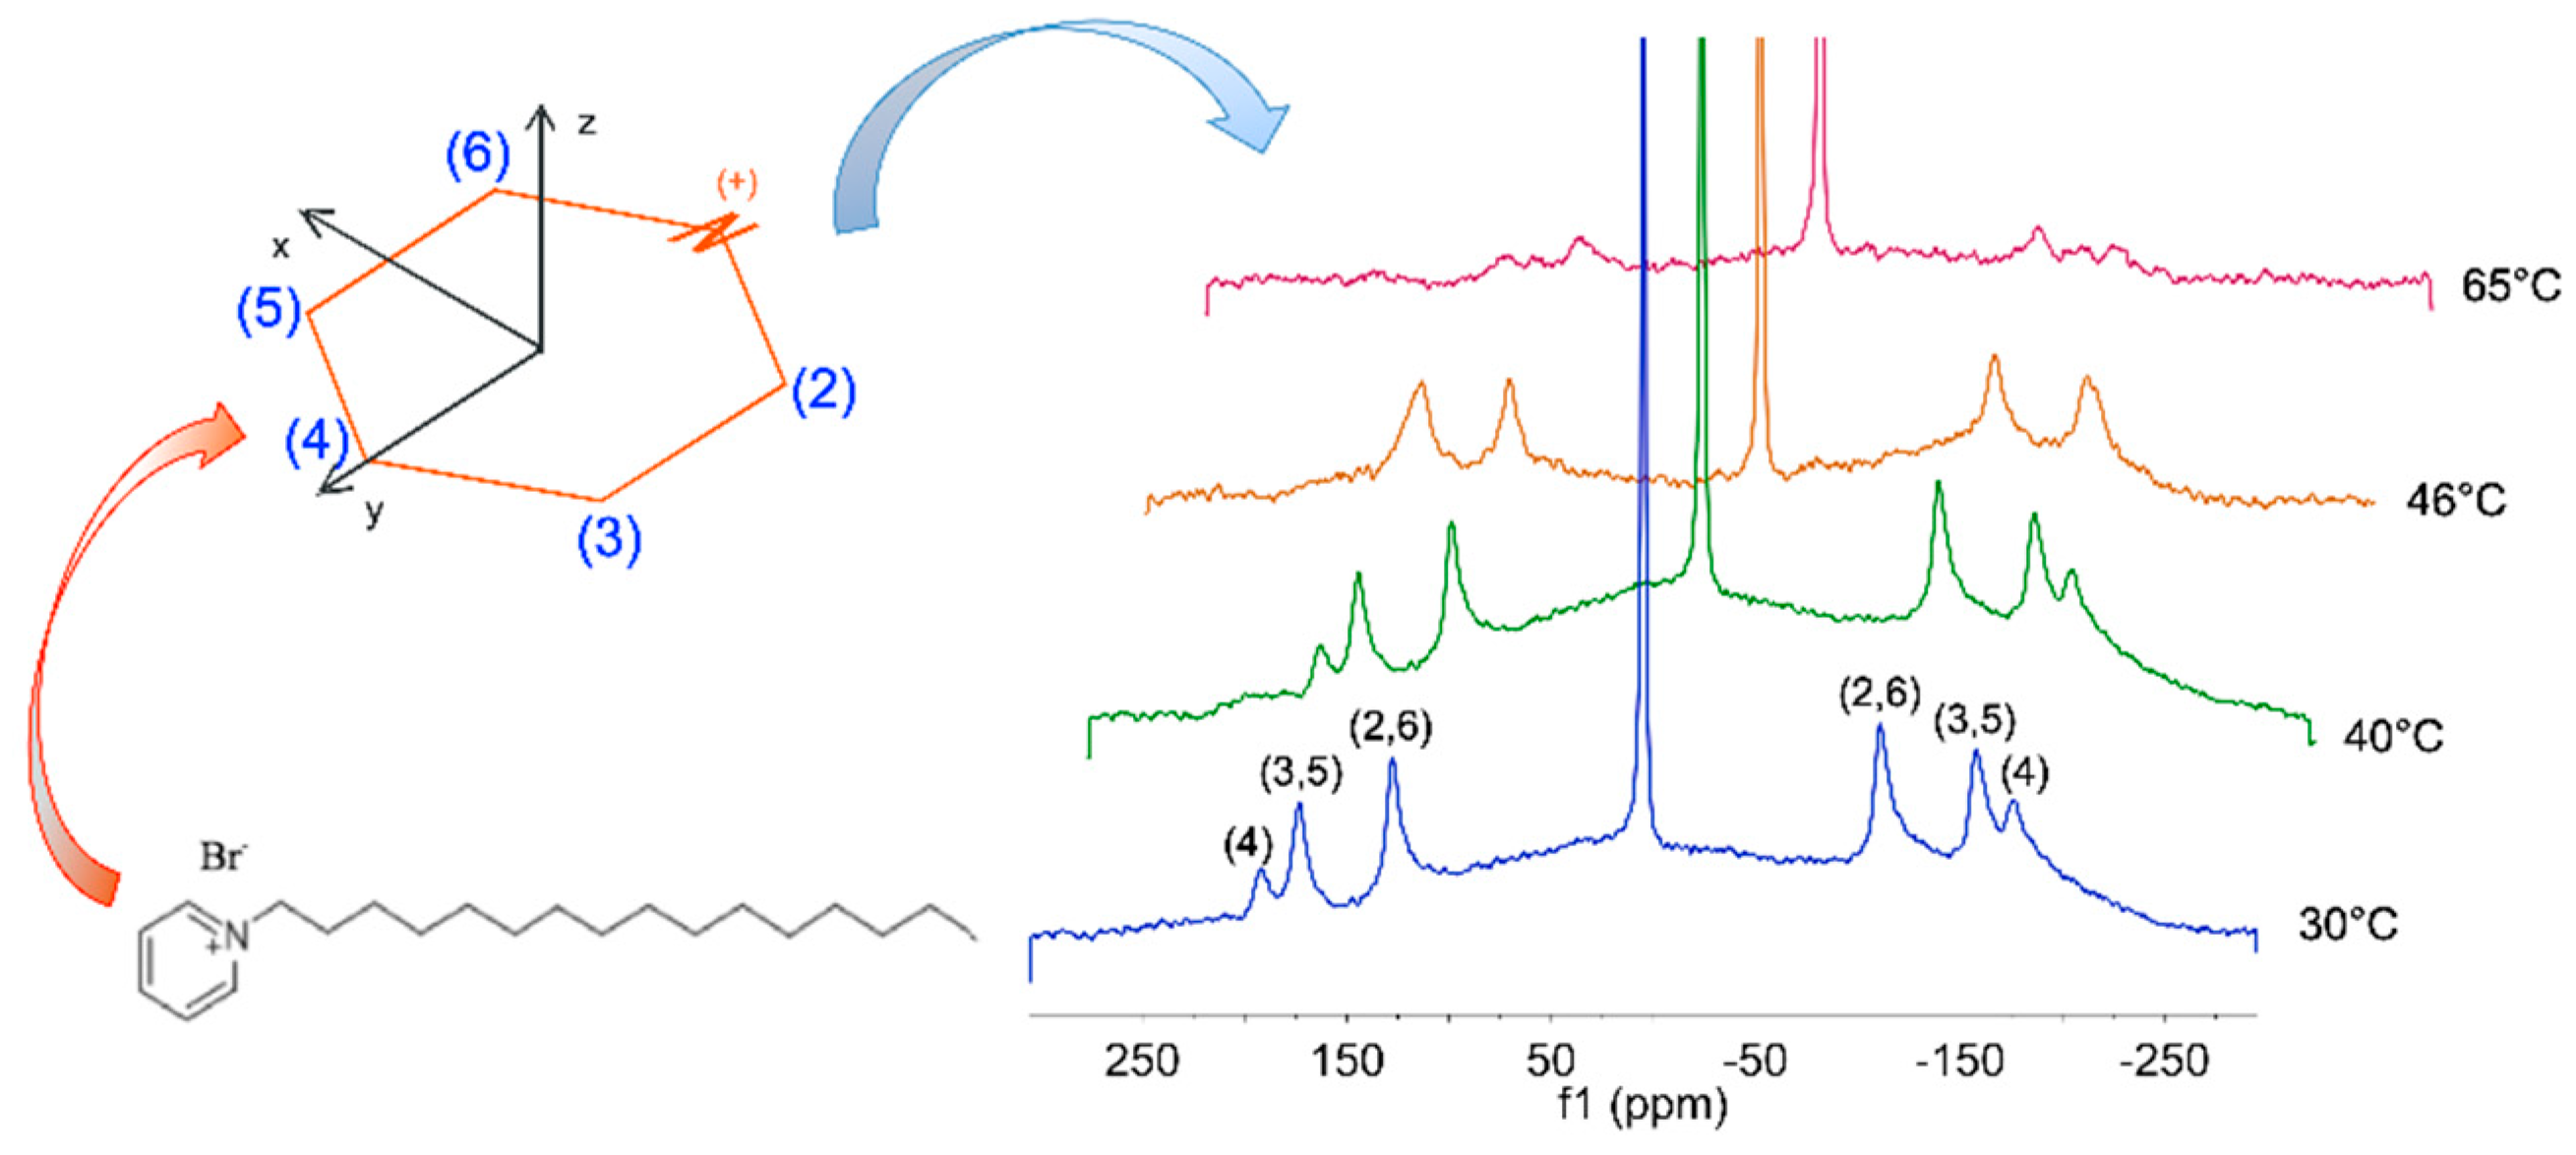
SDS/CPB (sodium dodecyl sulfate/cetylpyridinium bromide) and SdS/CPB (sodium decyl sulfate/cetylpyridinium bromide) were compared, taking advantage of the information by the pyridine substituent, to select the most appropriate and stable vesicular system. For this purpose, both anionic (vesicular systems) and cationic (mixed-micellar system) were changed. 2H-NMR was used to study a system with a molar ratio R = 1.7, composed of sodium decyl sulfate (SdS), cetylpyridinium bromide, with the fully deuterated head group (CPB-d5). The vesicular solution appeared milky, with no birefringence, as previously found for the SDS/CTAB systems. According to Figure 9, Δν(2H(2)) and Δν(2H(3)) showed a remarkable difference due to the geometry distortions from a regular hexagon of the pyridinium ring. The Δν(2H)s confirmed the order parameters—Sxx, Syy, and Szz—of the pyridinium head-group, referred to the axes system. Moreover, a residual quadrupolar splittings Δν(2H(i)) for the “i” signal of the pyridinium ring in the 2H NMR spectrum was detected [24]. The isotropy of the solution was confirmed by the HOD resonance as a singlet, as previously found for the SDS/CTAB systems. The maxima in a Pake doublet corresponded to the equatorial orientation for a sphere.
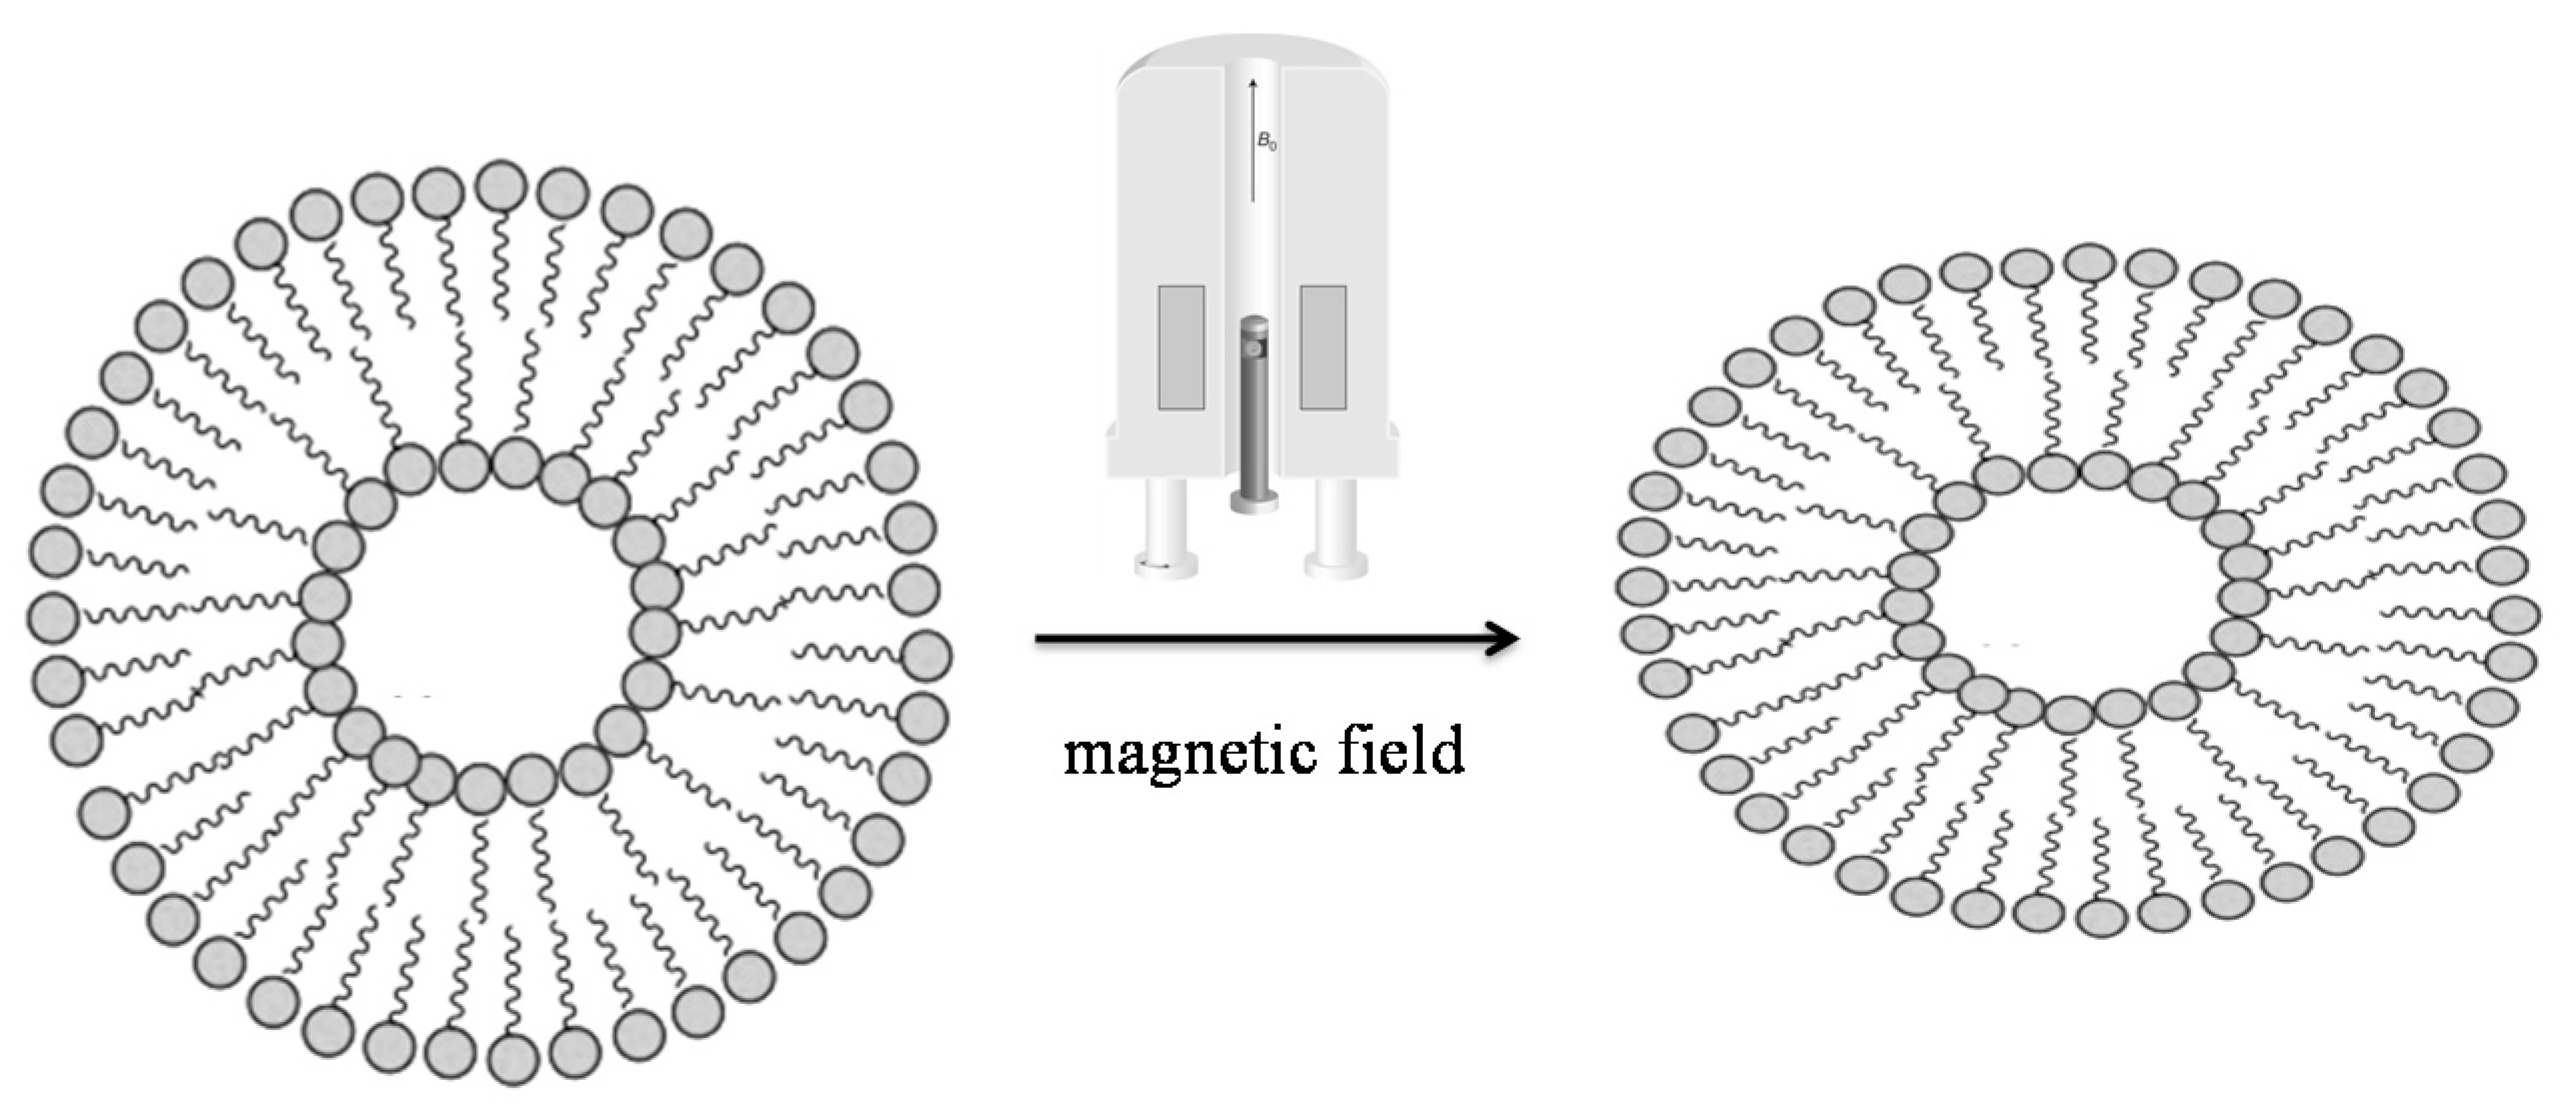
Thus, the bilayers’ orientation as a consequence of a strong magnetic field exposure was proved by the deviations from the powder patterns, at the lowest temperature. Therefore, the results led to understand that ‘soft’ catanionic vesicles tended to an oblate shape (soft nanoonions), as previously found for the low elastic constant measured for SDS/CTAB vesicles, which showed to be able to easily undergo a shape deformation (Figure 10).
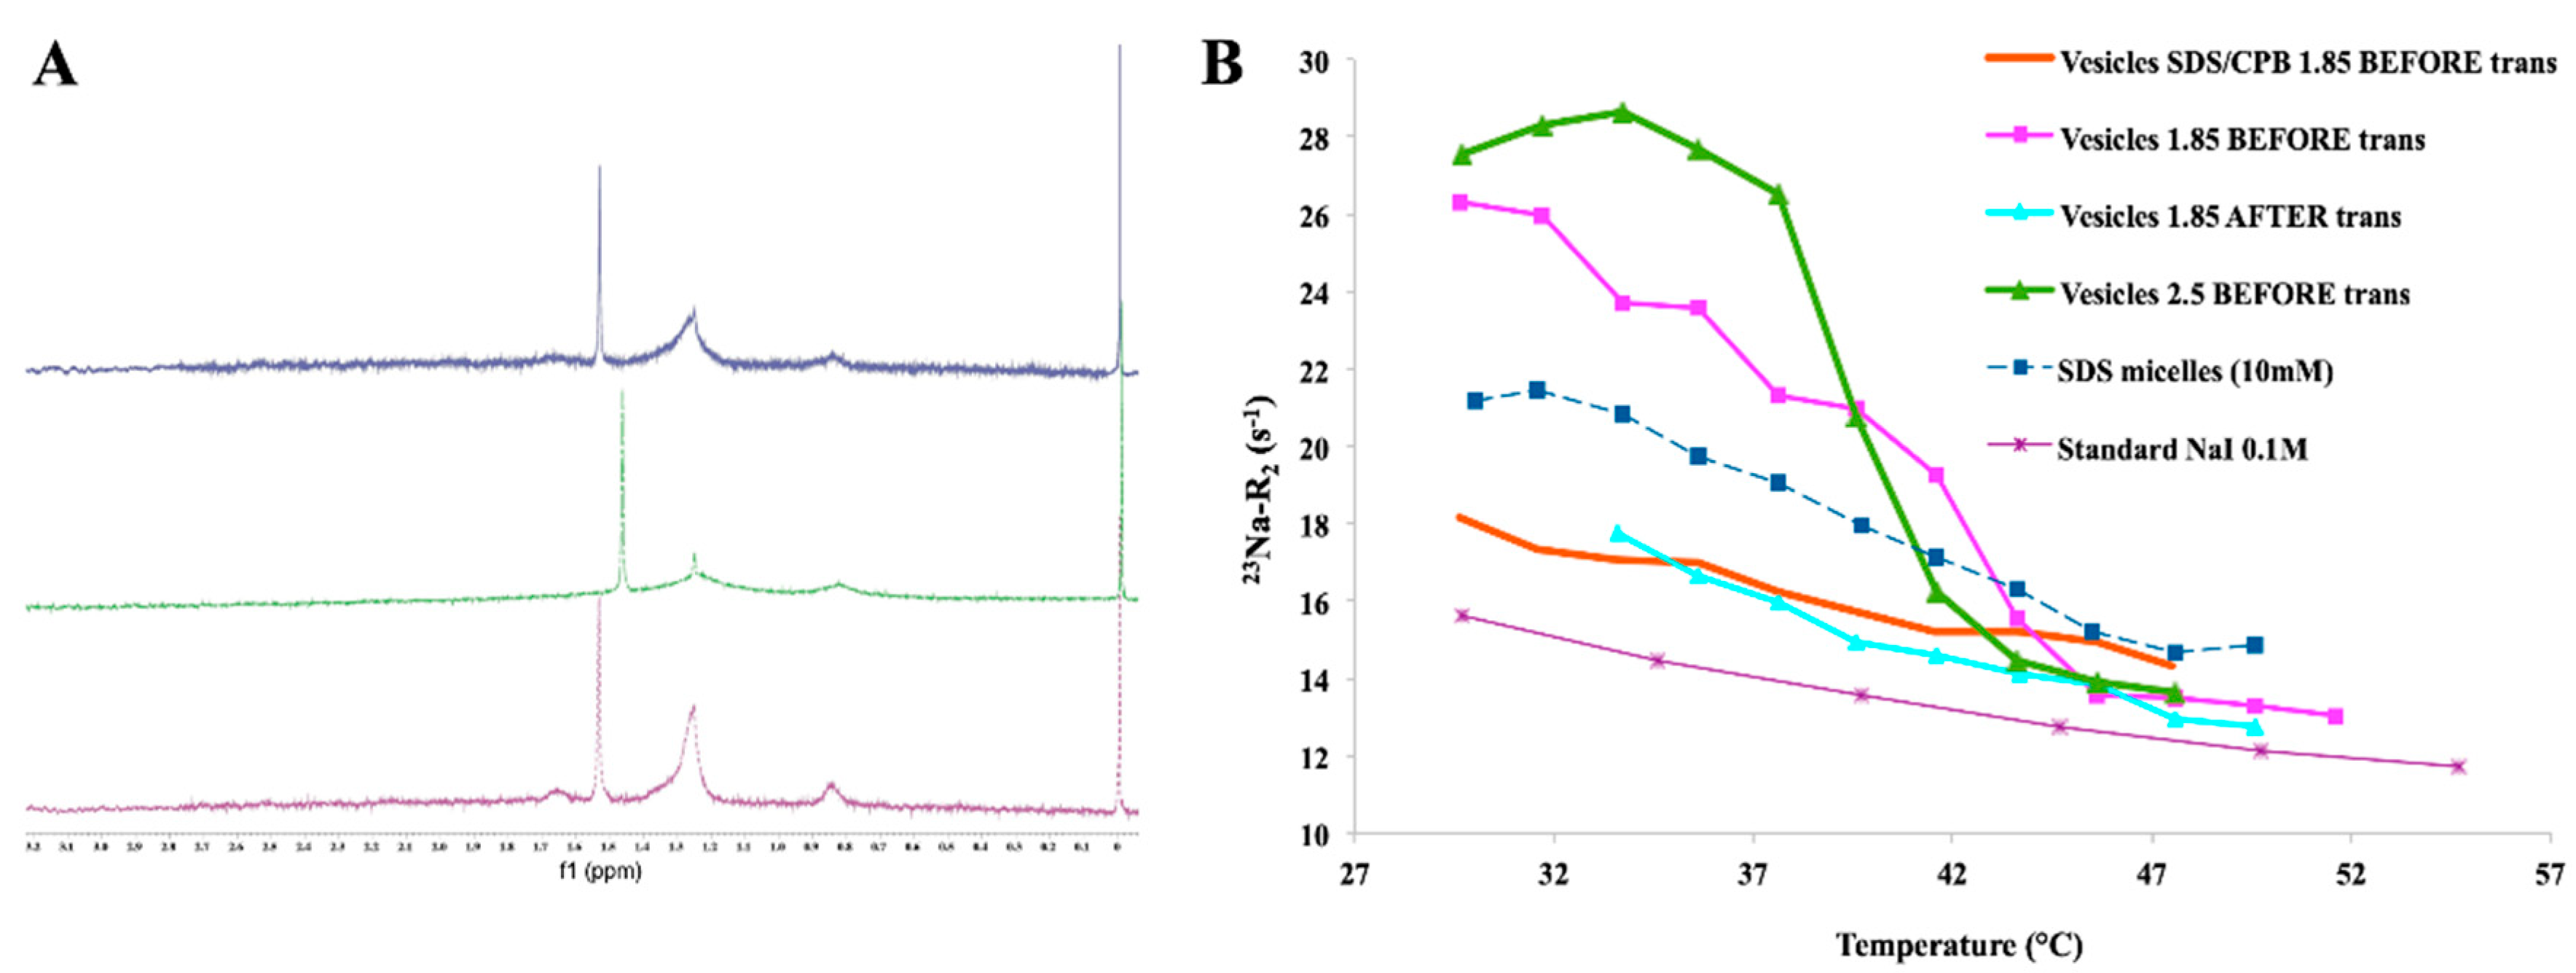
Comparing the low elastic constant found for SDS/CTAB vesicles with the above-mentioned deformation, it was verified that they perfectly matched [8]. Indeed, the Δν(2H) values decreased with the temperature increase, as well as a remarkable broadening of the spectral lines. These data confirmed an exchange between the surfactant molecules of the vesicles and the monomers in bulk. With reference to previous observation on the tails in the catanionic system myristic acid-CTA, related to higher alkyl chain motions with a heating ramp via 2H-NMR, the mentioned trends looked opposite [25]. As per the reference system of SDS/CTAB, the 1H-NMR spectra of the SDS/CPB system confirmed that the only detectable component was the free dodecyl sulfate portion, in the exchange between the vesicles and the bulk. The 23Na-R2 trends on SDS/CPB system were quite similar to the SDS/CTAB system after the thermal transition, according to Figure 11.
2.3. Final Systems Optimization
Many surfactant mixtures were studied. Nevertheless, the most promising model appeared to be the one composed of SDS (sodium dodecyl sulfate) and CTAB (cetyltrimethylammonium bromide). Further investigation of other systems revealed that, e.g., CPB (cetylpyridinium bromide) tended to promote also crystals formation.
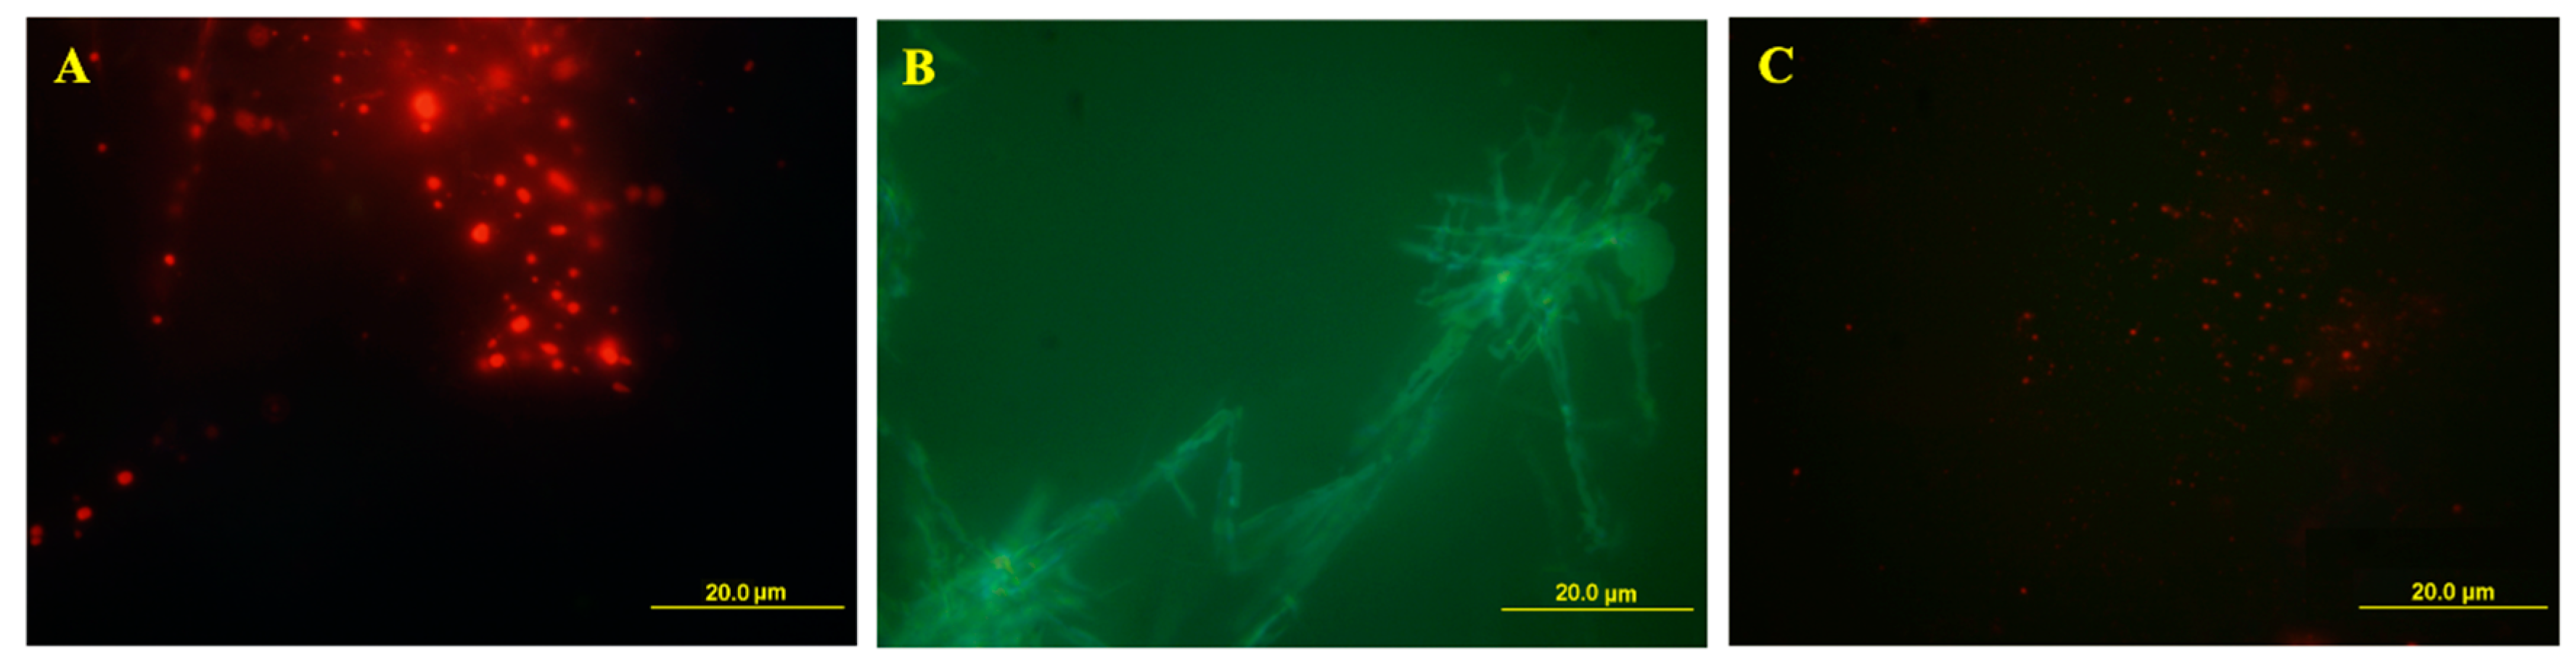
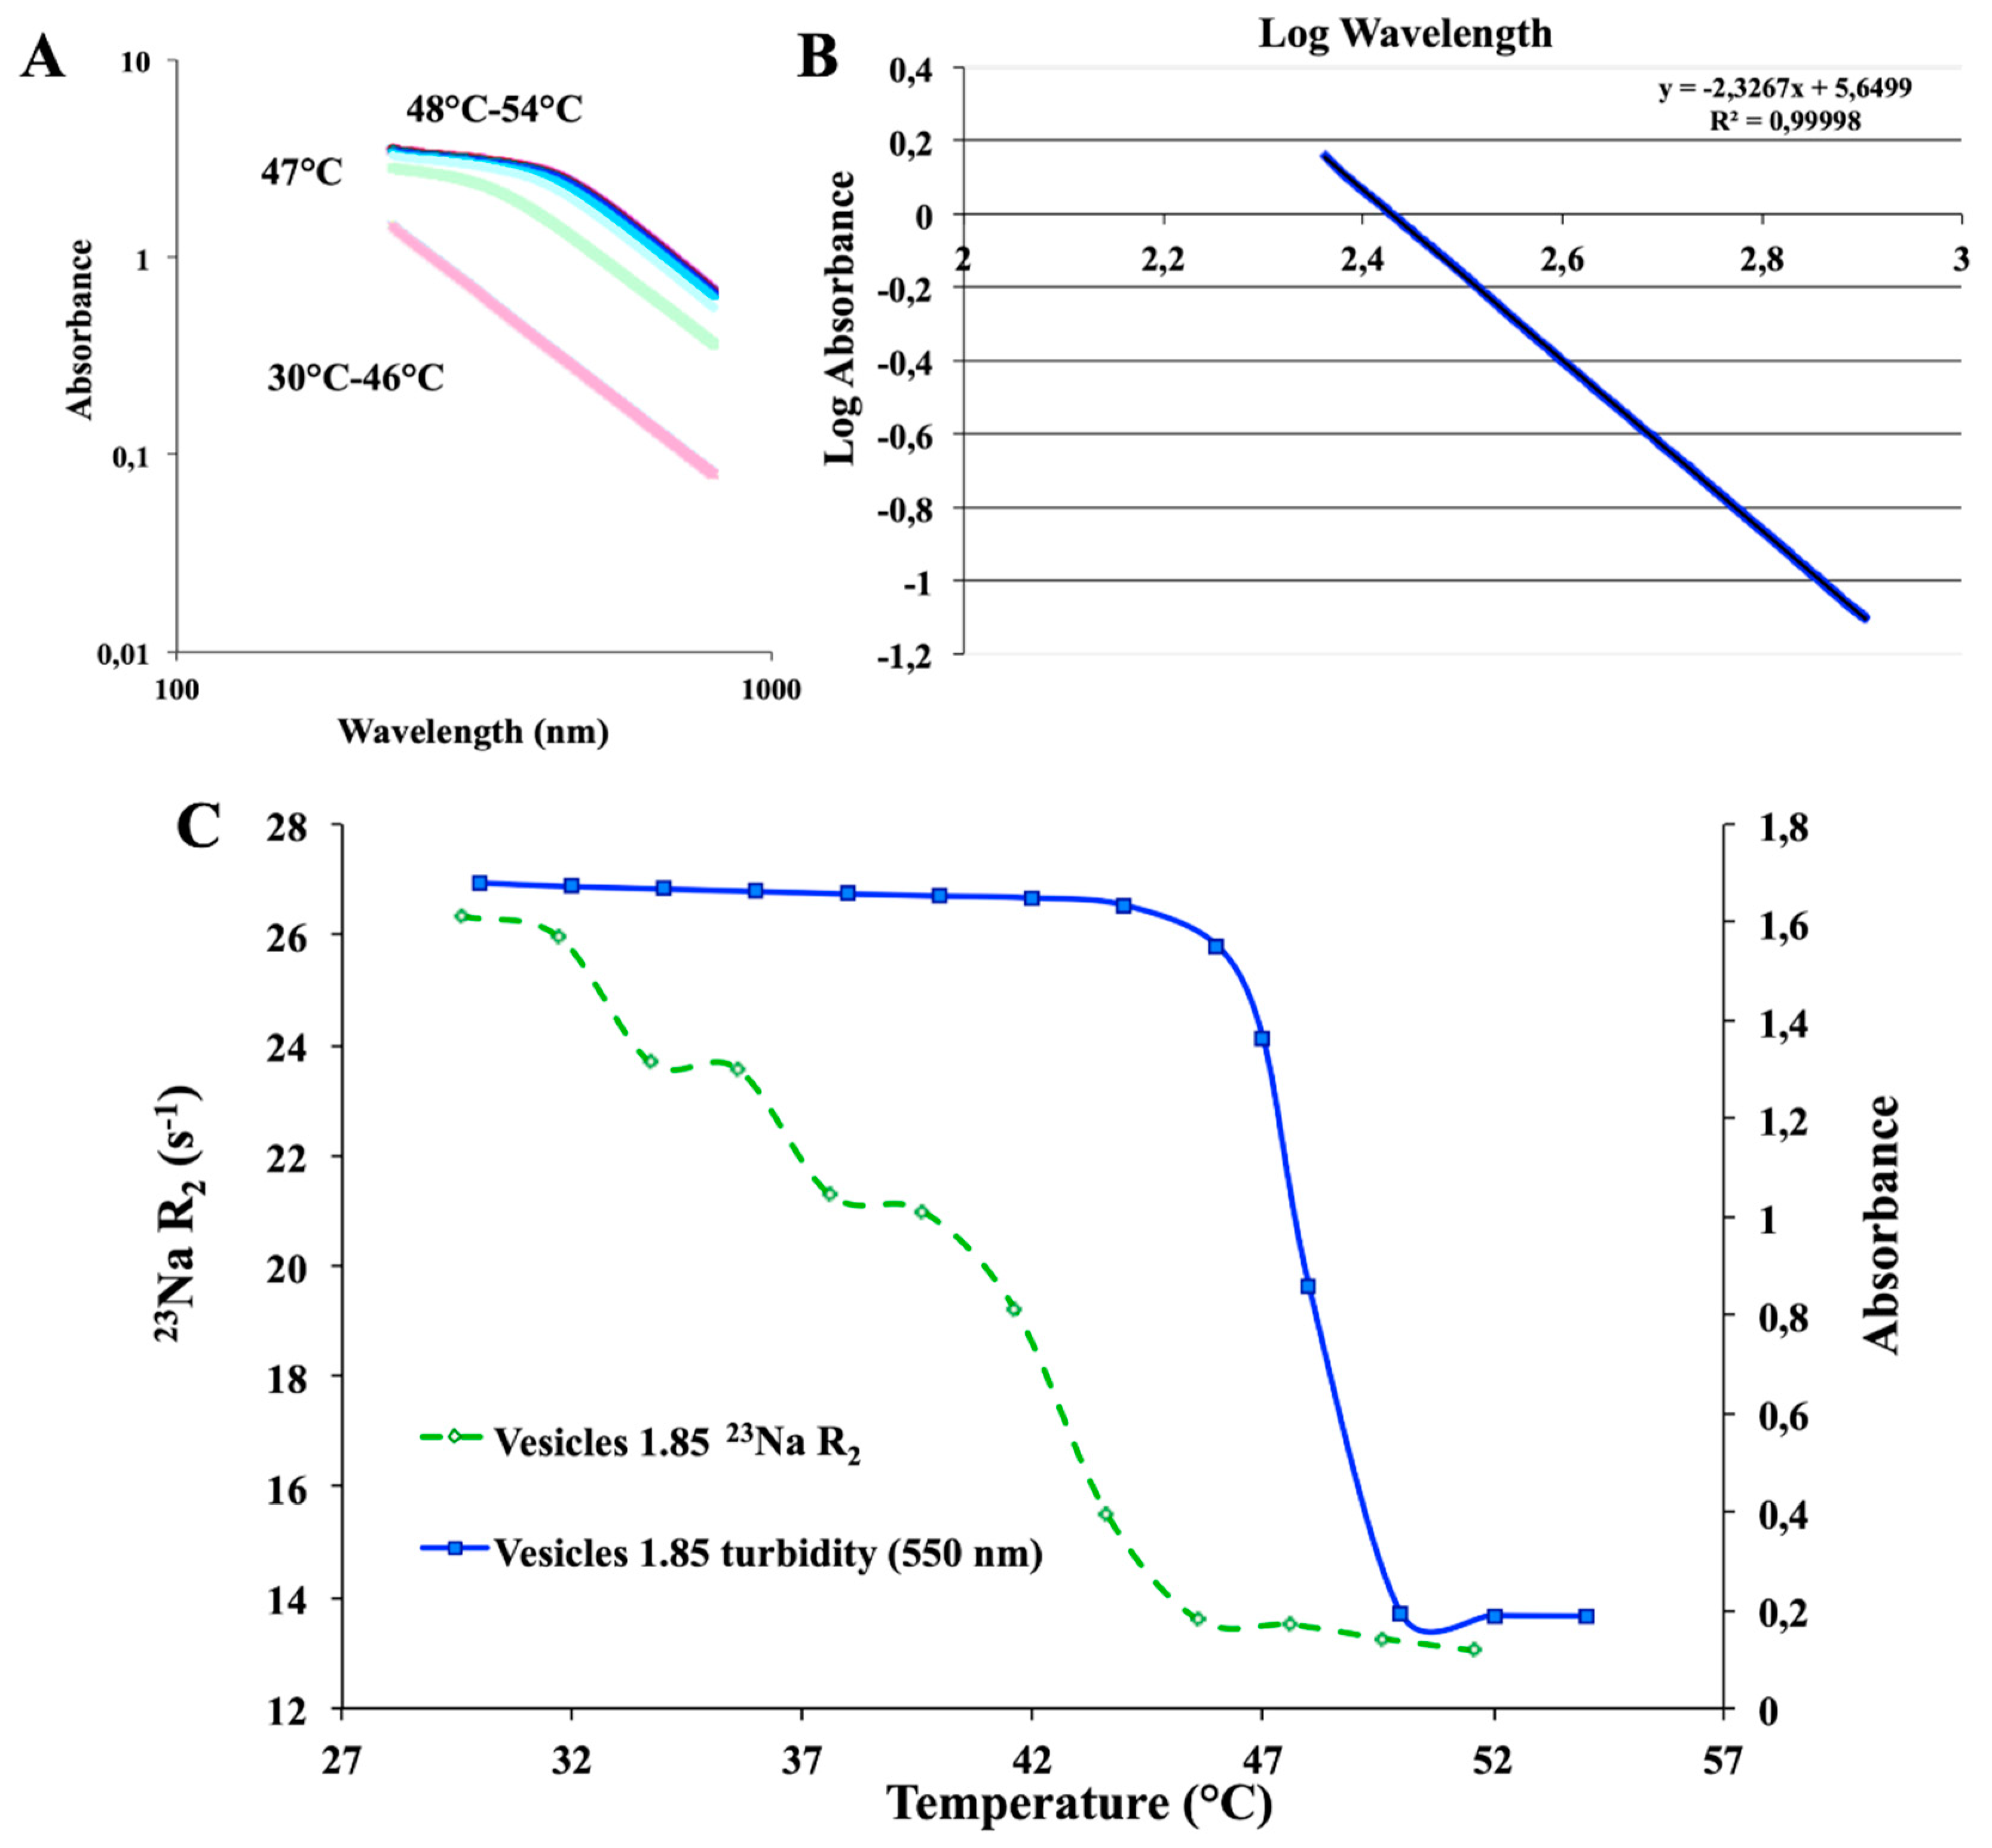
Cetylpyridinium bromide was employed as the cationic counterpart to test the stability of the vesicular aggregates. In fact, as it possesses the lowest critical micellar concentration (CMC) of the considered surfactants, it was hypothesized that it could decrease the stability of the vesicular aggregates [18]. The SDS/CPB samples contained giant vesicles (diameter size of the order of 1 µm, see Figure 12), extremely polydispersed, whereas SDS/CTAB aggregates exhibited a lower dispersity, as well as smaller aggregates dimensions. In addition, CTAB was finally selected as the best cationic partner to optimize the most performing vesicular system. It led to samples with lower polydispersity, higher stability, and the best aggregates diameter [26]. Moreover, UV-Vis analyses were carried out (Figure 13) in the temperature range of 30 °C–54 °C, every 2 °C of the heating ramp, to completely characterize the system. This analysis revealed several interesting findings: (1) in a range of around λ ≈ 500–550 nm, “turbidity” was detected, (2) by plotting the obtained results on a log/log graph, a −2.3 slope was found, which correlated with a Mie scattering. This finding perfectly fitted with previous DLS dimensions referred to in the literature, which reports a particle size of approx. 500–550 nm [8]. Furthermore, all spectroscopy techniques (NMR and UV-Vis, Figure 13) looked to be suitable and sensitive to study and optimize the system.
3. Materials and Methods
3.1. Sample Preparation
Sodium dodecyl sulfate (SDS) was obtained from BDH Chemicals Ltd., Poole, England, UK (purity grade 99.0%), while cetyltrimethylammonium bromide (CTAB) was purchased from Sigma-Aldrich GmbH, Sternheim, Germany (purity ≥ 96%), as well as cetylpyridinium bromide (CPB), cetylbromide, and sodium decyl sulfate (SdS). Acridine orange (AO) was obtained from Sigma-Aldrich GmbH, Sternheim, Germany (purity ≥ 98%).
CPB-d5 was prepared by direct condensation of pyridine-d5 and cetylbromide in a boiling water bath (6 h). The product was crystallized from ethylacetate [24].
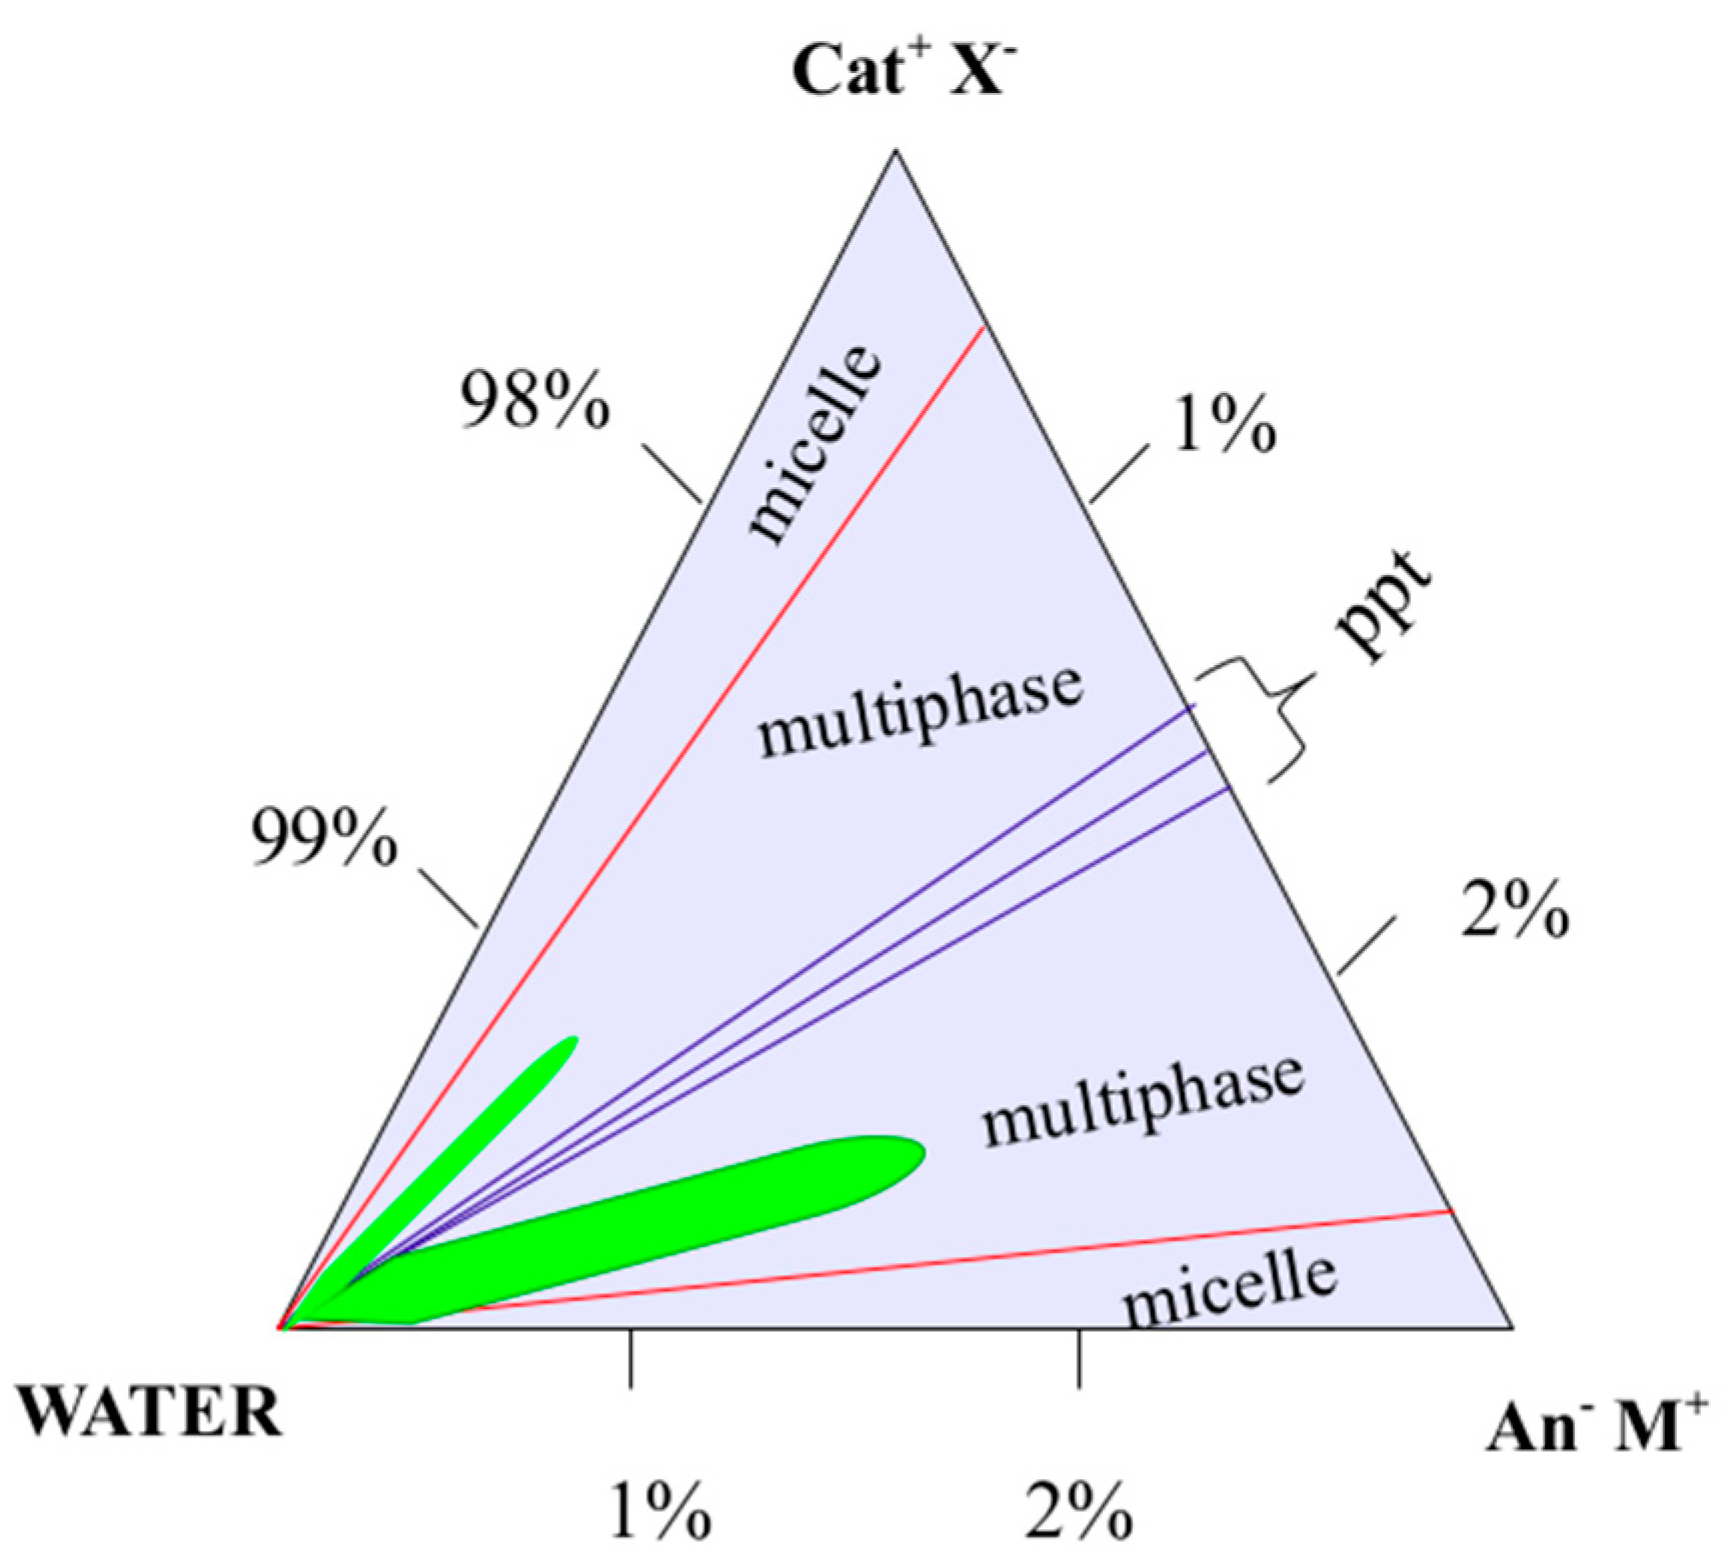
Aqueous solutions of CTAB, SDS, CPB, and SdS were prepared and subsequently mixed to obtain vesicular solutions. Different molar ratios (R) were employed, at a constant CTOT = 6 mM (i.e., about 0.2 wt%), according to the phase diagram below (Figure 14). Vesicles were obtained by mixing the surfactant aqueous solutions at the molar ratio R, as per Equation (1), at 20 °C.
3.2. Multinuclear NMR Experiments
NMR measurements were carried out on a Jeol Eclipse 400 NMR spectrometer (9.4 T), equipped with a Jeol NM-EVTS3 variable temperature unit (JEOL, Welwyn Garden City, UK), operating at 400 MHz for proton, 105.75 MHz for 23Na, 61.37 MHz for 2H, and 28.88 MHz for 14N. The measurements were carried out without field frequency lock, except in the case of the 1H spectra acquired with a lock on the signal of CDCl3 contained in a coaxial tube. The 23Na-R2 values (transverse relaxation rate, R2 = 1/T2) were measured by Hahn Echo [23].
3.3. PGSTE Measurements
The 1H NMR measurements were carried out on a Varian 500 MHz NMR spectrometer (11.74 T) operating at 500 MHz for 1H, equipped with a model L650 Highland Technology pulsed field gradient (PFA) amplifier (10 A) and a standard 5 mm indirect detection, PFG probe (Varian, Inc. Palo Alto, CA, USA). The lock was made on CDCl3 in a coaxial tube, containing tetramethylsilane (TMS) as 1H chemical shift reference. A one-shot sequence was employed for diffusion measurements [12,27], with 20 different z-gradient strengths, Gz, between 0.02 and 0.54 T/m, a pulsed gradient duration, δ, of 2 ms, and at different diffusion intervals (Δ). At each gradient strength, 64 transients were accumulated, employing a spectral width of 11 ppm over 16K data points. The solvent suppression was accomplished by presaturation. The gradients were calibrated on the value of D = 1.90·10−9 m2s−1 for 1H in D2O (99.9%) at 25 °C [28].
The values of the self-diffusion coefficient, D, were obtained by Tanner equation fitting to experimental data [29].
where E and E0 are the signal intensities in the presence and absence of Gz, respectively, D is the diffusion coefficient, γ is the nuclear gyromagnetic ratio 26.75 × 10⁷ rad s−1 T−1 for 1H nucleus, δ is the gradient pulse width, G is the gradient amplitude, (Δ-δ/3) correspond to the diffusion time corrected for the effects of finite gradient pulse.
PGSTE NMR spectra were processed using MestRenova, and the self-diffusion coefficients were determined by linear regression with Microsoft Excel.
3.4. UV-Vis
Spectral and absorbance measurements were carried out by using Shimadzu UV/Vis spectrophotometer model UV-2450 (Shimadzu, Tokyo, Japan), equipped with a Peltier temperature control unit; 1.0 cm path length matched quartz cells were used for the entire experimental work.
3.5. Polarized Light Microscopy
A Leitz Pol-Orthoplan microscope (Leitz GmbH, Wetzlar, Germany), equipped with differential interference contrast (DIC) lenses, was used. The main goal was to check the presence of crystals or anisotropic liquid crystals, such as lamellar phases, under polarized light. Samples were observed at room temperature, both immediately after preparation and several days later.
3.6. Confocal Microscopy
The integrity of catanionic vesicles was determined using acridine orange (AO) as the fluorescent probe. Samples were stained for 10 min with AO (0.3 mg/mL) and covered from sunlight. Immediately after, samples were examined using an Olympus microscope (Olympus, Tokyo, Japan), equipped with BX51M, a mercury UV-lamp (1000 W Ushio Olympus), with a set of filters of the type MNIBA3 (470 nm excitation and 505 nm dichromatic mirror). Subsequently, images were digitized through a video camera (Olympus DP70 digital camera) and analyzed with a raw image (Olympus DP Controller 2.1.1.176, Olympus DP Manager 2.1.1.158). All observations were made at 25 °C.
4. Conclusions
Several microscopic and spectroscopic techniques proved to be appropriate to characterize amphiphilic mixture systems. The heating ramp demonstrated to foster a remarkable Na+ dissociation, as the counterion of the excess surfactant (SDS), before the critical transition temperature [8]. Moreover, the bilayer of the pristine multilamellar vesicles exhibited an SDS dynamic release due to the temperature increase. When samples returned to the room temperature, vesicles demonstrated to be unilamellar, and a dynamic diffusion of dodecyl sulfate led to an increase of the vesicular aggregates curvature, boosting the 23Na transverse relaxation. Therefore, the above-mentioned curvature change was considered to be responsible for the stability at the high-temperature of the monolayer vesicular aggregates. Accordingly, an SDS/CTAB ratio raise occurred following the thermal ramp, as confirmed by 1H-NMR spectra. The multi-to-unilamellar transition was driven by a strong repulsion between the vesicular bilayers due to their surface net charge and the steric interactions.
In the optimization process, the application of CPB (cetylpyridinium bromide) as the cationic counterpart led to generate crystals; thus, it reduced the stability of vesicular aggregates. For what concerns the anionic partner, sodium decyl sulfate (SdS) proved to possess a very short alkyl chain, leading to excessive mobility of the monomers of the vesicular aggregates, as inferred by 2H-NMR in SdS/CBP samples, using CPB with the deuterated head group. As a confirmation of the observed phenomena, PGSTE experiments showed slower diffusion coefficients in vesicles after the thermal transition, as well as a slightly faster exchange between the vesicular aggregates and the bulk. Those findings endorsed a pseudo-phase irreversible thermal transition from multilamellar to unilamellar vesicles [5]. Hence, catanionic vesicles were optimized and revealed interesting temperature tunable changes both in their lamellar composition and curvature, depending on their composition and molar ratio.
Therefore, this kind of nanoreservoirs and their study by means of multinuclear NMR techniques propose an elegant approach to boost the ability of understanding and optimizing the encapsulation of a very small amount of bioactive molecules. Moreover, the present study provided for an in-depth awareness of all advantages that the optimized nanoreservoirs can broaden the applications’ plethora, such as the drug delivery sector. The catanionic vesicles preparation is quick and simple, the raw materials required are not expensive, and the nanoreservoirs can be used either on their multilamellar or their unilamellar form, thanks to their irreversible thermal transition. Furthermore, their soft nature allows them to include both hydrophilic and hydrophobic bioactive molecules.
Author Contributions
Conceptualization, G.M. and F.A; Data curation, G.M. and F.E.A.; Formal analysis, G.M.; Funding acquisition, M.G. and F.A.; Investigation, G.M.; Methodology, G.M. and F.E.A.; Project administration, M.G.; Resources, F.E.A., M.G. and F.A.; Supervision, F.E.A., M.G. and F.A.; Validation, G.M., F.E.A., M.G. and F.A.; Writing—review & editing, G.M., F.E.A., M.G. and F.A. All authors have read and agreed to the published version of the manuscript.
Funding
Fondazione CRTrieste is gratefully acknowledged for the purchase of the Varian 500 NMR spectrometer, while the University of Trieste (FRA2009) and the Italian Ministry of Education (PRIN 2010-11 (20109PLMH2)) are gratefully acknowledged for financial support.
Acknowledgments
Sonia Fiuza is gratefully acknowledged for her proofreading of the manuscript.
Conflicts of Interest
The authors declare no conflict of interest.
References
- Kaler, E.W.; Murthy, A.K.; Rodriguez, B.E.; Zasadzinski, J.A. Spontaneous vesicle formation in aqueous mixtures of single-tailed surfactants. Science 1989, 245, 1371–1374. [Google Scholar] [CrossRef] [PubMed]
- Salkar, R.A.; Mukesh, D.; Samant, S.D.; Manohar, C. Mechanism of Micelle to Vesicle Transition in Cationic−Anionic Surfactant Mixtures. Langmuir 1998, 14, 3778–3782. [Google Scholar] [CrossRef]
- Jurašin, D.D.; Šegota, S.; Čadež, V.; Selmani, A.; Dutour Sikirć, M. Recent Advances in Catanionic Mixtures. Appl. Charact. Surfactants 2017, 33–73. [Google Scholar] [CrossRef] [Green Version]
- Bonincontro, A.; Falivene, M.; La Mesa, C.; Risuleo, G.; Ruiz-Pena, M. Dynamics of DNA Adsorption on and Release from SDS−DDAB Cat−Anionic Vesicles: A Multitechnique Study. Langmuir 2008, 24, 1973–1978. [Google Scholar] [CrossRef] [PubMed]
- Guida, V. Thermodynamics and kinetics of vesicles formation processes. Adv. Colloid Interface Sci. 2010, 161, 77–88. [Google Scholar] [CrossRef] [PubMed]
- Russo Krauss, I.; Imperatore, R.; De Santis, A.; Luchini, A.; Paduano, L.; D’Errico, G. Structure and dynamics of cetyltrimethylammonium chloride-sodium dodecylsulfate (CTAC-SDS) catanionic vesicles: High-value nano-vehicles from low-cost surfactants. J. Colloid Interface Sci. 2017, 501, 112–122. [Google Scholar] [CrossRef]
- Dhawan, V.V.; Nagarsenker, M.S. Catanionic systems in nanotherapeutics—Biophysical aspects and novel trends in drug delivery applications. J. Control Release 2017, 266, 331–345. [Google Scholar] [CrossRef] [PubMed]
- Andreozzi, P.; Funari, S.S.; La Mesa, C.; Mariani, P.; Ortore, M.G.; Sinibaldi, R.; Spinozzi, F. Multi- to Unilamellar Transitions in Catanionic Vesicles. J. Phys. Chem. B 2010, 114, 8056–8060. [Google Scholar] [CrossRef] [Green Version]
- Whitesides, G.M.; Grzybowski, B. Self-Assembly at All Scales. Science 2002, 295, 2418–2421. [Google Scholar] [CrossRef] [Green Version]
- Antunes, F.E.; Marques, E.F.; Miguel, M.G.; Lindman, B. Polymer-Vesicle association. Adv. Colloid Interface Sci. 2009, 147–148, 18–35. [Google Scholar] [CrossRef]
- Mal, A.; Bag, S.; Ghosh, S.; Moulik, S.P. Physicochemistry of CTAB-SDS interacted catanionic micelle-vesicle forming system: An extended exploration. Colloid Surf. A Physicochem. Eng. Asp. 2018, 553, 633–644. [Google Scholar] [CrossRef]
- Jr Johnson, C.S. Diffusion ordered nuclear magnetic resonance spectroscopy: Principles and applications. Progr. Nucl. Magn. Reson. Spettrosc. 1999, 34, 203–256. [Google Scholar] [CrossRef]
- Shekar, S.C.; Tang, J.A.; Jerschow, A. Dynamics of I = 3/2Nuclei in Isotropic Slow Motion, Anisotropic and Partially Ordered Phases. Concepts Magn. Reson. 2010, 36, 362–387. [Google Scholar] [CrossRef]
- Furó, I. NMR spectroscopy of micelles and related systems. J. Mol. Liq. 2005, 117, 117–137. [Google Scholar] [CrossRef]
- Milcovich, G.; Asaro, F. Insights into Catanionic Vesicles Thermal Transition by NMR Spectroscopy. Prog. Colloid Polym. Sci. 2012, 139, 35–38. [Google Scholar]
- Quintela, P.A.; Reno, R.C.S.; Kaifer, A.E. Cryptand [2.2.2] Complexation of Anionic Surfactant Counterions. Drastic Decrease of the CMC of Sodium Dodecyl and Decyl Sulfates. J. Phys. Chem. 1987, 91, 3582–3585. [Google Scholar] [CrossRef]
- Cifuentes, A.; Bernal, J.L.; Diez-Masa, J.C. Determination of critical micelle concentration values using capillary electrophoresis instrumentation. Anal. Chem. 1997, 69, 4271–4274. [Google Scholar] [CrossRef]
- Battacharya, S.; Haldar, J. Microcalorimetric and Conductivity Studies with Micelles Prepared from Multi-Headed Pyridinium Surfactants. Langmuir 2005, 21, 5747–5751. [Google Scholar] [CrossRef]
- Rosen, M.J. Surfactants and Interfacial Phenomena, 3rd ed.; Wiley: New York, NY, USA, 2004. [Google Scholar]
- Asaro, F.; Liguori, L.; Pellizer, G. A multinuclear NMR approach to the study of the lyotropic system CTAB-D2O. Croat. Chem. Acta 2001, 74, 877–885. [Google Scholar]
- Boroske, E.; Helfrich, W. Magnetic anisotropy of egg lecithin membranes. Biophys. J. 1978, 24, 863–868. [Google Scholar] [CrossRef] [Green Version]
- Loudet, C.; Diller, A.; Grélard, A.; Oda, R.; Dufourc, E.J. Biphenyl phosphatidylcholine: A promoter of liposome deformation and bicelle collective orientation by magnetic fields. Prog. Lipid Res. 2010, 49, 289–297. [Google Scholar] [CrossRef] [PubMed]
- Woessner, D.E. NMR relaxation of spin-3/2 nuclei: Effects of structure, order, and dynamics in aqueous heterogeneous systems. Concepts Magn. Reson. 2001, 13, 294–325. [Google Scholar] [CrossRef]
- Asaro, F.; Pellizer, G.; Pergolese, B. 2H and 14N Nmr of Cetylpyridinium Bromide Lyotropic and Thermotropic Liquid Crystals. Mol. Cryst. Liq. Cryst. 2003, 394, 127–139. [Google Scholar] [CrossRef]
- Michina, Y.; Carrière, D.; Charpentier, T.; Brito, R.; Marques, E.F.; Douliez, J.-P.; Zemb, T. Absence of Lateral Phase Segregation in Fatty Acid-Based Catanionic Mixtures. J. Phys. Chem. B 2010, 114, 1932–1938. [Google Scholar] [CrossRef]
- Prabha, S.; Zhou, W.-Z.; Panyam, J.; Labhasetwar, V. Size-Dependency of nanoparticle-mediated gene transfection: Studies with fractionated nanoparticles. Int. J. Pharm. 2002, 244, 105–115. [Google Scholar] [CrossRef]
- Pelta, M.D.; Morris, G.A.; Stchendroff, M.J.; Hammond, S.J. A one-shot sequence for high-resolution diffusion-ordered spectroscopy. Magn. Reson. Chem. 2002, 40, S147–S152. [Google Scholar] [CrossRef]
- Antalek, B. Using pulsed gradient spin echo NMR for chemical mixture analysis: How to obtain optimum results. Concepts Magn. Reson. Part A 2002, 14, 225–258. [Google Scholar] [CrossRef]
- Tanner, J.E. Use of the Stimulated Echo in NMR Diffusion Studies. J. Chem. Phys. 1970, 52, 2523–2526. [Google Scholar] [CrossRef]
Figure 1.
Multi-to-unilamellar vesicles thermal transition. (A) 2H-NMR spectrum of SDS/CTAB aqueous solution and (B) decrease of turbidity with heating.
Figure 1.
Multi-to-unilamellar vesicles thermal transition. (A) 2H-NMR spectrum of SDS/CTAB aqueous solution and (B) decrease of turbidity with heating.

Figure 2.
14N-NMR spectrum of SDS/CTAB aqueous solution (R = 1.5 sample).

Figure 3.
23Na-R2 values for 1.85 SDS/CTAB vesicular solutions (before and after thermal transition), compared with a standard reference solution of NaI (free Na+) and a micellar solution of SDS.
Figure 3.
23Na-R2 values for 1.85 SDS/CTAB vesicular solutions (before and after thermal transition), compared with a standard reference solution of NaI (free Na+) and a micellar solution of SDS.

Figure 4.
1H-NMR spectra of an SDS/CTAB aqueous solution with integration. From bottom to top: 30 °C, 50 °C, 30 °C immediately after transition, and 30 °C two weeks after the transition. Peaks of water included in CDCl3 are marked with *.
Figure 4.
1H-NMR spectra of an SDS/CTAB aqueous solution with integration. From bottom to top: 30 °C, 50 °C, 30 °C immediately after transition, and 30 °C two weeks after the transition. Peaks of water included in CDCl3 are marked with *.

Figure 5.
PGSTE-NMR spectra of 1.85 molar ratio SDS/CTAB solutions, collected at 30 °C, with Δ = 60 ms (left) and Δ = 10 ms (right). PGSTE, pulsed gradient stimulated echo.
Figure 5.
PGSTE-NMR spectra of 1.85 molar ratio SDS/CTAB solutions, collected at 30 °C, with Δ = 60 ms (left) and Δ = 10 ms (right). PGSTE, pulsed gradient stimulated echo.

Figure 6.
Plot of the echo decays at different diffusion intervals at 30 °C (Δ = 10 ms, Δ = 60 ms) for (A) an SDS monomeric solution, (B) SDS micellar solution (10 mM), and (C) vesicles at R = 1.85.
Figure 6.
Plot of the echo decays at different diffusion intervals at 30 °C (Δ = 10 ms, Δ = 60 ms) for (A) an SDS monomeric solution, (B) SDS micellar solution (10 mM), and (C) vesicles at R = 1.85.

Figure 7.
The plot of the echo decays at different diffusion intervals (Δ = 10 ms, Δ = 60 ms) for vesicles at R = 1.85, following the heating ramp (30 °C, 35 °C, 40 °C, and 30 °C after the transition).
Figure 7.
The plot of the echo decays at different diffusion intervals (Δ = 10 ms, Δ = 60 ms) for vesicles at R = 1.85, following the heating ramp (30 °C, 35 °C, 40 °C, and 30 °C after the transition).

Figure 8.
1H-NMR integrals comparison of aqueous solution related to (bottom to top) monomeric SDS, micellar SDS, and SDS/CTAB (R = 1.85) at 30 °C. Integral values were referred to as the water included in CDCl3.
Figure 8.
1H-NMR integrals comparison of aqueous solution related to (bottom to top) monomeric SDS, micellar SDS, and SDS/CTAB (R = 1.85) at 30 °C. Integral values were referred to as the water included in CDCl3.

Figure 9.
Clockwise, from left bottom to right. CPB molecular structure; pyridinium head group numbering and related axes for order parameters; 2H-NMR integrals comparison of SdS/CPB related to (bottom to top) 30 °C, 40 °C, 46 °C, and 65 °C. Signals corresponded to the fully deuterated head group of CPB. CPB, cetylpyridinium bromide; SdS, sodium decyl sulfate.

Figure 10.
Representative scheme of the SdS/CPB vesicles deformation in the magnetic field.

Figure 11.
(A) 1H-NMR integrals of an SDS/CPB aqueous solution, bottom to top: 30 °C, 50 °C, 30 °C after transition; (B) 23Na-R2 values for 1.85 SDS/CTAB vesicular solution (before and after thermal transition), 1.85 SDS/CPB vesicular solution (before thermal transition), compared with a reference solution of NaI (free Na+) and a micellar solution of SDS.

Figure 12.
Fluorescence micrographs. (A) SDS/CPB system 24 h after preparation (vesicles, R = 1.85); (B) 1 month after preparation (crystals); all coming from the same solution. (C) SDS/CTAB vesicles system (R = 1.85), 24 h after preparation.
Figure 12.
Fluorescence micrographs. (A) SDS/CPB system 24 h after preparation (vesicles, R = 1.85); (B) 1 month after preparation (crystals); all coming from the same solution. (C) SDS/CTAB vesicles system (R = 1.85), 24 h after preparation.

Figure 13.
(A) UV-Vis spectra of an SDS/CTAB vesicles solution from 30 °C to 54 °C; (B) log/log plot of absorbance vs. wavelength; (C) comparison of turbidity and 23Na transverse relaxation rates of SDS/CTAB system.
Figure 13.
(A) UV-Vis spectra of an SDS/CTAB vesicles solution from 30 °C to 54 °C; (B) log/log plot of absorbance vs. wavelength; (C) comparison of turbidity and 23Na transverse relaxation rates of SDS/CTAB system.

Figure 14.
Phase diagram for the catanionic mixtures (vesicles formation in the green areas). “Ppt” stands for precipitation areas, “An” refers to the anionic partner, whereas “Cat” is the cationic component.
Figure 14.
Phase diagram for the catanionic mixtures (vesicles formation in the green areas). “Ppt” stands for precipitation areas, “An” refers to the anionic partner, whereas “Cat” is the cationic component.


Table 1.
Critical micellar concentrations (CMC) of the employed surfactants.
| Component | CMC |
| Sodium decyl sulfate (SdS) | 33 mM [16] |
| Sodium dodecyl sulfate (SDS) | 8.3 mM [17] |
| Cetyltrimethylammonium bromide (CTAB) | 0.93 mM [17] |
| Cetylpyridinium bromide (CPB) | 0.33 mM [18] |
| Component | CMC |
| Sodium decyl sulfate (SdS) | 33 mM [16] |
| Sodium dodecyl sulfate (SDS) | 8.3 mM [17] |
| Cetyltrimethylammonium bromide (CTAB) | 0.93 mM [17] |
| Cetylpyridinium bromide (CPB) | 0.33 mM [18] |
© 2020 by the authors. Licensee MDPI, Basel, Switzerland. This article is an open access article distributed under the terms and conditions of the Creative Commons Attribution (CC BY) license (http://creativecommons.org/licenses/by/4.0/).
Share and Cite
MDPI and ACS Style
Milcovich, G.; Antunes, F.E.; Grassi, M.; Asaro, F. Soft Nanoonions: A Dynamic Overview onto Catanionic Vesicles Temperature-Driven Transition. Int. J. Mol. Sci. 2020, 21, 6804. https://doi.org/10.3390/ijms21186804
AMA Style
Milcovich G, Antunes FE, Grassi M, Asaro F. Soft Nanoonions: A Dynamic Overview onto Catanionic Vesicles Temperature-Driven Transition. International Journal of Molecular Sciences. 2020; 21(18):6804. https://doi.org/10.3390/ijms21186804
Chicago/Turabian StyleMilcovich, Gesmi, Filipe E. Antunes, Mario Grassi, and Fioretta Asaro. 2020. "Soft Nanoonions: A Dynamic Overview onto Catanionic Vesicles Temperature-Driven Transition" International Journal of Molecular Sciences 21, no. 18: 6804. https://doi.org/10.3390/ijms21186804
Note that from the first issue of 2016, this journal uses article numbers instead of page numbers. See further details here.