Cholestasis Differentially Affects Liver Connexins

 , , , and
Abstract
:
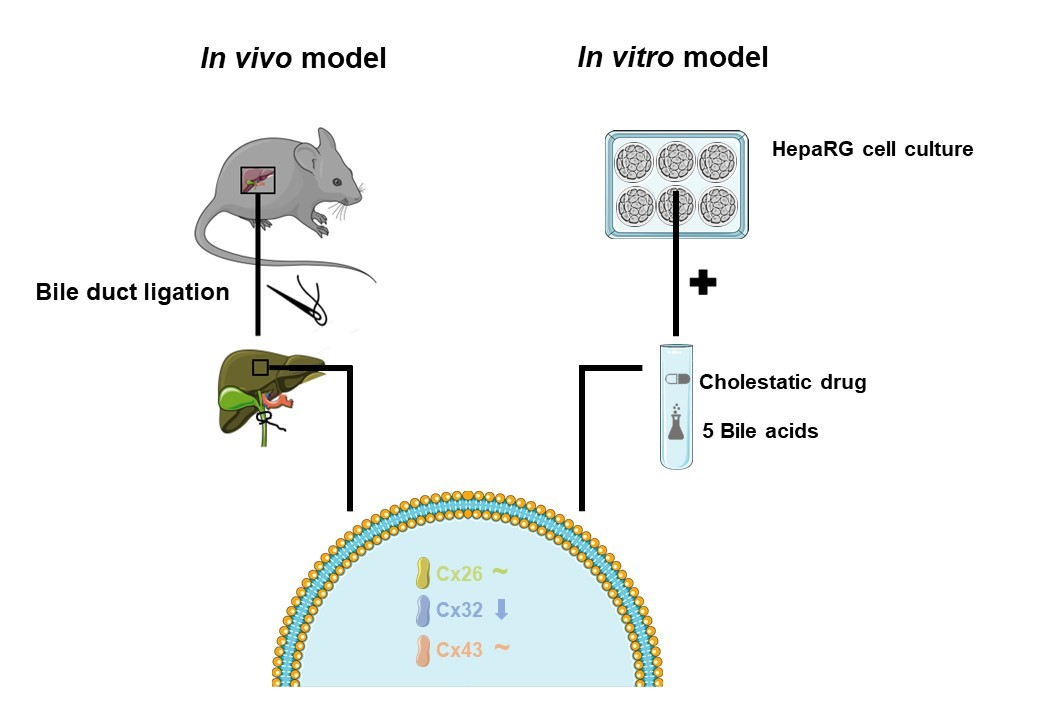
1. Introduction
2. Results
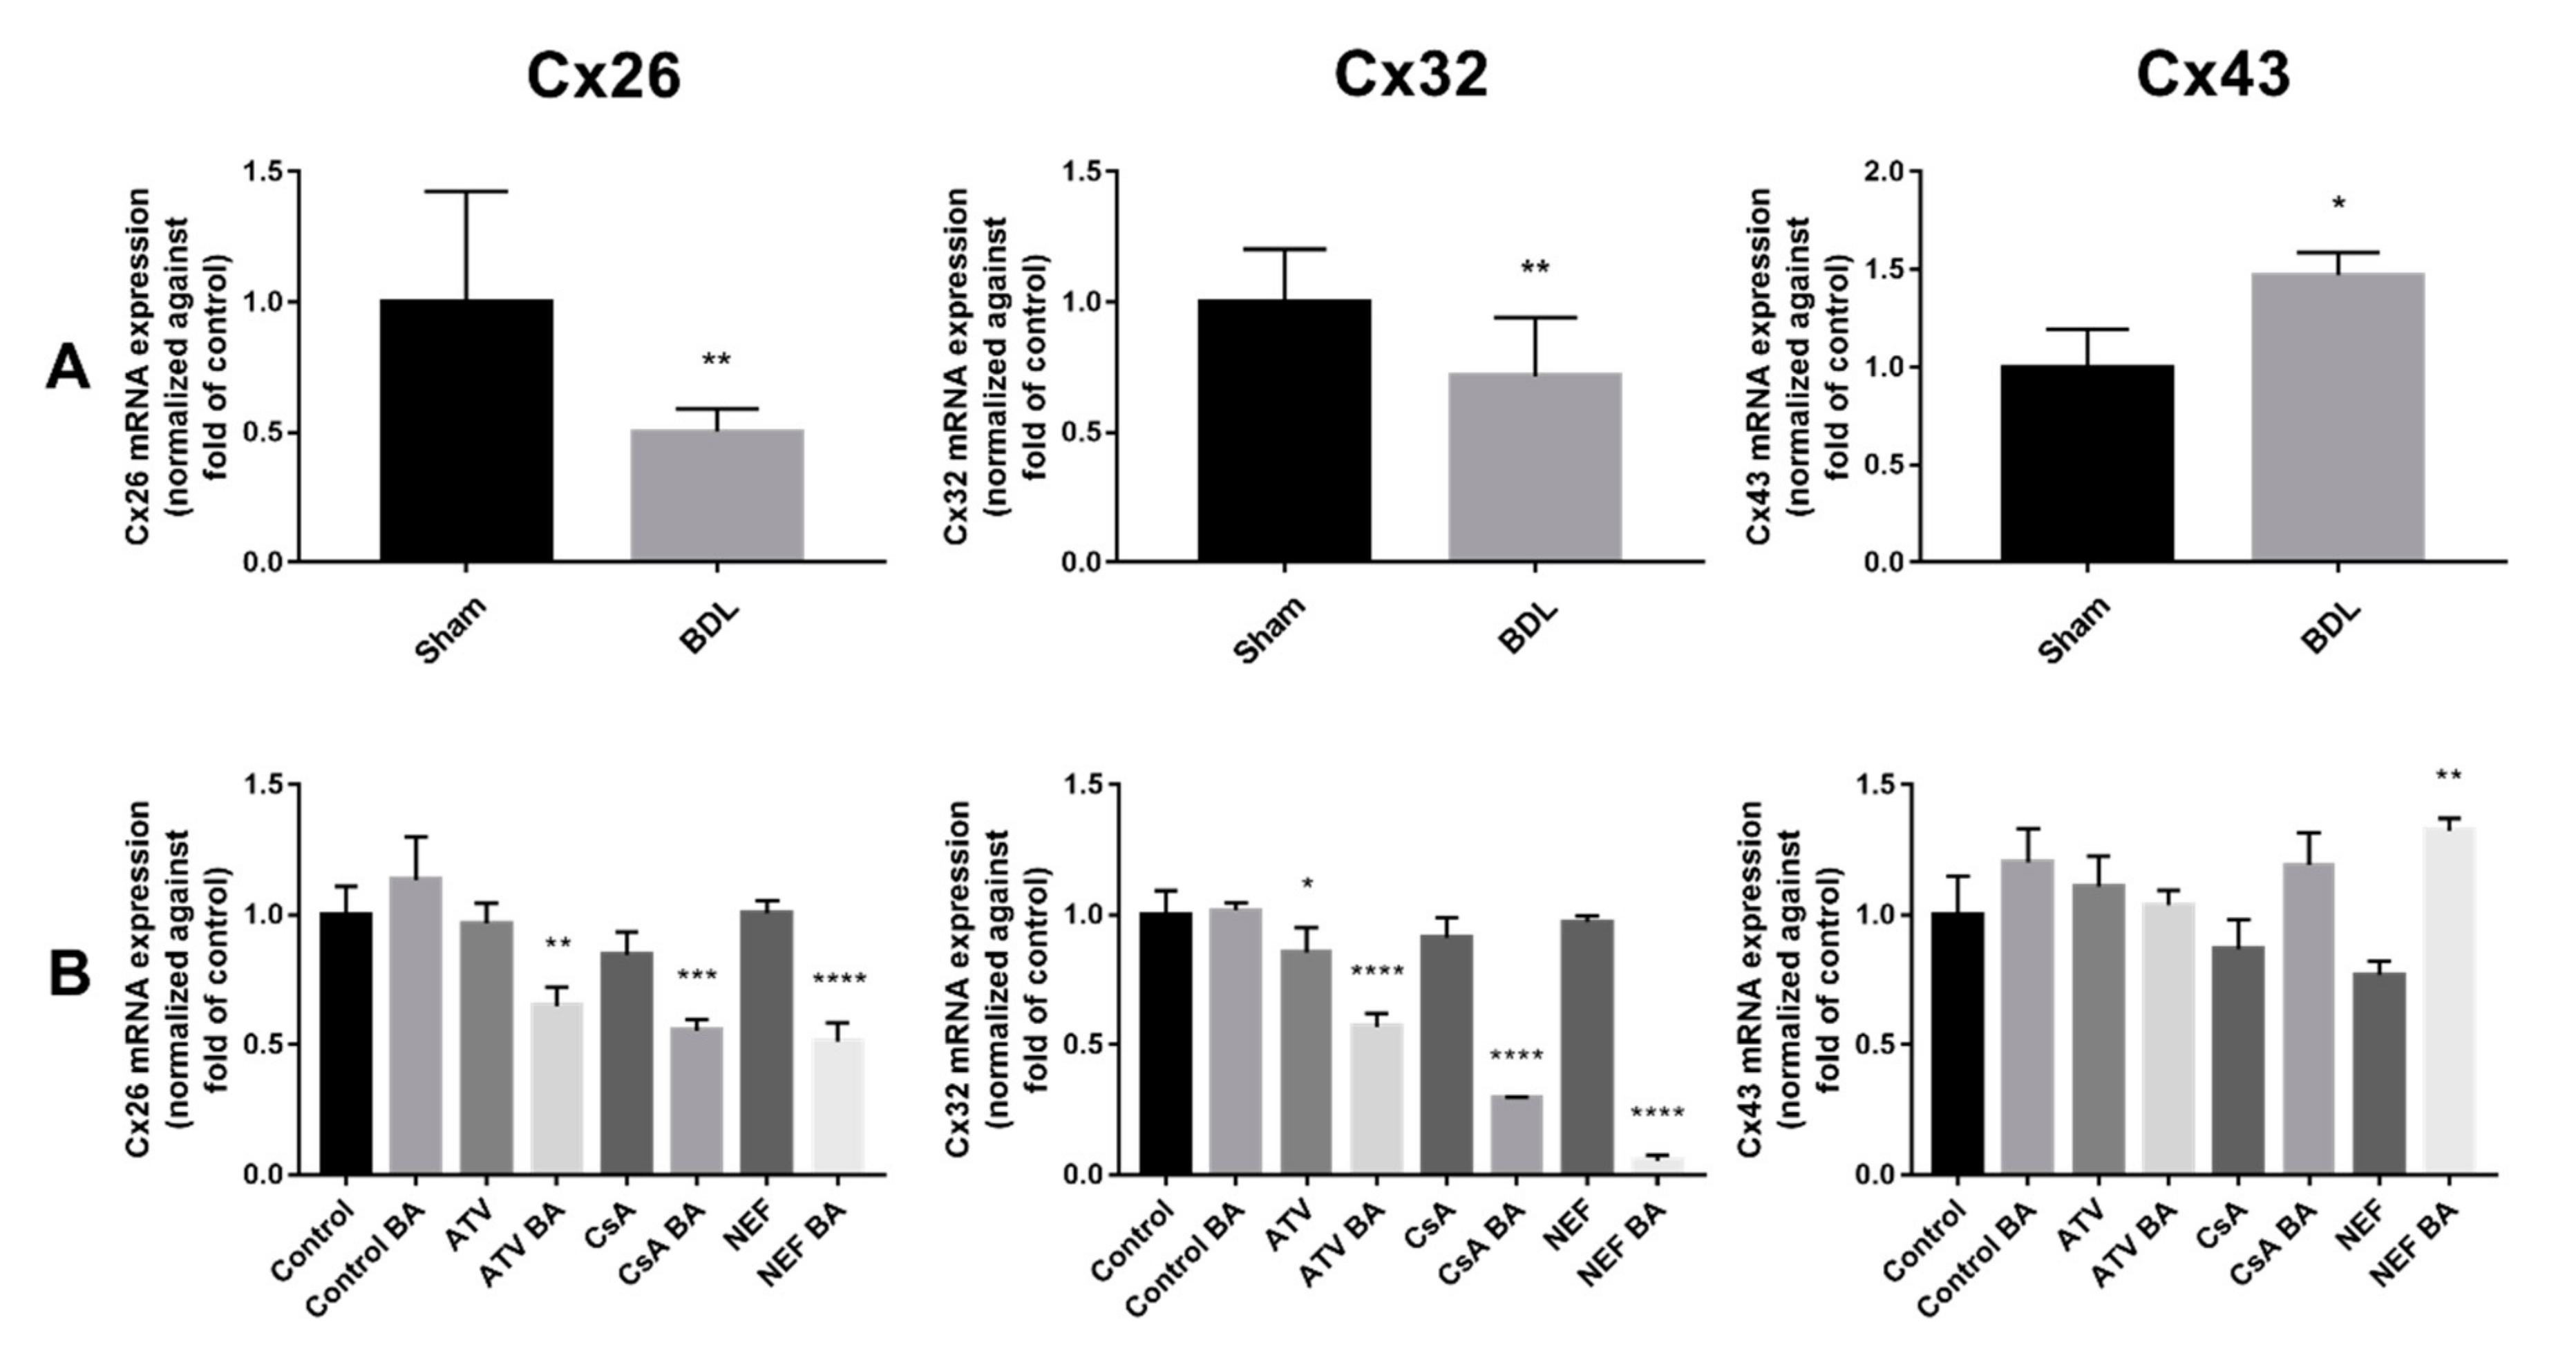
2.1. Effects of Cholestasis on Hepatic Connexin mRNA Expression
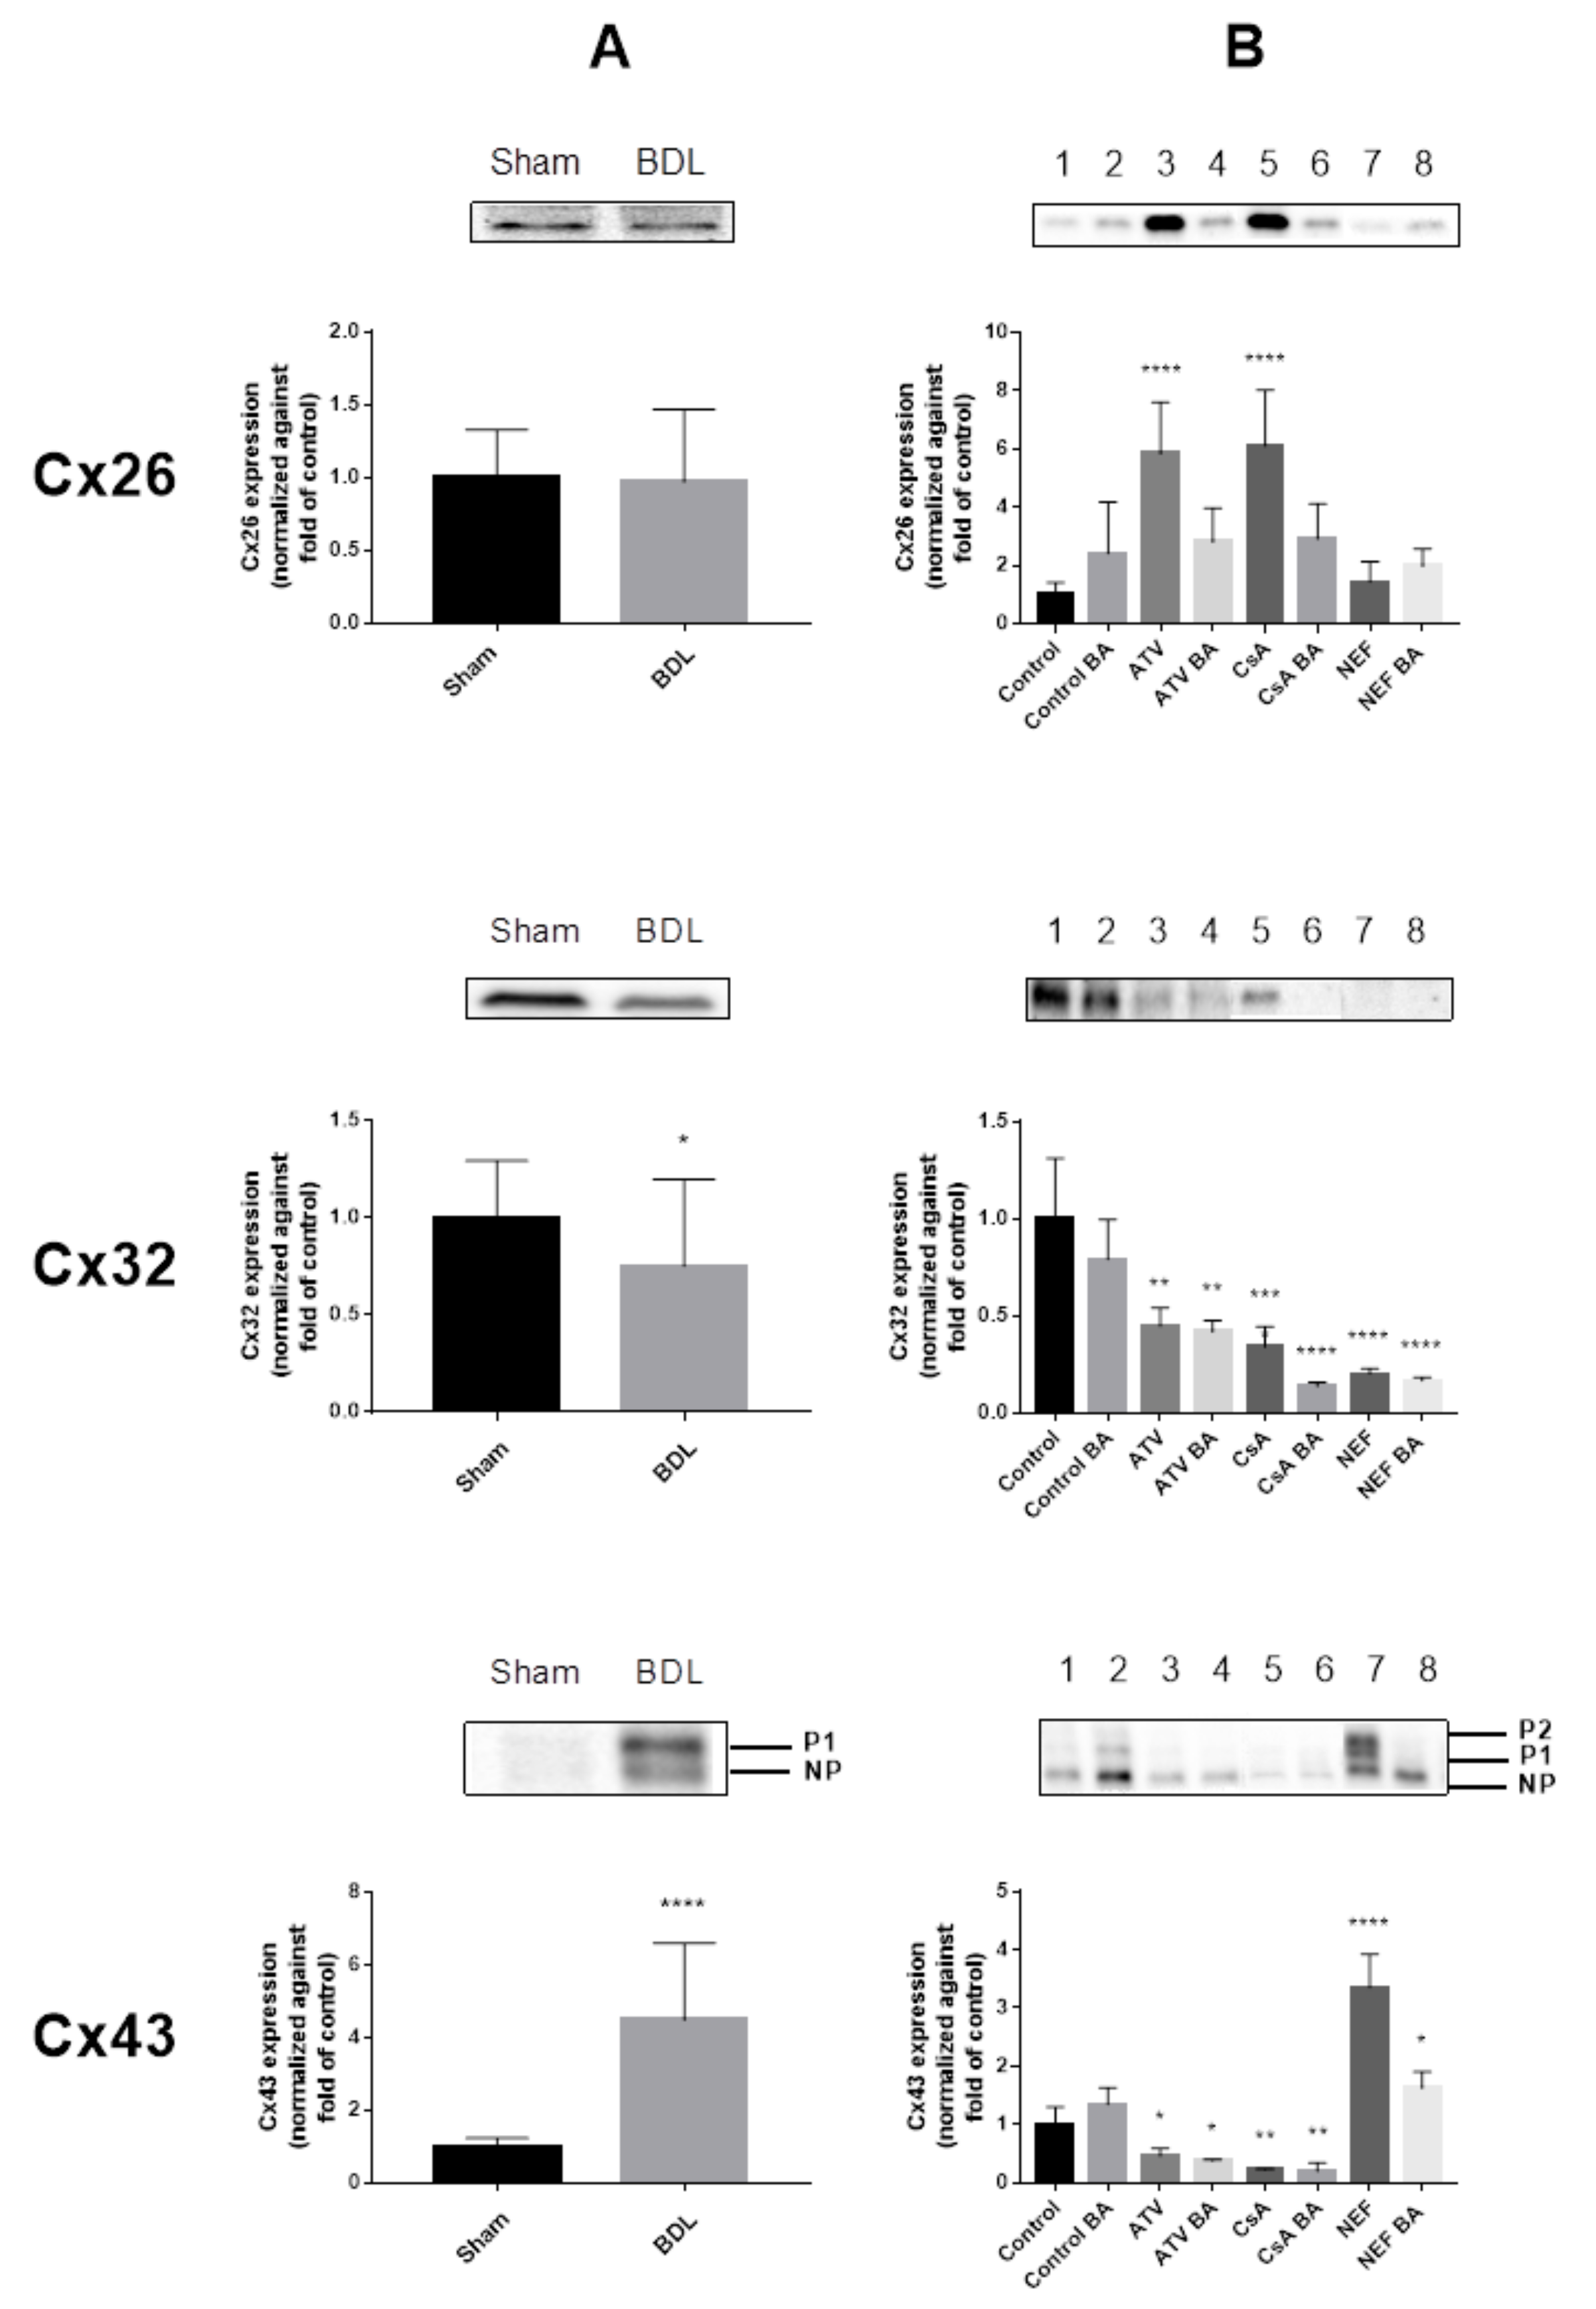
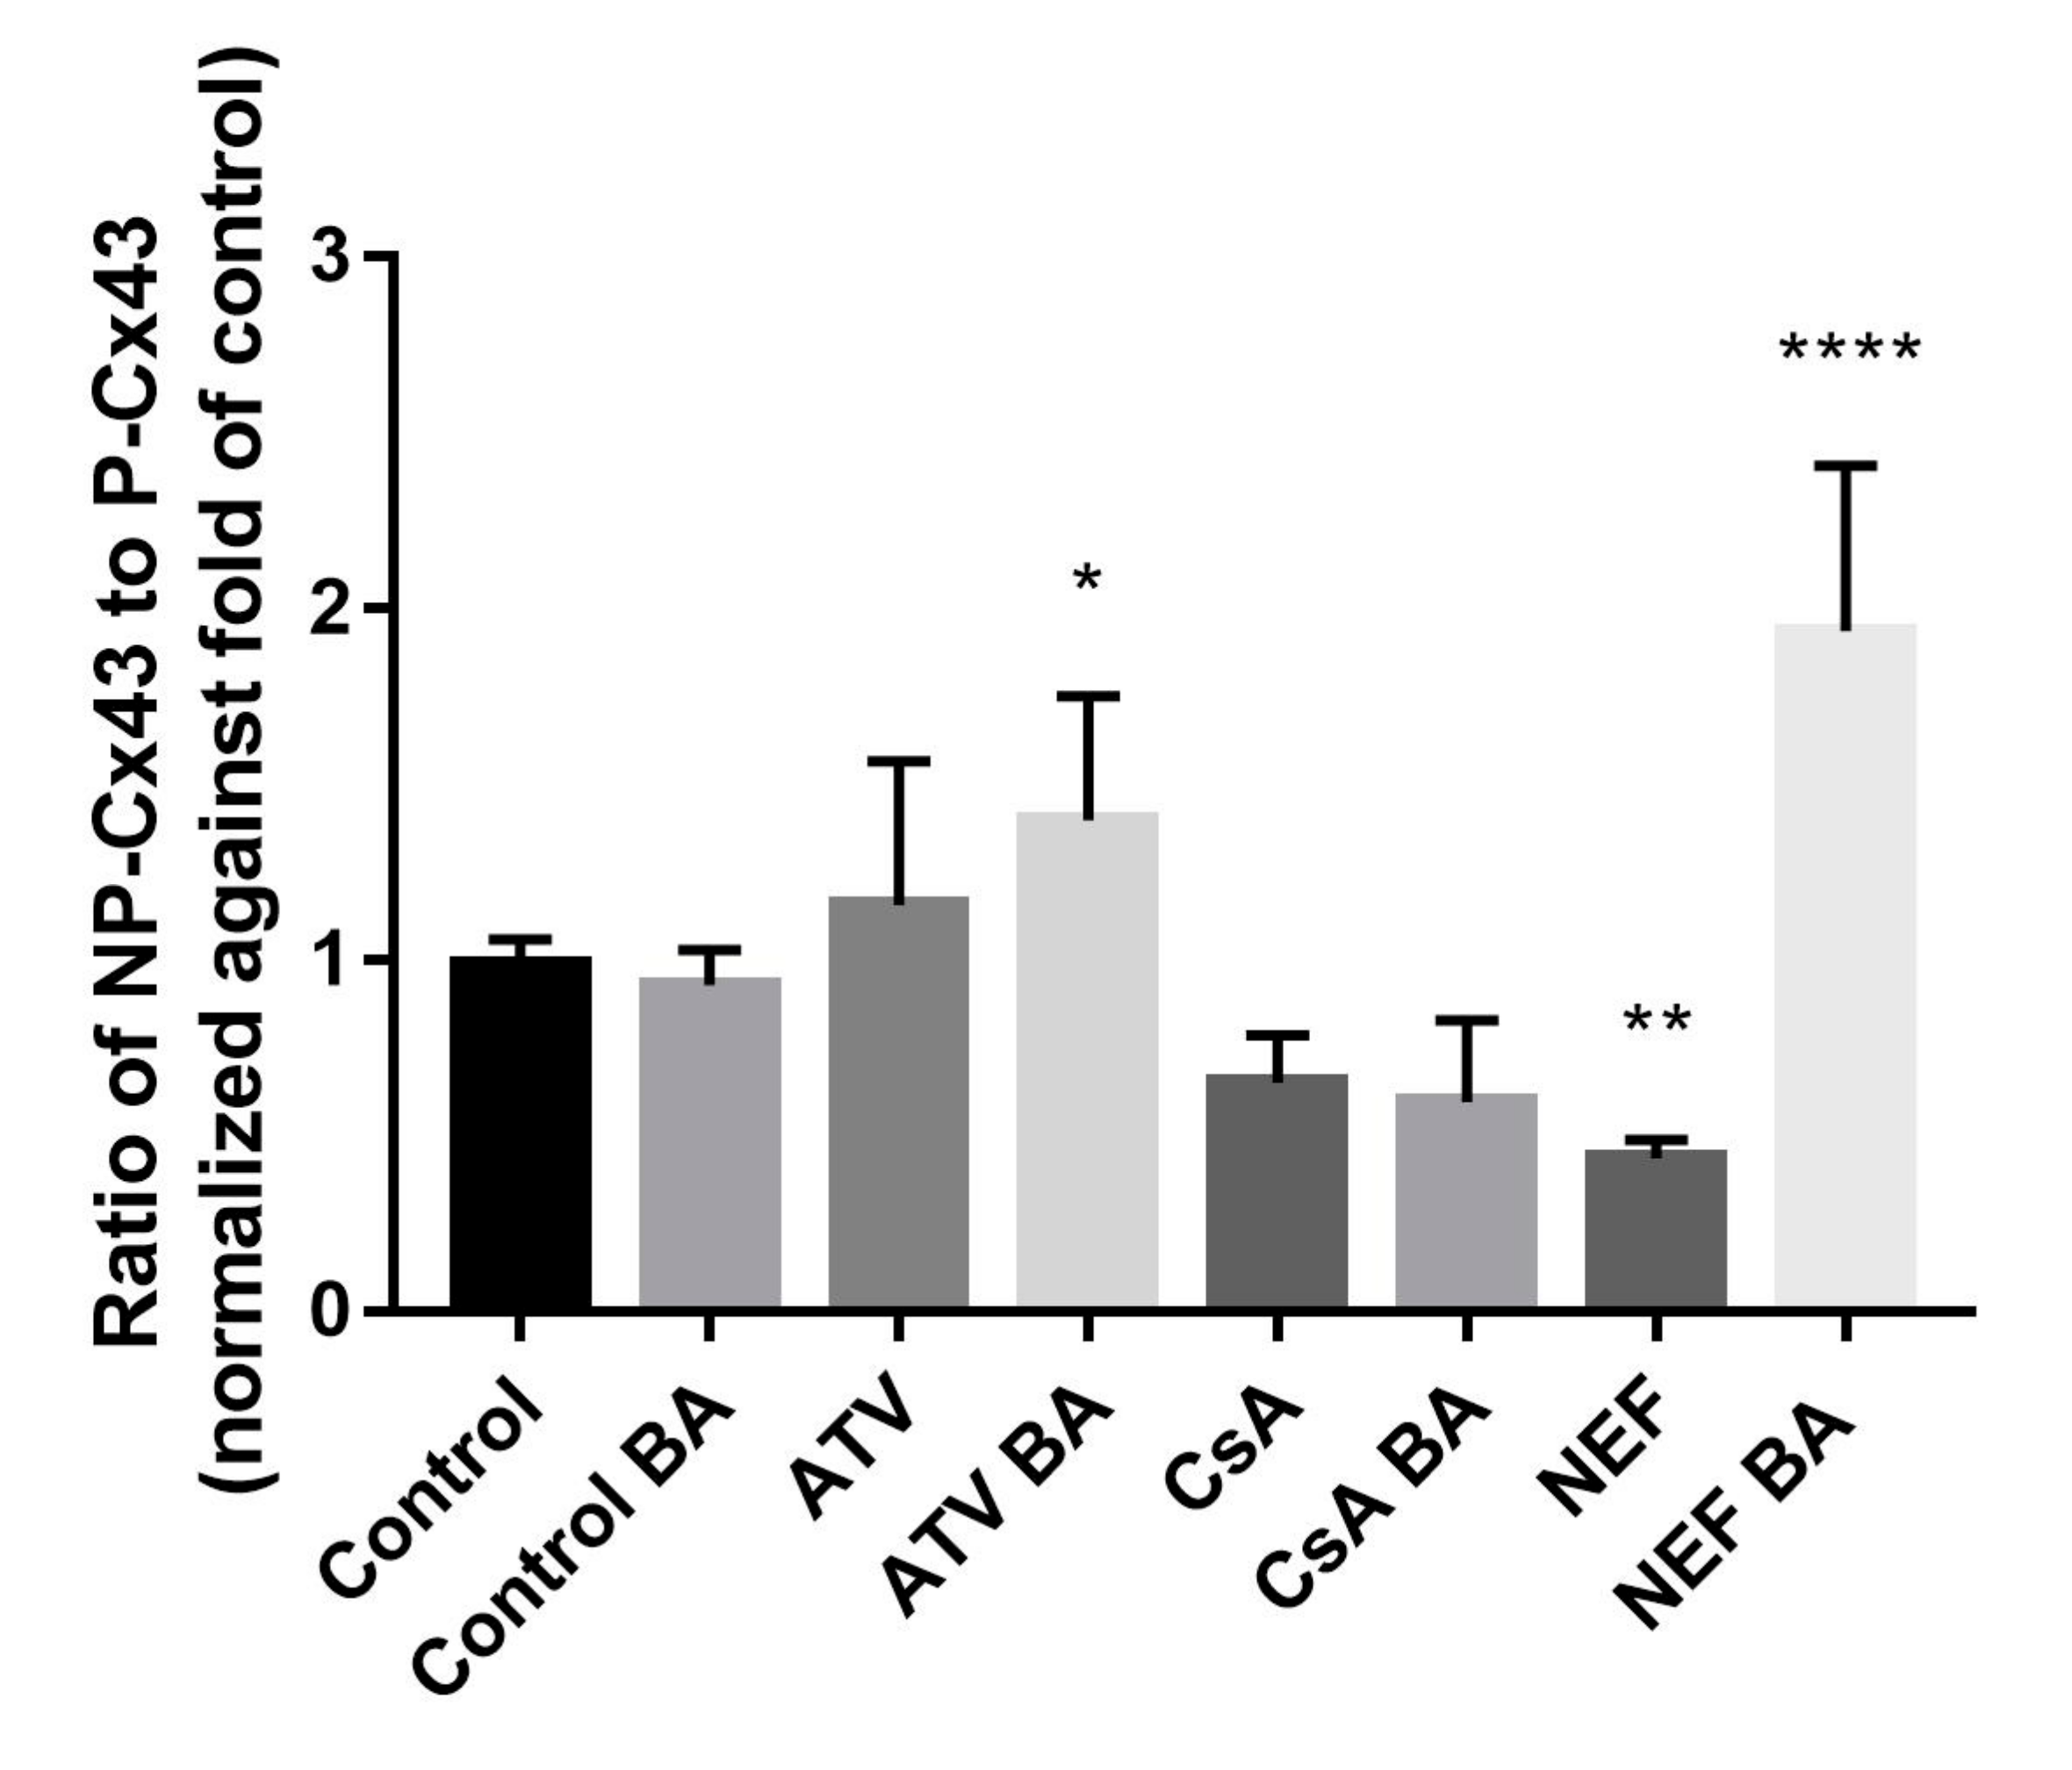
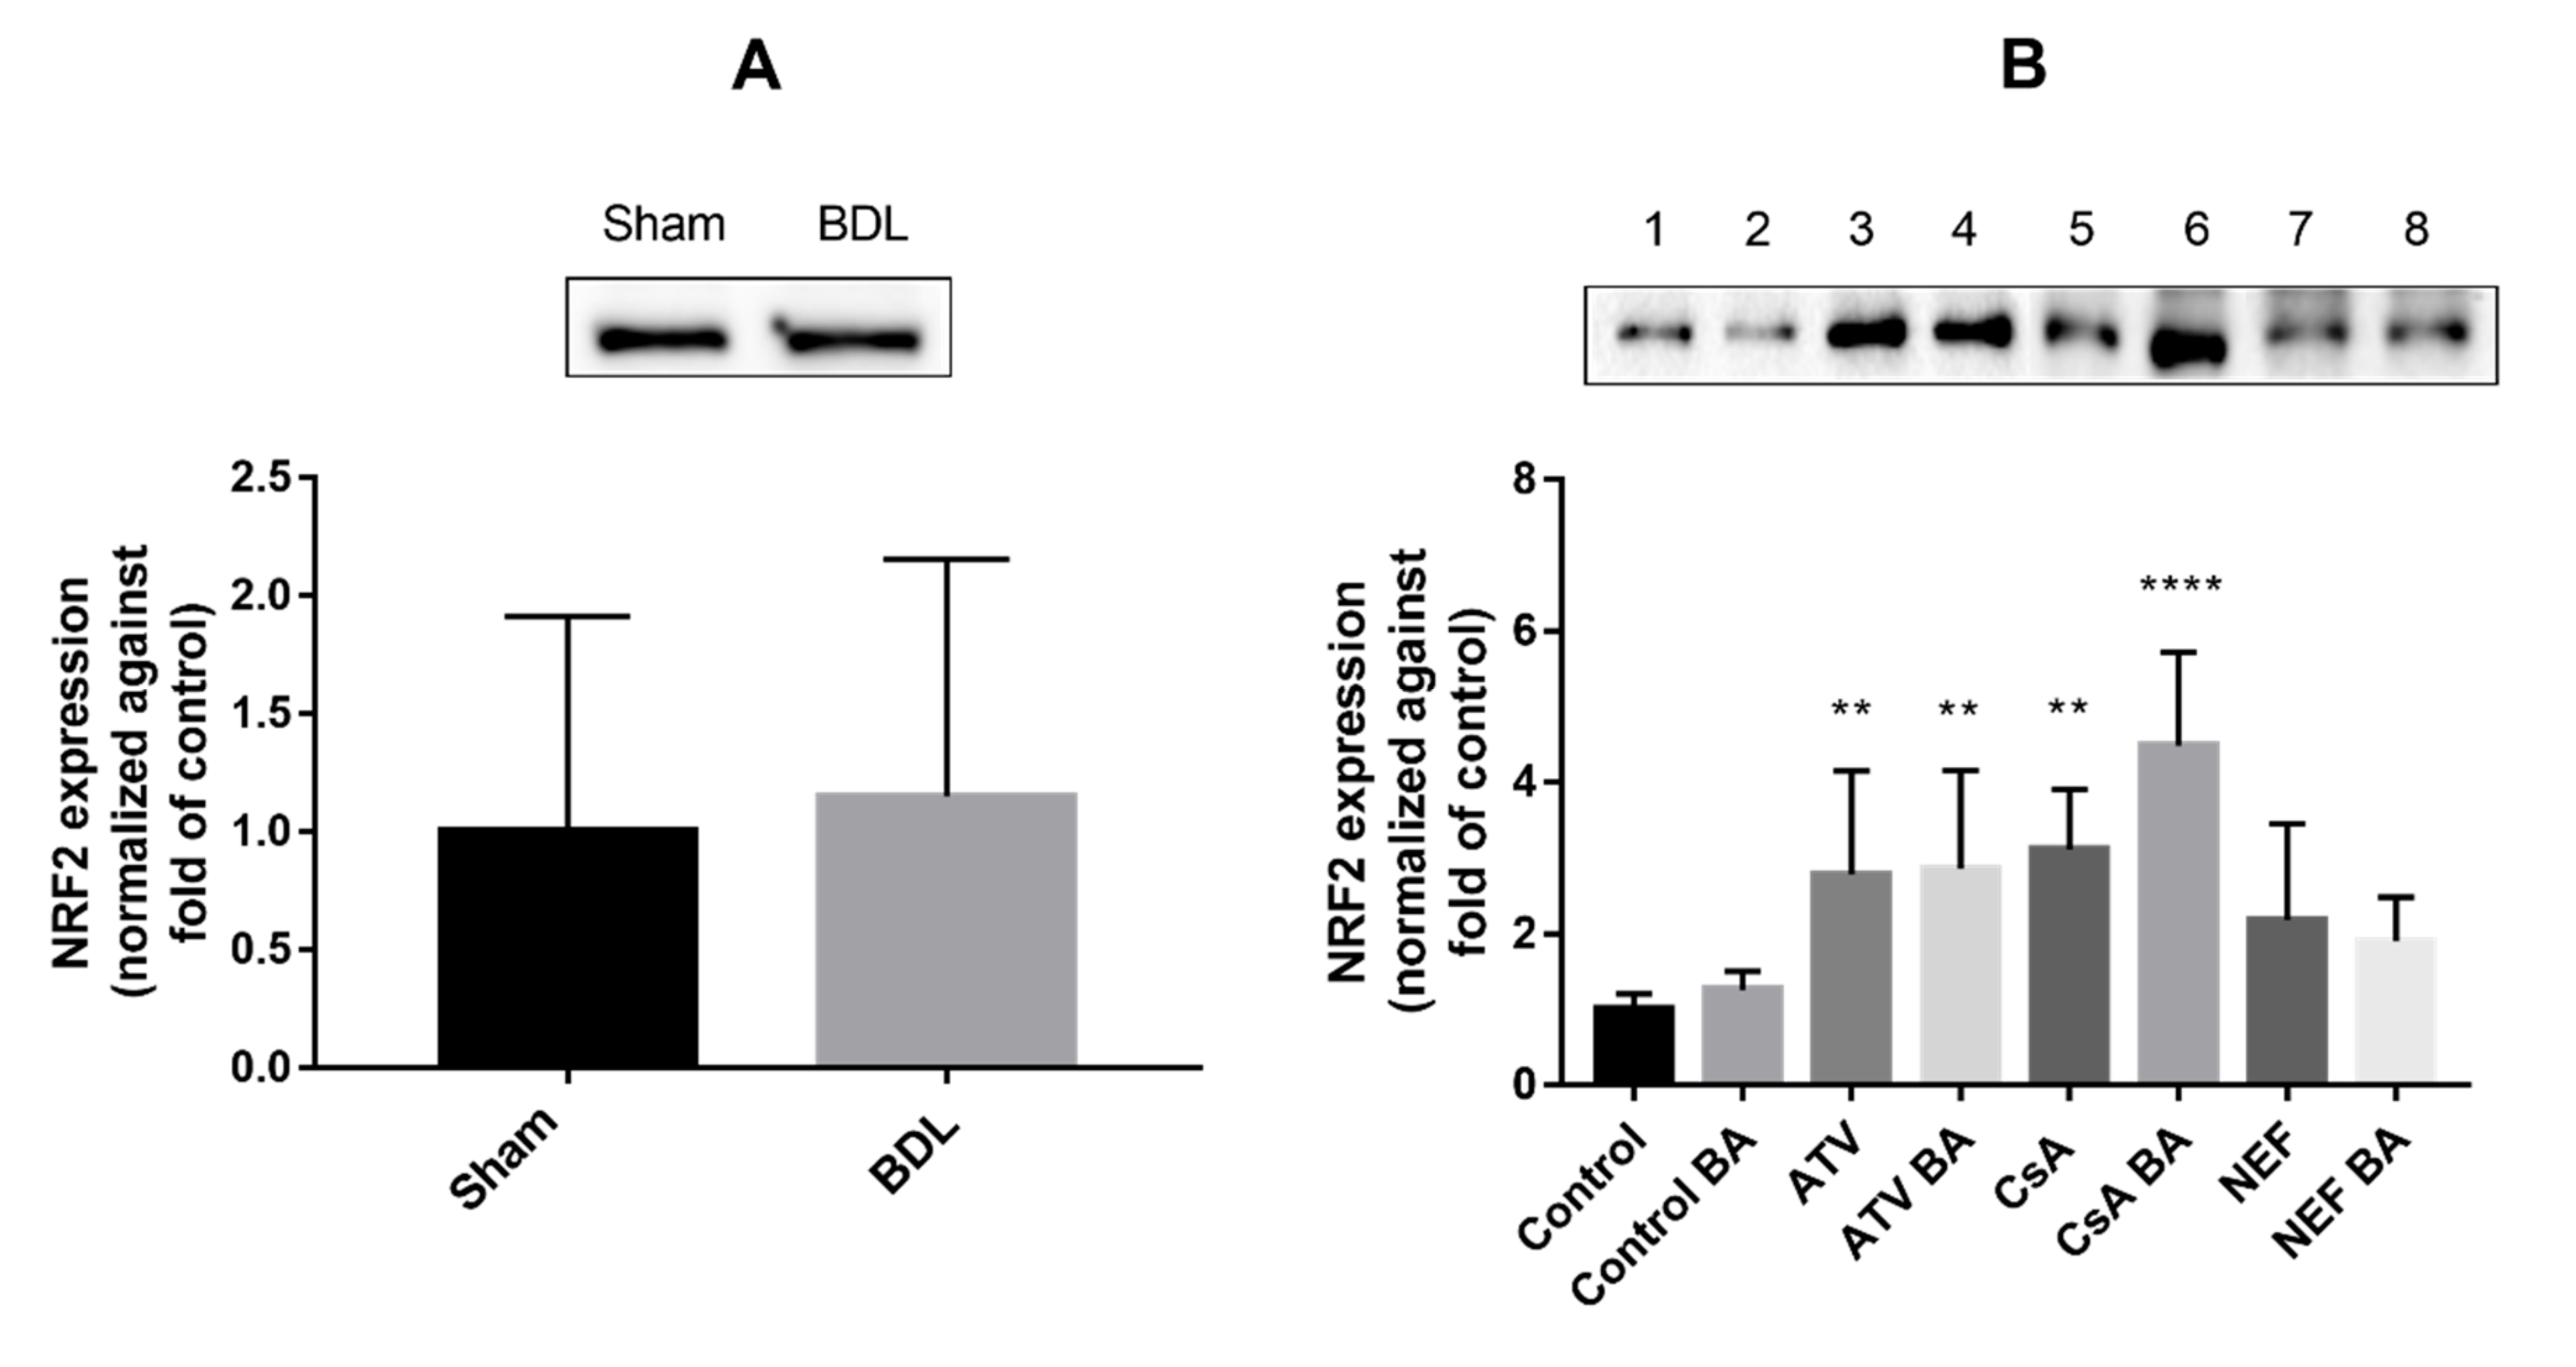
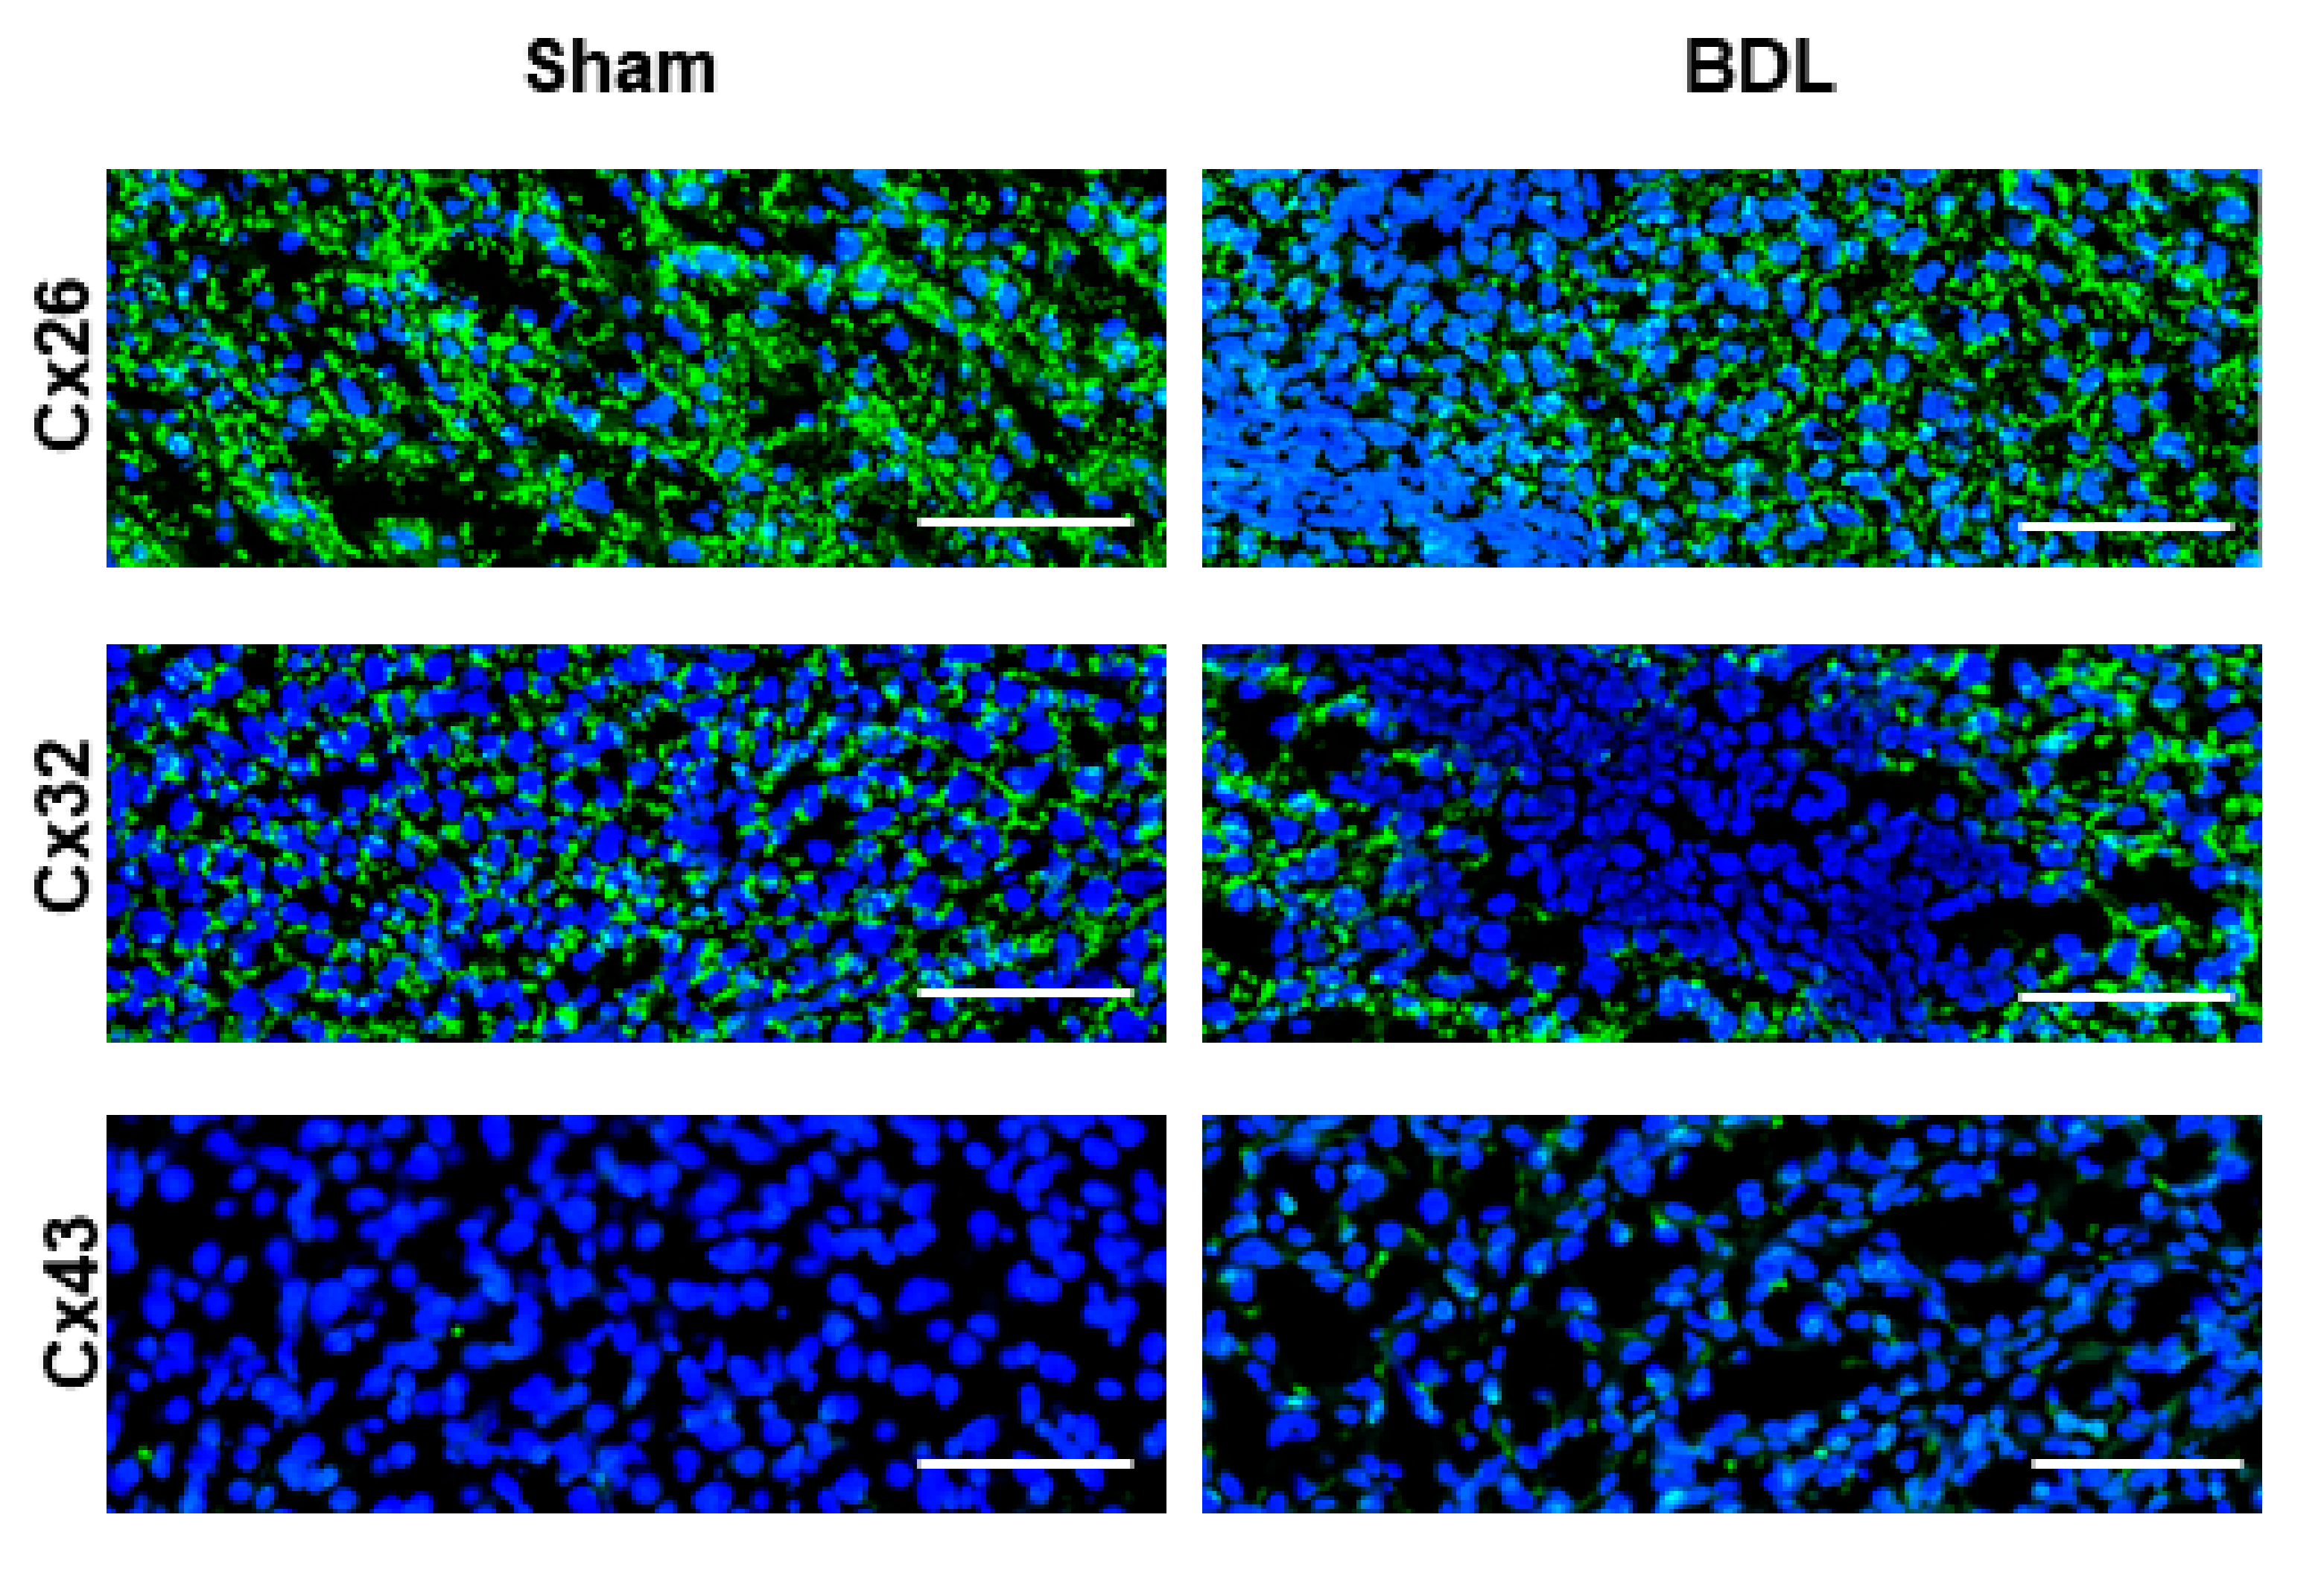
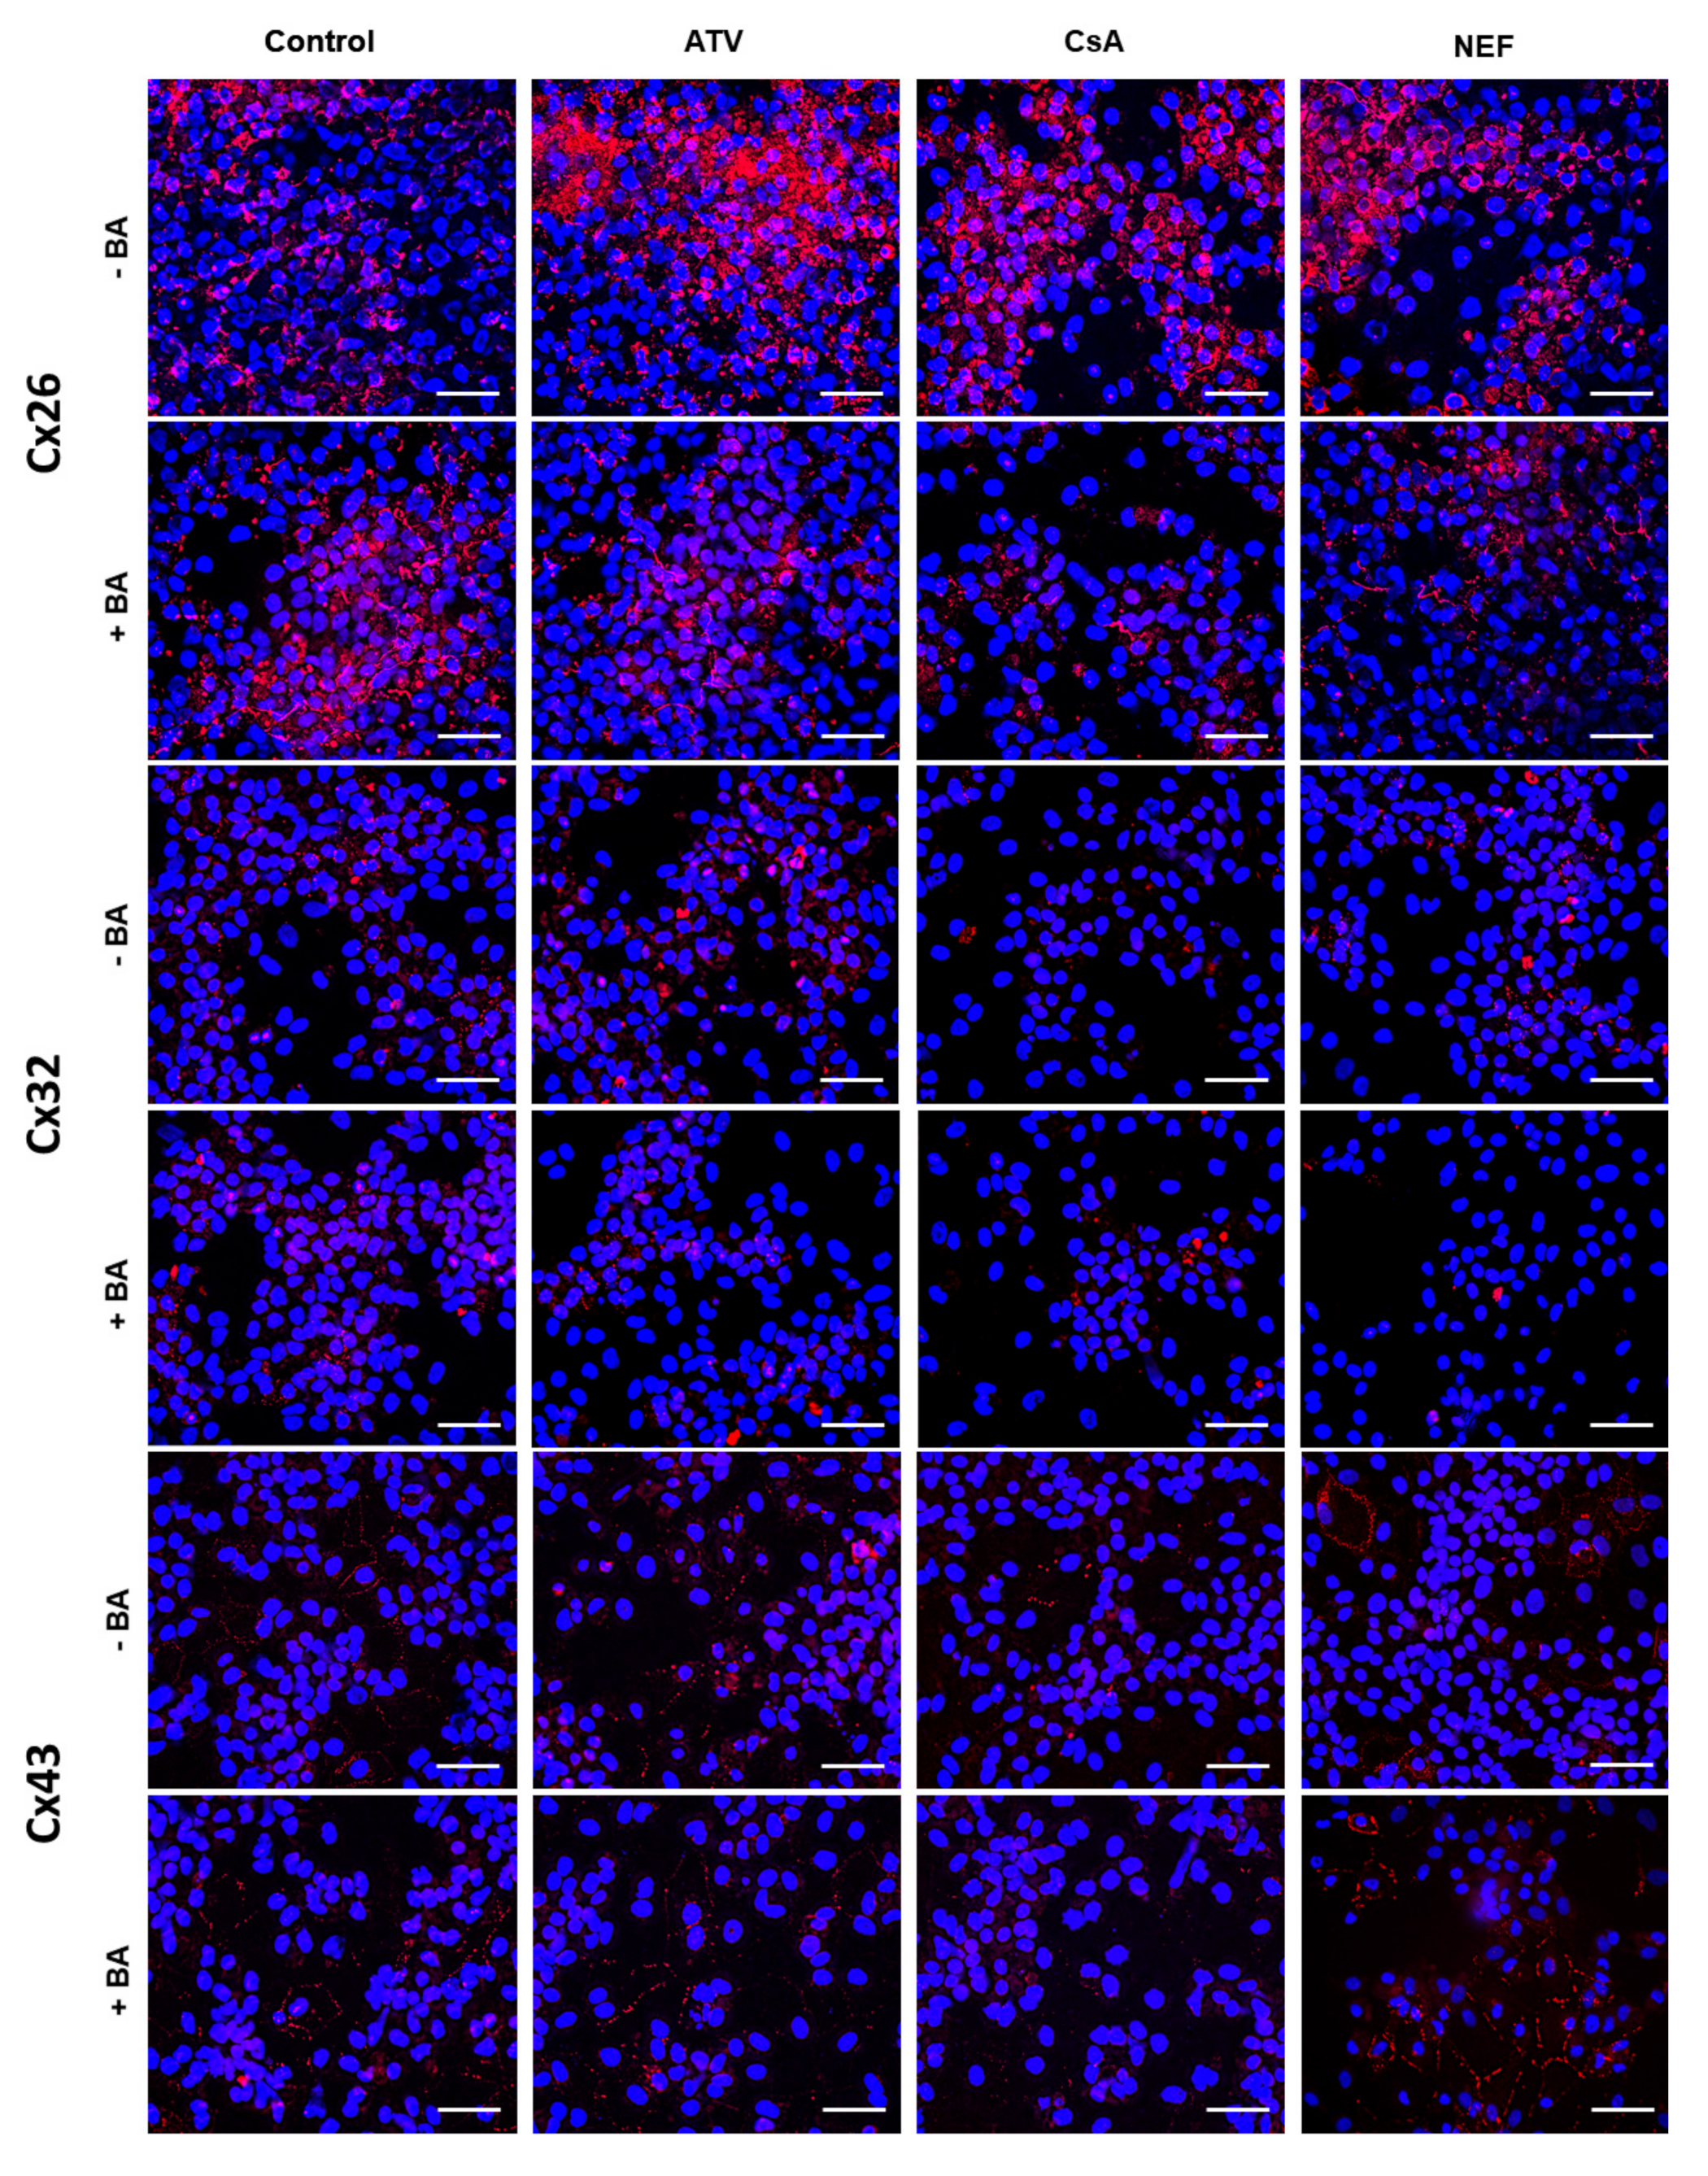
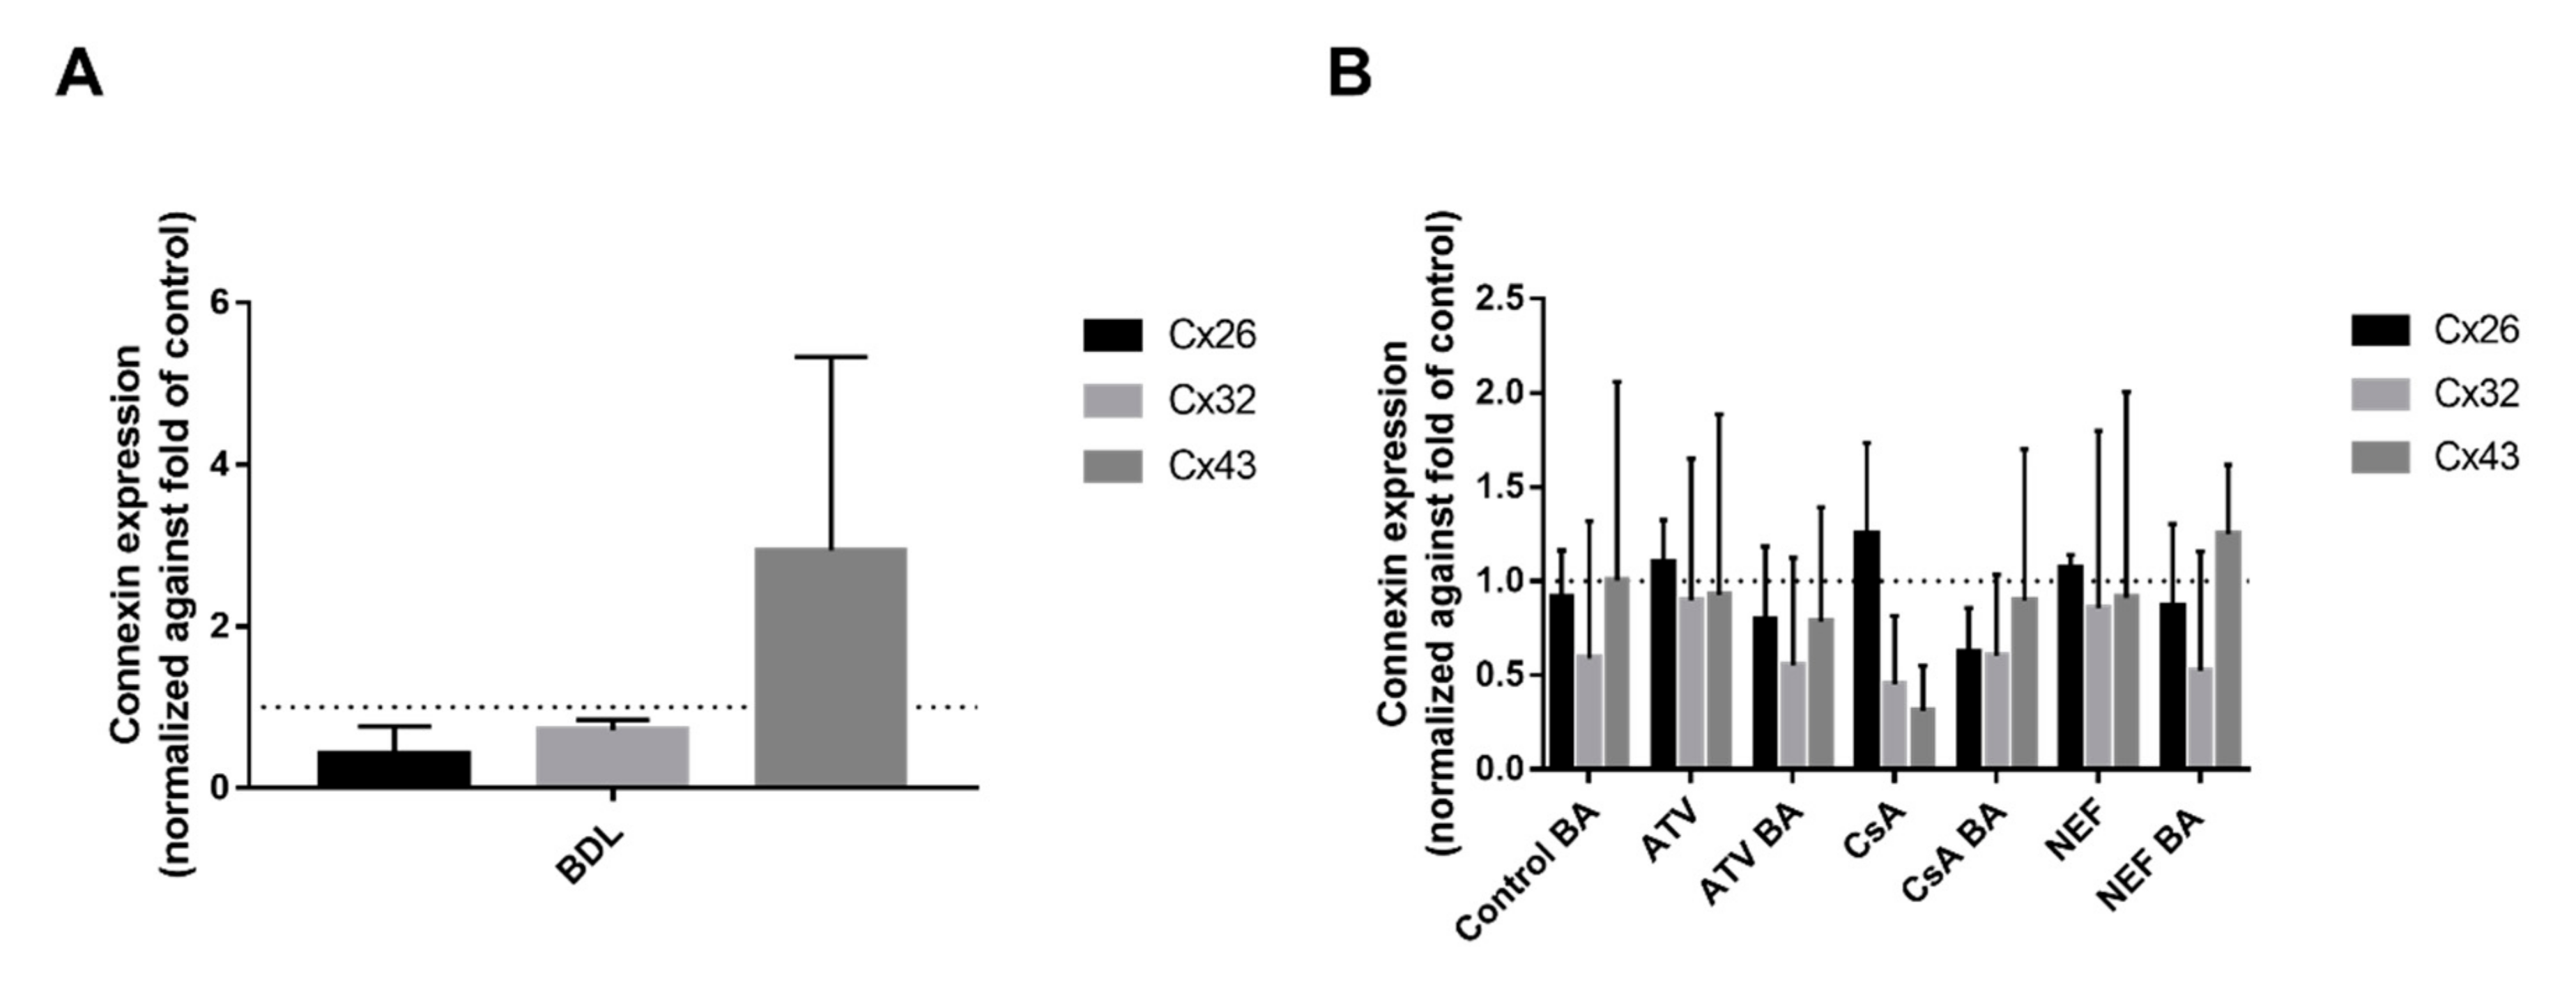
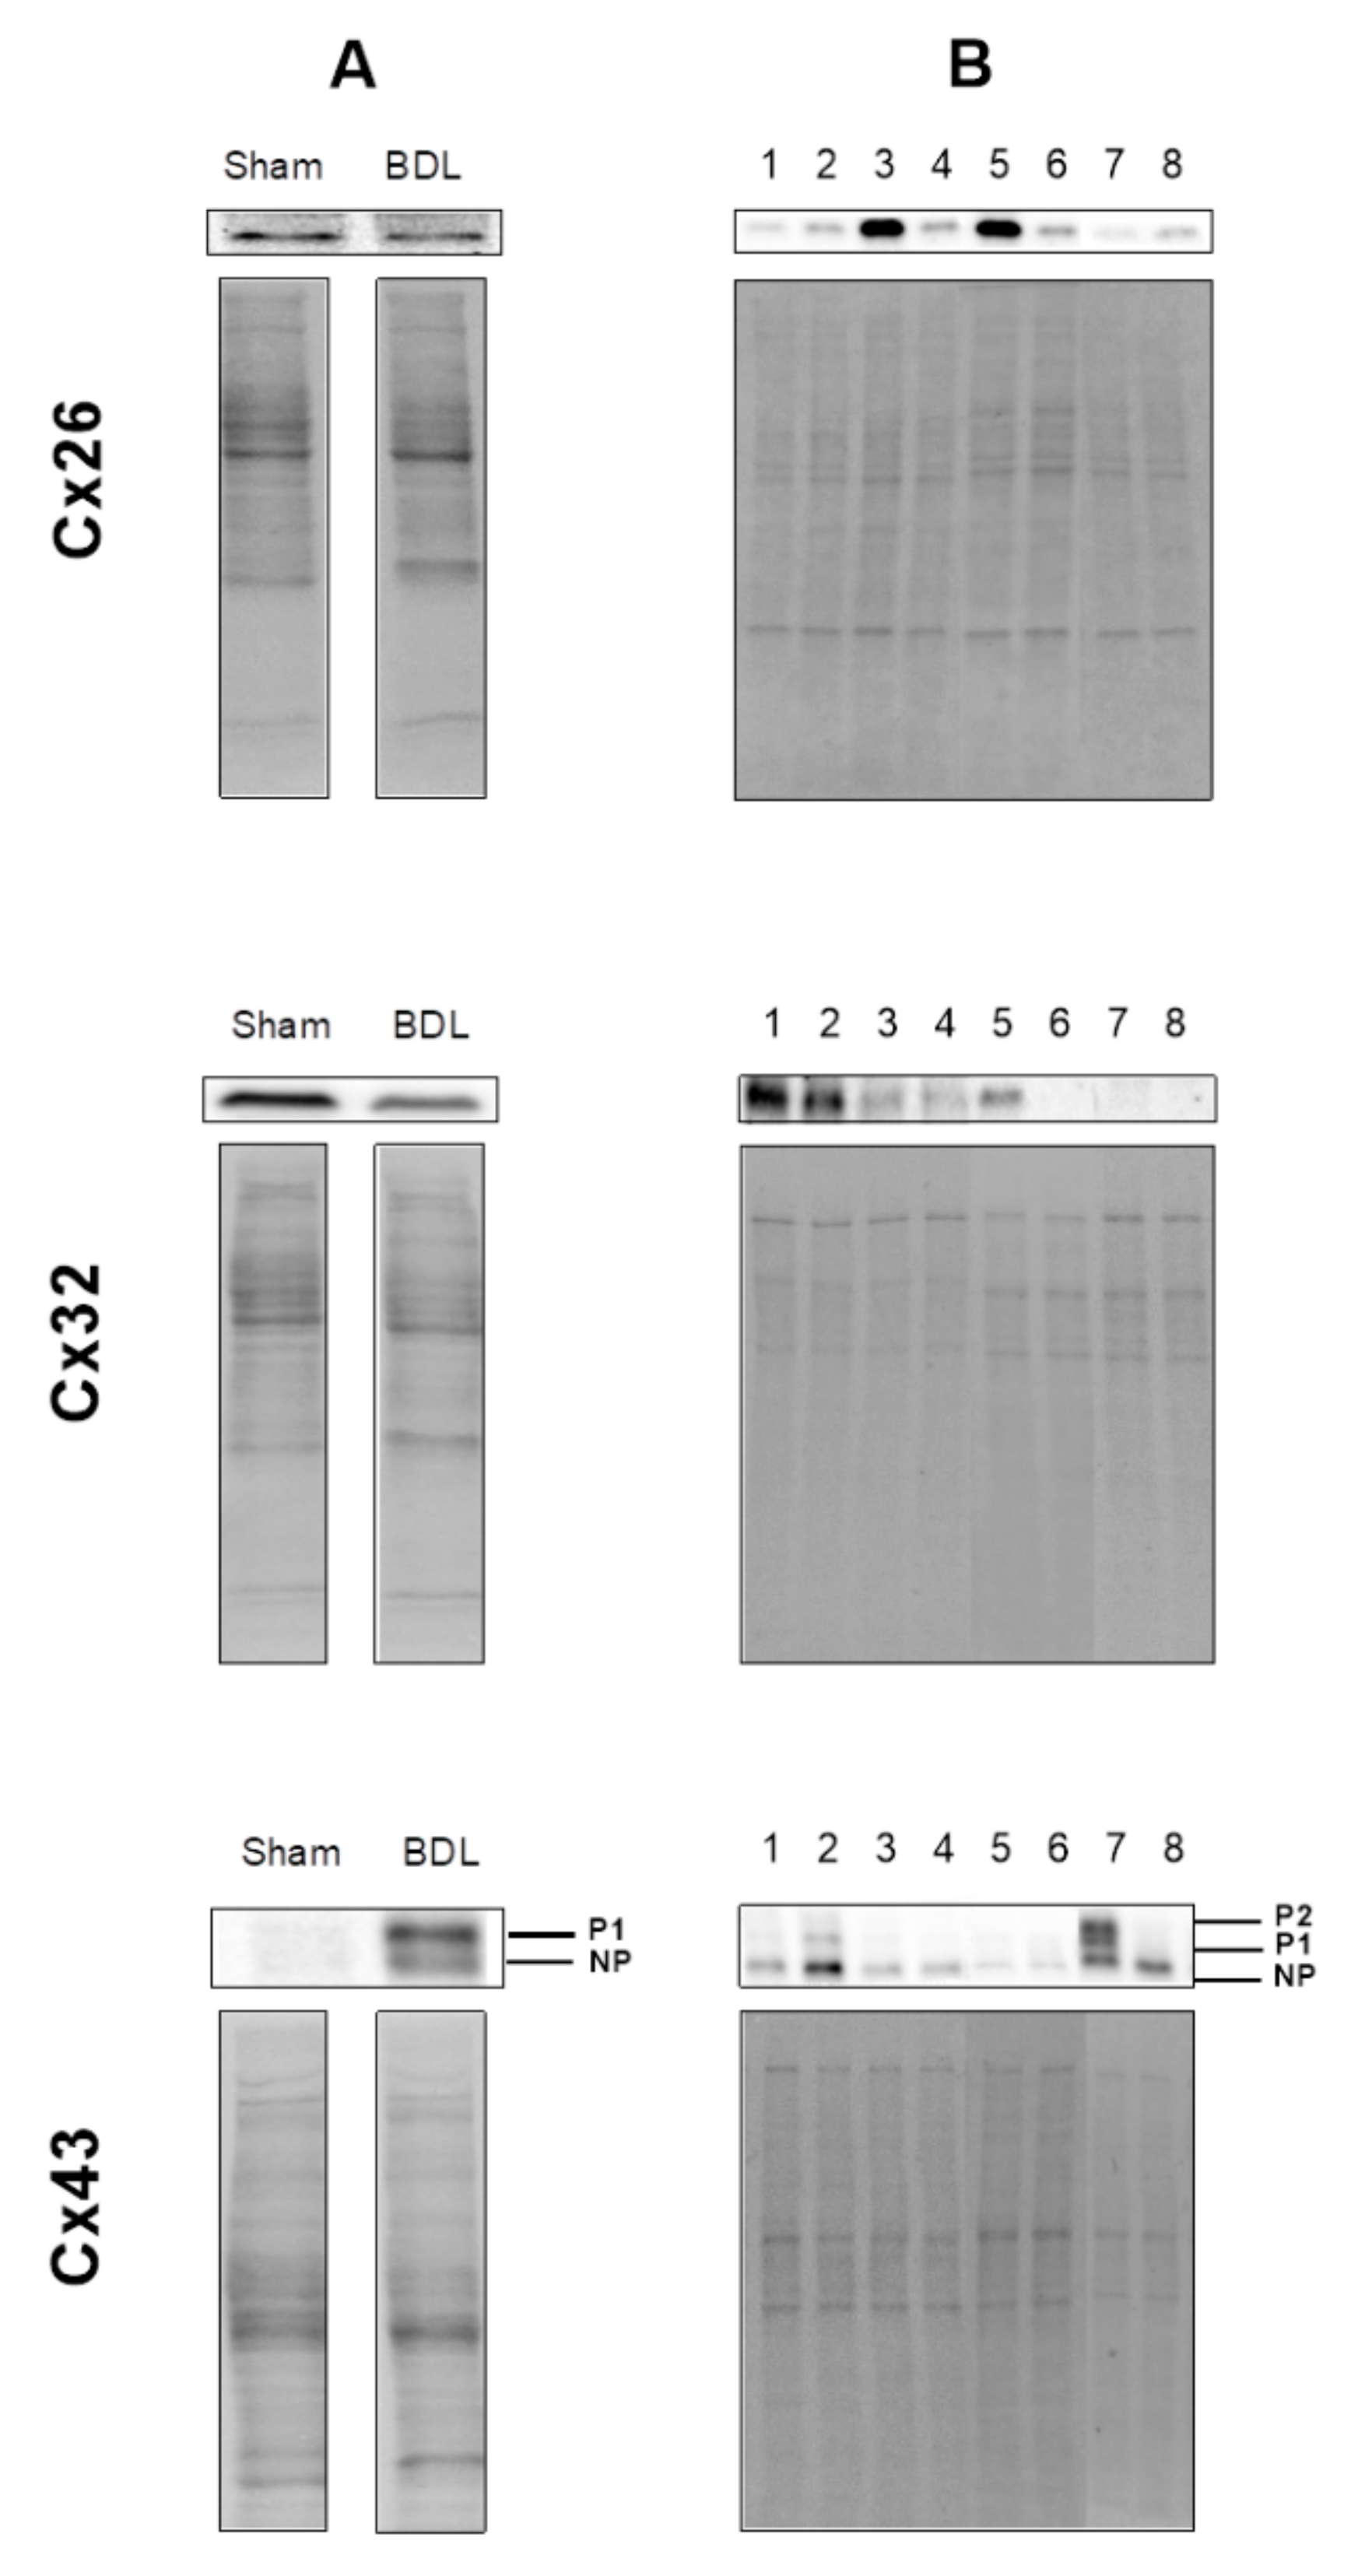
2.2. Effects of Cholestasis on Hepatic Connexin Protein Expression
3. Discussion
4. Materials and Methods
4.1. Animals and Treatment
4.2. Cell Cultures and Treatment
4.3. Reverse Transcription Quantitative Real-Time Polymerase Chain Reaction Analysis
4.4. Immunoblot Analysis
4.5. Immunohistochemistry Analysis
4.6. Immunocytochemistry Analysis
4.7. Statistical Analysis
Author Contributions
Funding
Acknowledgments
Conflicts of Interest
Abbreviations
| ANOVA | Analysis of variance |
| ATV | Atazanavir |
| BA(s) | Bile acid(s) |
| BDL | Bile duct ligation |
| Cx | Connexin |
| CsA | Cyclosporin A |
| DAPI | 4′,6-diamidino-2-phenylindole |
| DIC | Drug-induced cholestasis |
| DILI | Drug-induced liver injury |
| DMSO | Dimethylsulfoxide |
| IB | Immunoblot |
| ICC | Immunocytochemistry |
| IHC | Immunohistochemistry |
| NEF | Nefazodone |
| Nrf2 | Nuclear factor erythroid 2-related factor 2 |
| PBS | Phosphate-buffered saline |
| P | Probability |
| RT-qPCR | Reverse transcription-quantitative polymerase chain reaction |
| SD | Standard deviation |
References
- Alexander, D.; Goldberg, G. Transfer of Biologically Important Molecules Between Cells Through Gap Junction Channels. Curr. Med. Chem. 2005, 10, 2045–2058. [Google Scholar] [CrossRef] [PubMed]
- Goodenough, D.A.; Goliger, J.A.; Paul, D.L. Connexins, Connexons, and Intercellular Communication. Annu. Rev. Biochem. 1996, 65, 475–502. [Google Scholar] [CrossRef] [PubMed]
- Neveu, M.J.; Babcock, K.L.; Hertzberg, E.L.; Paul, D.L.; Nicholson, B.J.; Pitot, H.C. Colocalized Alterations in connexin32 and Cytochrome P450IIB1/2 by Phenobarbital and Related Liver Tumor Promoters. Cancer Res. 1994, 54, 3145–3152. [Google Scholar] [PubMed]
- Shoda, T.; Mitsumori, K.; Onodera, H.; Toyoda, K.; Uneyama, C.; Imazawa, T.; Hirose, M. The relationship between decrease in Cx32 and induction of P450 isozymes in the early phase of clofibrate hepatocarcinogenesis in the rat. Arch. Toxicol. 1999, 73, 373–380. [Google Scholar] [CrossRef]
- Shoda, T.; Mitsumori, K.; Onodera, H.; Toyoda, K.; Uneyama, C.; Takada, K.; Hirose, M. Live Tumor-Promoting Effect of β-Naphthoflavone, a Strong CYP 1A1/2 Inducer, and the Relationship between CYP 1A1/2 Induction and Cx32 Decrease in Its Hepatocarcinogenesis in the Rat. Toxicol. Pathol. 2000, 28, 540–547. [Google Scholar] [CrossRef] [Green Version]
- Yang, J.; Ichikawa, A.; Tsuchiya, T. A novel function of connexin 32: Marked enhancement of liver function in a hepatoma cell line. Biochem. Biophys. Res. Commun. 2003, 307, 80–85. [Google Scholar] [CrossRef]
- Stümpel, F.; Ott, T.; Willecke, K.; Jungermann, K. Connexin 32 Gap junctions enhance stimulation of glucose output by glucagon and noradrenaline in mouse liver. Hepatology 1998, 28, 1616–1620. [Google Scholar] [CrossRef]
- Temme, A.; Stümpel, F.; Söhl, G.; Rieber, E.P.; Jungermann, K.; Willecke, K.; Ott, T. Dilated bile canaliculi and attenuated decrease of nerve-dependent bile secretion in connexin32-deficient mouse liver. Pflugers Arch. Eur. J. Physiol. 2001, 442, 961–966. [Google Scholar] [CrossRef]
- Cooreman, A.; Van Campenhout, R.; Ballet, S.; Annaert, P.; Van Den Bossche, B.; Colle, I.; Cogliati, B.; Vinken, M. Connexin and pannexin (hemi)channels: Emerging targets in the treatment of liver disease. Hepatology 2019, 69, 1317–1323. [Google Scholar] [CrossRef]
- Willebrords, J.; Crespo Yanguas, S.; Maes, M.; Decrock, E.; Wang, N.; Leybaert, L.; da Silva, T.C.; Veloso Alves Pereira, I.; Jaeschke, H.; Cogliati, B.; et al. Structure, Regulation and Function of Gap Junctions in Liver. Cell Commun. Adhes. 2015, 22, 29–37. [Google Scholar] [CrossRef] [Green Version]
- Berthoud, V.M.; Iwanij, V.; Garcia, A.M.; Saez, J.C. Connexins and glucagon receptors during development of rat hepatic acinus. Am. J. Physiol. Gastrointest. Liver Physiol. 1992, 263, G650–G658. [Google Scholar] [CrossRef] [PubMed]
- Bode, H.P.; Wang, L.F.; Cassio, D.; Leite, M.F.; St-Pierre, M.V.; Hirata, K.; Okazaki, K.; Sears, M.L.; Meda, P.; Nathanson, M.H.; et al. Expression and regulation of gap junctions in rat cholangiocytes. Hepatology 2002, 36, 631–640. [Google Scholar] [CrossRef] [PubMed]
- Fischer, R.; Reinehr, R.; Lu, T.P.; Schönicke, A.; Warskulat, U.; Dienes, H.P.; Häussinger, D. Intercellular communication via gap junctions in activated rat hepatic stellate cells. Gastroenterology 2005, 128, 433–448. [Google Scholar] [CrossRef]
- Maes, M.; McGill, M.R.; da Silva, T.C.; Abels, C.; Lebofsky, M.; Maria Monteiro de Araújo, C.; Tiburcio, T.; Veloso Alves Pereira, I.; Willebrords, J.; Crespo Yanguas, S.; et al. Involvement of connexin43 in acetaminophen-induced liver injury. Biochim. Biophys. Acta Mol. Basis Dis. 2016, 1862, 1111–1121. [Google Scholar] [CrossRef]
- Cogliati, B.; Da silva, T.C.; Aloia, T.P.A.; Chaible, L.M.; Real-Lima, M.A.; Sanches, D.S.; Matsuzaki, P.; Hernandez-Blazquez, F.J.; Dagli, M.L.Z. Morphological and molecular pathology of CCL4-induced hepatic fibrosis in connexin43-deficient mice. Microsc. Res. Tech. 2011, 74, 421–429. [Google Scholar] [CrossRef]
- Hernández-Guerra, M.; González-Méndez, Y.; de Ganzo, Z.A.; Salido, E.; García-Pagán, J.C.; Abrante, B.; Malagón, A.M.; Bosch, J.; Quintero, E. Role of gap junctions modulating hepatic vascular tone in cirrhosis. Liver Int. 2014, 34, 859–868. [Google Scholar] [CrossRef]
- Nakashima, Y.; Ono, T.; Yamanoi, A.; El-Assal, O.N.; Kohno, H.; Nagasue, N. Expression of gap junction protein connexin32 in chronic hepatitis, liver cirrhosis, and hepatocellular carcinoma. J. Gastroenterol. 2004, 39, 763–768. [Google Scholar] [CrossRef]
- Nakata, Y.; Iwai, M.; Kimura, S.; Shimazu, T. Prolonged decrease in hepatic connexin32 in chronic liver injury induced by carbon tetrachloride in rats. J. Hepatol. 1996, 25, 529–537. [Google Scholar] [CrossRef]
- Yamaoka, K.; Nouchi, T.; Kohashi, T.; Marumo, F.; Sato, C. Expression of gap junction protein connexin 32 in chronic liver diseases. Liver 2000, 20, 104–107. [Google Scholar] [CrossRef]
- Deferm, N.; De Vocht, T.; Qi, B.; Van Brantegem, P.; Gijbels, E.; Vinken, M.; de Witte, P.; Bouillon, T.; Annaert, P. Current insights in the complexities underlying drug-induced cholestasis. Crit. Rev. Toxicol. 2019, 49, 520–548. [Google Scholar] [CrossRef]
- Gijbels, E.; Vilas-Boas, V.; Deferm, N.; Devisscher, L.; Jaeschke, H.; Annaert, P.; Vinken, M. Mechanisms and in vitro models of drug-induced cholestasis. Arch. Toxicol. 2019, 93, 1169–1186. [Google Scholar] [CrossRef]
- Desmet, V.J. Histopathology of cholestasis. Verh. Dtsch. Ges. Pathol. 1995, 79, 233–240. [Google Scholar]
- European Association for the Study of the Liver EASL Clinical Practice Guidelines: Management of cholestatic liver diseases. J. Hepatol. 2009, 51, 237–267. [CrossRef]
- Onofrio, F.Q.; Hirschfield, G.M. The Pathophysiology of Cholestasis and Its Relevance to Clinical Practice. Clin. Liver Dis. 2020, 15, 110–114. [Google Scholar] [CrossRef] [Green Version]
- Tag, C.G.; Sauer-Lehnen, S.; Weiskirchen, S.; Borkham-Kamphorst, E.; Tolba, R.H.; Tacke, F.; Weiskirchen, R. Bile duct ligation in mice: Induction of inflammatory liver injury and fibrosis by obstructive cholestasis. J. Vis. Exp. 2015, 96, e52438. [Google Scholar] [CrossRef] [Green Version]
- Georgiev, P.; Jochum, W.; Heinrich, S.; Jang, J.H.; Nocito, A.; Dahm, F.; Clavien, P.A. Characterization of time-related changes after experimental bile duct ligation. Br. J. Surg. 2008, 95, 646–656. [Google Scholar] [CrossRef]
- Olynyk, J.; Yeoh, G.; Ramm, G.; Clarke, S.; Hall, P.; Britton, R.; Bacon, B.; Tracy, T. Gadolinium Chloride Suppresses Hepatic Oval Cell Proliferation in Rats With Biliary Obstruction. Am. J. Pathol. 1998, 152, 347–352. [Google Scholar]
- Padda, M.S.; Sanchez, M.; Akhtar, A.J.; Boyer, J.L. Drug-induced cholestasis. Hepatology 2011, 53, 1377–1387. [Google Scholar] [CrossRef] [Green Version]
- Björnsson, E.; Olsson, R. Outcome and prognostic markers in severe drug-induced liver disease. Hepatology 2005, 42, 481–489. [Google Scholar] [CrossRef]
- Sharanek, A.; Burban, A.; Burbank, M.; Le Guevel, R.; Li, R.; Guillouzo, A.; Guguen-Guillouzo, C. Rho-kinase/myosin light chain kinase pathway plays a key role in the impairment of bile canaliculi dynamics induced by cholestatic drugs. Sci. Rep. 2016, 6, 24709. [Google Scholar] [CrossRef] [Green Version]
- Gijbels, E.; Vilas-Boas, V.; Annaert, P.; Vanhaecke, T.; Devisscher, L.; Vinken, M. Robustness testing and optimization of an adverse outcome pathway on cholestatic liver injury. Arch. Toxicol. 2020, 94, 1151–1172. [Google Scholar] [CrossRef]
- Cascio, M.; Kumar, N.M.; Safarik, R.; Gilula, N.B. Physical characterization of gap junction membrane connexons (hemi-channels) isolated from rat liver. J. Biol. Chem. 1995, 270, 18643–18648. [Google Scholar] [CrossRef] [Green Version]
- Neveu, M.J.; Hully, J.R.; Babcock, K.L.; Vaughan, J.; Hertzberg, E.L.; Nicholson, B.J.; Paul, D.L.; Pitot, H.C. Proliferation-associated Differences in the Spatial and Temporal Expression of Gap Junction Genes in Rat Liver. Hepatology 1995, 22, 202–212. [Google Scholar]
- Hernández-Guerra, M.; Hadjihambi, A.; Jalan, R. Gap junctions in liver disease: Implications for pathogenesis and therapy. J. Hepatol. 2019, 70, 759–772. [Google Scholar] [CrossRef] [Green Version]
- Vinken, M.; De Kock, J.; Oliveira, A.G.; Menezes, G.B.; Cogliati, B.; Dagli, M.L.Z.; Vanhaecke, T.; Rogiers, V. Modifications in Connexin Expression in Liver Development and Cancer. Cell Commun. Adhes. 2012, 19, 55–62. [Google Scholar] [CrossRef] [Green Version]
- Gingalewski, C.; Wang, K.; Clemens, M.G.; De Maio, A. Posttranscriptional Regulation of Connexin 32 Expression in Liver During Acute Inflammation. J. Cell. Physiol. 1996, 166, 461–467. [Google Scholar] [CrossRef]
- Temme, A.; Traub, O.; Willecke, K. Downregulation of connexin32 protein and gap-junctional intercellular communication by cytokine-mediated acute-phase response in immortalized mouse hepatocytes. Cell Tissue Res. 1998, 294, 345–350. [Google Scholar] [CrossRef]
- Willebrords, J.; Maes, M.; Yanguas, S.C.; Cogliati, B.; Vinken, M. Detection of connexins in liver cells using sodium dodecyl sulfate polyacrylamide gel electrophoresis and immunoblot analysis. In Methods in Molecular Biology; Humana Press Inc.: New York, NY, USA, 2016; Volume 1437, pp. 37–53. [Google Scholar]
- Kanczuga-Koda, L.; Koda, M.; Sulkowski, S.; Wincewicz, A.; Zalewski, B.; Sulkowska, M. Gradual Loss of Functional Gap Junction Within Progression of Colorectal Cancer—A Shift From Membranous CX32 and CX43 Expression to Cytoplasmic Pattern During Colorectal Carcinogenesis. In Vivo 2010, 24, 101–107. [Google Scholar]
- Sirnes, S.; Lind, G.E.; Bruun, J.; Fykerud, T.A.; Mesnil, M.; Lothe, R.A.; Rivedal, E.; Kolberg, M.; Leithe, E. Connexins in colorectal cancer pathogenesis. Int. J. Cancer 2015, 137, 1–11. [Google Scholar] [CrossRef]
- Vinken, M.; Henkens, T.; Vanhaecke, T.; Papeleu, P.; Geerts, A.; Van Rossen, E.; Chipman, J.K.; Rogiers, V. Trichostatin a Enhances Gap Junctional Intercellular Communication in Primary Cultures of Adult Rat Hepatocytes. Toxicol. Sci. 2006, 91, 484–492. [Google Scholar] [CrossRef] [Green Version]
- Kojima, T.; Mitaka, T.; Shibata, Y.; Mochizuki, Y. Induction and Regulation of connexin26 by Glucagon in Primary Cultures of Adult Rat Hepatocytes. J. Cell Sci. 1995, 109, 2771–2780. [Google Scholar]
- Traub, O.; Look, J.; Dermietzel, R.; Brummer, F.; Hulser, D.; Willecke, K. Comparative characterization of the 21-kD and 26-kD gap junction proteins in murine liver and cultured hepatocytes. J. Cell Biol. 1989, 108, 1039–1051. [Google Scholar] [CrossRef] [PubMed]
- Chu, F.F.; Doyle, D. Turnover of plasma membrane proteins in rat hepatoma cells and primary cultures of rat hepatocytes. J. Biol. Chem. 1985, 260, 3097–3107. [Google Scholar]
- Traub, O.; Druge, P.M.; Willecke, K. Degradation and resynthesis of gap junction protein in plasma membranes of regenerating liver after partial hepatectomy or cholestasis. Proc. Natl. Acad. Sci. USA 1983, 80, 755–759. [Google Scholar] [CrossRef] [Green Version]
- Spray, D.; Saez, J.; Hertzberg, E.; Dermietzel, R. Gap Junctions in Liver: Composition, Function, and Regulation, 3rd ed.; Arias, I., Boyer, J., Fausto, N., Jakoby, W., Schachter, D., Shaftrits, D., Eds.; Raven Press: New York, NY, USA, 1994; pp. 951–967. [Google Scholar]
- Fallon, M.B.; Nathanson, M.H.; Mennone, A.; Saez, J.C.; Burgstahler, A.D.; Anderson, J.M. Altered expression and function of hepatocyte gap junctions after common bile duct ligation in the rat. Am. J. Physiol. Cell Physiol. 1995, 268, C1186–C1194. [Google Scholar] [CrossRef]
- Balasubramaniyan, V.; Dhar, D.K.; Warner, A.E.; Vivien Li, W.Y.; Amiri, A.F.; Bright, B.; Mookerjee, R.P.; Davies, N.A.; Becker, D.L.; Jalan, R. Importance of Connexin-43 based gap junction in cirrhosis and acute-on-chronic liver failure. J. Hepatol. 2013, 58, 1194–1200. [Google Scholar] [CrossRef]
- De Maio, A.; Gingalewski, C.; Theodorakis, N.G.; Clemens, M.G. Interruption of hepatic gap junctional communication in the rat during inflammation induced by bacterial lipopolysaccharide. Shock 2000, 14, 53–59. [Google Scholar] [CrossRef]
- Kojima, T.; Mitaka, T.; Mizuguchi, T.; Mochizuki, Y. Effects of Oxygen Radical Scavengers on Connexins 32 and 26 Expression in Primary Cultures of Adult Rat Hepatocytes. Carcinogenesis 1996, 17, 537–544. [Google Scholar] [CrossRef]
- Morsi, A.S.; Godfrey, R.E.; Chipman, J.K.; Minchin, S.D. Characterisation of the connexin32 promoter and changes in response element complexes in rat liver and hepatocytes during culture associated with oxidative stress. Toxicol. Vitro 2003, 17, 191–199. [Google Scholar] [CrossRef]
- Yamamoto, T.; Kojima, T.; Murata, M.; Takano, K.I.; Go, M.; Chiba, H.; Sawada, N. IL-1β regulates expression of Cx32, occludin, and claudin-2 of rat hepatocytes via distinct signal transduction pathways. Exp. Cell Res. 2004, 299, 427–441. [Google Scholar] [CrossRef]
- Theodorakis, N.G.; De Maio, A. Cx32 mRNA in rat liver: Effects of inflammation on poly(A) tail distribution and mRNA degradation. Am. J. Physiol. Regul. Integr. Comp. Physiol. 1999, 276, R1249–R1257. [Google Scholar] [CrossRef] [PubMed]
- Cogliati, B.; Crespo Yanguas, S.; Da Silva, T.C.; Aloia, T.P.A.; Nogueira, M.S.; Real-Lima, M.A.; Chaible, L.M.; Sanches, D.S.; Willebrords, J.; Maes, M.; et al. Connexin32 deficiency exacerbates carbon tetrachloride-induced hepatocellular injury and liver fibrosis in mice. Toxicol. Mech. Methods 2016, 26, 362–370. [Google Scholar] [CrossRef] [PubMed]
- Tiburcio, T.C.; Willebrords, J.; da Silva, T.C.; Pereira, I.V.A.; Nogueira, M.S.; Crespo Yanguas, S.; Maes, M.; Silva, E.D.A.; Dagli, M.L.Z.; de Castro, I.A.; et al. Connexin32 deficiency is associated with liver injury, inflammation and oxidative stress in experimental non-alcoholic steatohepatitis. Clin. Exp. Pharmacol. Physiol. 2017, 44, 197–206. [Google Scholar] [CrossRef] [PubMed]
- Humbert, L.; Maubert, M.A.; Wolf, C.; Duboc, H.; Mahé, M.; Farabos, D.; Seksik, P.; Mallet, J.M.; Trugnan, G.; Masliah, J.; et al. Bile acid profiling in human biological samples: Comparison of extraction procedures and application to normal and cholestatic patients. J. Chromatogr. B Anal. Technol. Biomed. Life Sci. 2012, 899, 135–145. [Google Scholar] [CrossRef]
- Sharanek, A.; Burban, A.; Humbert, L.; Guguen-Guillouzo, C.; Rainteau, D.; Guillouzo, A. Progressive and preferential cellular accumulation of hydrophobic bile acids induced by cholestatic drugs is associated with inhibition of their amidation and sulfation. Drug Metab. Dispos. 2017, 45, 1292–1303. [Google Scholar] [CrossRef]
- Thakare, R.; Alamoudi, J.A.; Gautam, N.; Rodrigues, A.D.; Alnouti, Y. Species differences in bile acids I. Plasma and urine bile acid composition. J. Appl. Toxicol. 2018, 38, 1323–1335. [Google Scholar] [CrossRef]
- Woolbright, B.L.; Antoine, D.J.; Jenkins, R.E.; Bajt, M.L.; Park, B.K.; Jaeschke, H. Plasma biomarkers of liver injury and inflammation demonstrate a lack of apoptosis during obstructive cholestasis in mice. Toxicol. Appl. Pharmacol. 2013, 273, 524–531. [Google Scholar] [CrossRef] [Green Version]
- Woolbright, B.L.; Jaeschke, H. Critical factors in the assessment of cholestatic liver injury in vitro. In Methods in Molecular Biology; Humana Press Inc.: New York, NY, USA, 2015; Volume 1250, pp. 363–376. [Google Scholar]
- Kmiec, Z. Cooperation of liver cells in health and disease. Adv. Anat. Embryol. Cell Biol. 2001, 161, 1–151. [Google Scholar]
- Parent, R.; Marion, M.J.; Furio, L.; Trépo, C.; Petit, M.A. Origin and Characterization of a Human Bipotent Liver Progenitor Cell Line. Gastroenterology 2004, 126, 1147–1156. [Google Scholar] [CrossRef]
- Fausto, N.; Campbell, J.S. The role of hepatocytes and oval cells in liver regeneration and repopulation. Mech. Dev. 2003, 120, 117–130. [Google Scholar] [CrossRef]
- Oh, S.H.; Hatch, H.M.; Petersen, B.E. Hepatic oval “stem” cell in liver regeneration. Semin. Cell Dev. Biol. 2002, 13, 405–409. [Google Scholar] [CrossRef] [PubMed]
- Ruch, R.J.; Trosko, J.E. The Role of Oval Cells and Gap Junctional Intercellular Communication in Hepatocarcinogenesis. Anticancer Res. 1999, 19, 4831–4838. [Google Scholar]
- Zhang, M.; Thorgeirsson, S.S. Modulation of connexins during differentiation of oval cells into hepatocytes. Exp. Cell Res. 1994, 213, 37–42. [Google Scholar] [CrossRef] [PubMed]
- Lotowska, J.; Sobaniec-Lotowska, M.; Lebensztejn, D.; Daniluk, U.; Sobaniec, P.; Sendrowski, K.; Daniluk, J.; Reszec, J.; Debek, W. Ultrastructural Characteristics of Rat Hepatic Oval Cells and Their Intercellular Contacts in the Model of Biliary Fibrosis: New Insights Into Experimental Liver Fibrogenesis. Gastroenterol. Res. Pract. 2017, 2017. [Google Scholar] [CrossRef] [PubMed]
- Mitchell, J.A.; Lye, S.J. Regulation of connexin43 expression by c-fos and c-jun in myometrial cells. Cell Adhes. Commun. 2000, 8, 299–302. [Google Scholar] [CrossRef] [PubMed]
- Lefebvre, D.L.; Piersanti, M.; Hui Bai, X.; Qing Chen, Z.; Lye, S.J. Myometrial transcriptional regulation of the gap junction gene, connexin-43. Reprod. Fertil. Dev. 1995, 7, 603–611. [Google Scholar] [CrossRef]
- Kanno, H.; Abe, T.; Saito, T.; Tsuchiya, T.; Miyazawa, M.; Suzuki, M.; Ishii, S.; Motoki, R.; Gotoh, M. Induction of immediate early genes after partial hepatectomy in cholestatic liver. J. Hepatobiliary. Pancreat. Surg. 2001, 8, 259–267. [Google Scholar] [CrossRef]
- Okada, K.; Shoda, J.; Taguchi, K.; Maher, J.M.; Ishizaki, K.; Inoue, Y.; Ohtsuki, M.; Goto, N.; Sugimoto, H.; Utsunomiy, H.; et al. Nrf2 counteracts cholestatic liver injury via stimulation of hepatic defense systems. Biochem. Biophys. Res. Commun. 2009, 389, 431–436. [Google Scholar] [CrossRef]
- Weerachayaphorn, J.; Mennone, A.; Soroka, C.J.; Harry, K.; Hagey, L.R.; Kensler, T.W.; Boyer, J.L. Nuclear factor-E2-related factor 2 is a major determinant of bile acid homeostasis in the liver and intestine. Am. J. Physiol. Gastrointest. Liver Physiol. 2012, 302, G925. [Google Scholar] [CrossRef] [Green Version]
- Crespo Yanguas, S.; da Silva, T.C.; Pereira, I.V.A.; Maes, M.; Willebrords, J.; Shestopalov, V.I.; Goes, B.M.; Sayuri Nogueira, M.; Alves de Castro, I.; Romualdo, G.R.; et al. Genetic ablation of pannexin1 counteracts liver fibrosis in a chemical, but not in a surgical mouse model. Arch. Toxicol. 2018, 92, 2607–2627. [Google Scholar] [CrossRef] [Green Version]
- Van Campenhout, R.; Yanguas, S.C.; Cooreman, A.; Gijbels, E.; Leroy, K.; Vilas-Boas, V.; Devoogdt, N.; Muyldermans, S.; Cogliati, B.; Vinken, M. Increased expression of adherens junction components in mouse liver following bile duct ligation. Biomolecules 2019, 9, 636. [Google Scholar] [CrossRef] [Green Version]
- Chatterjee, S.; Richert, L.; Augustijns, P.; Annaert, P. Hepatocyte-based in vitro model for assessment of drug-induced cholestasis. Toxicol. Appl. Pharmacol. 2014, 274, 124–136. [Google Scholar] [CrossRef] [PubMed] [Green Version]
- Maes, M.; Willebrords, J.; Yanguas, S.C.; Cogliati, B.; Vinken, M. Analysis of liver connexin expression using reverse transcription quantitative real-time polymerase chain reaction. In Methods in Molecular Biology; Humana Press Inc.: New York, NY, USA, 2016; Volume 1437, pp. 1–19. [Google Scholar]
- Livak, K.J.; Schmittgen, T.D. Analysis of relative gene expression data using real-time quantitative PCR and the 2-ΔΔCT method. Methods 2001, 25, 402–408. [Google Scholar] [CrossRef] [PubMed]
- Eaton, S.L.; Roche, S.L.; Llavero Hurtado, M.; Oldknow, K.J.; Farquharson, C.; Gillingwater, T.H.; Wishart, T.M. Total Protein Analysis as a Reliable Loading Control for Quantitative Fluorescent Western Blotting. PLoS ONE 2013, 8, e72457. [Google Scholar] [CrossRef]
- Cogliati, B.; Maes, M.; Pereira, I.V.A.; Willebrords, J.; Da Silva, T.C.; Crespo Yanguas, S.; Vinken, M. Immunohisto- and cytochemistry analysis of connexins. In Methods in Molecular Biology; Humana Press Inc.: New York, NY, USA, 2016; Volume 1437, pp. 55–70. [Google Scholar]


| Gene Symbol | Assay ID | Accession Number | Assay Location | Amplicon Size (Base Pairs) | Exon Boundary |
|---|---|---|---|---|---|
| Gjb1 | Mm01950058_s1 | NM_008124.2 | 466 | 65 | 1–1 |
| Gjb2 | Mm00433643_s1 | NM_008125.3 | 603 | 72 | 2–2 |
| Gja1 | Mm01179639_s1 | NM_010288.3 | 2937 | 168 | 2–2 |
| Actb | Mm00607939_s1 | NM_007393.3 | 1233 | 115 | 6–6 |
| B2m | Mm00437762_m1 | NM_009735.3 | 111 | 77 | 1–2 |
| Gapdh | Mm99999915_g1 | NM_008084.2 | 265 | 107 | 2–3 |
| Hmbs | Mm01143545_m1 | NM_013551.2 | 473 | 81 | 6–7 |
| Ubc | Mm02525934_g1 | NM_019639.4 | 370 | 176 | 2–2 |
| Gjb1 | Hs00939759_s1 | NM_000166.5 | 1547 | 63 | 2 |
| Gjb2 | Hs00269615_s1 | NM_004004.5 | 715 | 123 | 2 |
| Gja1 | Hs00748445_s1 | NM_000165.4 | 1031 | 142 | 2 |
| Actb | Hs01060665_g1 | NM_001101.3 | 208 | 63 | 2–3 |
| B2m | Hs00187842_m1 | NM_004048.2 | 134 | 64 | 1–2 |
| Gadph | Hs02786624_g1 | NM_001256799.2 | 870 | 157 | 7 |
| Hmbs | Hs00609296_g1 | NM_000190.3 | 1070 | 69 | 13–14 |
| Ubc | Hs01871556_s1 | M26880.1 | 2173 | 135 | / |
| Antigen | Dilution | |||
|---|---|---|---|---|
| IB | IHC | ICC | ||
| In Vitro | In Vivo | |||
| Cx26 | 1/250 | 1/250 | 1/250 | 1/250 |
| Cx32 | 1/600 | 1/1000 | 1/500 | 1/500 |
| Cx43 | 1/1000 | 1/1000 | 1/100 | 1/1000 |
| Nrf2 | 1/800 | 1/800 | / | / |
© 2020 by the authors. Licensee MDPI, Basel, Switzerland. This article is an open access article distributed under the terms and conditions of the Creative Commons Attribution (CC BY) license (http://creativecommons.org/licenses/by/4.0/).
Share and Cite
Cooreman, A.; Van Campenhout, R.; Crespo Yanguas, S.; Gijbels, E.; Leroy, K.; Pieters, A.; Tabernilla, A.; Van Brantegem, P.; Annaert, P.; Cogliati, B.; et al. Cholestasis Differentially Affects Liver Connexins. Int. J. Mol. Sci. 2020, 21, 6534. https://doi.org/10.3390/ijms21186534
Cooreman A, Van Campenhout R, Crespo Yanguas S, Gijbels E, Leroy K, Pieters A, Tabernilla A, Van Brantegem P, Annaert P, Cogliati B, et al. Cholestasis Differentially Affects Liver Connexins. International Journal of Molecular Sciences. 2020; 21(18):6534. https://doi.org/10.3390/ijms21186534
Chicago/Turabian StyleCooreman, Axelle, Raf Van Campenhout, Sara Crespo Yanguas, Eva Gijbels, Kaat Leroy, Alanah Pieters, Andrés Tabernilla, Pieter Van Brantegem, Pieter Annaert, Bruno Cogliati, and et al. 2020. "Cholestasis Differentially Affects Liver Connexins" International Journal of Molecular Sciences 21, no. 18: 6534. https://doi.org/10.3390/ijms21186534