Article

Predicting Carcinogenic Mechanisms of Non-Genotoxic Carcinogens via Combined Analysis of Global DNA Methylation and In Vitro Cell Transformation

1
Division of Life Sciences, College of Life Sciences and Bioengineering, Incheon National University, Incheon 22012, Korea
2
Institute for New Drug Development, Incheon National University, Incheon 22012, Korea
3
Department of Psychiatry, Korea University Anam Hospital, Korea University College of Medicine, Seoul 02841, Korea
4
College of Pharmacy and Medical Research Center, Chungbuk National University, Cheoungju-si, Chungcheongbuk-do 28160, Korea
5
INU Human Genome Center, Incheon National University, Incheon 22012, Korea
*
Authors to whom correspondence should be addressed.
Int. J. Mol. Sci. 2020, 21(15), 5387; https://doi.org/10.3390/ijms21155387
Submission received: 19 June 2020 / Revised: 17 July 2020 / Accepted: 27 July 2020 / Published: 29 July 2020
(This article belongs to the Section Molecular Toxicology)

Abstract

:
An in vitro cell transformation assay (CTA) is useful for the detection of non-genotoxic carcinogens (NGTXCs); however, it does not provide information on their modes of action. In this study, to pursue a mechanism-based approach in the risk assessment of NGTXCs, we aimed to develop an integrated strategy comprising an in vitro Bhas 42 CTA and global DNA methylation analysis. For this purpose, 10 NGTXCs, which were also predicted to be negative through Derek/Sarah structure–activity relationship analysis, were first tested for transforming activity in Bhas 42 cells. Methylation profiles using reduced representation bisulfite sequencing were generated for seven NGTXCs that were positive in CTAs. In general, the differentially methylated regions (DMRs) within promoter regions showed slightly more bias toward hypermethylation than the DMRs across the whole genome. We also identified 13 genes associated with overlapping DMRs within the promoter regions in four NGTXCs, of which seven were hypermethylated and six were hypomethylated. Using ingenuity pathway analysis, the genes with DMRs at the CpG sites were found to be enriched in cancer-related categories, including “cell-to-cell signaling and interaction” as well as “cell death and survival”. Moreover, the networks related to “cell death and survival”, which were considered to be associated with carcinogenesis, were identified in six NGTXCs. These results suggest that epigenetic changes supporting cell transformation processes occur during non-genotoxic carcinogenesis. Taken together, our combined system can become an attractive component for an integrated approach for the testing and assessment of NGTXCs.

Graphical Abstract

1. Introduction

Non-genotoxic carcinogens (NGTXCs) induce tumors through a variety of non-DNA-damaging mechanisms during carcinogenesis. Twelve percent (45/371) of IARC Group 1, 2A, and 2B carcinogens appear to be non-genotoxic [1]. NGTXCs are traditionally identified only in vivo in two-year rodent bioassays because there are currently no accurate or well validated in vitro assays. In vitro cell transformation assays (CTAs), which mimic different stages of the in vivo neoplastic process, have been reported to be useful for detecting possible NGTXCs [2,3]. In particular, CTAs using Bhas 42 cells are capable of detecting promotor activities without initiator treatment, and thus are superior to those of the BALB/c 3T3 CTA and other CTAs (Validation Study Report [4,5]). In recent years, the Bhas 42 CTA has undergone several comprehensive international validation studies [4,6,7] and is now the subject of an OECD guidance document [8].
The importance of a mechanism-based approach in the risk assessment of NGTXCs has risen. However, current CTAs do not provide information on key molecular events supporting the carcinogenesis process of NGTXCs. In fact, NGTXCs have a number of relatively diverse modes of action, including epigenetic alterations, tumor promotion, endocrine modulation, immune suppression, and inflammatory responses [1,9,10,11]. Owing to this diversity, it is impossible to detect all NGTXCs in one test system [1]. Presumably, the performance of a test battery to cover all the modes of action of NGTXCs is time-consuming and complex. Many studies have highlighted that the mode of action of NGTXCs may involve epigenetic alteration, including altered DNA methylation, histone modification, non-coding RNA, and chromatin remodeling [12,13]. With this, it has become clear that epigenetic dysregulation is a characteristic of virtually all human cancers [14]. Of these alterations, DNA methylation is demonstrably heritable [15], rendering DNA methylation the standard epigenetic marker [16]. Furthermore, changes in gene expression patterns based on altered DNA methylation have been linked to various cancers [17]. Using a massively parallel sequencing-based approach, it is relatively easy to generate comprehensive genome-wide methylation profiles. Reduced-representation bisulfite sequencing (RRBS) is an economical, accurate, and efficient method for analyzing the DNA methylation of a single base [18,19]. This method enriches the promoter and CpG island regions by methylation-insensitive restriction endonuclease digestion, providing a locus-specific methylation analysis for roughly 6–8% of the CpG loci in the human genome [20]. Moreover, several laboratories have combined in vitro CTAs with several endpoint applications, such as protein analysis [21] or whole-genome transcriptomic profiles [22,23], to elucidate cancer mechanisms in more detail. However, little has been reported on an integrated strategy consisting of the methylation analysis and in vitro CTA. We previously reported a method that couples the in vitro Bhas 42 CTA with methyl-CpG-binding domain protein sequencing (MBD-Seq) to utilize the CTA within an integrated approach for testing and assessment (IATA) for NGTXCs [24].
Herein, we analyzed the methylation profiles of transformed foci induced by seven NGTXCs using the RRBS method to distinguish the different modes of action of NGTXCs with the aim of predicting essential information regarding their carcinogenic mechanisms. Combining restriction enzymes and bisulfite sequencing, RRBS enriches genomic regions with a high CpG content [25]. Furthermore, RRBS can be applied to quickly identify aberrant methylation in cancer because this technique is highly sensitive [26]. As such, we provide information regarding the methylation signatures in foci during NGTXC-induced cell transformation and reveal, using ingenuity pathway analysis (IPA), that the genes with differentially methylated regions (DMRs) at CpG sites are linked to cancer-related categories in the enriched functional annotations. As far as we know, this study is among the first to elucidate a unique pathway associated with NGTXC-induced carcinogenesis based on a genome-wide methylation approach.

2. Results

2.1. Selection of Test Articles

The selection of 10 NGTXCs was based on carcinogenicity and genotoxicity reviews by previously published reports [5,27,28] (Table 1). The selected 10 NGTXCs were also predicted to be negative through Derek/Sarah analysis, which is accepted by regulators under International Conference on Harmonisation (ICH) guideline M7 on the assessment and control of DNA-reactive impurities in pharmaceuticals [29]. In particular, a structural alert for non-genotoxic carcinogenicity was noted in four NGTXCs (DEHP, TCDD, rosuvastatin, and sodium saccharin) by the OECD quantitative structure–activity relationship (QSAR) toolbox [30,31]. Table 2 lists the diversity in the modes of action of 10 NGTXCs. The non-genotoxic modes of action include the dysregulation of the hepatic iron metabolism, choline deficiency, peroxisome proliferation, and calculus formation.

2.2. Transformation Assay

As a first step towards the development of an integrated approach, the in vitro Bhas 42 CTA suggested by the OECD Working Group [8] was performed on 10 NGTXCs. Cell growth assays were conducted to identify the most suitable concentration of each test article for the Bhas 42 CTA (data not shown). Three independent assays were carried out to assess cytotoxicity. Five to seven concentrations of each NGTXC were established based on the results of the cell growth assay. The highest concentration for the cell growth assay was set to 10 mM or 2 mg/mL according to an OECD guidance document [8]. In the case of insoluble substances, the concentration range for the growth assay was set to include one concentration with a visible precipitate due to the limit of solubility. However, in the transformation assay for melamine, rosuvastatin, and D-limonene, no foci were formed even in the concentration range where no cytotoxicity was observed in the cell growth assay (data not shown). Thus, for these three test substances, the CTA was performed at a re-adjusted concentration range, which is low enough to form foci. The promoter activity of 10 NGTXCs was examined, and the results are summarized in Table 3. Among the 10 NGTXCs, three (D-limonene, melamine, and rosuvastatin) showed negative results in the promotion test. Sodium saccharin, methapyrilene, DEHP, diethanolamine (DEA), TCDD, and cholic acid induced a more than two-fold increase in foci formation, while okadaic acid led to a relatively weak increase.

2.3. Identification and Distribution of DMRs

To detect the critical methylation events associated with NGTXCs, we compared the DNA methylomes from seven Bhas 42 CTA-positive NGTXCs via RRBS analysis, which is an effective and economical method for analyzing the DNA methylation of a single base [18,19]. DMRs, defined as genomic regions exhibiting methylation differences with more than 20% changes between the samples (untransformed cells vs. transformed foci) at a CpG site and achieving a false discovery rate (FDR)-adjusted p-value < 0.05, were used for all the subsequent analyses. The complete list of DMRs associated with each NGTXC is included in Supplementary Tables S1–S7. The average number of DMRs identified in each NGTXC are 730–1574, with the exception of 3796 DMRs for DEHP and 288 DMRs for okadaic acid (OA). DMRs identified in OA were relatively low compared to other CTA-positive NGTXCs probably due to the low transforming activity of OA as shown in Table 3. We calculated the coefficient of correlation to investigate whether there was any relation between the number of DMRs and in vitro cell transformation. The number of DMRs appeared to be positively related to the number of foci formed in CTA, but the coefficient of correlation was low with the value of 0.4782. The scatter diagram and coefficient of correlation are presented in Supplementary Figure S1. Interestingly, of the 3796 DMRs in DEHP, 3081 DMRs (81%) were hypermethylated, while the remaining 715 (19%) were hypomethylated (Figure 1A). Conversely, in DEA-induced transformed foci, 730 significant DMRs were detected, of which 146 (20%) were hypermethylated and 583 (80%) were hypomethylated. The DMRs in the promoter region, which were defined as DMRs within 1500 bp upstream and 1500 bp downstream from the transcription start site (TSS), were then segregated on the basis of methylation status (Figure 1B). With the exception of DEHP, the DMRs in the promoter regions showed slightly more bias toward hypermethylation than DMRs throughout the whole genome. Figure 1C shows the heatmap of the DNA methylation level at DMRs specific for each NGTXC using hierarchical agglomerative clustering with complete linkage.
Then, the distributions of the DMRs from the RRBS data were compared in terms of the following seven genomic features: (i) promoters (DMR within 1500 bp upstream and 1500 bp downstream from TSS); (ii) exon; (iii) intron; (iv) 5′-UTR; (v) 3′-UTR; (vi) downstream (a 3-kb region downstream of transcription termination sites); and (vii) distal intergenic regions. The distribution patterns appeared to be relatively similar among the six NGTXCs, except for OA (Figure 1D). Almost 40% of the identified DMRs were associated with the gene body (exon + intron). DMRs located within the intergenic regions were almost 40%. We also discovered that, on average, 15% of the identified DMRs were located in promoter regions, which are crucial for gene expression regulation. However, in the case of OA, DMRs were observed in the promoter regions at a frequency of 26.4%.

2.4. Overlapping DMRs in Promoter Regions across NGTXCs

We focused on the DMRs in promoter regions that could be directly associated with gene expression. The overlapping DMRs with a methylation difference >20% and adjusted p-value < 0.05 in the promoter region (1500 bp upstream and 1500 bp downstream from the putative TSS) were selected. Of these shared DMRs in NGTXCs, the DMRs exhibiting methylation changes in the same direction were selected as “overlapping” DMRs. A complete list of the overlapping DMRs in promoter regions between each NGTXC is available in Supplemental Table S8. In particular, there were 59 overlapping DMRs in the promoter region between DEHP and CA. This accounts for 31% of the 188 DMRs found in CA. However, the mode of actions (MOAs) of DEHP and CA were peroxisome proliferators and xenobiotic metabolizing enzyme inhibitors, respectively, and there was no similarity between the non-genotoxic carcinogenic mechanisms. Only three DMRs were found between OA and SS. Table 4 lists the genes harboring the overlapping DMRs in four or more NGTXCs. The 13 genes associated with overlapping DMRs in four NGTXCs were identified, of which seven were hypermethylated and six hypomethylated. Although two genes (H2-D1 and Mir705) harboring overlapping DMRs were found to be significantly differentially methylated between the transformed foci and controls across the five NGTXCs, the roles of these genes in cancer have not yet been investigated.

2.5. Enriched Functional Annotation and Canonical Pathway

The functions associated with genes harboring DMRs identified for each NGTXC were annotated (Table 5). For enriched function annotation, we used a list of DMRs with more than 30% changes between the samples (controls vs. the transformed foci) at a CpG site and achieving an FDR-adjusted p-value < 0.05. In six NGTXCs, except SA, the genes with DMRs at CpG sites were significantly enriched in cancer-related categories, including “cancer”, “cell-to-cell signaling and interaction”, and “cell death and survival”, although these were not the most enriched categories. On the other hand, the genes harboring DMRs in SA were significantly related to connective tissue development and function (p = 1.93 × 10⁻⁵). Additionally, as shown in Table 6, several canonical pathways revealed the significant enrichment of the activation pathway of the retinoid acid receptor (RAR) and retinoid X receptor (RXR) families (in six NGTXCs), gustation pathways (in six NGTXCs), as well as the salvage pathway of pyrimidine ribonucleotides (in five NGTXCs), although these pathways were not observed as top hits. Overall, the annotations represent the trends of the malignant cell transformation of cells with NGTXC treatment.

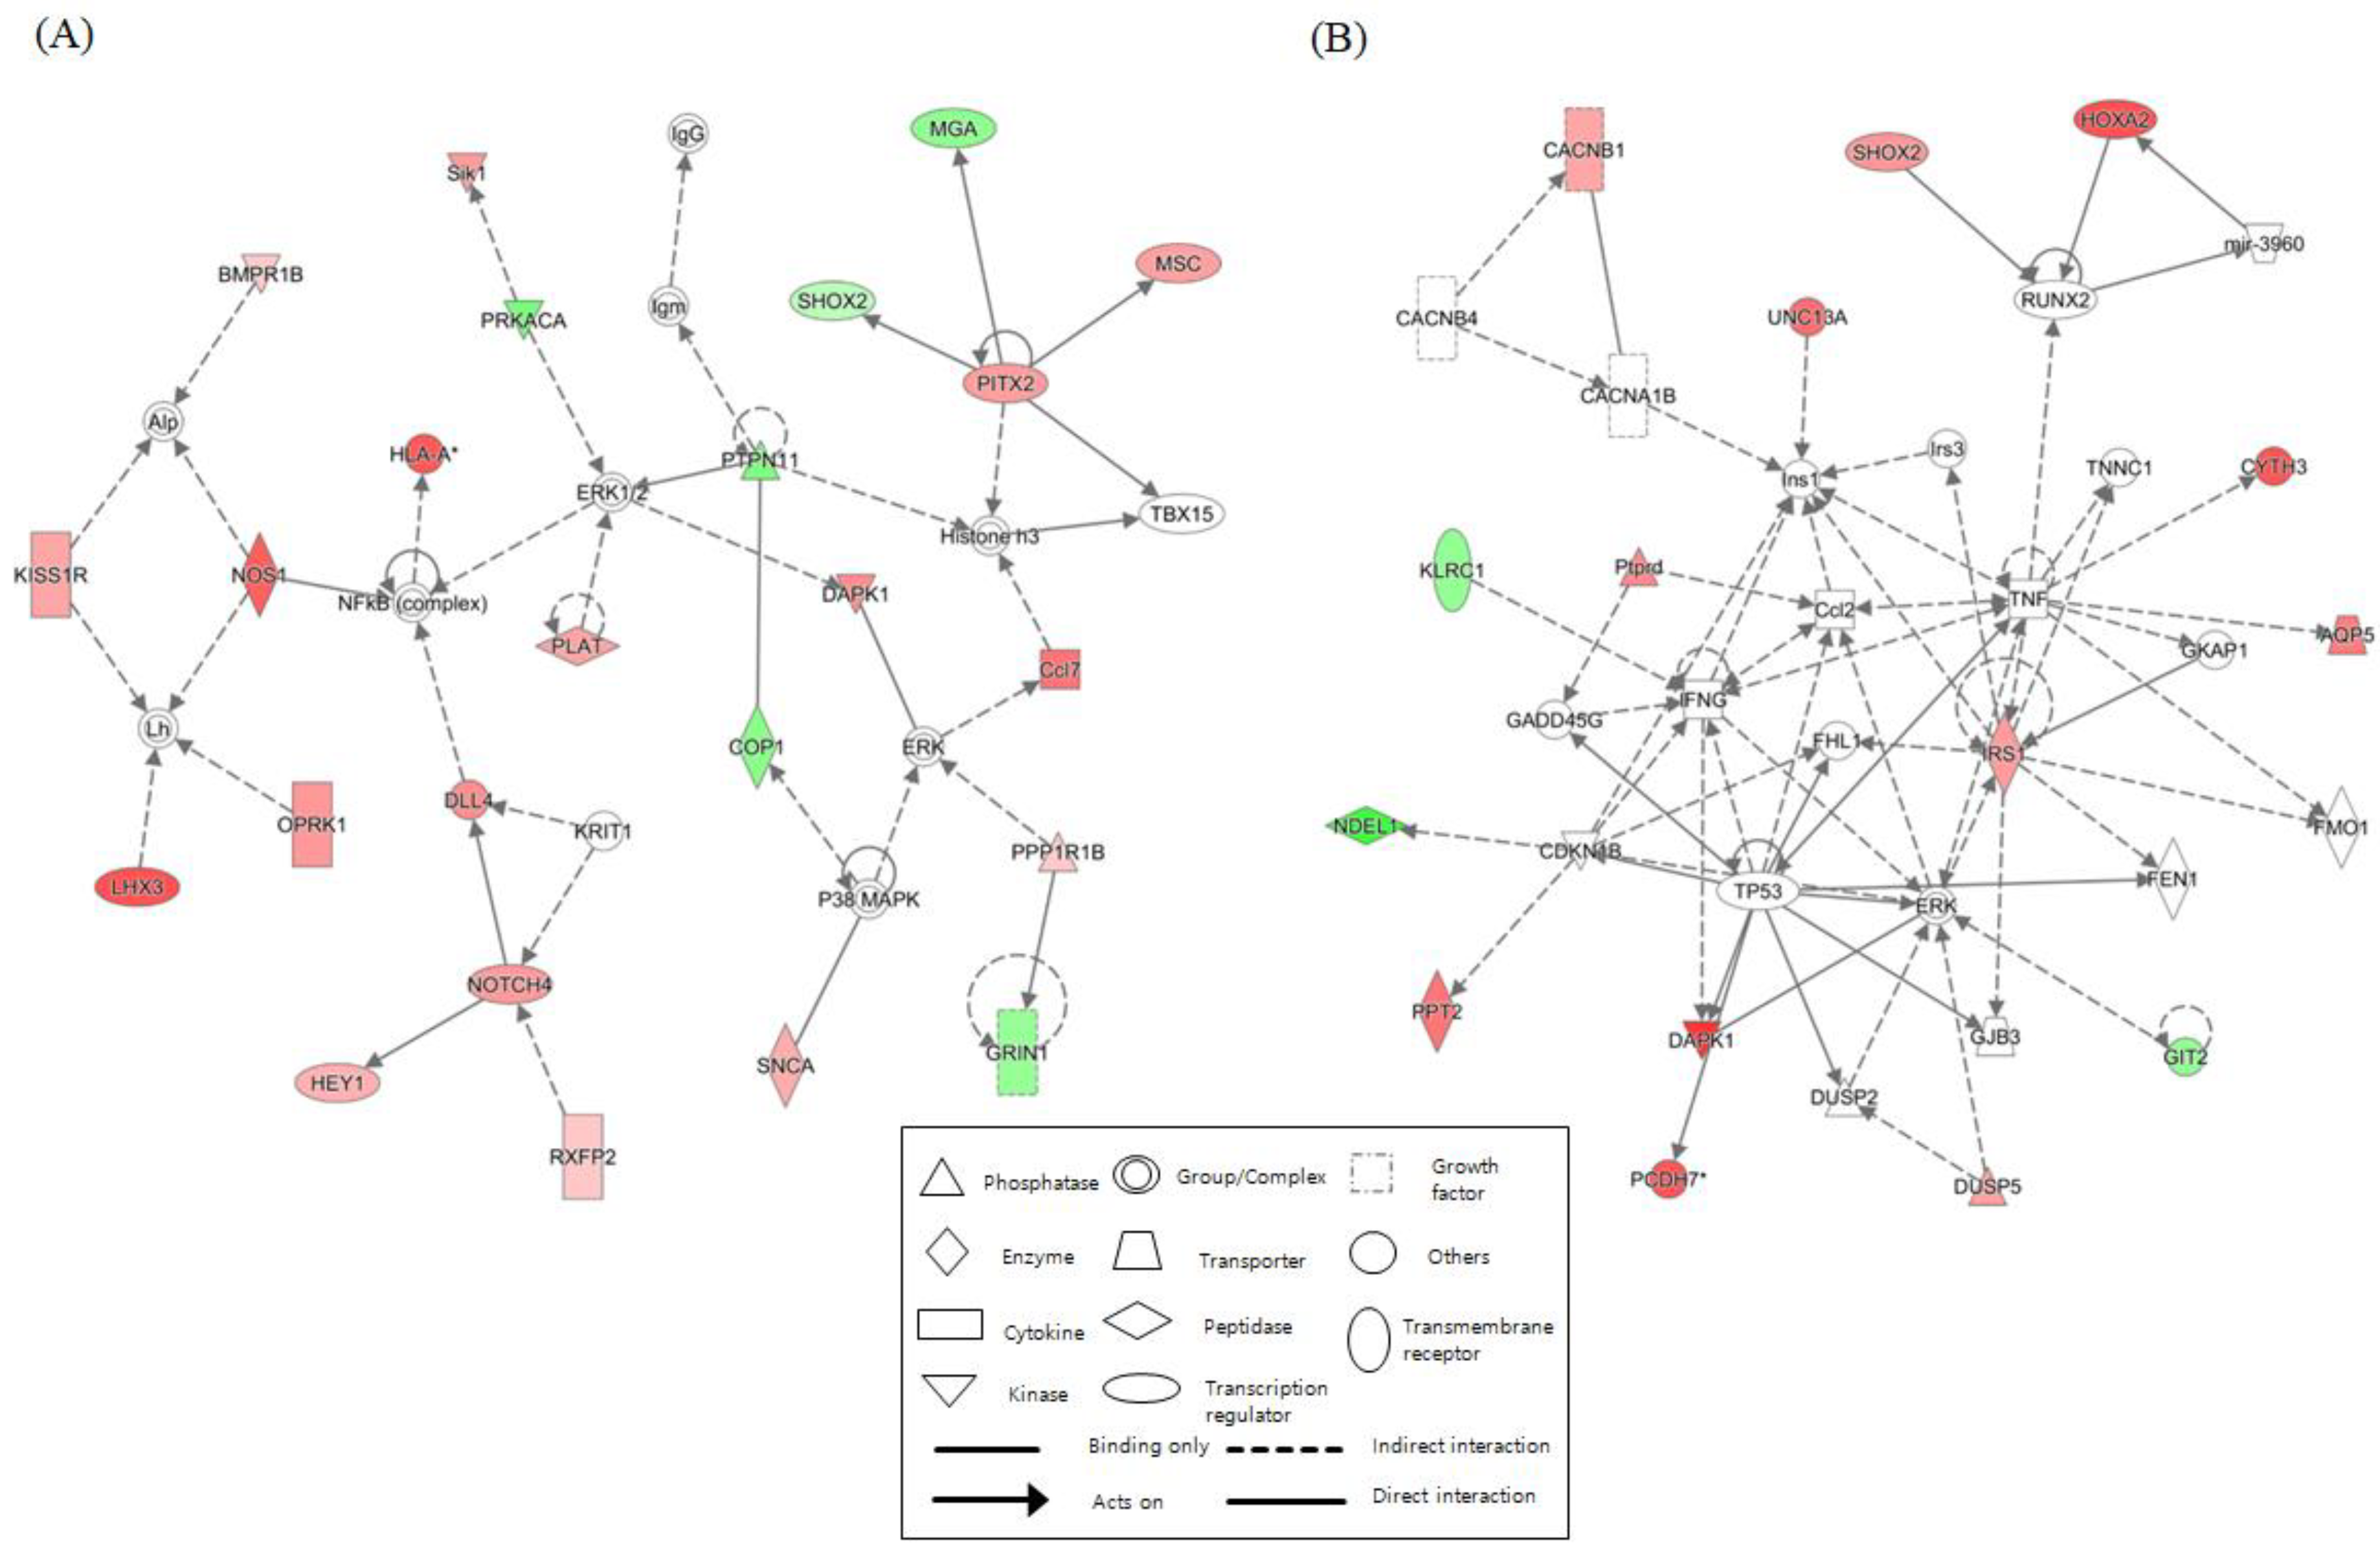
2.6. Network Identification

We identified networks with scores over 5 for each NGTXC. Figure 2 depicts the top two highest-scoring IPA-generated networks. One network (control vs. DEHP) with a score of 32, including genes for ERK1/2, NFκB (complex), NOS1, NOTCH4, PITX2, and PTPN11, was associated with cell-to-cell signaling and interaction, gene expression, nervous system development, and function. The other network (control vs. OA) with a score of 28 included genes for Ccl2, IFNG, IRS1, RUNX2, TNF, and TP53, was associated with cancer, cell death and survival, and organismal development. Networks related to “cell death and survival”, which were considered to be linked to carcinogenesis, were identified in the other six NGTXCs, except for CA. Supplementary Table S9 features detailed information, including the molecules, score, and focus molecules, for each network.

3. Discussion

Genotoxic carcinogens (GTXCs) can be detected with a battery of genotoxicity tests, such as the measurement of primary DNA damage. However, NGTXCs act through a large and diverse variety of different and specific mechanisms that do not involve direct interaction with DNA [1]. Thus, in contrast to GTXCs, a panel of assays addressing particular biological endpoints will be needed for the detection of NGTXCs [27]. There is cumulative evidence that the in vitro Bhas 42 CTA is suitable for detecting NGTXCs acting via non-genotoxic mechanisms (Validation Study Report [4,5]). However, in vitro CTA approaches do not provide information on the non-genotoxic mechanisms of carcinogenicity. Recently, it has been suggested that the development of an IATA could be the mechanistic basis for the carcinogenicity of NGTXCs [27]. IATA can include a combination of methods that includes in vitro testing, QSAR, and -omics technologies.
Here, in order to identify the epigenetic modifications associated with NGTXC-induced carcinogenesis, we provided an integrated strategy consisting of (QSAR), in vitro Bhas 42 CTA, and DNA methylomes employing RRBS analysis. DNA methylation is one of the most important epigenetic modifications because aberrant methylation patterns are associated with the development diseases like cancer [45,46]. RRBS is an efficient and high-throughput technique for analyzing genome-wide methylation profiles at a single nucleotide level [25]. In addition, RRBS has been used to study several human diseases, including cancer [47], neurodegenerative diseases [48], aging [49], and immunological diseases [50]. Ten test articles selected as NGTXCs in this study were also predicted to be negative through Derek/Sarah analysis. Among the 10 NGTXCs, seven had positive results in the promotion testing of the in vitro Bhas 42 CTA. The average number of DMRs identified in the CTA-positive NGTXCs was 730–1574, with the exception of 3796 DMRs for DEHP and 288 DMRs for OA. We also discovered that, on average, 15% of the identified DMRs were located in promoter regions, which are crucial for gene expression regulation. With the exception of DEHP, the DMRs in the promoter regions showed slightly more bias toward hypermethylation than DMRs across the whole genome. Moreover, the 13 genes associated with overlapping DMRs in four NGTXCs were identified, of which seven were hypermethylated and six hypomethylated. In particular, although two genes (H2-D1 and Mir705) harboring overlapping DMRs were found to be significantly differentially methylated between transformed foci and controls across the five NGTXCs, and the roles of these genes in cancer have not yet been investigated.
To identify the major genetic events and processes occurring during malignant cell transformation by NGTXCs, we examined enriched functional annotations. The IPA analysis showed that, in six NGTXCs, except SA, the genes with DMRs at CpG sites were highly enriched in cancer-related categories, including “cancer”, “cell-to-cell signaling and interaction”, and “cell death and survival”, although these were not the most enriched categories. Overall, the annotations represent the trends of the malignant cell transformation of the cells with NGTXC treatment. Interestingly, the potential contribution of the synaptic transmission and development throughout cell transformation by NGTXCs is evident from the enrichment of genes with annotations related to “cell-to-cell signaling and interaction”. Although immunological synapses have been described previously in the context of the immune escape of glioma [51], their role in cell transformation has not been determined as of yet.
Several canonical pathways were established to have a significant enrichment of the activation pathway of the RAR and RXR families (in six NGTXCs), gustation pathways (in six NGTXCs), as well as the salvage pathway of pyrimidine ribonucleotides (in five NGTXCs), though these pathways were not observed as top hits. With this, the cell growth and differentiation of malignant cells by retinoids has been reported to be regulated by RARs and RXRs [52]. In addition, our results are in line with previous reports indicating that gustation pathways and the salvage pathway of pyrimidine ribonucleotides were identified via IPA in cancer cells [53,54]. IPA also determined the functional networks relevant to NGTXC-induced cell transformation. The most significant network was defined as “cell-to-cell signaling and interaction” (with a score of 32), where genes including ERK1/2, NFκB (complex), NOS1, NOTCH4, PITX2, and PTPN11 are clustered. The second top-ranked network was “cell death and survival” (with a score of 28).
Taken together, we posit that the genes with DMRs at CpG sites in the transformed foci are linked to malignant cell transformation that the cells undergo during NGTXC treatment. Thus, the framework in this study demonstrated the possibility of using a combination of several tools to take advantage of an integrated approach. However, the functional annotations and canonical pathways identified through our IPA analysis did not exhibit a robust correlation with the modes of action previously reported for each NGTXC. Therefore, further study will be required for the development of a more efficient integrated approach that includes a methylation profile analysis.

4. Materials and Methods

4.1. Materials

The 10 NGTXCs used for the Bhas 42 CTA in this study were as follows: methapyrilene hydrochloride (MH) (CAS # 135-23-9), D-limonene (CAS # 5989-27-5), bis(2-ethylhexyl) phthalate (DEHP) (CAS # 117-81-7), 2,3,7,8-tetrachlorodibenzo-p-dioxin (TCDD) (CAS # 1746-01-6), okadaic acid (OA) (CAS # 78111-17-8), cholic acid (CA) (CAS # 81-25-4), diethanolamine (DEA) (CAS # 111-42-2), rosuvastatin (CAS # 287714-41-4), melamine (CAS # 108-78-1), and sodium saccharin (SA) (CAS # 128-44-9). All were obtained from Sigma-Aldrich (St. Louis, MO, USA). Dulbecco’s modified Eagle’s medium/F12 (DMEM/F12), minimum essential medium (MEM), and fetal bovine serum (FBS) were purchased from Thermo Fisher Scientific (Carlsbad, CA, USA). Crystal violet (CV) and Giemsa staining solution were purchased from Sigma-Aldrich. In addition, 12-O-tetradecanoylphorbol 13-acetate (TPA, CAS # 16561-29-8) was included as a positive control for the promotion assay. Test articles were dissolved in sterile distilled water or DMSO. The final concentration of distilled water was 1% in the culture medium, and that of DMSO was 0.1%.

4.2. Cell Lines and Cell Culture

Bhas 42 cells, which were established from the BALB/c 3T3 cells through transfection with the v-Ha-ras gene [55], were obtained from the Japan Health Sciences Foundation Health Science Research Resources Bank (Osaka, Japan). As previously described [24], the cells were grown in MEM supplemented with 10% FBS (M10F). Only 60–70% of the confluent cells were sub-cultured. The cells were cultured in a humidified incubator under 5% CO2 and 95% O2. Three days prior to treatment with test articles, Bhas 42 cells were maintained in DMEM/F12 supplemented with 5% FBS (DF5F).

4.3. Cell Growth Assay

The cell growth assays were performed prior to the transformation assays to determine the appropriate treatment concentrations of the test articles, as well as concurrently with every transformation assay to estimate the effect of the test articles on cell growth and survival. The cells were seeded, treated with a test article, and cultured until day 7. Three wells were prepared for each treatment group. On day 7, the cells were fixed with 10% formalin and stained with a 0.1% CV solution in 5% ethanol. CV was extracted from the stained cells with a solution containing 0.02 mol/L hydrochloric acid in 50% ethanol. The optical density of the extract was measured at a wavelength between 540 and 570 nm.

4.4. In Vitro Bhas 42 CTA for the Promotion Test

The in vitro transformation assays were conducted according to the procedures reported by Sakai et al. [7] with slight modifications. The Bhas 42 cells were seeded into each well of 6-well microplates at 2 mL volumes (7000 cells/well, day 0). Six wells were prepared for each treatment group. The cells were cultured for four days without medium exchange. On day 4, day 7, and day 11, the culture medium was replaced with fresh medium containing a test article or vehicle alone, and the treatment in the promotion phase was continued until day 14. The media were not changed during the last 7 days of culture. The cells were then fixed with methanol and stained with Giemsa solution.

4.5. Isolation of Transformed Foci

For the methylation profiling analysis, the foci that formed in the culture dish were cloned with cloning cylinders (6 mm internal diameter, 8 mm external diameter, 8 mm length). The foci were inspected, and the desired foci were circled. Growth medium was removed from the dish and cells washed with PBS. Then, a sterile cloning cylinder with one edge coated with silicone grease was placed around the selected focus, and 40 μL of trypsin was added to the cloning cylinder well. Cell lines were established from each focus, which were placed in 6-well plates containing M10F. After cellular growth for 10 to 15 days with frequent changes of medium, the genomic DNA from one established cell line was analyzed for methylation with RRBS.

4.6. Genomic DNA Extraction and Reduced-Representation Bisulfite Sequencing (RRBS)

For the whole-genome DNA, RRBS was performed by C&K Genomics, Inc. (Seoul, Korea) Briefly, genomic DNA was quantified in a Victor2 spectrophotometer (PerkinElmer, Boston, MA, USA) using the Quant-iT™ PiboGreen™ RNA Assay Kit (Invitrogen, Carlsbad, CA, USA) according to the manufacturer’s protocol. To construct the Msp1 and Apek1 digested RRBS library, 500 ng of genomic DNA was incubated at 37 °C for 24 h. The digested products were purified with a MinElute PCR Purification Kit (Qiagen, Valencia, SC, USA). After purification, the digested products were blunt-ended, and then the dA was added, followed by methylated-adapter ligation. A range of 160–420 adapter-ligated fractions was excised from a 2% agarose gel. Bisulfite conversion was conducted using a ZYMO EZ DNA Methylation-Gold Kit™ (ZYMO research, Irvine, CA, USA) following the manufacturer’s instructions. The final libraries were generated by PCR amplification using PfuTurbo Cx Hotstart DNA Polymerase (Agilent Technologies, Santa Clara, CA, USA). RRBS libraries were evaluated by an Agilent 2100 Bioanalyzer (Agilent Technologies, Palo Alto, CA, USA). Libraries were quantified by qPCR using the CFX96 Real-Time System (Bio-Rad, Hercules, CA, USA). After normalization, the sequencing of the prepared library was conducted on the Nextseq system (Illumina, San Diego, CA, USA) with 75-bp paired-end reads.

4.7. RRBS Data Analysis

RRBS data were preprocessed by the following steps. Briefly, low-quality adapter sequences in the raw reads were trimmed using TrimGalore (version 0.6.5) with Cutadapt (version 1.18) [56]. Quality checks of the clean data were conducted with FastQC (version 0.11.5), then high-quality reads were mapped to the reference genome (Mouse genome assembly GRCm38.p6) using Bismark (version 0.22.3) with bowtie2 (version 2.3.5) [57]. Data quality was shown in Supplementary Table S10. During the NGTXC-induced cell transformation, the DMRs were identified using DMRcaller (version 1.18.0), which uses the Bismark output data as input [58]. We considered 100-bp tilling bins for computing the differentially methylated cytosines, and performed a score test between the methylated and total reads in a bin for the samples (untransformed cells vs. transformed foci). We selected the bins where the FDR-adjusted p-value was less than 0.05 and the difference in level of methylation was at least 20% in the CG context, containing at least four cytosines (with at least four reads per cytosine). The identified DMRs were annotated using ChipSeeker [59] with gene annotation information from the R package TxDb.Mmusculus.UCSC.mm10.knownGene and org.Mm.eg.db [60]. Promoters were defined as the DMRs within 1500 bp upstream and 1500 bp downstream from the TSS.

4.8. Molecular Network, Pathway, and Functional Analysis

Enriched functional annotation, gene network identification, and canonical pathway analysis (generalized pathways that represent the common properties of a particular signaling module or pathway) were performed using Ingenuity Pathway Analysis software (Ingenuity Systems, Redwood City, USA). We utilized a list of DMRs with more than 30% changes between the samples (controls vs. transformed foci) at a CpG site and achieving an FDR-adjusted p-value < 0.05. The networks were identified using the scores calculated for each network according to the fit of the network to the set of the focus genes of the ingenuity analysis. The significance of the biofunctions and canonical pathways were tested by p-value. In addition, the canonical pathways were ranked by the ratio (number of genes from the input DMR data that maps to the pathway divided by the total number of molecules that exist in the canonical pathway).

Supplementary Materials

Supplementary materials can be found at https://www.mdpi.com/1422-0067/21/15/5387/s1. Table S1. List of DMRs associated with cholic acid (CA); Table S2. List of DMRs associated with bis(2-ethylhexyl) phthalate (DEHP); Table S3. List of DMRs associated with okadaic acid (OA); Table S4. List of DMRs associated with 2,3,7,8-tetrachlorodibenzo-p-dioxin (TCDD); Table S5. List of DMRs associated with diethanolamine (DEA); Table S6. List of DMRs associated with methapyrilene hydrochloride (MH); Table S7. List of DMRs associated with sodium saccharin (SS). Table S8; List of overlapping DMRs in a promoter region between each NGTXC. Table S9; Networks with a score with scores over 5 in each NGTXC. Table S10; Summary of the data quality of RRBS performance. Figure S1. Association between DMRs and cell transformation.

Author Contributions

Conceptualization, M.L. and Y.-M.L.; data curation, S.-H.H.; formal analysis, M.-R.H. and M.L.; funding acquisition, M.L.; investigation, S.-H.H., H.Y. and B.-I.H.; methodology, S.-H.H., Y.-M.L., M.-R.H. and M.L.; resources, Y.-M.L., B.-J.H., M.-R.H. and M.L.; software, M.-R.H. and Y.-M.L.; supervision, M.L.; validation, M.L.; visualization, S.-H.H., M.-R.H. and M.L.; writing—original draft: S.-H.H., M.-R.H. and M.L.; writing—review and editing: M.-R.H. and M.L. All authors have read and agreed to the published version of the manuscript.

Funding

This research was supported by a grant (18182MFDS367) from Korea’s Ministry of Food and Drug Safety in 2019 and by the National Research Foundation of Korea (NRF) grant funded by the Ministry of Science and ICT (MIST) (NRF-2019R1F1A1048733). The content is solely the responsibility of the authors and does not necessarily represent the official views of the Ministry of Food and Drug Safety. This research was also supported by the Collaborative Genome Program for Fostering New Post-Genome Industry of the National Research Foundation (NRF) funded by the Ministry of Science and ICT (MSIT) (NRF-2017M3C9A6047623).

Conflicts of Interest

The authors declare no conflict of interest.

Abbreviations

CTAIn vitro cell transformation
NGTXCNon-genotoxic carcinogen
DMRDifferentially methylated region
RRBSReduced-representation bisulfate sequencing
IATAIntegrated approach to testing and assessment
IPAIngenuity pathway analysis
QSARQuantitative structure–activity relationship
MHMethapyrilene hydrochloride
DEHPBis(2-ethylhexyl) phthalate
TCDD2,3,7,8-tetrachlorodibenzo-p-dioxin
OAOkadaic acid
CACholic acid
DEADiethanolamine
SASodium saccharin

References

  1. Hernández, L.G.; van Steeg, H.; Luijten, M.; van Benthem, J. Mechanisms of non-genotoxic carcinogens and importance of a weight of evidence approach. Mutat. Res. 2009, 682, 94–109. [Google Scholar] [CrossRef] [PubMed]
  2. Kakunaga, T. A quantitative system for assay of malignant transformation by chemical carcinogens using a clone derived from Balb 3T3. Int. J. Cancer 1973, 12, 463–473. [Google Scholar] [CrossRef] [PubMed]
  3. Meyer, A.L. In vitro transformation assays for chemical carcinogens. Mutat. Res. 1983, 115, 323–338. [Google Scholar] [CrossRef]
  4. Hayashi, M.; Kojima, H.; Corvi, R.; Stokes, W.; Jacobs, A.; Morita, T.; Schechtman, L.; Suzuki, A. The Validation Management Team Report on the Bhas 42 CTA; EURL ECVAM Recommendations; EU Reference Laboratory for Alternatives to Animal Testing: Ispra, Italy, 2012. [Google Scholar]
  5. Sakai, A.; Sasaki, K.; Muramatsu, D.; Arai, S.; Endou, N.; Kuroda, S.; Hayashi, K.; Lim, Y.M.; Yamazaki, S.; Umeda, M.; et al. A Bhas 42 cell transformation assay on 98 chemicals: The characteristics and performance for the prediction of chemical carcinogenicity. Mutat. Res. 2010, 702, 100–122. [Google Scholar] [CrossRef]
  6. Tanaka, N.; Sasaki, K.; Hayashi, K.; Sakai, A.; Asada, S.; Muramatsu, D.; Kuroda, S.; Mizuhashi, F.; Nagai, M.; Suzuki, H.; et al. An international collaborative study on a cell transformation assay using Bhas 42 cells. AATEX 2009, 14, 831–848. [Google Scholar]
  7. Sakai, A.; Sasaki, K.; Hayashi, K.; Muramatsu, D.; Arai, S.; Endou, N.; Kuroda, S.; Poth, A.; Bohnenberger, S.; Kunkelmann, T.; et al. An international validation study of a Bhas 42 cell transformation assay for the prediction of chemical carcinogenicity. Mutat. Res. 2011, 725, 57–77. [Google Scholar] [CrossRef]
  8. OECD. Organisation for Economic and Cooperative Development. Guidance Document on the in vitro Bhas 42 cell transformation assay. Series on Testing and Assessment. No. 231. Paris. 2016. Available online: https://www.oecd.org/env/ehs/testing/ENV_JM_MONO(2016)1.pdf (accessed on 3 December 2016).
  9. Melnick, R.L.; Kohn, M.C.; Portier, C.J. Implications for risk assessment of suggested nongenotoxic mechanisms of chemical carcinogenesis. Environ. Health Perspect. 1996, 104 (Suppl. 1), 123–134. [Google Scholar]
  10. Hattis, D.; Chu, M.; Rahmioglu, N.; Goble, R.; Verma, P.; Hartman, K.; Kozlak, M. A preliminary operational classification system for nonmutagenic modes of action for carcinogenesis. Crit. Rev. Toxicol. 2009, 39, 97–138. [Google Scholar] [CrossRef]
  11. Waters, M.D.; Jackson, M.; Lea, I. Characterizing and predicting carcinogenicity and mode of action using conventional and toxicogenomics methods. Mutat. Res. 2010, 705, 184–200. [Google Scholar] [CrossRef]
  12. Portela, A.; Esteller, M. Epigenetic modifications and human disease. Nat. Biotechnol. 2010, 28, 1057–1068. [Google Scholar] [CrossRef]
  13. Herceg, Z.; Lambert, M.P.; van Veldhoven, K.; Demetriou, C.; Vineis, P.; Smith, M.T.; Straif, K.; Wild, C.P. Towards incorporating epigenetic mechanisms into carcinogen identification and evaluation. Carcinogenesis 2013, 34, 1955–1967. [Google Scholar] [CrossRef] [PubMed] [Green Version]
  14. Pfister, S.X.; Ashworth, A. Marked for death: Targeting epigenetic changes in cancer. Nat. Rev. Drug Discov. 2017, 16, 241–263. [Google Scholar] [CrossRef] [PubMed]
  15. Goyal, R.; Reinhardt, R.; Jeltsch, A. Accuracy of DNA methylation pattern preservation by the Dnmt1 methyltransferase. Nucleic Acids Res. 2006, 34, 1182–1188. [Google Scholar] [CrossRef] [PubMed] [Green Version]
  16. Greally, J.M.; Jacobs, M.N. In vitro and in vivo testing methods of epigenomic endpoints for evaluating endocrine disruptors. ALTEX 2013, 30, 445–471. [Google Scholar] [CrossRef] [PubMed] [Green Version]
  17. Pan, Y.; Liu, G.; Zhou, F.; Su, B.; Li, Y. DNA methylation profiles in cancer diagnosis and therapeutics. Clin. Exp. Med. 2018, 18, 1–14. [Google Scholar] [CrossRef]
  18. Meissner, A.; Mikkelsen, T.S.; Gu, H.; Wernig, M.; Hanna, J.; Sivachenko, A.; Zhang, X.; Bernstein, B.E.; Nusbaum, C.; Jaffe, D.B.; et al. Genome-scale DNA methylation maps of pluripotent and differentiated cells. Nature 2008, 454, 766–770. [Google Scholar] [CrossRef] [Green Version]
  19. Van Gurp, T.P.; Wagemaker, N.C.; Wouters, B.; Vergeer, P.; Ouborg, J.N.; Verhoeven, K.J. epiGBS: Reference-free reduced representation bisulfite sequencing. Nat. Methods 2016, 13, 322–324. [Google Scholar] [CrossRef]
  20. Walker, D.L.; Bhagwate, A.V.; Baheti, S.; Smalley, R.L.; Hilker, C.A.; Sun, Z.; Cunningham, J.M. DNA methylation profiling: Comparison of genome-wide sequencing methods and the Infinium Human Methylation 450 Bead Chip. Epigenomics 2015, 7, 1287–1302. [Google Scholar] [CrossRef]
  21. Poburski, D.; Thierbach, R. Improvement of the BALB/c-3T3 cell transformation assay: A tool for investigating cancer mechanisms and therapies. Sci. Rep. 2016, 6, 32966. [Google Scholar] [CrossRef]
  22. Chang, C.; Xi, L.; Zhang, J.; Zhao, W.; Liu, Z.; Guo, J.; Xu, C. Roles of Cyclin A, Myc, Jun and Ppm1l in tumourigenic transformation of NIH3T3 cell. J. Genet. 2018, 97, 1155–1168. [Google Scholar] [CrossRef]
  23. Vaccari, M.; Mascolo, M.G.; Rotondo, F.; Morandi, E.; Quercioli, D.; Perdichizzi, S.; Zanzi, C.; Serra, S.; Poluzzi, V.; Angelini, P.; et al. Identification of pathway-based toxicity in the BALB/c 3T3 cell model. Toxicol. In Vitro 2015, 29, 1240–1253. [Google Scholar] [CrossRef]
  24. Hwang, S.-H.; Yeom, H.; Eom, S.Y.; Lee, Y.-M.; Lee, M. Genome-wide DNA methylation changes in transformed foci induced by non-genotoxic carcinogens. Environ. Mol. Mutagen. 2019, 60, 576–587. [Google Scholar] [CrossRef]
  25. Meissner, A.; Gnirke, A.; Bell, G.W.; Ramsahoye, B.; Lander, E.S.; Jaenisch, R. Reduced representation bisulfite sequencing for comparative high-resolution DNA methylation analysis. Nucleic. Acids Res. 2005, 33, 5868–5877. [Google Scholar] [CrossRef] [PubMed] [Green Version]
  26. Smith, Z.D.; Gu, H.; Bock, C.; Gnike, A.; Meissner, A. High-throughput bisulfite sequencing in mammalian genomes. Methods 2009, 48, 226–232. [Google Scholar] [CrossRef] [Green Version]
  27. Jacobs, M.N.; Colacci, A.; Louekari, K.; Luijten, M.; Hakkert, B.C.; Paparella, M.; Vasseur, P. International regulatory needs for development of an IATA for non-genotoxic carcinogenic chemical substances. ALTEX 2016, 33, 359–392. [Google Scholar] [CrossRef] [PubMed] [Green Version]
  28. Kirkland, D.; Kasper, P.; Martus, H.J.; Müller, L.; van Benthem, J.; Madia, F.; Corvi, R. Updated recommended lists of genotoxic and non-genotoxic chemicals for assessment of the performance of new or improved genotoxicity tests. Mutat. Res. Genet. Toxicol. Environ. Mutagen. 2016, 795, 7–30. [Google Scholar] [CrossRef] [PubMed]
  29. ICH. M7: Assessment and Control of DNA Reactive (Mutagenic) Impurities in Pharmaceuticals to Limit Potential Carcinogenic Risk; ICH: Geneva, Switzerland, 2015. [Google Scholar]
  30. Van Leeuwen, K.; Schultz, T.W.; Henry, T.; Diderich, B.; Veith, G.D. Using chemical categories to fill data gaps in hazard assessment. SAR QSAR Environ. Res. 2009, 20, 207–220. [Google Scholar] [CrossRef]
  31. Benigni, R.; Bossa, C.; Tcheremenskaia, O. In vitro cell transformation assays for an integrated, alternative assessment of carcinogenicity: A data-based analysis. Mutagenesis 2013, 28, 107–116. [Google Scholar] [CrossRef] [PubMed]
  32. NTP. NTP Technical Report on the Hepatotoxicity Studies of the Liver Carcinogen: Methapyrilene Hydrochloride; Toxicity Report Series 46; National Institute of Environmental Health Sciences: Durham, UK, 2000. [Google Scholar]
  33. NTP. NTP Technical Report on the Toxicology and Carcinogenesis Studies of 2,3,7,8-Tetrachlorodibenzo-P-Dioxin (TCDD) (CAS No. 1746-01-6) in Female Harlan Sprague-Dawley Rats (Gavage Studies); Natl. Toxicol. Program Tech. Rep. 521; National Institute of Environmental Health Sciences: Durham, UK, 2006. [Google Scholar]
  34. Aonuma, S.; Ushijima, T.; Nakayasu, M.; Shima, H.; Sugimura, T.; Nagao, M. Mutation induction by okadaic acid, a protein phosphatase inhibitor, in CHL cells, but not in S. typhimurium. Mutat. Res. 1991, 250, 375–381. [Google Scholar] [CrossRef]
  35. Kindrat, I.; Dreval, K.; Shpyleva, S.; Tryndyak, V.; de Conti, A.; Mudalige, T.K.; Chen, T.; Erstenyuk, A.M.; Beland, F.A.; Pogribny, I.P. Effect of methapyrilene hydrochloride on hepatic intracellular iron metabolism in vivo and in vitro. Toxicol. Lett. 2017, 281, 65–73. [Google Scholar] [CrossRef]
  36. Lehman-McKeeman, L.D.; Rodriguez, P.A.; Takigiku, R.; Caudill, D.; Fey, M.L. d-Limonene-induced male rat-specific nephrotoxicity: Evaluation of the association between d-limonene and alpha 2u-globulin. Toxicol. Appl. Pharmacol. 1989, 99, 250–259. [Google Scholar] [CrossRef]
  37. Ito, Y.; Nakajima, T. PPARalpha- and DEHP-Induced Cancers. PPAR Res. 2008, 2008, 759716. [Google Scholar] [CrossRef] [PubMed] [Green Version]
  38. Mandal, P.K. Dioxin: A review of its environmental effects and its aryl hydrocarbon receptor biology. J. Comp. Physiol. B 2005, 175, 221–230. [Google Scholar] [CrossRef] [PubMed]
  39. Fujiki, H.; Suganuma, M.; Yoshizawa, S.; Nishiwaki, S.; Winyar, B.; Sugimura, T. Mechanisms of action of okadaic acid class tumor promoters on mouse skin. Environ. Health Perspect. 1991, 93, 211–214. [Google Scholar] [CrossRef] [PubMed]
  40. Baijal, P.K.; Fitzpatrick, D.W.; Bird, R.P. Modulation of colonic xenobiotic metabolizing enzymes by feeding bile acids: Comparative effects of cholic, deoxycholic, lithocholic and ursodeoxycholic acids. Food Chem. Toxicol. 1998, 36, 601–607. [Google Scholar] [CrossRef]
  41. Zeisel, S.H. Choline. A nutrient that is involved in the regulation of cell proliferation, cell death, and cell transformation. Adv. Exp. Med. Biol. 1996, 399, 131–141. [Google Scholar]
  42. AstraZeneca. Crestor (rosuvastatin calcium) Tablets; Full Prescribing Information” (PDF); AstraZeneca: Cambridge, UK, 2016. [Google Scholar]
  43. Cohen, S.M.; Ellwein, L.B. Genetic errors, cell proliferation, and carcinogenesis. Cancer Res. 1991, 51, 6493–6505. [Google Scholar]
  44. Chappel, C.I. A review and biological risk assessment of sodium saccharin. Regul. Toxicol. Pharmacol. 1992, 15, 253–270. [Google Scholar] [CrossRef]
  45. Hao, X.; Luo, H.; Krawczyk, M.; Wei, W.; Wang, W.; Wang, J.; Flagg, K.; Hou, J.; Zhang, H.; Yi, S.; et al. DNA methylation markers for diagnosis and prognosis of common cancers. Proc. Natl. Acad. Sci. USA 2017, 114, 7414–7419. [Google Scholar] [CrossRef] [Green Version]
  46. Stieglitz, E.; Mazor, T.; Olshen, A.B.; Geng, H.; Gelston, L.C.; Akutagawa, J.; Lipka, D.B.; Plass, C.; Flotho, C.; Chehab, F.F.; et al. Genome-wide DNA methylation is predictive of outcome in juvenile myelomonocytic leukemia. Nat. Commun. 2017, 8, 2127. [Google Scholar] [CrossRef] [Green Version]
  47. Kim, H.J.; Kang, T.W.; Haam, K.; Kim, M.; Kim, S.K.; Kim, S.Y.; Lee, S.I.; Song, K.S.; Jeong, H.Y.; Kim, Y.S. Whole genome MBD-seq and RRBS analyses reveal that hypermethylation of gastrointestinal hormone receptors is associated with gastric carcinogenesis. Exp. Mol. Med. 2018, 50, 156. [Google Scholar] [CrossRef] [PubMed]
  48. Ng, C.W.; Yildirim, F.; Yap, Y.S.; Dalin, S.; Matthews, B.J.; Velez, P.J.; Labadorf, A.; Housman, D.E.; Fraenkel, E. Extensive Changes in DNA Methylation are Associated with Expression of Mutant Huntingtin. Proc. Natl. Acad. Sci. USA 2013, 110, 2354–2359. [Google Scholar] [CrossRef] [PubMed] [Green Version]
  49. Gervin, K.; Andreassen, B.K.; Hjorthaug, H.S.; Carlsen, K.C.L.; Carlsen, K.-H.; Undlien, D.E.; Lyle, R.; Munthe-Kaas, C. Intra-individual Changes in DNA Methylation Not Mediated by Cell-Type Composition Are Correlated with Aging During Childhood. Clin. Epigenerics 2016, 8, 110. [Google Scholar] [CrossRef] [Green Version]
  50. Caution, K.; Pan, A.; Krause, K.; Badr, A.; Hamilton, K.; Vaidya, A.; Gosu, H.; Daily, K.; Estfanous, S.; Gavrilin, M.A.; et al. Methylomic Correlates of Autophagy Activity in Cystic Fibrosis. J. Cyst. Fibros. 2019, 18, 491–500. [Google Scholar] [CrossRef] [PubMed] [Green Version]
  51. Díaz, L.R.; Saavedra-López, E.; Romarate, L.; Mitxitorena, I.; Casanova, P.V.; Cribaro, G.P.; Gallego, J.M.; Pérez-Vallés, A.; Forteza-Vila, J.; Alfaro-Cervello, C.; et al. Imbalance of immunological synapse-kinapse states reflects tumor escape to immunity in glioblastoma. JCI Insight 2018, 3, e120757. [Google Scholar] [CrossRef] [PubMed]
  52. Yang, Q.; Sakurai, T.; Kakudo, K. Retinoid, Retinoic Acid Receptor Beta and Breast Cancer. Breast Cancer Res. Treat. 2002, 76, 167–173. [Google Scholar] [CrossRef]
  53. Parris, T.Z.; Vizlin-Hodzic, D.; Salmela, S.; Funa, K. Tumorigenic effects of TLX overexpression in HEK 293T cells. Cancer Rep. 2019, 2, e1204. [Google Scholar] [CrossRef]
  54. Lanceta, L.; O’Neill, C.; Lypova, N.; Li, X.; Rouchka, E.; Waigel, S.; Gomez-Gutierrez, J.G.; Chesney, J.; Imbert-Fernandez, Y. Transcriptomic Profiling Identifies Differentially Expressed Genes in Palbociclib-Resistant ER+ MCF7 Breast Cancer Cells. Genes 2020, 11, 467. [Google Scholar] [CrossRef]
  55. Sasaki, K.; Mizusawa, H.; Ishidate, M. Isolation and characterization of ras-transfected BALB/3T3 clone showing morphological transformation by 12-O-tetradecanoyl-phorbol-13-acetate. Jpn. J. Cancer Res. 1988, 79, 921–930. [Google Scholar] [CrossRef]
  56. Martin, M. Cutadapt Removes Adapter Sequences from High-Throughput Sequencing Reads. EMBnet. J. 2011, 17, 10–12. [Google Scholar] [CrossRef]
  57. Krueger, F.; Andrews, S.R. Bismark: A flexible aligner and methylation caller for bisulfite-seq applications. Bioinformatics 2011, 27, 1571–1572. [Google Scholar] [CrossRef] [PubMed]
  58. Zabet, N.; Tsang, J. DMRcaller: Differentially Methylated Regions Caller. R Package Version 1.18.0. 2015. Available online: https://bioconductor.org/news/bioc_3_1_release/ (accessed on 2 March 2020).
  59. Yu, G.; Wang, L.-G.; He, Q.-Y. ChIPseeker: An R/Bioconductor Package for ChIP Peak Annotation, Comparison and Visualization. Bioinformatics 2015, 31, 2382–2383. [Google Scholar] [CrossRef] [PubMed] [Green Version]
  60. Team, B.C.; Maintainer, B.P. TxDb.Mmusculus.UCSC.mm10.knownGene: Annotation Package for TxDb Object(s). R Package Version 3.10.0. 2020. Available online: http://10.18129/B9.bioc.TxDb.Mmusculus.UCSC.mm10.knownGene (accessed on 2 March 2020).
Figure 1. Identification and distribution of the differentially methylated regions (DMRs) specific to each non-genotoxic carcinogen (NGTXC) during the cell transformation. (A) Histogram of the distribution of the relative number of hypermethylated and hypomethylated DMRs per NGTXC. (B) Histogram of DMRs in the promoter region (−1500–1500). In (A,B), the DMRs that were unique to each NGTXC-induced transformed focus were separated by methylation status and classified as hypermethylated or hypomethylated with respect to the untransformed cells. (C) The heatmap of the DNA methylation level at DMRs specific to each NGTXC. Each column represents a different NGTXC, and each row represents a different DMR specific to each NGTXC. The red color represents hypermethylation, while the green color represents hypomethylation. (D) The distribution of DMRs in different genomic regions: 3′-UTR, 5′-UTR, exon, intron, intergenic, promoter, and downstream (≤300).
Ijms 21 05387 g001
Figure 2. Top two networks based on ingenuity pathway analysis (IPA) showing interactions between the controls and the case. (A) Cell-to-cell signaling and interaction (control vs. DEHP). (B) Cancer, cell death and survival (control vs. OA). The lines between the genes represent known interactions (solid lines represent direct interactions; dashed lines represent indirect interactions). Each gene is displayed using shapes that represent the functional class of the gene product as indicated in the legend. The intensity of the red and green colors indicates the degree of up- and downregulation, respectively. A total of 25 networks (p-scores > 18) are provided in Supplementary Table S9.
Ijms 21 05387 g002
Table 1. Published genotoxicity and carcinogenicity results for the test articles.
Test ArticlesGenotoxicityCarcinogenicityICH M7 Prediction (Derek/Sarah)OECD QSAR Toolbox Prediction
Methapyrilene hydrochloride (MH)Equivocal in Ames test, Negative in in vitro CA and SCE, in vivo CA, SCE and MNPotent hepatocarcinogen in rats-/-No alert found
D-limoneneNegative in Ames test, in vivo comet, in vitro CAMale rat kidney tumors-/-No alert found
bis(2-ethylhexyl) phthalate (DEHP)Negative in Ames test, in vivo MN, in vitro MN, MLAIARC Group 2B-/-Structural alert for nongenotoxic carcinogenicity
TCDDNegative in Ames test, in vitro MLA, CA, SCE, in vivo CAIARC Group 1-/-Structural alert for nongenotoxic carcinogenicity
Okadaic acid (OA)Negative in Ames test, in vitro CHO/HGPRT, but mutagenic to CHL cellsTumor promoter on mouse skin-/-No alert found
Cholic acid (CA)Equivocal in Ames test, non-significant mutagenic activity in a battery of in vitro genotoxicity testsColon cancer promoter-/-No alert found
Diethanolamine (DEA)Negative in Ames test, in vivo MN, in vitro CAIARC Group 2B-/-No alert found
RosuvastatinNegative in Ames test, in vivo MN, in vitro CA, MLAPositive response in mice and rats-/-Structural alert for nongenotoxic carcinogenicity
MelamineNegative in Ame test, in vivo MN, in vitro CABladder carcinoma-/-Structural alert for genotoxic carcinogenicity
Sodium saccharin (SA)Negative in Ames test, in vivo CA and comet, in vitro MLARat and mouse bladder tumors-/equivocalStructural alert for nongenotoxic carcinogenicity
Abbreviations: Ames, reverse bacterial mutation assay in Salmonella typhimurium; in vitro CA, in vitro chromosomal aberration assay; in vivo MN, micronucleus test; SCE, sister chromatid exchange; MLA, mouse lymphoma assay; CHO, Chinese hamster ovary; CHL, Chinese hamster lung; HGPRT, hypoxanthine guanine phosphoribosyltransferase; IARC, International Agency for Research on Cancer; -, negative response. References: D-limonene, melamine, diethanolamine. DEHP, rosuvastatin, sodium saccharin [28]; ethapyrilene hydrochloride [32]; TCDD [33]; Okadaic acid [34].
Table 2. Mode of actions of the test articles.
Test ArticlesMode of ActionsReference
Methapyrilene hydrochlorideThe dysregulation of hepatic iron metabolism[35]
D-limoneneα2 μ-globulin nephropathy[36]
Bis(2-ethylhexyl) phthalate (DEHP)Peroxisome proliferators[37]
TCDDReceptor binding[38]
Okadaic acidInhibitors of protein serine/threonine phosphatases[39]
Cholic acidInhibition of xenobiotic metabolizing enzyme[40]
DiethanolamineCholine deficiency[41]
RosuvastatinInhibitor of 3-hydroxy-3-methylglutaryl-coenzyme A (HMG-CoA) reductase[42]
MelamineCalculus formation[43]
Sodium saccharinCalculus formation[44]
Table 3. Bhas 42 cell transformation assay (Promotion test).
Conc.% ViabilityFoci/WellConc.% ViabilityFoci/Well
Sodium saccharin (128-44-9)—PositiveMethapyrilene HCl (135-23-9)—Positive
0 (μg/mL)1003.5 ± 1.38 (a)0 (μg/mL)1007.2 ± 0.75
5001079.3 ± 1.97 **,(b)310714.5 ± 2.59 **
7501138.8 ± 1.94 **3.511016.0 ± 1.26 **
1000939.3 ± 1.03 **410113.8 ± 1.60 **
12501069.7 ± 1.21 **4.510015.0 ± 2.00 **
1500948.2 ± 1.94 **59614.5 ± 2.43 **
17501017.3 ± 2.16 **5.59910.5 ± 3.27
DEHP (117-81-7)—PositiveD-limonene (5989-27-5)—Negative
0 (μg/mL)10011.0 ± 1.790 (μg/mL)10012.7 ± 3.01
2.59313.8 ± 2.4812.510314.7 ± 3.72
59219.5 ± 2.17 **1510312.2 ± 3.19
109120.5 ± 4.76 **17.510214.0 ± 2.00
259518.5 ± 3.73 **2010112.8 ± 3.60
509318.5 ± 1.64 **22.58312.3 ± 2.07
1009013.0 ± 3.5225789.8 ± 2.14
Melamine (108-78-1)—NegativeRosuvastatin (287714-41-4)—Negative
0 (μM)1007.5 ± 1.760 (μg/mL)1008.0 ± 0.89
0.25927.8 ± 2.230.11038.8 ± 1.83
0.5968.2 ± 2.480.251007.8 ± 1.83
1959.0 ± 2.680.51028.7 ± 1.51
2.5989.7 ± 3.080.751178.2 ± 1.94
59610.8 ± 2.2311259.8 ± 3.13
101039.3 ± 3.2021168.7 ± 1.63
Diethanolamine (111-42-2)—PositiveOkadaic acid (78111-17-8)—Weak positive
0 (μg/mL)1007.8 ± 1.940 (ng/mL)1008.8 ± 1.17
109914.0 ± 3.22 *0.2510011.7 ± 2.25
2511716.7 ± 2.66 **0.510913.0 ± 3.35 *
5011412.8 ± 3.870.759711.2 ± 3.49
7511017.5 ± 2.07 **110212.8 ± 2.14 *
1008816.8 ± 3.66 **21186.2 ± 0.75
15011217.8 ± 4.71 **31175.0 ± 1.41
TCDD (1746-01-6)—PositiveCholic acid (81-25-4)—Positive
0 (nM)10011.3 ± 1.370 (μg/mL)1005.0 ± 2.28
107720.0 ± 3.35 **101248.8 ± 2.48
258619.3 ± 3.14 **251199.0 ± 1.79 *
508121.2 ± 0.75 **501079.3 ± 1.97 *
758518.8 ± 3.43 **1001229.0 ± 3.22 *
1008919.7 ± 2.25 **25010310.0 ± 2.68 **
2007917.3 ± 1.86 **50013111.8 ± 2.99 **
(a) Values represent the mean SD of six wells per group. (b) ** p < 0.01 and * p < 0.05 as compared with vehicle control, as determined by Dunnett’s t test.
Table 4. Genes harboring the overlapping DMRs.
Associated GeneDescriptionDMR PositionDMR Distance from TSS (1)DMCs NumberMethylationNGTXC
Genes harboring overlapping DMRs in 4 NGTXCs, -induced transformed foci
Asic1Acid-sensing (proton-gated) ion channel 1chr15: 99,691,202–99,691,300−9338hypomethylatedDEHP/OA/TCDD/MH
Gm14169Predicted gene 14169chr2: 156,613,303–156,613,4012118hypermethylatedCA/DEHP/OA/TCDD
Gm7337DAZ interacting protein 1 pseudogenechr5: 87,851,102–87,851,20058410hypomethylatedCA/DEHP/OA/MH
Gpsm2G-protein signaling modulator 2chr3: 108,721,702–108,721,90021626hypomethylatedCA/DEHP/OA/TCDD
Irs1Insulin receptor substrate 1chr1: 82,290,404–82,290,50291418hypermethylatedOA/TCDD/DEA/SS
Mpv17MpV17 mitochondrial inner membrane proteinch5: 31,154,402–31,154,500−1518hypermethylatedCA/DEHP/OA/TCDD
NexnNexilinchr3: 152,265,802–152,265,900−722hypomethylatedDEHP/DEA/MH/SS
Nrip2Nuclear receptor interacting protein 2chr6: 128,401,302–128,401,40010092hypomethylatedCA/DEHP/TCDD/SS
Nsun7NOL1/NOP2/Sun domain family, member 7chr5: 66,261,102–66,261,20079010hypomethylatedCA/TCDD/DEA/SS
Pcdh7Protocadherin 7chr5: 57,720,202–57,720,3007914hypermethylatedCA/OA/DEA/MH
Pou6f1POU domain, class 6, transcription factor 1chr15: 100,599,102–100,599,2006646hypermethylatedCA/DEHP/TCDD/SS
Unc13aUnc-13 homolog Achr8: 71,668,402–71,668,500−32012hypermethylatedCA/DEHP/OA/TCDD
Zfp882Zinc finger protein 882chr8: 71,908,855–71,908,954014hypermethylatedTCDD/DEA/MH/SS
Genes harboring overlapping DMRs in 5 NGTXCs-induced transformed foci
H2-D1Histocompatibility 2, D region locus 1chr17: 35,263,302–35,263,40020623hypomethylatedCA/DEHP/DEA/MH/SS
Mir705MicroRNA 705chr6: 85,337,102–85,337,200−7296hypomethylatedDEHP/OA/DEA/MH/SS
(1) TSS, transcription start site (1500 bp downstream and 1500 bp upstream from TSS)—> Promoter. Abbreviation: DMCs, differentially methylated cytosines
Table 5. Top 3 and significant enriched functional annotations of the differentially methylated regions between the control and the NGTXC-treated group (p-value < 0.05 and proportion of methylation difference >0.3).
NGTXCCategoriesDisease or Functions Annotationp-ValueNumber of Molecules
Cholic acidCellular assembly and organizationRelease of vesicles0.006052
Lipid metabolismConcentration of malonyl-coenzyme A0.009131
Embryonic developmentAttachment of chorioallantoic membrane0.009131
Cancer, cellular growth and proliferationProliferation of mammary tumor cells0.01821
DEHPBehaviorLearning7.93 × 10−625
Cell-to-cell signaling and interactionUptake of neurotransmitter1.85 × 10−55
Neurological DiseaseCognitive impairment0.0000916
Cell death and survivalApoptosis of tumor cell lines0.005313
Okadaic aicdGastrointestinal diseaseMeteorism0.0004682
Cell-to-cell signaling and interactionDevelopmental process of synapse0.0005554
Respiratory diseaseAbnormal secretion of pulmonary surfactant0.001352
TCDDCellular movementCellular infiltration by macrophages7.68 × 10−69
BehaviorLong-term recognition memory5.16 × 10−54
Cardiovascular system development and functionSystolic pressure0.000147
cancerCell transformation0.001259
Cell death and survivalApoptosis0.0053117
Diethanol-amineEmbryonic developmentFormation of visceral endoderm0.0001952
Cell cycleAneuploidy of embryonic cell lines0.0002912
Cell cycleAneuploidy of fibroblast cell lines0.0004072
Cell-to-cell signaling and interactionDevelopmental process of synapse0.001164
CancerHyperplasia of urothelium0.004461
Methapyrilene HClConnective tissue development and functionOsteogenesis0.003162
Cell-to-cell signaling and interactionSynaptic transmission0.007936
Reproductive system development and functionGestation0.008143
Sodium saccharinConnective tissue development and functionThickness of bone1.93 × 10−57
Skeletal and muscular system development and functionMineralization of bone3.44 × 10−58
Connective tissue disordersSynostosis of cranium6.38 × 10−52
BehaviorSocial behavior9.72 × 10−56
Table 6. Top 3 and the significant canonical pathways of the differentially methylated regions between the control and the NGTXC-treated group (p-value < 0.05 and proportion of methylation difference >0.3).
NGTXCIngenuity Canonical Pathways−log (p-value)RatioMolecules
Cholic acidNotch signaling2.370.0833CNTN1, DTX1, LFNG
Axonal guidance signaling1.970.0214ADAM19, ADAMTS1, GNG2, MYL12A, PRKAR1B, SEMA4A, SEMA4G, SEMA6C, SRGAP1, SRGAP3
Thyroid hormone biosynthesis1.570.333IYD
RAR activation1.020.0211Akr1b10, NRIP2, PRKAR1B, SMARCD3
Gustation pathway0.8630.0214GNG2, PDE1B, PRKAR1B
Salvage pathways of pyrimidine ribonucleotides0.6950.022DAPK1, GRK4
DEHPDopamine-DARPP32 feedback in cAMP Signaling3.540.0692GNAI1, GRIN1, GRIN3B, KCNJ12, NOS1, PPP1R1B, PPP2R5A, PRKACA, PRKAR1B, PRKCZ, PRKG2
Notch signaling2.30.111DLL4, DTX1, HEY1, NOTCH4
nNOS signaling in neurons1.950.0889GRIN1, GRIN3B, NOS1, PRKCZ
Gustation pathway1.250.0429ASIC1, GNG2, P2RY12, PDE6B, PRKACA, PRKAR1B
Salvage pathways of pyrimidine ribonucleotides0.5850.033AK1, DAPK1, GRK4
Okadaic aicdGlutamate degradation II1.960.333GOT2
L-Serine degradation1.960.333SDS
Aspartate biosynthesis1.960.333GOT2
RAR activation1.490.0158Akr1b10, MAP2K5, NSD1
Salvage pathways of pyrimidine ribonucleotides1.360.022DAPK1, GRK4
Gustation pathway1.030.0143ASIC1, CACNB1
TCDDPyridoxal 5′-phosphate salvage pathway2.480.0625GRK4, MAP2K6, PDXK, PKN1
PPARα/RXRα activation2.10.0331APOA1, GOT2, IRS1, MAP2K6, PPARA, PRKAR1A
Apelin liver signaling pathway1.60.0769APLNR, IRS1
Salvage pathways of pyrimidine ribonucleotides1.250.033GRK4, MAP2K6, PKN1
Gustation pathway0.8240.0214ASIC1, CACNA1D, PRKAR1A
DiethanolamineRegulation of the epithelial–mesenchymal Transition pathway1.990.0211CLDN3, FGF19, FGFR2, NOTCH1
Glutamate degradation II1.880.333GOT2
Aspartate Biosynthesis1.880.333GOT2
Cancer drug resistance by drug efflux1.560.0345miR-133, PTEN
Gustation pathway0.8890.0143CACNB1, PDE8B
PPARα/RXRα activation0.7140.011GOT2, IRS1
Methapyrilene HClγ-glutamyl cycle4.140.3GGCT, GGT6, GGT7
Leukotriene biosynthesis2.340.167GGT6, GGT7
Valine degradation I1.990.111ABAT, SDS
Autophagy1.050.0345CTSF, ULK1
Phagosome maturation0.9210.0214CTSF, HLA-A, TCIRG1
VDR/RXR activation0.8390.0256BGLAP, IGFBP5
Salvage pathways of pyrimidine Ribonucleotides0.2640.011CDK5
Sodium saccharinGustation pathway3.030.0429P2RX7, P2RY12, PDE1B, PDE8B, PDE9A, PRKACA
tRNA splicing2.370.0732PDE1B, PDE8B, PDE9A
G-protein coupled receptor signaling1.680.0225P2RY12, PDE1B, PDE8B, PDE9A, PRKACA, PRKCB
VDR/RXR activation1.610.0385PRKCB, RUNX2, SPP1
Phagosome maturation1.580.0286ATP6V1G3, HLA-A, LPO, TCIRG1

