Article

Overexpression of Isoprene Synthase Affects ABA- and Drought-Related Gene Expression and Enhances Tolerance to Abiotic Stress

1
Department of Biodiversity and Molecular Ecology, Fondazione Edmund Mach, Research and Innovation Centre, via Mach 1, 38010 San Michele all’Adige (TN), Italy
2
Dipartimento di Biologia, Università degli Studi di Padova, viale Giuseppe Colombo, 3, 35131 Padova, Italy
*
Authors to whom correspondence should be addressed.
Int. J. Mol. Sci. 2020, 21(12), 4276; https://doi.org/10.3390/ijms21124276
Submission received: 7 May 2020 / Revised: 10 June 2020 / Accepted: 13 June 2020 / Published: 16 June 2020
(This article belongs to the Section Molecular Plant Sciences)

Abstract

:
Isoprene is the most abundant single biogenic volatile compound emitted by plants. Despite the relevance of this molecule to plant abiotic resistance and its impact on global atmospheric chemistry, little is known about the details of its mechanism of action. Here, we characterized through both physiological and molecular methods the mechanisms of action of isoprene using model transgenic arabidopsis lines overexpressing a monocot isoprene synthase gene. Our results demonstrated the effect that isoprene had on ABA signaling at different tissue-specific, spatial, and temporal scales. In particular, we found that isoprene enhanced stomatal sensitivity to ABA through upregulation of RD29B signaling gene. By contrast, isoprene decreased sensitivity to ABA in germinating seeds and roots, suggesting tissue-specific mechanisms of action. In leaves, isoprene caused the downregulation of COR15A and P5CS genes, suggesting that the enhanced tolerance to water-deprivation stress observed in isoprene-emitting plants may be mediated chiefly by an enhanced membrane integrity and tolerance to osmotic stress.

1. Introduction

Plants, as sessile organisms, have developed diverse defense mechanisms to allow them to adapt to sudden and severe environmental changes. Among these, drought (water deficiency) and heat (high temperature) are considered the most detrimental abiotic stresses, which cause severe damage to plant survival and crop production. It is also expected that if drought occurs under the condition of raised temperatures from global warming, water scarcity will set in more severely and rapidly [1], which would result in a greater challenge for plant fitness and productivity.
It has been reported that isoprene (2-methyl-1,3-butadiene, a biogenic volatile compound) plays fundamental roles in protecting plants against oxidative stress under various environmentally unfavorable conditions [2]. Recently, it was estimated that around 70% of non-methane biogenic volatile compounds in the atmosphere annually are derived from isoprene emission alone at the global level [3]. Isoprene’s vast dominating quantities and rapid oxidation reactions can strongly influence atmosphere chemistry and air quality [4]. Isoprene biosynthesis is widespread among perennial and deciduous species [5]. In plants, its emission is further stimulated when leaves are subjected to or recovering from environmental stresses [6,7,8,9]. These findings suggest that isoprene emission is capable of responding to many stresses and provides benefits to plants [5,10]. Hypotheses about the protective mechanisms of isoprene emission to improve plant tolerance against biotic and abiotic stresses include membrane stabilization [11,12], direct reactions with reactive oxygen and nitrogen species [13,14,15], and indirect alteration of ROS signaling [2,16]. Therefore, Vickers and colleagues proposed a unified mechanism by which the antioxidant behavior of isoprene improves a variety of abiotic stresses resistance in isoprene emitting plants [10].
Isoprene synthase (IspS) plays a crucial role in the synthesis of isoprene, the production of which is catalyzed from the dimethylallyl diphosphate (DMADP) produced through the methylerythritol 4-phosphate (MEP) pathway [7]. IspS is the first and only committed enzyme of this side-branch of the major terpene biosynthetic pathway [7]. Therefore, the sole presence of this chloroplast-localized enzyme is sufficient to cause a non-emitting plant to emit isoprene (reviewed in Reference [17]). Since the first isolation of an isoprene synthase sequence more than two decades ago [18], several functional studies based on the overexpression or downregulation of IspS genes from different species have exploited this peculiarity of IspS to engineer isoprene emission into natural non-emitters or to eliminate it from natural emitters (reviewed in Reference [19]). This, in turn, provided ample opportunities to study in plant species from different families (e.g., tobacco, poplar and Arabidopsis) the physiological mechanisms by which isoprene emission enhances tolerance under heat stress [20,21,22,23]. By contrast, the positive effects of isoprene emission in photosynthetic and whole-plant drought responses in transgenic plants were just demonstrated a few years ago [24,25]. These previous studies provided evidence that isoprene emission suppressed the increase of reactive oxygen species (ROS) content, thus protecting the photosynthetic apparatus under drought stress and during the recovery phase as well.
ABA, a plant hormone, participates in drought perception and signal transduction pathways [26,27]. Drought-induced ABA biosynthesis initiates ABA relocation and accumulation in guard cells, causing a loss of guard-cell turgor pressure which results in stomatal closure [28]. Since drought-tolerance responses include ABA-dependent and ABA-independent pathways, most drought-inducible genes in ABA-dependent pathway are also induced by exogenous ABA treatment [27,29]. The application of exogenous ABA can decrease plant transpiration rate [30], and inhibit seed germination [31] and plant growth under non-stress conditions [32]. As the MEP pathway is responsible for the generation of precursors for both ABA and isoprene biosynthesis, a direct linear correlation between isoprene emission and leaf ABA content was observed in both Phragmites australis and Populus alba at certain range of stomatal conductance [33]. Additionally, the decrease of isoprene emission was accompanied by the reduction of foliar ABA concentration when the MEP pathway was inhibited [33]. However, this correlation was not maintained under drought stress. When PaIspS (isoprene synthase from Populus alba) transgenic tobacco plants were subjected to mild drought stress, the dramatic decrease of isoprene emission did not affect the foliar ABA concentration and stomatal conductance at the whole-leaf level [24]. In turn, under severe drought stress, the isoprene emission of PaIspS transgenic tobacco plants was reduced, but the foliar ABA concentration was dramatically increased and unexpectedly higher stomatal conductance in PaIspS transgenic plants compared with non-emitter was detected [25]. According to these results, which are in contrast to current knowledge about the correlation between ABA level and stomatal conductance, it was suggested that the tobacco plants changed their water-management strategy from isohydric to anisohydric under drought stress.
Isohydric and anisohydric strategies are two water-management strategies in plants under water-limited conditions [34], although the distinctions between them are often not easy to identify precisely in practice [35,36]. Even plants in a given species could adjust their behavior types in different experimental conditions [37,38,39]. In general, plants with anisohydric behavior are more drought-tolerant [40,41,42], and faster to recover during re-watering than isohydric plants [35]. The high photosynthesis rate maintained by anisohydric plants under normal and mild drought conditions creates a growth advantage in uncertain and unpredictable environments (reviewed in Reference [43]). Additionally, the switch from isohydric to anisohydric strategies by gene transformation was reported to significantly increase fruit yield [42]. Probably due to ABA’s multiple roles in the regulation of water-use efficiency [43], the level of anisohydric behavior and isohydric behavior has been reported to strongly depend on abscisic acid (ABA) production and sensitivity [37,43,44], as anisohydric plants display low sensitivity and isohydric plants display hypersensitivity to ABA.
Recently, the first IspS gene was isolated from a monocot species, Arundo donax L., belonging to Poaceae family (AdoIspS) [45], which is an excellent energy crop and biomass feedstock [46,47] with a high growth rate and resistance to biotic and abiotic stresses [48]. Li and colleagues reported that the AdoIspS gene was upregulated at different time points when subjected to heat and osmotic stresses [45], andadditionally, a recent study showed that there were differences upon isoprene-emission rate identified between two Arundo donax ecotypes, and the higher isoprene emitter exhibited greater drought tolerance and faster recovery [49]. Taken together, these observations imply that isoprene emission in A. donax might play a positive role in plant adaptation to abiotic stresses in general. To date, intensive studies have been focused mainly on the comparison of physiological responses under different abiotic stresses between natural isoprene emitters and non-emitters, transgenic isoprene emitters, and corresponding control plants [50], but limited information is available upon physiological responses at different developmental stages under abiotic stress treatment, and the correlation between the physiological responses and molecular reactions. Thus, in this study we aimed to evaluate (1) the water-deficiency responses of AdoIspS transgenic plants compared with Col-0 at different developmental stages, and consequence of physiological responses derived from molecular reactions; (2) short-term responses of these genotypes at the young seedling stage and long-term responses of plant fitness under heat stress between these two genotypes; and (3) the consequent effects of the transformed AdoIspS gene on plant development and yields.

2. Results

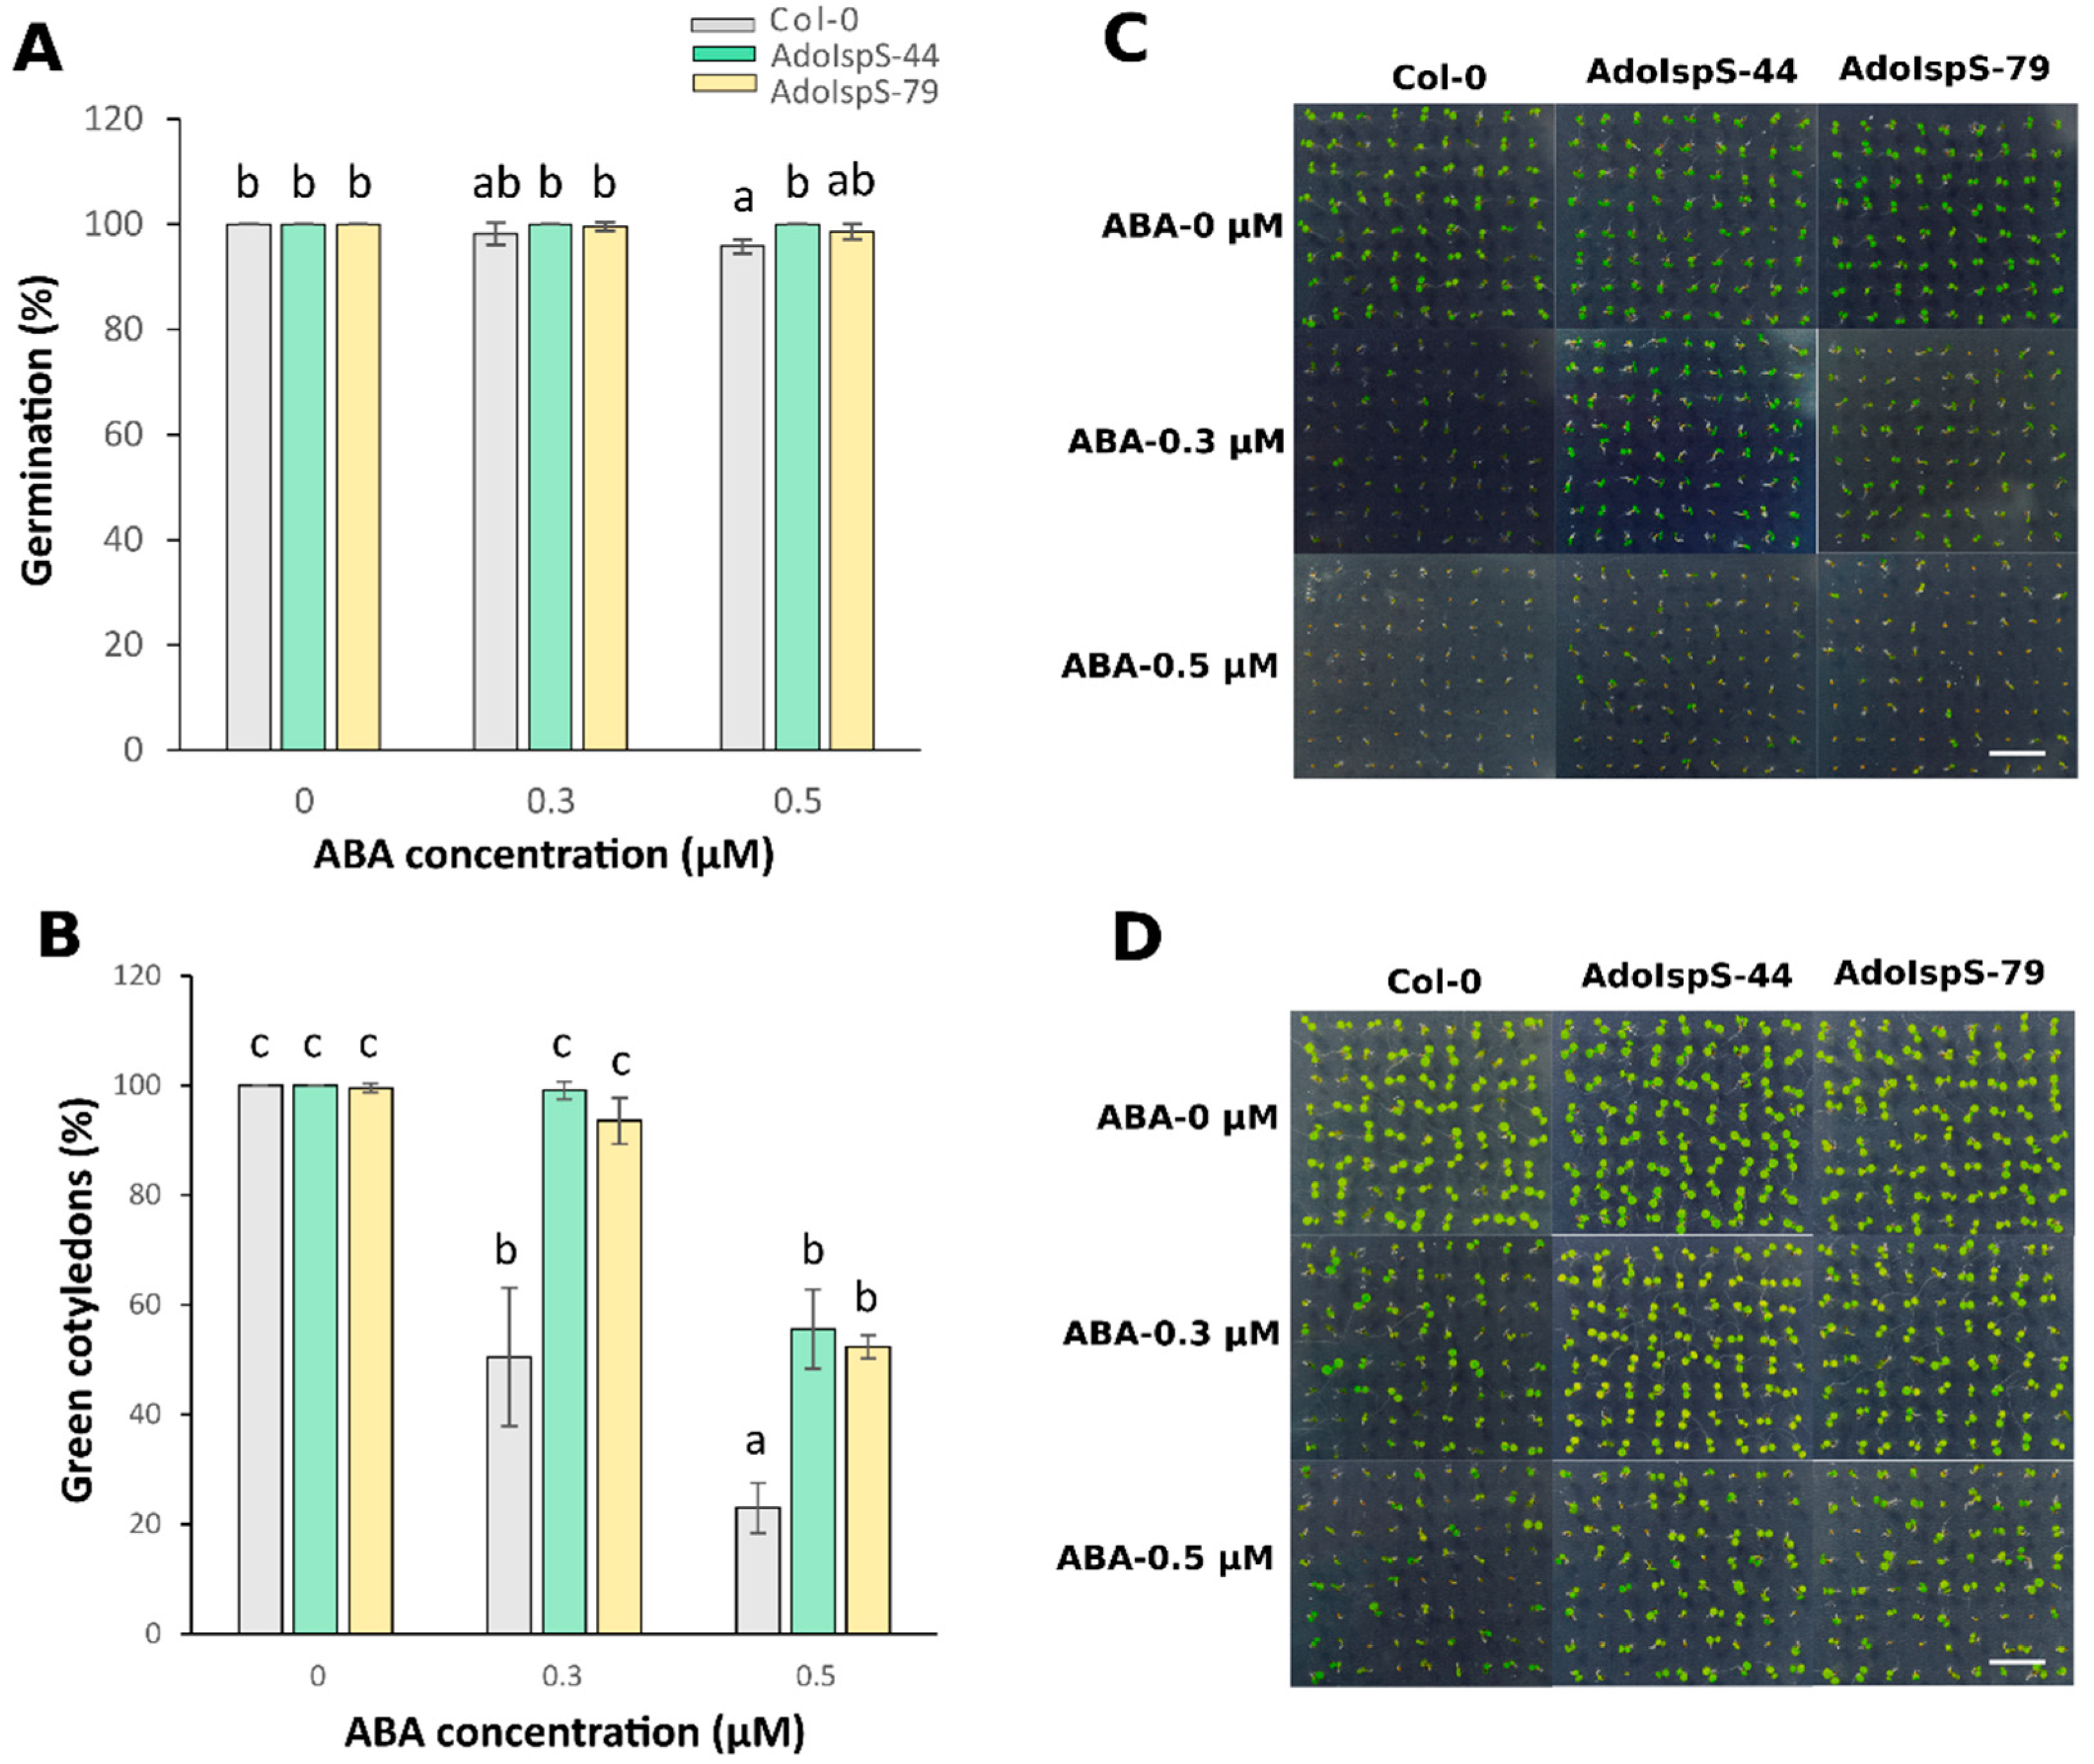
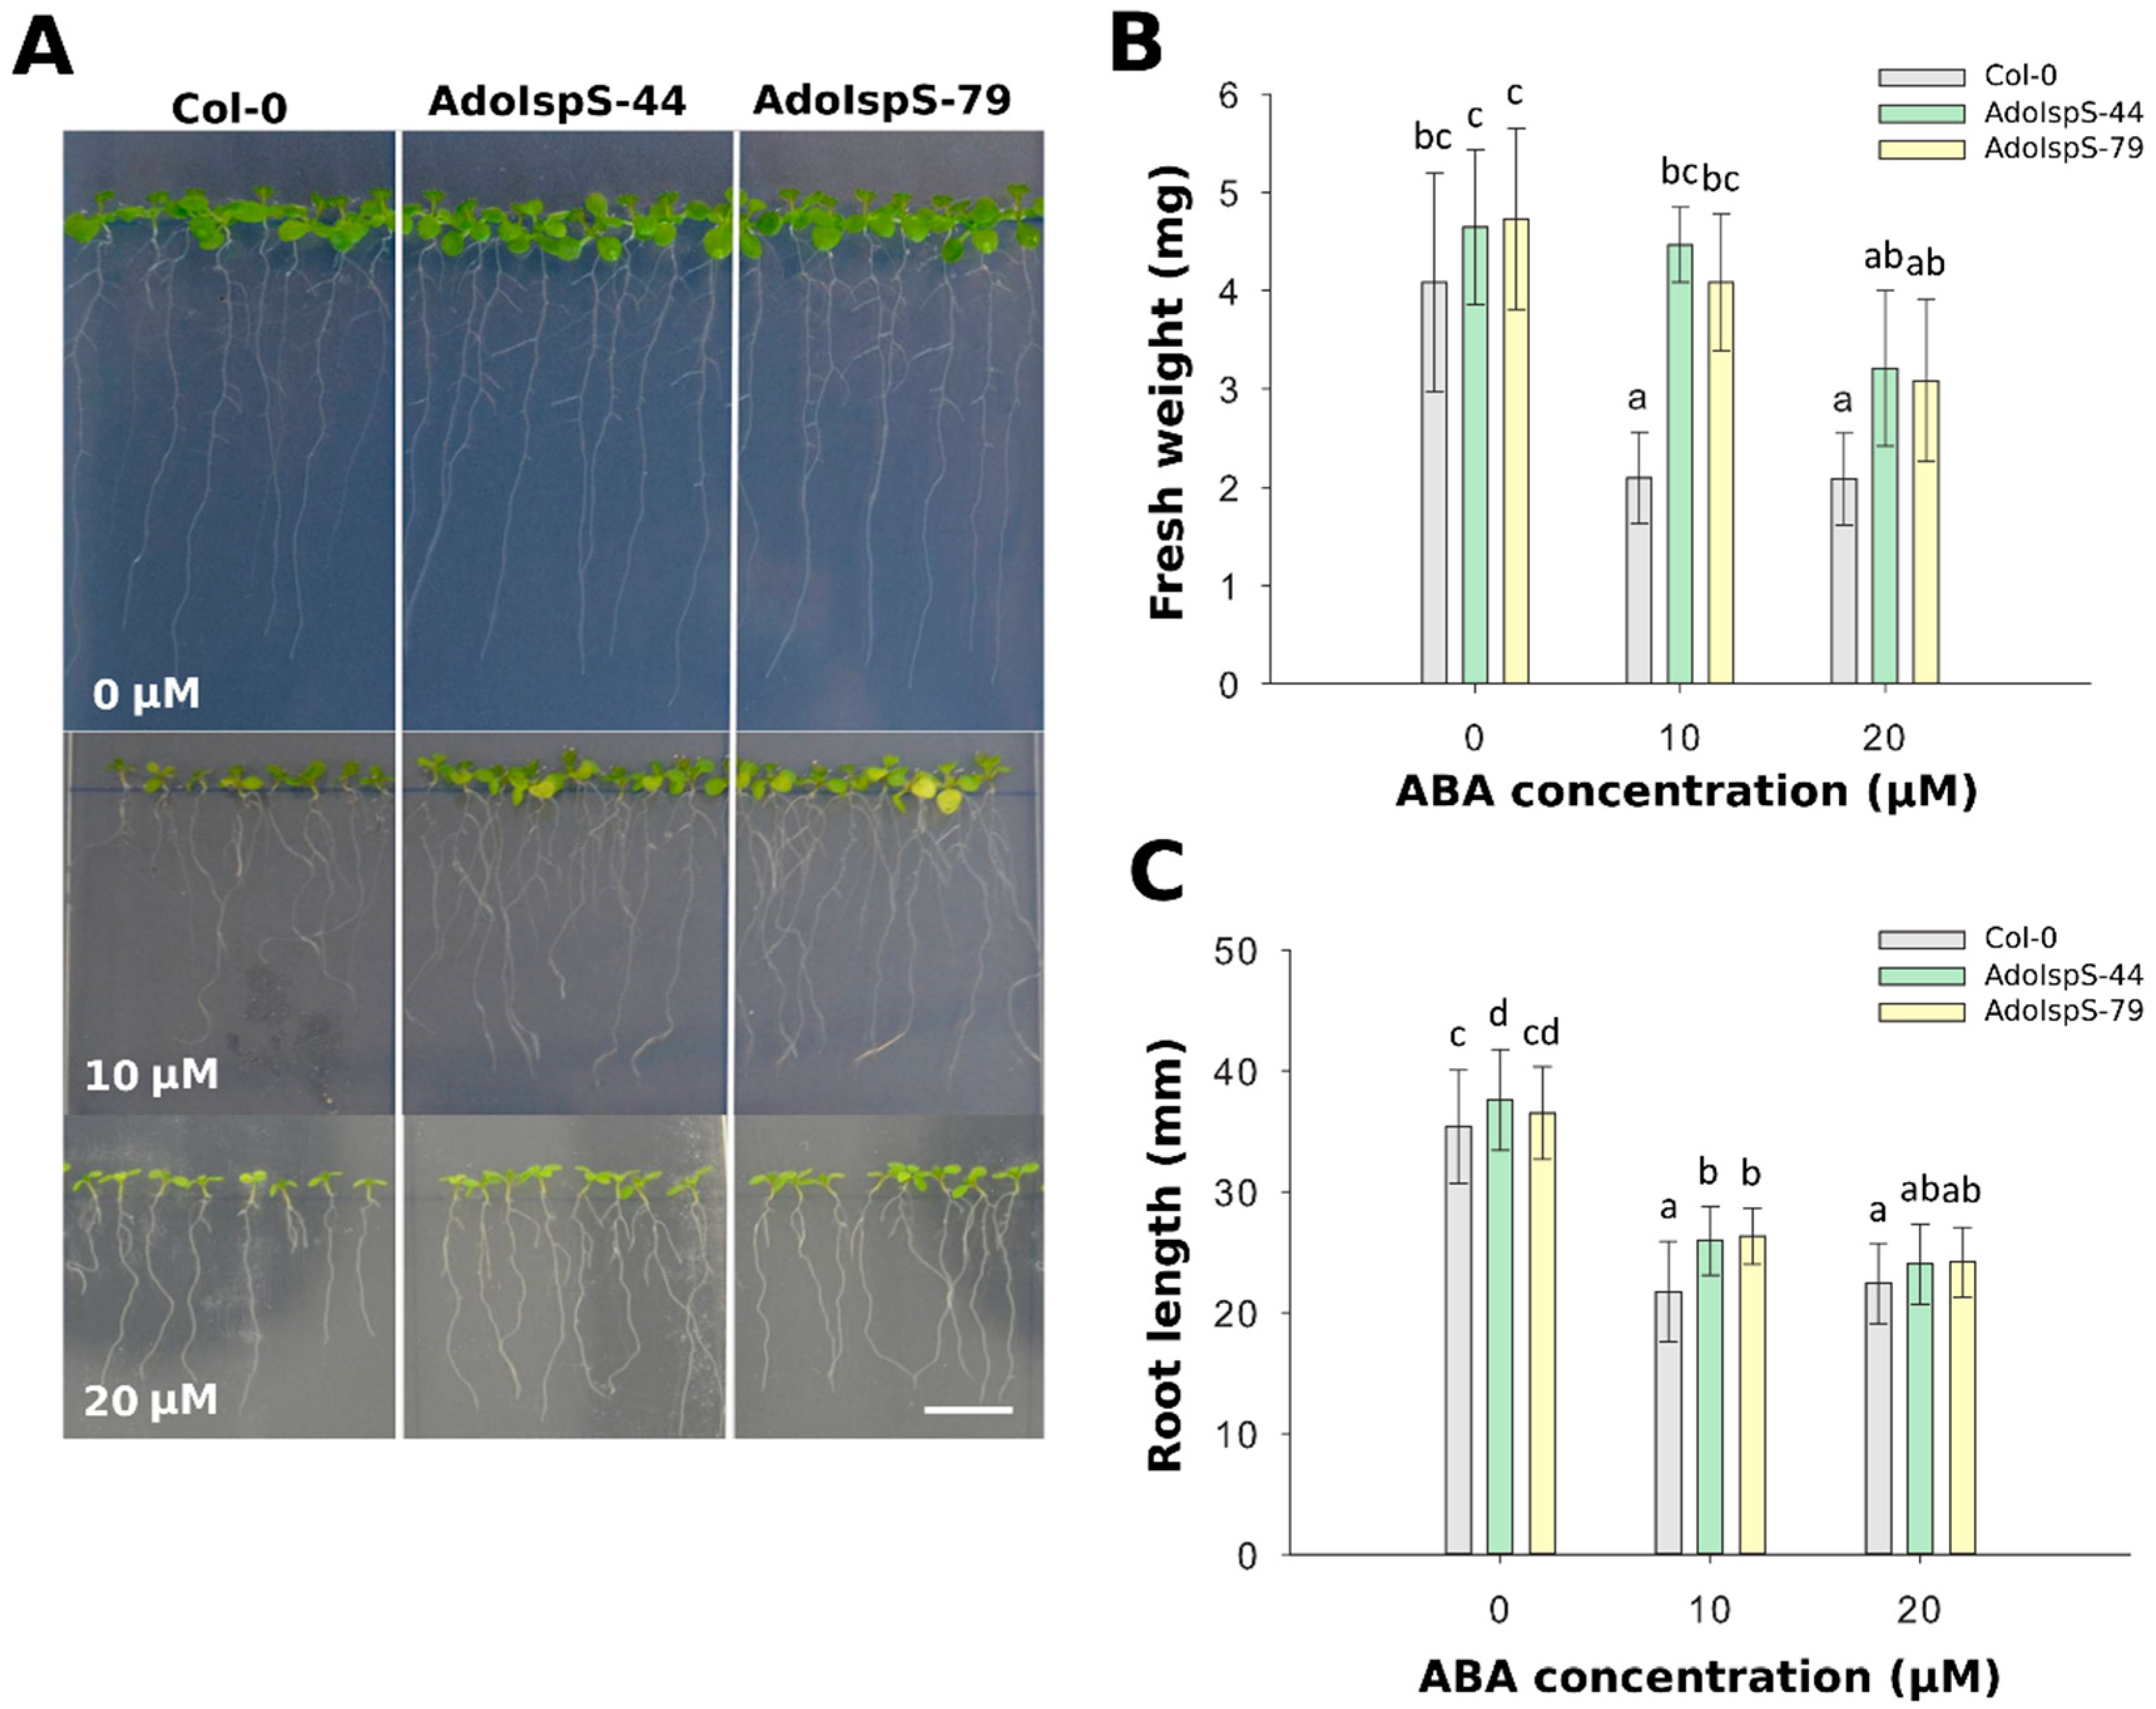
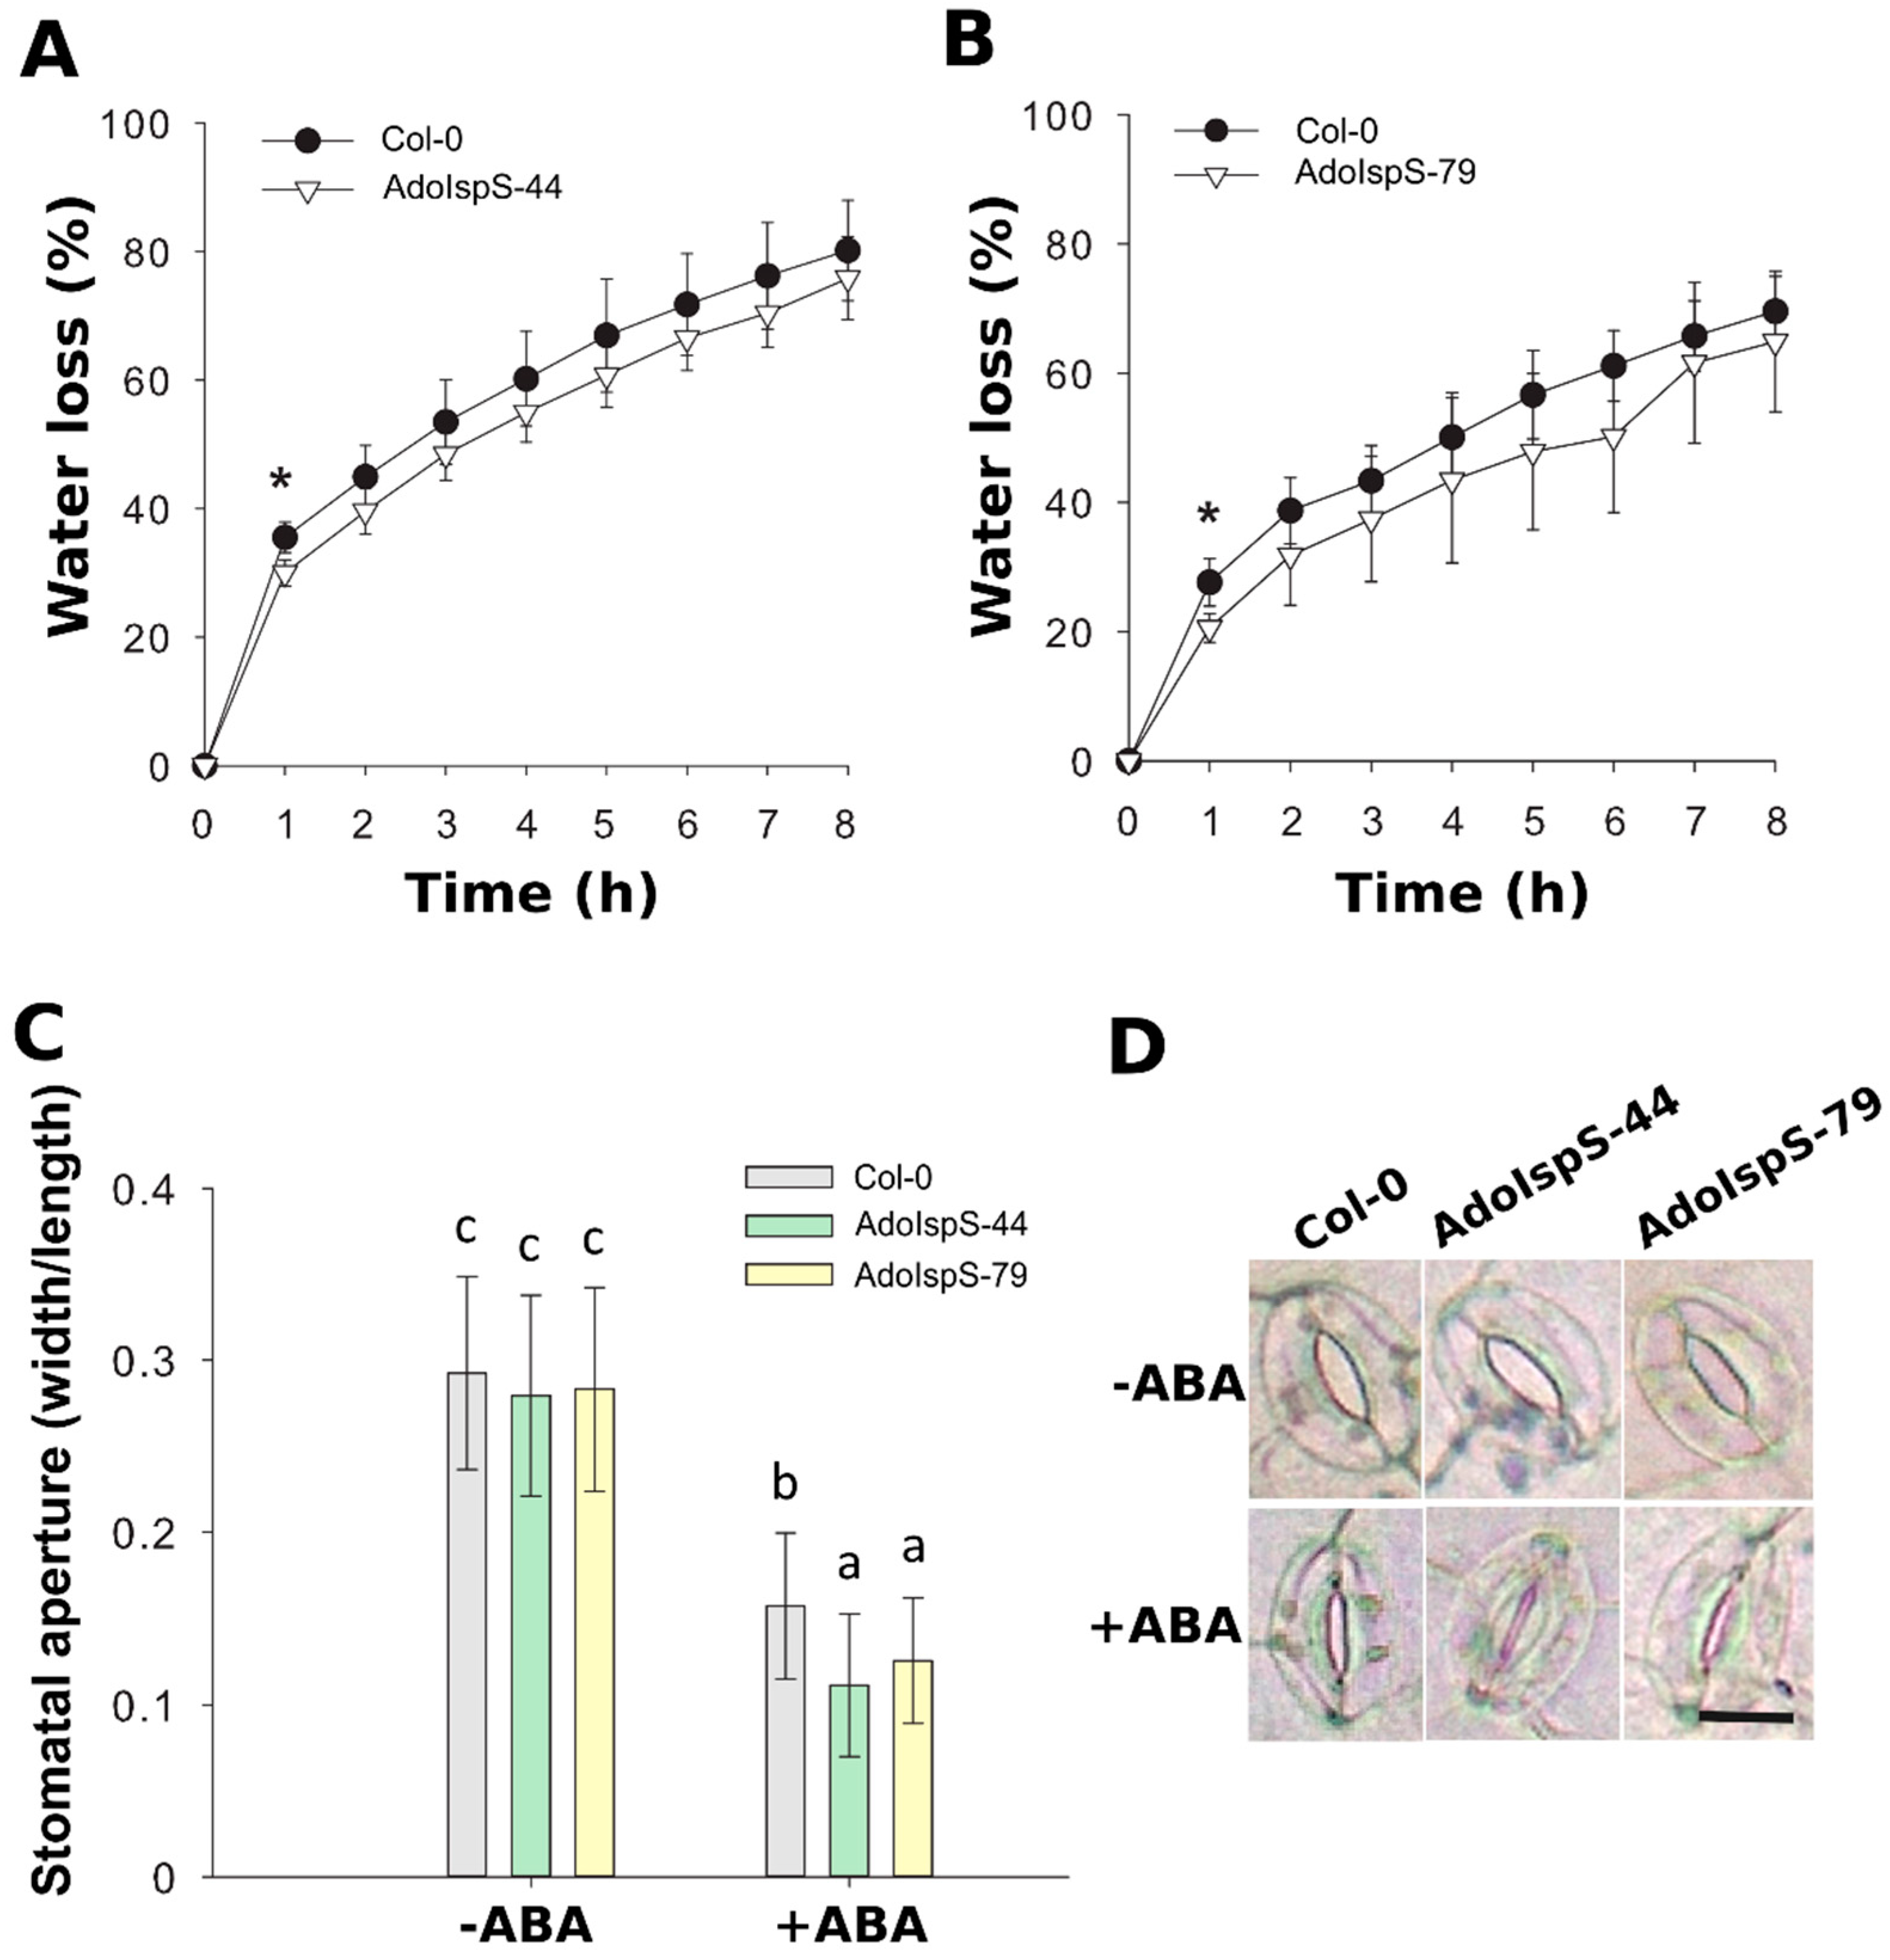
2.1. Enhanced Tolerance of AdoIspS Transgenic Arabidopsis Plants to Exogenous ABA Treatment

Expression of the AdoIspS transgene and isoprene emission from T3 homozygous transgenic lines AdoIspS-44 and AdoIspS-79 are shown in Supplementary Figures S1 and S2, respectively. The results showed that the two transgenic lines had comparable expression and emission levels, and that they were not subject to silencing. A previous study showed that AdoIspS was upregulated upon osmotic stress in A. donax [45]. It is well-known that ABA is a key regulator of abiotic stress responses [51]. To evaluate the response of AdoIspS transgenic plants to ABA treatment, seed germination analyses were carried out on half-strength MS medium supplemented with different concentrations of ABA. A two-factor ANOVA (3 × 3) was conducted to examine the effect of genotype and ABA concentration on germination rate. The results indicated a significant main effect for ABA treatment, F (2, 18) = 7.96, p = 0.0034, and a significant main effect for genotype, F (2, 18) = 9.71, p = 0.0014. There was a statistically significant interaction between the effects of genotype and ABA concentration on germination rate, F (4, 18) = 3.4825, p = 0.028. The germination rate of AdoIspS seeds was not consistently higher than that of Col-0 seeds treated with 0.5 μM ABA after 3 days of growth, and no difference could be observed after 5 days (Figure 1A). The rate of green cotyledon formation was significantly higher in both AdoIspS transgenic lines than that in Col-0 at both ABA concentrations (Figure 1B–D).
To examine whether the decreased sensitivity of AdoIspS transgenic plants to exogenous ABA treatment during germination would be also maintained at the post-germination stage, 4 day old seedlings growing in half-strength MS medium were transferred either to the same medium or to medium supplemented with 10 or 20 µM ABA and grown for an additional 7 days. A two-factor ANOVA (3 × 3) was conducted to examine the effect of genotype and ABA concentration on either fresh weight or root length. The results for fresh weight indicated a significant main effect for ABA treatment, F(2, 45) = 23.01, p = 1.31 × 10⁻⁷, and a significant main effect for genotype, F(2, 45) = 17.58, p = 2.29 × 10⁻⁶. There was no statistically significant interaction between the effects of genotype and ABA concentration on fresh weight, F (4, 45) = 2.44, p = 0.061. The results for root length indicated a significant main effect for ABA treatment, F(2, 343) = 463.48, p <2. 2 × 10⁻¹⁶, and a significant main effect for genotype, F(2, 343) = 20.92, p = 2.7 × 10⁻⁹. There was statistically significant interaction between the effects of genotype and ABA concentration on root length, F (4, 343) = 4.26, p = 0.0022. Compared with Col-0, at 10 µM ABA concentration, the primary roots were significantly longer (Figure 2A), and the fresh weight was significantly higher than the Col-0 plants (Figure 2B,C). These results indicated that the overexpression of AdoIspS gene not only promoted the root growth of transgenic plants, but also the growth of aerial parts, thus relieving the growth inhibition associated with exogenous ABA treatment.
To evaluate whether ABA biosynthesis and signaling pathways were affected or not in transgenic plants overexpressing AdoIspS, four genes were selected for qRT-PCR analyses, namely NCED3 and ABA2 (related to ABA biosynthesis), and RAB18 and RD29B (related to ABA signaling). Two-factor ANOVA (3 × 3) analyses were conducted to examine the effect of genotype and time on relative gene expression in shoot and root. The results for the two-way ANOVAs (Supplementary Table S1) indicated a significant main effect for time in all tests, F(2, 18) > 15.61, p < 0.0001. A significant main effect for genotype, F(2, 18) > 26.572, p < 4.25 × 10⁻⁶, was found in shoots for the effect of genotypes on relative expression levels of genes NCED3 (downregulation in transgenic lines compared to WT) and RD29B (upregulation). There was a statistically significant interaction between the effects of genotype and time on expression levels for genes NCED3, RAB18, and RD29B, F (4, 18) > 2.95, p < 0.05 (details in Supplementary Table S1). In the case of ABA2 expression, there were no significant differences detected in both shoots and roots between Col-0 and transgenic lines (Figure 3A,E). The transcripts of NCED3 were significantly reduced in aerial parts of transgenic plants compared with those of Col-0 (Figure 3B), but in roots the expression levels of this gene were not different between AdoIspS transgenic plants and Col-0 (Figure 3F).
ABA-responsive marker genes RAB18 and RD29B from both leaves and roots in both transgenic lines were highly expressed after exogenous ABA treatment (Figure 3C,D,G,H).
In summary, in leaves, AdoIspS plants showed upregulation of expression levels of two ABA-induced genes, and of expression of one ABA biosynthesis gene, but this pattern was not apparent in roots.

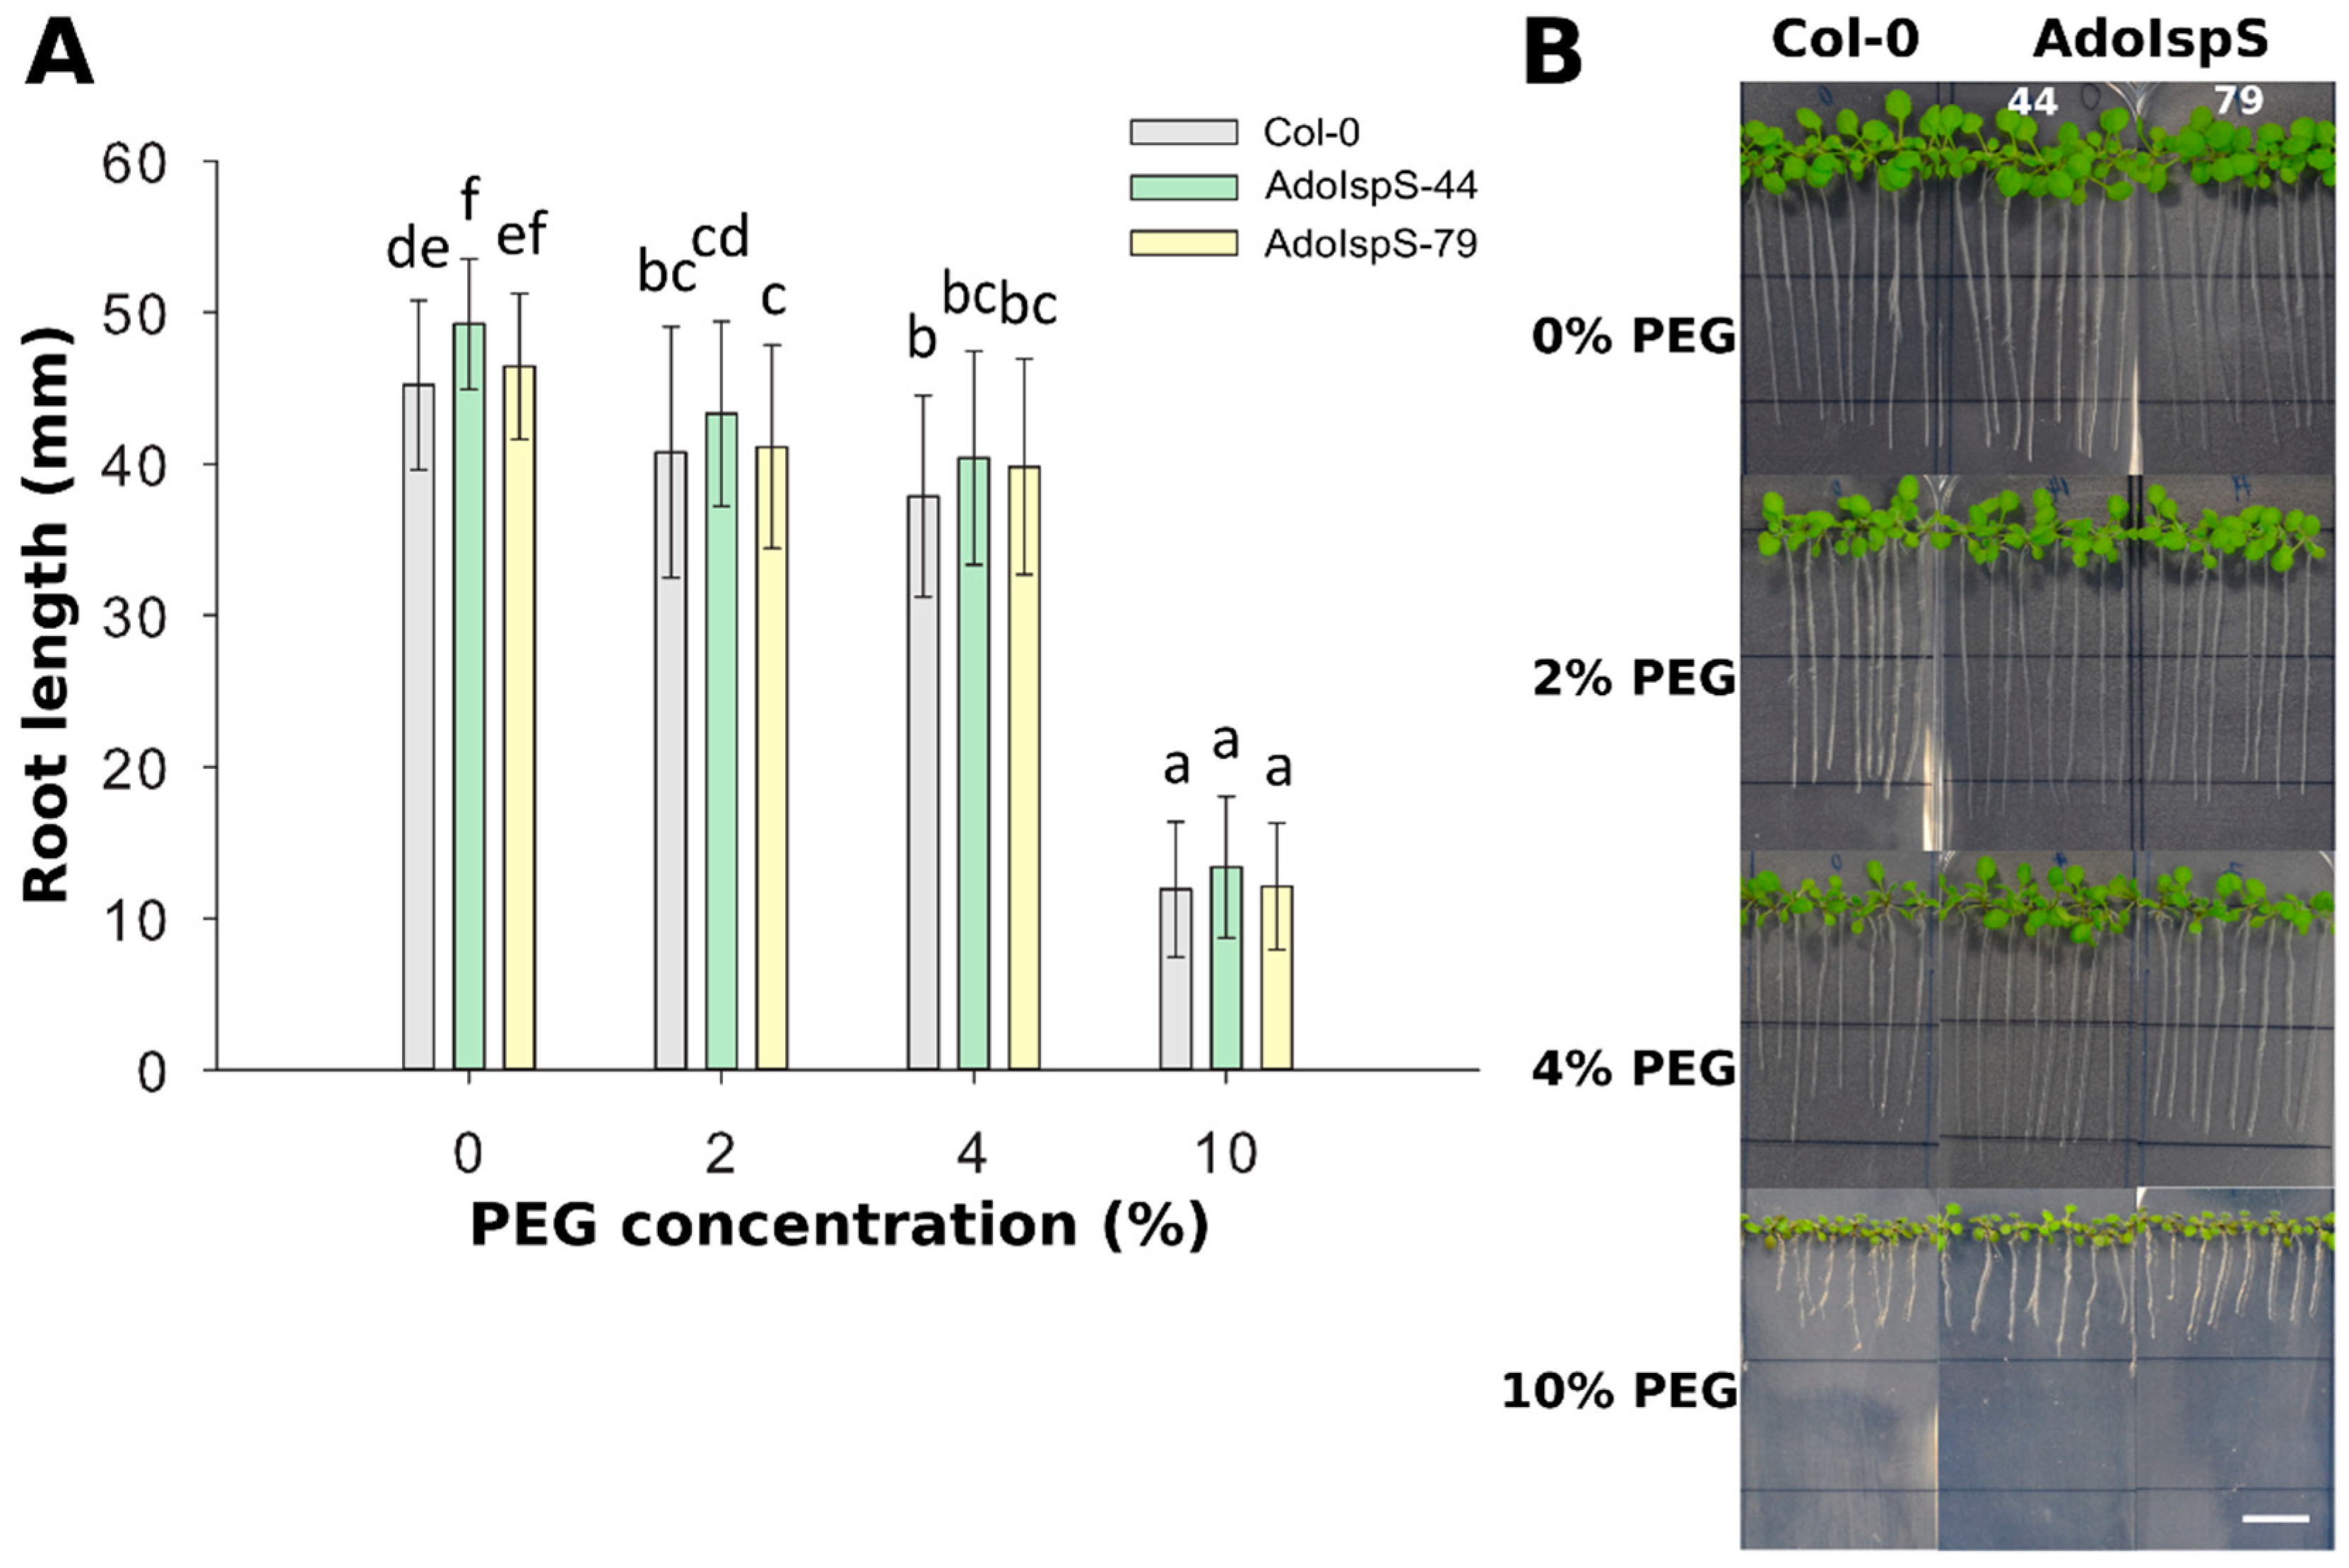
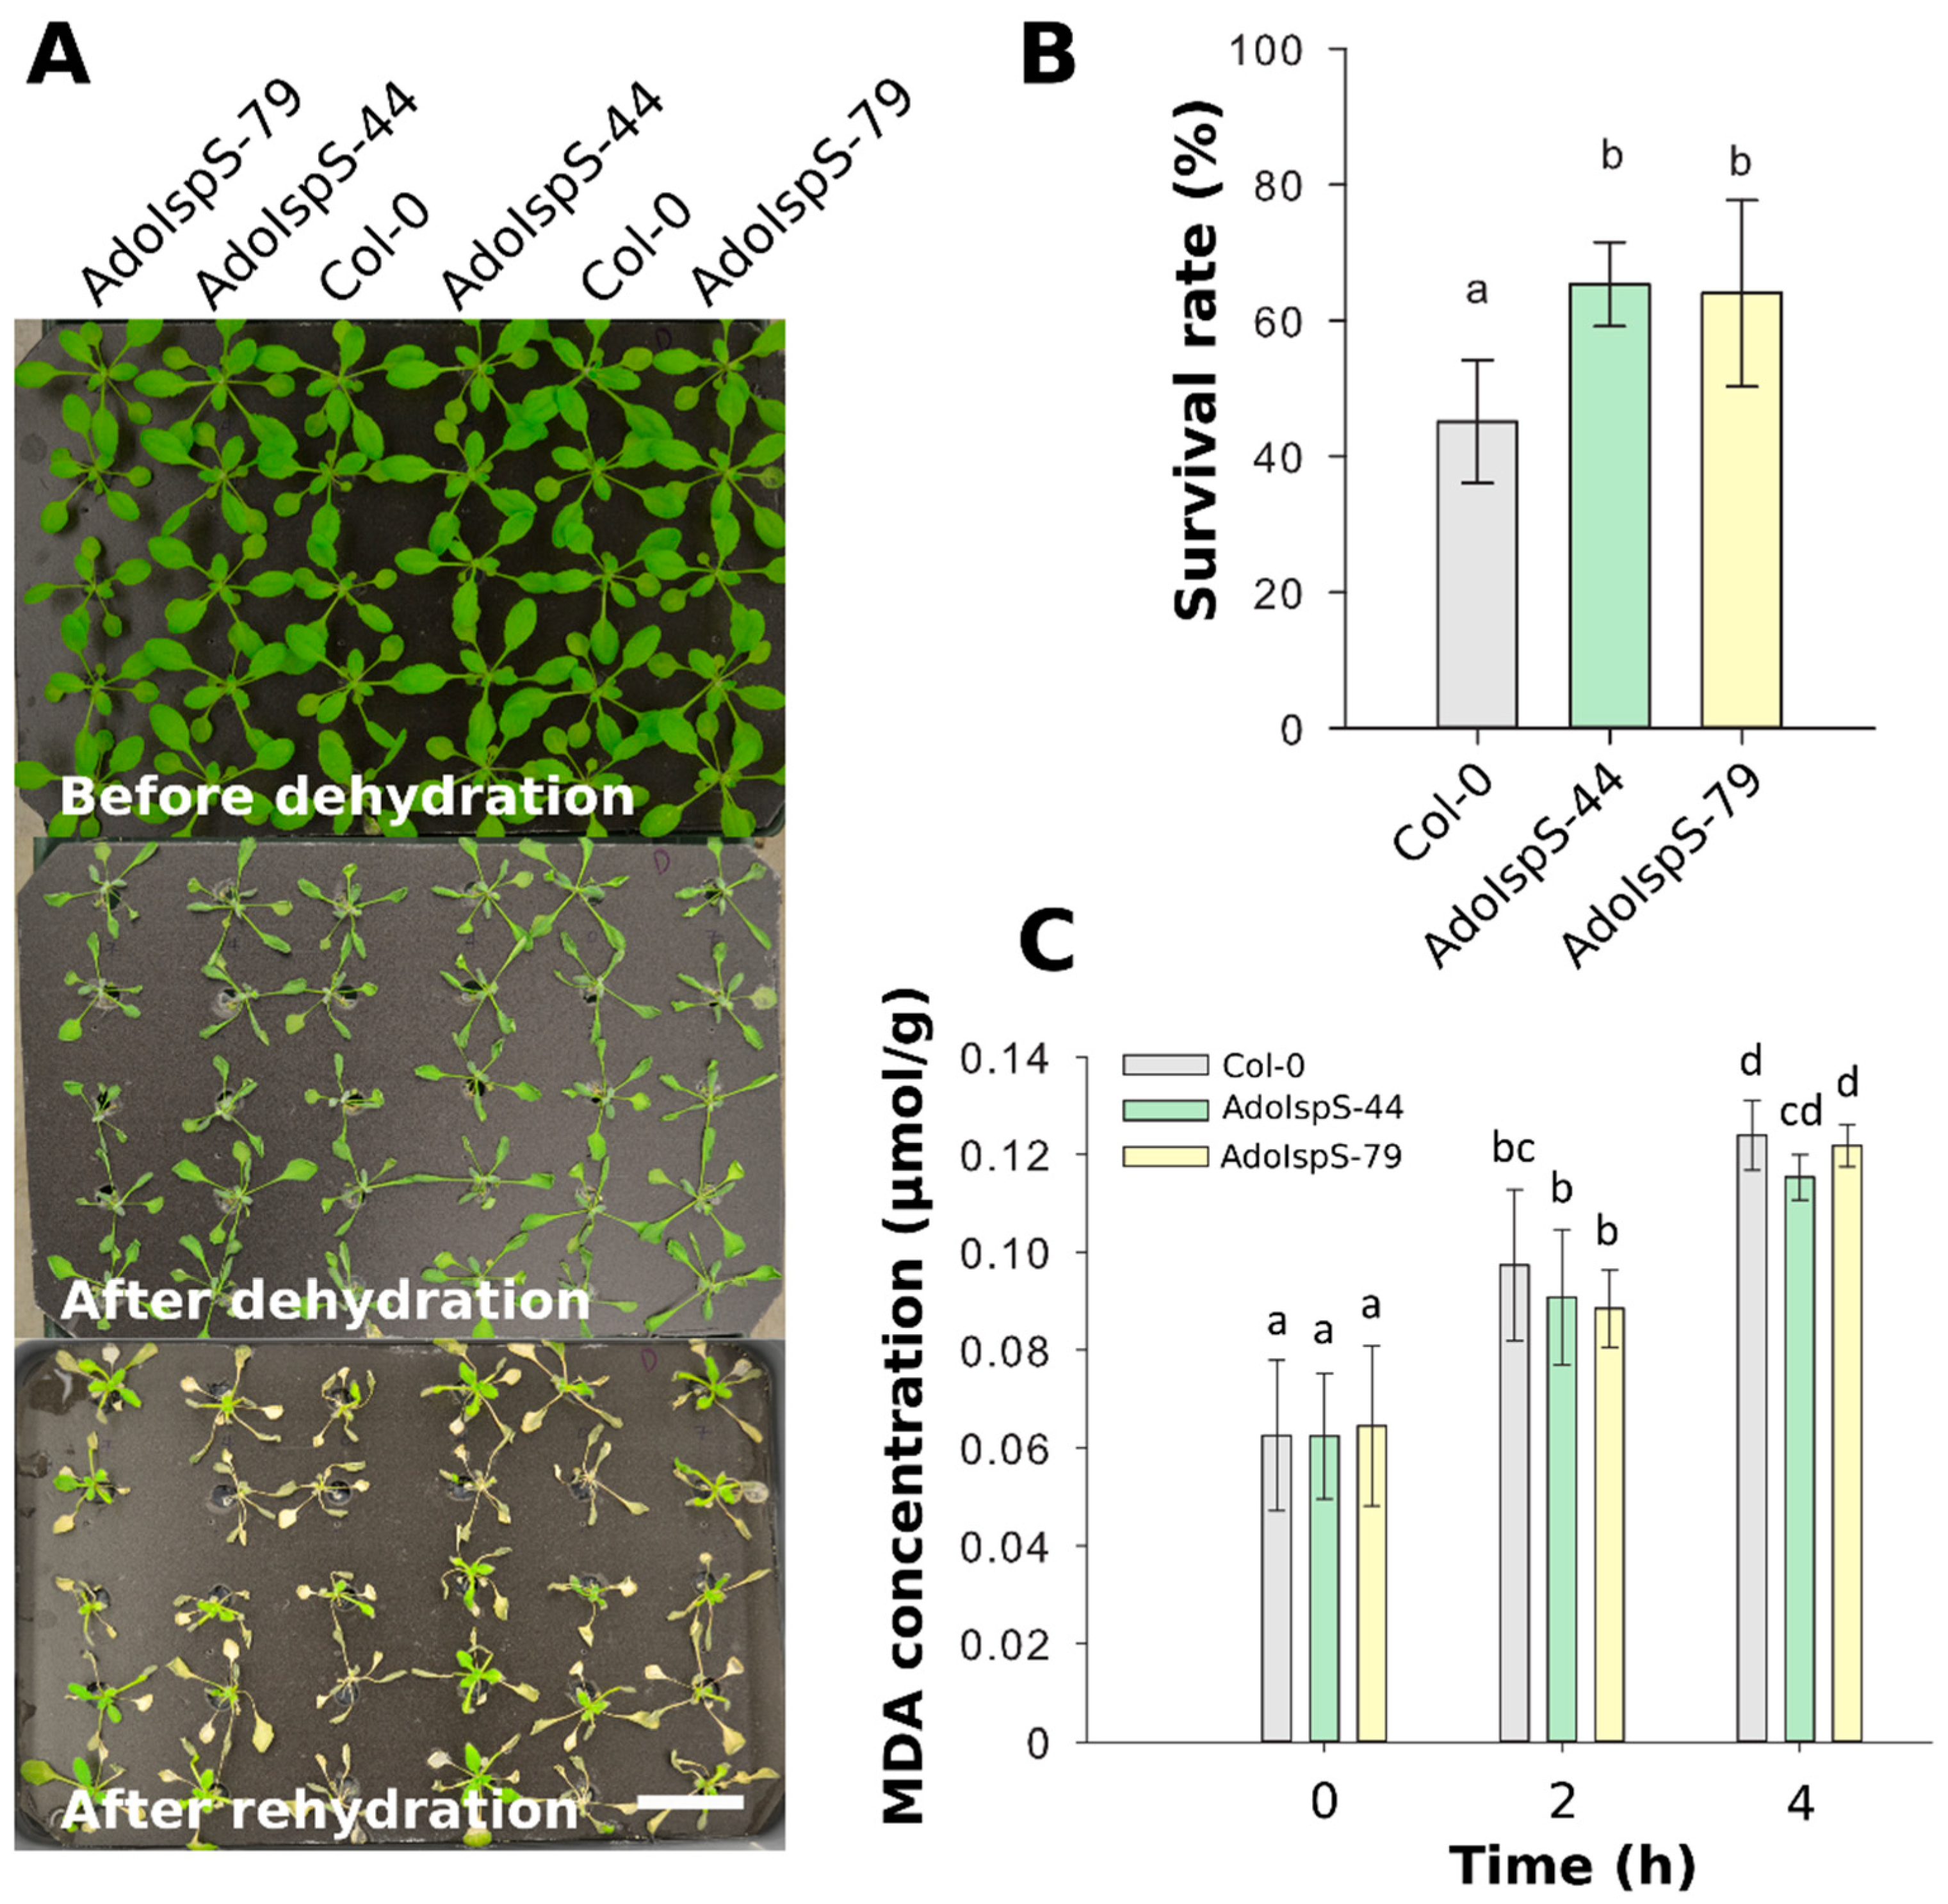
2.2. Enhanced Tolerance of AdoIspS Transgenic Arabidopsis Plants to Dehydration Stresses

In order to examine the responses of AdoIspS transgenic plants to osmotic stress, 4 day old seedlings from Col-0 and AdoIspS transgenic plants were grown in nutritional solution supplemented with different concentrations of PEG 6000. After 7 days of treatment, a strong reduction of plant growth was observed for all genotypes (Figure 4). Two-factor ANOVA (4 × 3) analysis was conducted to examine the effect of genotype and PEG concentration on root length. The results for the two-way ANOVA indicated a significant main effect for PEG concentration, F(3, 888) = 1528.84, p < 2.2 × 10⁻¹⁶, and for genotype, F(2, 888) = 14.97, p = 4.036 × 10⁻⁷. There was no statistically significant interaction between the effects of genotype and PEG concentration on root length, F (6, 888) = 1.18, p = 0.32. In none of the conditions tested did AdoIspS transgenic lines show consistent differences in tolerance to osmotic stress compared with Col-0, as assessed by root length.
To further evaluate the dehydration response at later developmental stages, the survival rates of 18 day old plants growing in nutrition solution were recorded after 1 day of dehydration and 2 days of recovery. One-way ANOVA was conducted to examine the effect of genotype on survival rate. The results for the analysis indicated a significant effect of genotype on survival rate, F(2, 14) = 6.26, p = 0.013. Compared with Col-0, both AdoIspS transgenic lines showed significantly higher survival rates (Figure 5A,B). Furthermore, to examine the oxidative stress caused by dehydration, plant lipid peroxidation was analyzed by assessing the accumulation of malondialdehyde (MDA). A two-factor ANOVA (3 × 3) was conducted to examine the effects of genotype and time on MDA concentration. The results indicated a significant main effect for time, F(2, 54) = 123.18, p < 2 × 10⁻¹⁶ but no significant main effect for genotype, F(2, 54) = 0.98, p = 0.38. There was no statistically significant interaction between the effects of genotype and time on MDA concentration, F (4, 54) = 0.5742, p = 0.6825. MDA content in both Col-0 and AdoIspS plants was significantly increased after dehydration treatment. No difference in MDA accumulation was found in transgenic lines compared to Col-0 (Figure 5C).
In addition, the detached rosette leaves from 3 week old plants growing in soil were used for a transpiration rate assay. The water loss rate was significantly lower in both AdoIspS transgenic lines than in Col-0 in the first hour, while the rate increased in a similar manner later on (Figure 6A,B). In order to dissect the cause of the lower transpiration rate of AdoIspS transgenic plants, stomatal apertures were measured of leaves of Col-0 and AdoIspS plants treated with ABA. A two-factor ANOVA (2 × 3) was conducted to examine the effect of genotype and ABA on stomatal aperture. The results indicated a significant main effect for ABA concentration, F(1, 1020) = 903.95, p < 2.2 × 10⁻¹⁶, and a significant main effect for genotype, F(2, 1020) = 11.75, p = 8.97 × 10⁻⁶. There was a statistically significant interaction between the effects of genotype and ABA concentration on stomatal aperture, F (2, 1020) = 5.26, p = 0.0053. In the absence of ABA, no obvious difference was detected between Col-0 and AdoIspS plants upon stomatal aperture. However, after incubation with ABA, AdoIspS plants exhibited a significantly lower width:length ratio than Col-0. Thus, AdoIspS plants showed enhanced ABA-induced stomatal closure (Figure 6C,D).
To evaluate in more depth the dehydration response at the molecular level, qRT-PCR was carried out using the stress-related marker genes COR15A, P5CS, RD20, and RD29A. Two-factor ANOVA (3 × 3) analyses were conducted to examine the effect of genotype and time on relative gene expression. The results for the two-way ANOVAs (Supplementary Table S2) indicated a significant main effect for time in all tests, F(2, 18) > 34.69, p < 6.68 × 10⁻⁷. A significant main effect for genotype, F(2, 18) > 14.86, p < 0.00015, was found for the effect of genotype on relative expression levels of genes COR15A and P5CS (both downregulated in transgenic lines compared to WT). There was a statistically significant interaction between the effects of genotype and time on expression levels for genes COR15A and of P5CS, F (4, 18) > 8.5, p < 0.0005 (details in Supplementary Table S2). Dehydration treatment caused a large increase in gene expression levels relative to non-treatment. Among these four genes, the expression levels of COR15A and P5CS were significantly elevated in Col-0 compared with AdoIspS plants (Figure 7A,B); no differences among genotypes were detected in RD20 or RD29A expression levels in response to dehydration stress (Figure 7C,D). These results may indicate that AdoIspS plants maintained a higher water potential.

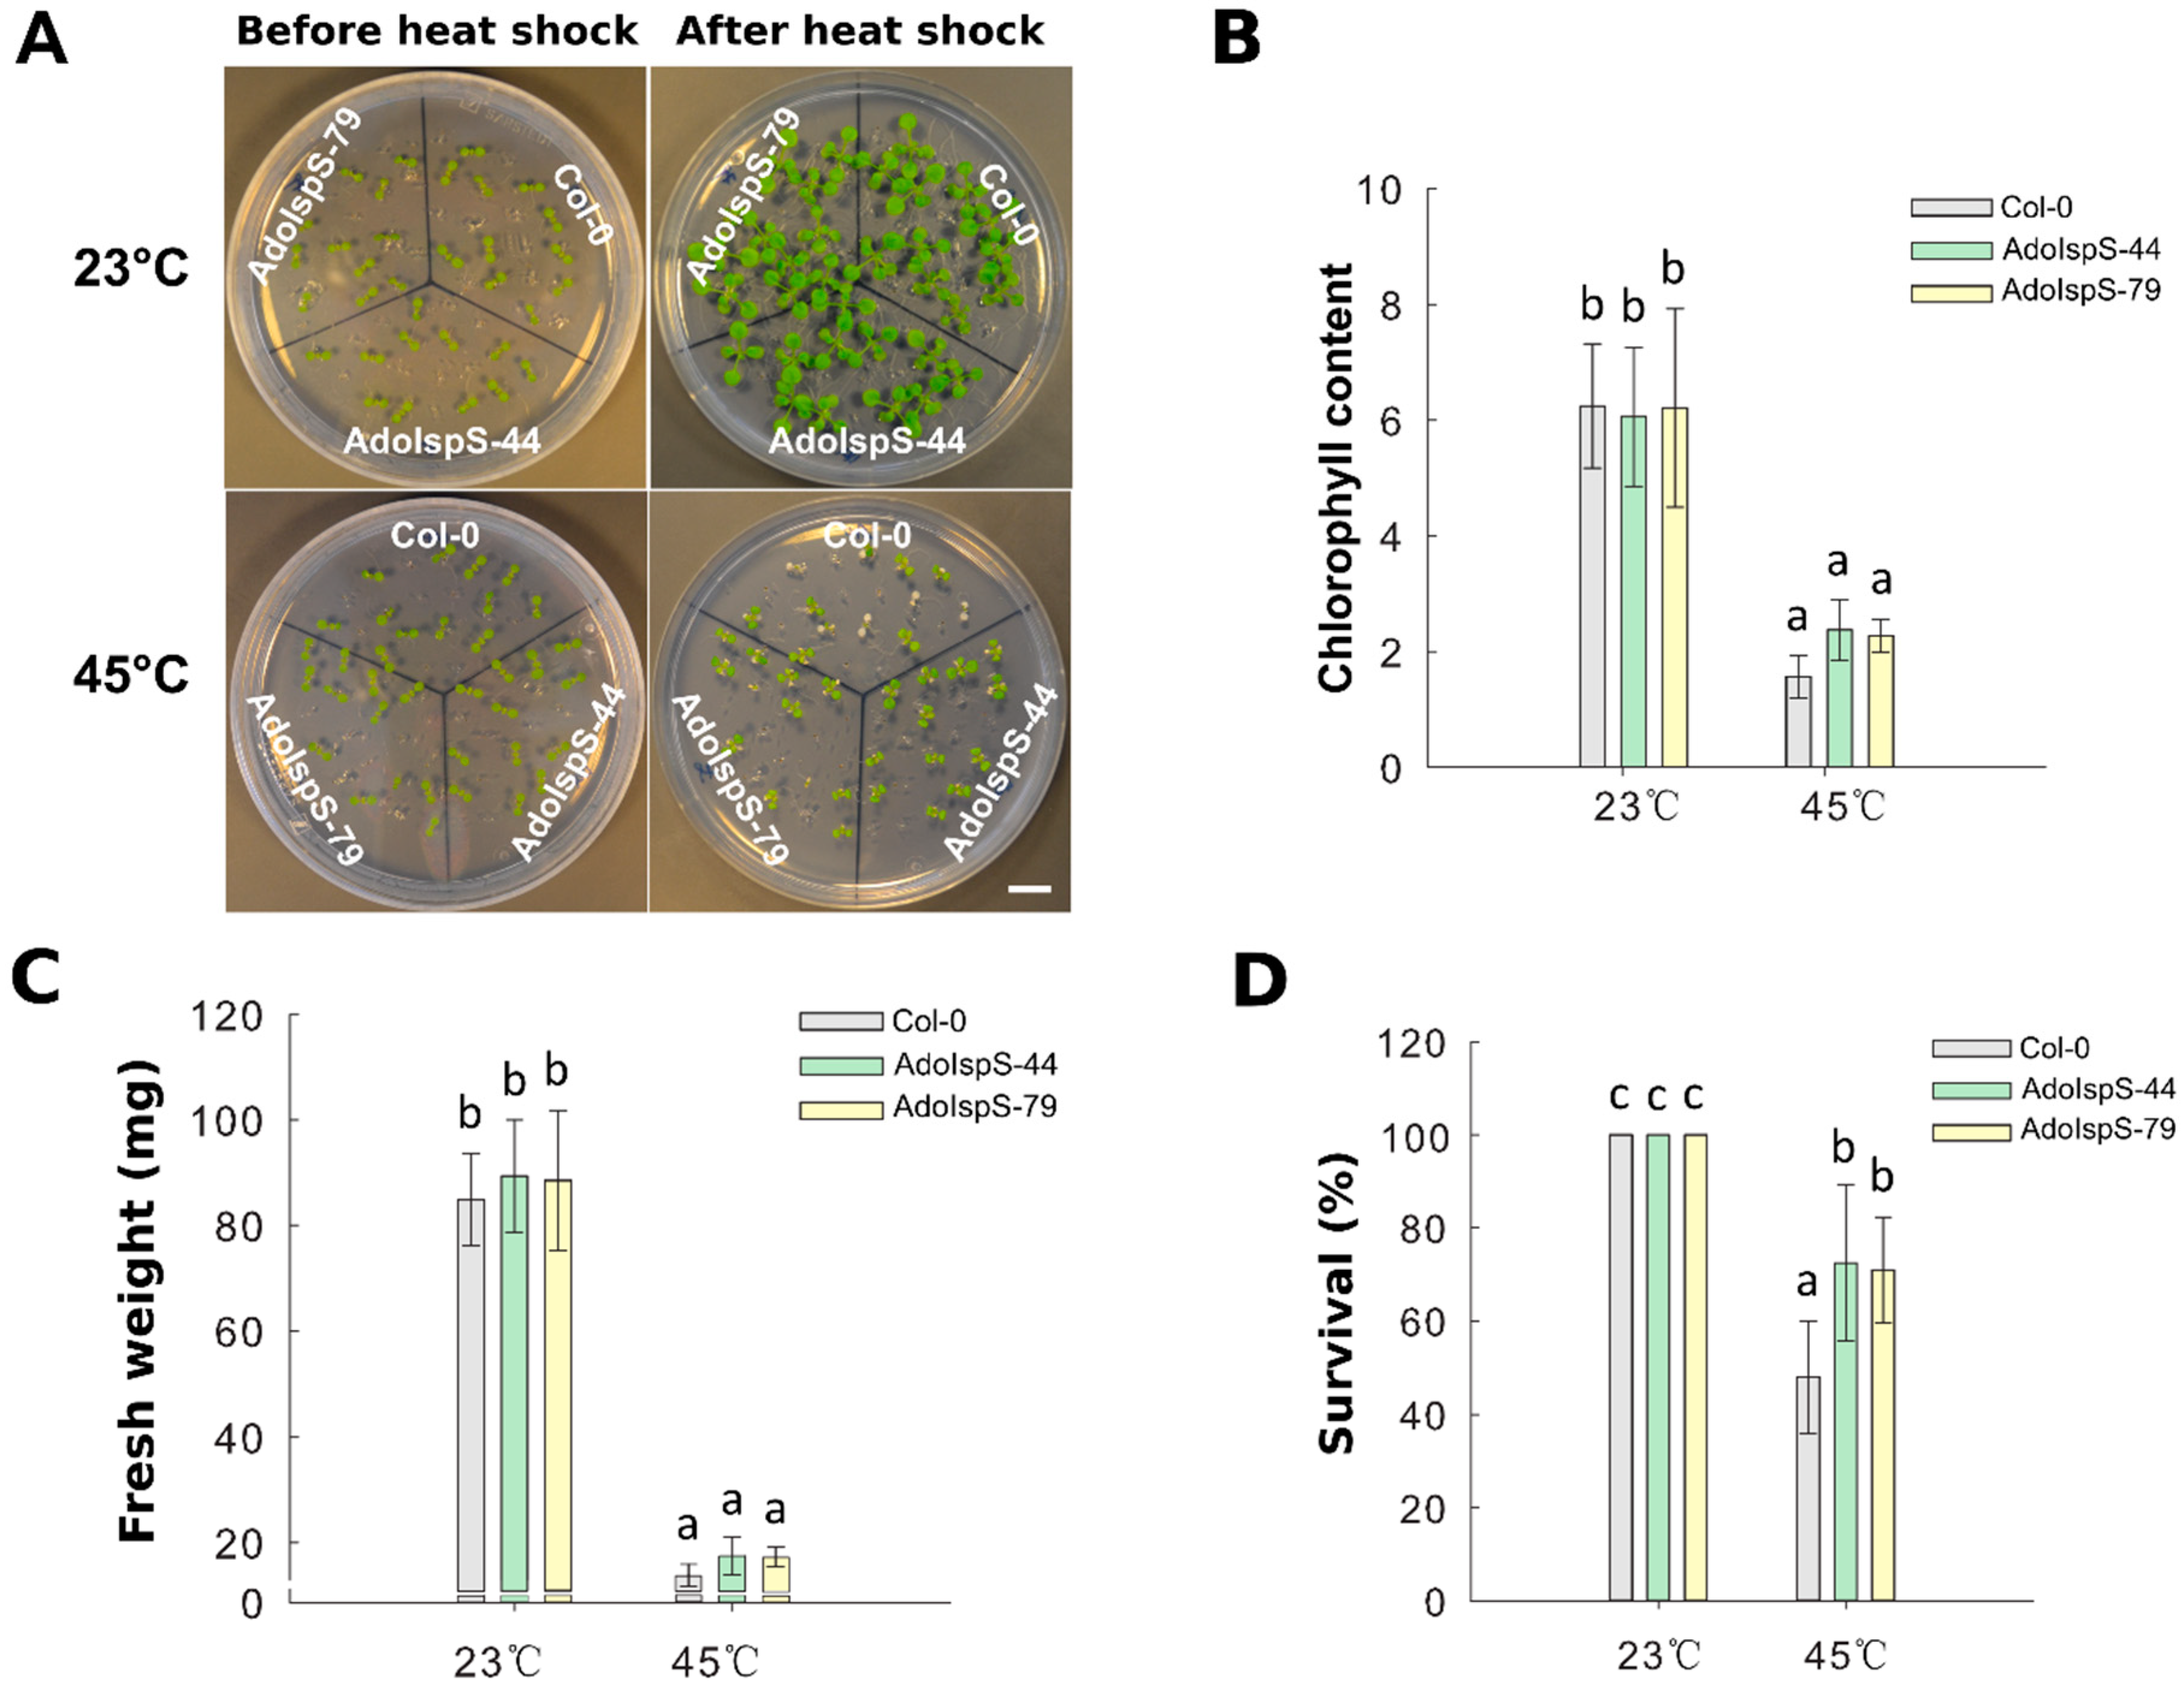
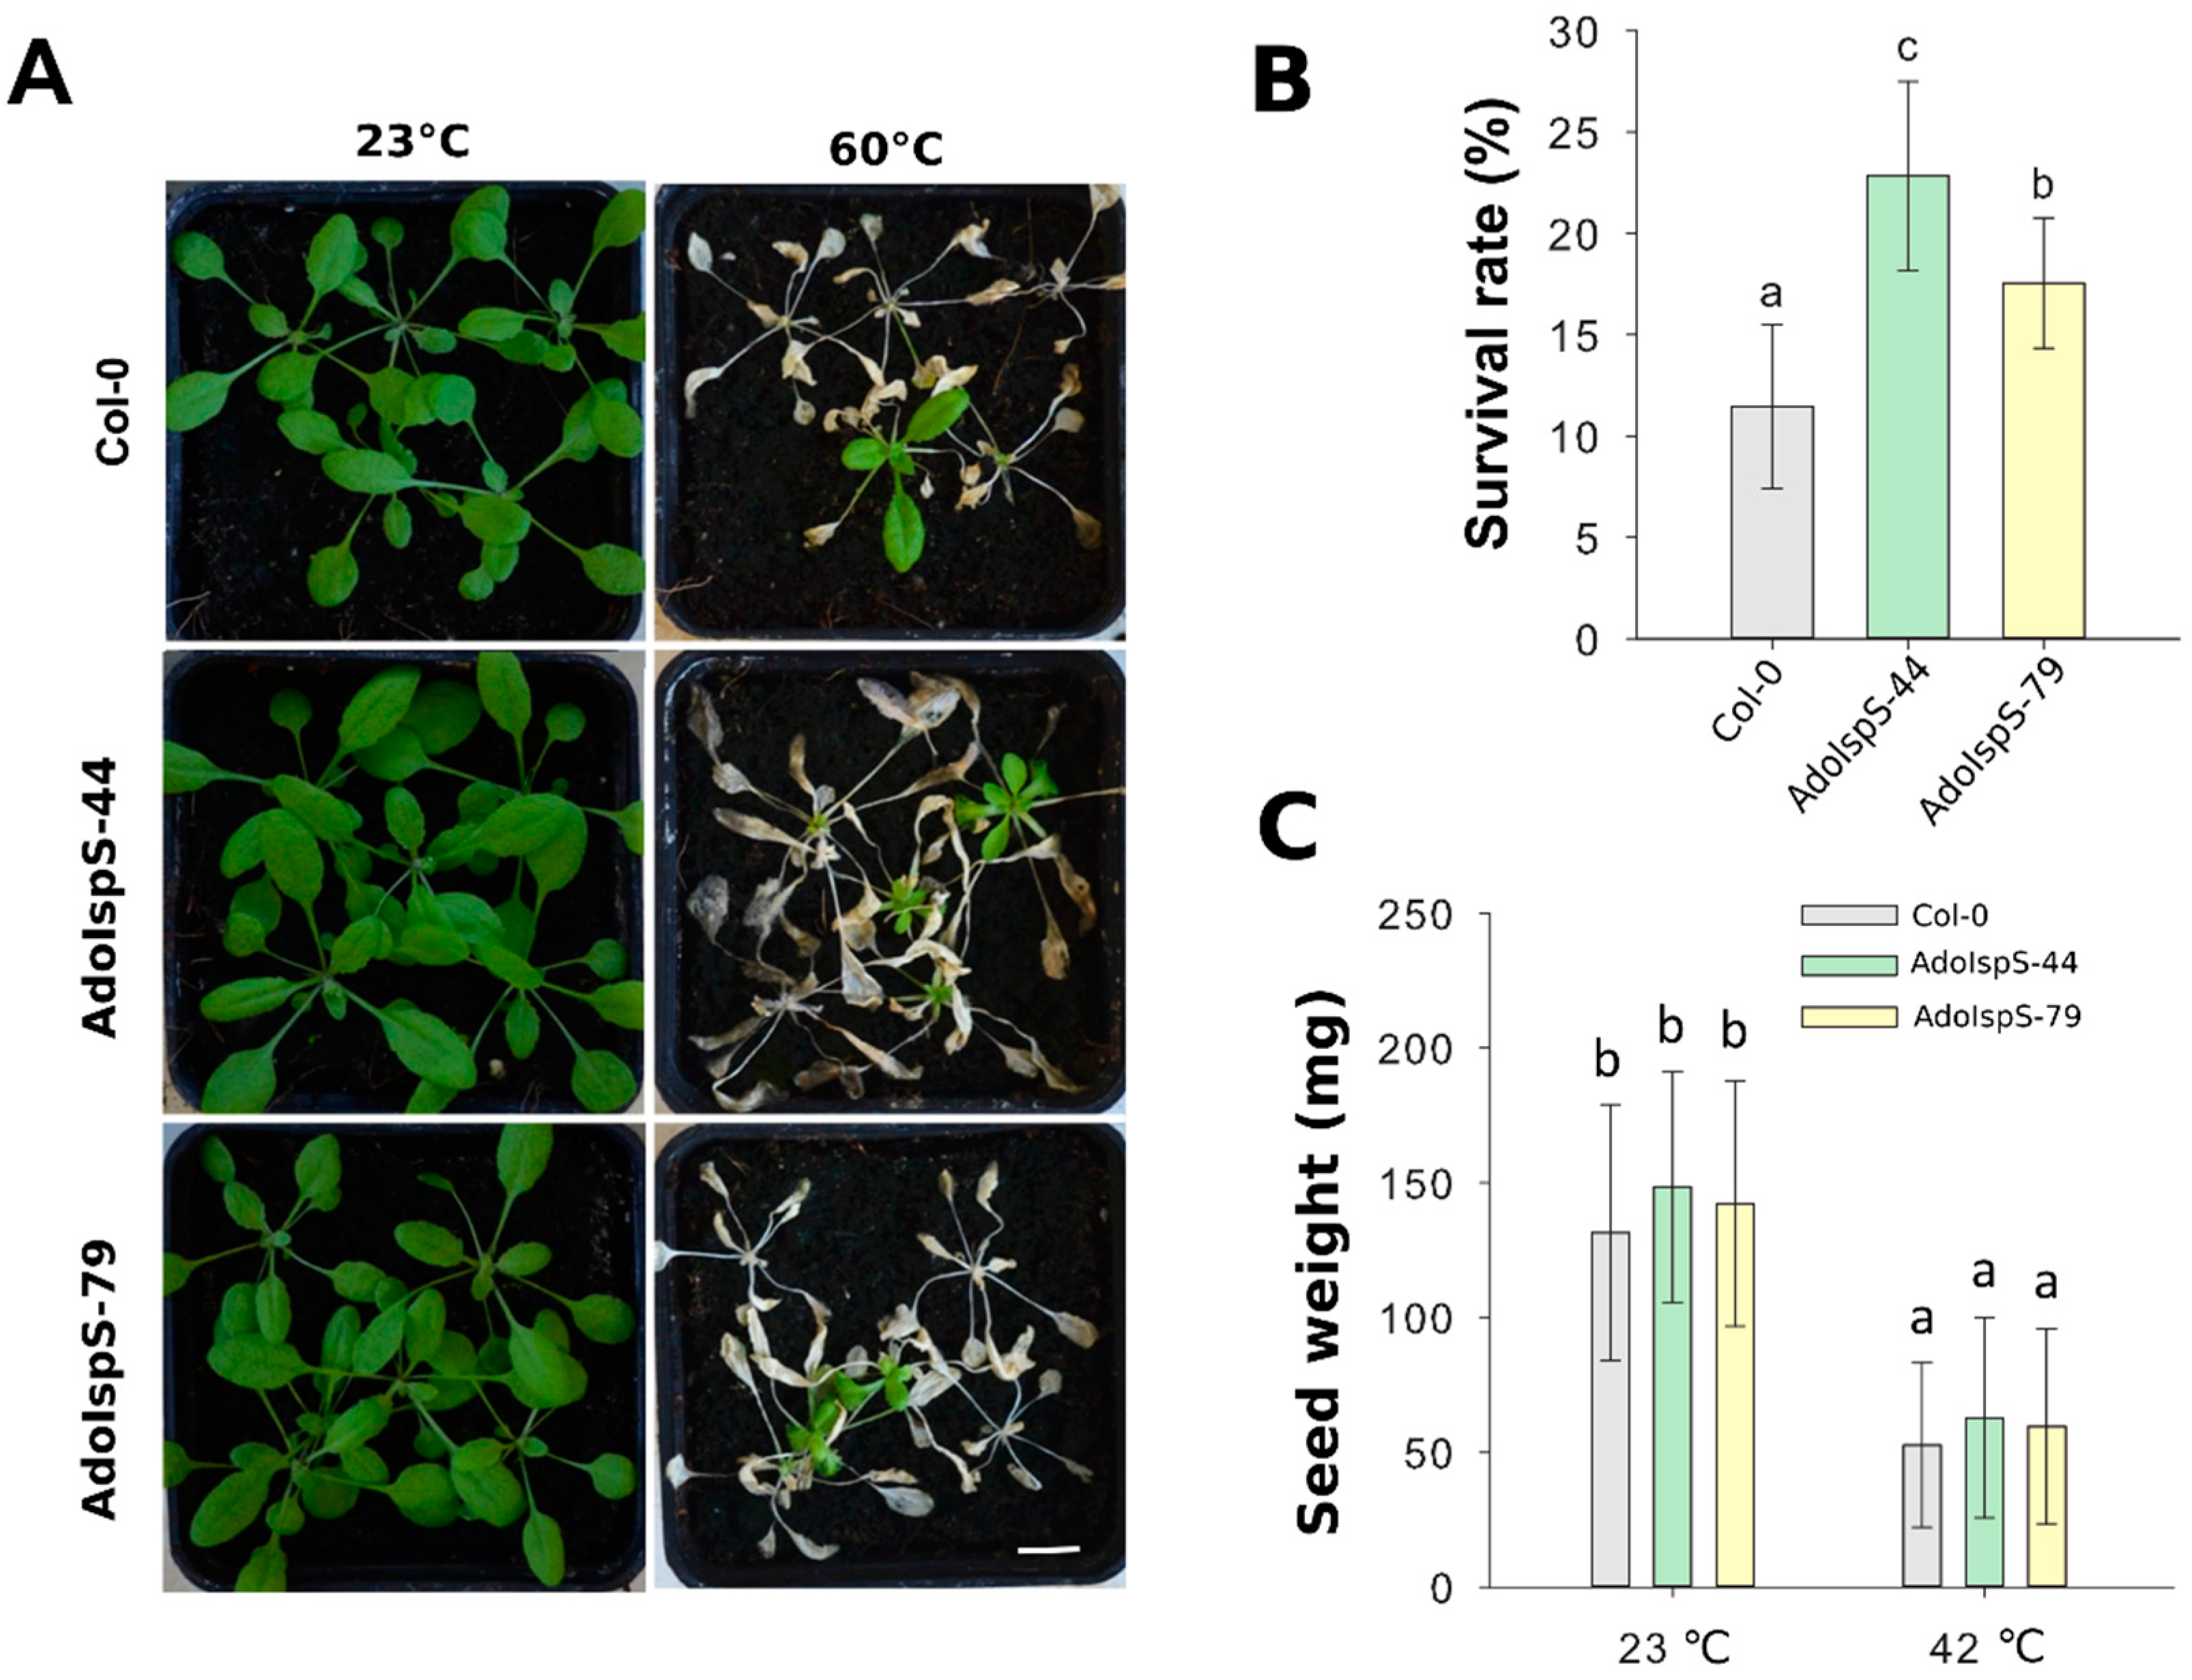
2.3. Enhanced Tolerance of AdoIspS Transgenic Arabidopsis Plants to Heat

A previous study demonstrated that AdoIspS expression was significantly upregulated upon heat treatment in A. donax [45]; in addition, the IspS gene from poplar could increase tolerance of transgenic Arabidopsis to heat stress at a later developmental stage [23]. Until now, limited studies examining the early developmental stage under heat treatment were available. Therefore, the resistance to heat shock of Col-0 and AdoIspS transgenic plants was examined to evaluate whether AdoIspS transgenic plants also exhibited an enhanced thermo-tolerance at early developmental stages. Seven day old seedlings were treated at 45 °C for one hour. Two-factor ANOVAs (2 × 3) were conducted to examine the effect of genotype and temperature on chlorophyll content, fresh weight, and survival rate. A significant main effect for temperature only was found for chlorophyll content and fresh weight, with, respectively, F(1, 30) = 217.96, p = 2.673 × 10⁻¹⁵ and F(1, 30) = 716.37, p < 2 × 10⁻¹⁶. In the case of survival rate, the two-factor ANOVA results indicated significant main effects for both temperature and genotype, with, respectively, F(1, 30) = 127.89, p = 2.42 × 10⁻¹² and F(2, 30) = 6.13, p = 0.0059. There was a statistically significant interaction between the effects of genotype and temperature on survival rate, F (2, 30) = 6.13, p = 0.0059. After a recovery phase, significantly more AdoIspS than Col-0 seedlings survived, although the chlorophyll content and fresh weights of both AdoIspS lines did not differ from WT. Compared with Col-0, recovered AdoIspS seedlings showed less necrosis (Figure 8).
In addition, 3 week old plants growing in pots were treated at 60 °C for 2.5 h under dim light conditions. One-way ANOVA was conducted to examine the effect of genotype on survival rate. The results for the analysis indicated a significant effect of genotype on survival rate, F(2, 14) = 15.43, p = 0.00048. After 7 days of recovery, the survival rates of both AdoIspS transgenic lines were significantly higher than that of Col-0 (Figure 9A,B).

2.4. Alteration of Inflorescence Architecture of AdoIspS Transgenic Arabidopsis Plants

Previous studies showed that the leaves of transgenic plants overexpressing PcIspS or PaIspS in Arabidopsis grew bigger compared to those of wild-type plants in normal growth conditions, but no differences were observed in siliques or seeds [22,23]. Based on these previous analyses, further investigation on the phenotypic variation between wild-type and AdoIspS transgenic plants was performed. No differences were detected in the total weight of seeds produced per plant (Figure 9C) and seed set per silique (Supplementary Figure S3). Unexpectedly, compared with Col-0, AdoIspS transgenic plants produced more lateral and axillary branches, which led to an increase of the total number of siliques produced per primary shoot and per plant by AdoIspS transgenic plants (Supplementary Figure S3). These changes in inflorescence architecture had not been previously reported.

3. Discussion

Our current knowledge of the role played by isoprene emission in abiotic-stress tolerance largely stems from a conspicuous body of functional studies on the physiology of transgenic tobacco or Arabidopsis plants overexpressing IspS genes from various species [10,22,23,45,52,53]. To date, by contrast, the molecular mechanisms underlying the widely characterized physiological responses of plants to isoprene are still poorly understood. In this study, we combined physiological and molecular approaches to investigate in greater depth such mechanisms in relation to major types of abiotic stress, like water deficiency, excess of ABA, and high temperature.
The general characterization of our transgenic lines via stress-tolerance tests analogous to those conducted in previous publications confirmed that they behaved as other isoprene-emitting (IE) Arabidopsis lines. Survival of desiccation and survival of heat stress (Figure 4, Figure 5, Figure 8 and Figure 9) were, in fact, all in agreement with previous observations, suggesting that isoprene emission confers enhanced water-stress tolerance and heat-stress tolerance in transgenic models engineered to emit isoprene [23,25]. Previous studies, however, failed to identify a link of causal relationships between isoprene and ABA in the short term, despite the expectation that the diversion of DMADP from the MEP pathway might reduce ABA biosynthesis [25]. Whole-leaf ABA levels were found not to correlate to stomatal conductance, as both increased in IE plants compared to WT under the same levels of dehydration stress [25]; the studies referred mainly to medium- to long-term stress responses. Our results provide direct evidence of the effect that isoprene emission has on ABA-driven processes like stomatal closure, seedling greening, root elongation, and gene expression. The reason for the lack of correlation between whole-leaf ABA levels and stomatal conductance observed in previous studies [25] may be related to the fact that the action exerted by isoprene is both temporally and spatially restricted. Concerning time, we found that the effect of isoprene emission on water usage was significant only within the first hour upon stress application, as demonstrated by the time course of early desiccation stages assessed in this work (Figure 6A,B). Such time-restricted water-conservative behavior of isoprene-emitters likely explains the previous observations that isoprene emission seems to have relevance in short-term water stress, while the trait may not be ecologically relevant for taxa subjected to prolonged and intense heat or water-deprivation stresses [5,24,25]. The spatial evidence comes from the link between the action of isoprene and stomatal guard cells. First of all, the stomatal aperture test demonstrated that stomata of isoprene-emitting plants were more responsive to ABA, i.e., they closed more, than WT (Figure 6C,D). According to the most widely accepted definition of the term [54], the transgenic emitters showed an anisohydric, water-conservative behavior. This was in contrast to what previously reported for transgenic tobacco subjected to long-term water stress [25]. More recently, isoprene emission has been demonstrated to have partly contrasting effects on Arabidopsis and tobacco, where the trait is associated with yield penalties [24,50,55], which could be caused by different water-usage behavior. The second piece of evidence that isoprene action is mediated by guard-cell specific action came from RD29B, which together with RAB18 is an important component of the ABA signaling pathway specific to the stomata in the leaf [56,57]. RD29B was upregulated in IE plants compared to WT, consistently with its known inducibility in the presence of ABA [56,58,59,60,61]. Both of the genes were found to depend for activation on the HAB1-SWI3B complex (formed by the protein phosphatase type 2C HYPERSENSITIVE TO ABA1 and the chromatin remodeling factor SWITCH SUBUNIT 3B), while the expression of RD29A and P5CS1 genes was HAB1–SWI3B-independent [58]. Thus, the differences in regulation observed in this study indicate the presence of fine-tuning regulatory mechanisms deserving further investigation. It is noteworthy that, at the same time, the ABA biosynthetic gene NCED3 was downregulated, suggesting a concomitant reduction of ABA biosynthesis consequent to exogenous hormone administration (Figure 3A,B). While ABA’s positive feedback loop on its biosynthetic genes is well established [62], comparatively little is known on how such a self-reinforcing loop is stopped in order to avoid ABA overproduction. Repressors of both of the genes analyzed in this work have been identified [63], but whether their expression can be modulated by exogenous ABA has not been investigated. Possibly, due to the fact that leaf mesophyll cells are the primary site of ABA biosynthesis in leaf [64], its synthesis may have to be finely regulated to prevent undesired stomatal closure.
Interestingly, the physiological data showed variations in the opposite direction of ABA responsiveness in seedlings (decreased ABA sensitivity) as compared to stomata (increased sensitivity), suggesting tissue-specific variation of the effects that isoprene–ABA interaction has on the following abiotic stress responses. These results were in line with the recent findings that isoprene acts as a signaling molecule in plants [50,65]. Isoprene has been proposed to downregulate MARD1 in Arabidopsis but not tobacco [50]. As with SWI3B, MARD1 loss of function also produces the same lack of sensitivity to ABA of seedlings at the radicle stage [66]. Further analyses are required to test the possible involvement of MARD1 and SWI3B in this specific branch of isoprene signaling.
In addition to ABA-mediated responses in the short term, however, the analysis of drought-responsive genes indicated the involvement of an osmotic component to the water tolerance mediated by isoprene. Two of the water-stress-related genes known to respond to ABA (RD20 and RD29A [67,68]), in fact, were not differentially regulated between IE and WT (Figure 7C,D). By contrast, COR15A and P5CS were both downregulated in IE lines compared to WT (Figure 7A,B). The function of the COR15A protein is to stabilize membrane structure by reducing the formation of lamella-to-hexagonal II phase [69] and to stabilize chloroplast membranes in vivo [70]. The expression of COR15A is mainly induced by salt and cold, two potent elicitors of osmotic stress [71]. Besides COR15A, the expression level of P5CS in AdoIspS lines was also significantly lower than that of wild-type plants. P5CS is a rate-limiting enzyme which is responsible for synthesizing proline under stress conditions [72,73]. Many plants accumulate proline to offset the cellular imbalances caused by various stresses, including drought and osmotic stress [74]. Taking these results together with the enhanced tolerance to PEG-mediated osmotic stress, we propose that isoprene emission under drought stress can prevent damage to membrane integrity in response to water-deficit-driven osmotic stress. In recent years, evidence that isoprene affects membrane properties has been reported [15,75,76,77]. However, these observations are at odds with the estimated amount of isoprene in membranes, which is too little to justify a bulk effect [78]. The results presented here show that isoprene may explain this apparent contradiction by strengthening membranes not by a direct effect, but through changes in the expression of genes that play important roles in membrane integrity. Further investigation will be required to confirm this observation and, in particular, to ascertain the role of chloroplasts in such a mechanism.
In conclusion, we found evidence that isoprene emission is involved in short-term regulation of water-use efficiency by enhancing ABA sensitivity of stomatal cells through upregulation of the key ABA-signaling gene RD29B. In addition, isoprene is involved in other ABA-related physiological responses like seedling greening and root elongation, but in these cases, isoprene action led to a decreased sensitivity to the hormone, rather than to an increase as observed in stomata. These results provide additional support to the increasingly recognized function of isoprene as a signaling molecule and suggest novel directions of investigation in this exciting new development in the biological functions of this important bVOC. Future research directions include the detailed investigation of the role of ABA-signaling in relation to isoprene emission. In particular, the use of functional genomics and genetics approaches could help to further our mechanistic insights into the isoprene-mediated regulation of hormonal control of plant development and abiotic-stress tolerance.

4. Materials and Methods

4.1. Plant Materials and Growth Conditions

Arabidopsis Col-0 wild-type and two AdoIspS transgenic homozygous lines (AdoIspS-44 and AdoIspS-79) overexpressing the isoprene synthase gene from Arundo donax (GenBank accession No. KX906604) were used [45,79] and further characterized here. The promoter used for overexpression was the strong CaMV 35S promoter. Seeds of Col-0 and transgenic lines were surface-sterilized and sown on Murashige-Skoog (MS) agar medium containing 1% sucrose. After stratification at 4 °C for three days, the plates were transferred to a growth chamber (KBF 720, Binder GmbH, Tuttlingen, Germany) set at 23 °C and 40–50% relative humidity with light intensity of 100–120 μmol m−2·s−1 under long-day conditions (16 h light/8 h dark). A few days after germination, the seedlings were transferred to pots filled with commercial soil and grown in the same condition as mentioned above. The protocol used for plants growing in hydroponics was the one described by Tocquin and colleagues [80] and the plants were maintained in a growth chamber under the environmental conditions mentioned above [79].

4.2. Plant Architecture and Seed Production

The total numbers of secondary stems and axillary branches were assessed using 8 week old plants. For seed-productivity analyses, the seeds were collected by using Arasystems (AraSystem 360 KIT; Beta Tech bvba, Gent, Belgium) from 12 week old plants in two different temperature settings, normal growth condition (23 °C) and normal growth condition with a heat shock (42 °C) applied for two hours (11:00 to 13:00) every day since plants were 3 weeks old.

4.3. Seed Germination Assay and Root Growth Measurement

For germination tests, 72 seeds of each genotype were surface-sterilized and sown on Petri dishes containing half-strength MS medium supplemented either with 0.3 μM or 0.5 μM abscisic acid (ABA) dissolved in ethanol, while an equal amount of absolute ethanol without ABA was added to untreated control plates. Germination rates, which were based on radicle protrusion, were recorded after 3, 5, and 7 days of growth, and the percentage of green cotyledons was calculated after 7 days of growth. Three biological replicates were performed for each experimental condition.
To compare the response to ABA treatment among different genotypes during the post-germination stage, the root length was measured. Four day old seedlings growing on half-strength MS agar medium were transferred into square Petri dishes containing fresh medium supplemented either with 10 μM or 20 μM ABA or an equal amount of 99% ethanol (mock), and grown for an additional 7 days. Afterwards, the root length of vertically grown seedlings was captured with a stereomicroscope (MZ75, Leica Microsystems Srl, Buccinasco (MI), Italy) equipped with a color-CCD camera (DFC 420C, Leica Microsystems Srl, Buccinasco (MI), Italy), and the fresh weight of each plant was measured. Images were analyzed with the Leica Application Suite 2.8.1 software. Six biological replicates were performed for this experiment.
For osmotic-stress treatment with polyethylene glycol (PEG) 6000, 4 day old plants were transferred to the same hydroponic solution containing various concentrations of PEG 6000. Plants were photographed and root lengths were measured after 7 days of treatment. The root length and fresh weight were measured as described previously. At least 15 plants of each genotype were measured per treatment and five biological replicates were conducted correspondingly.

4.4. Stomatal Aperture Assay and Water Loss Measurement

Stomatal closing assays were measured as described previously by Ren and colleagues, with slight modification [81]. Rosette leaves of 4 week old plants were detached and incubated in a stomatal opening solution containing 10 mM MES, 50 μM CaCl2, and 10 mM KCl (pH 6.15), and exposed under fluorescent light (150 μmol m−2 s−1) for 3 h. The buffer was then replaced with freshly made opening solution containing 10 μM ABA for stomatal closing. After 3 h of treatment with ABA, about 40 stomata of each genotype were observed randomly under a differential interference contrast (DIC) microscope (DM 2500, Leica Microsystems Srl, Buccinasco (MI), Italy) with Leica Application Suite LAS V3.7 software. Image J 1.50i software (http://imagej.nih.gov/ij) was used to measure the length and width of individual stomata. Each experiment was repeated five times.
The water loss rate was assayed as follows. For each genotype, 15 rosette leaves of equal size were detached from five different 3 week old plants at the same developmental stage, and weighed immediately at each indicated time-point with five replicates.

4.5. Dehydration Treatment and Lipid Peroxidation Quantification

18 day old Col-0 and AdoIspS transgenic plants growing hydroponically were lifted out of the solution and directly exposed to air for 24 h, after which plants were rehydrated by putting them back into the same solution to recover for 48 h. Plants with rehydrated primary shoots were counted as survival events. This experiment was performed in five replicates, with about 20 plants for each genotype in each replicate.
Lipid peroxidation was quantified by measuring malondialdehyde (MDA) accumulation, using the TBARS method [82] with a slight modification. First, 100 mg of frozen plant material was homogenized in 1 mL of 0.1% (w/v) trichloroacetic acid (TCA) solution. The homogenate was centrifuged at 13,000 g at 4 °C for 20 min. Next, 0.5 mL of the supernatant was mixed with 1.5 mL of freshly made 20% TCA solution containing 0.5% (w/v) thiobarbituate acid (TBA). The mixture was heated in a boiling water bath for 30 min and cooled down in ice-cold water. Samples were centrifuged again for 5 min at 10,000 g. The supernatant absorbance was measured with an Ultrospec 3100 proUV/Visible Spectrophotometer (GE healthcare) at 532 nm, deducting the value at 600 nm to correct for non-specific turbidity. The extinction coefficient 155 mM−1 cm−1 was used to calculate the content of MDA–TBA complex. Results were obtained from seven biological replicates for each genotype.

4.6. Heat Shock Treatment and Chlorophyll Content Analysis

The heat survival test for Col-0 and AdoIspS transgenic plants at different developmental stages was carried out as follows: 7 day old seedlings were incubated at 45 °C in a pre-heated chamber for 1 h in the dark, and brought back to a 23 °C growth chamber for recovery. The survival rate was recorded after a week of recovery. Plants with four green leaves were scored as survival events. Each plate contained about 14 plants for each genotype as one replicate, and six replicates in total were performed. In addition, 3 week old plants growing in pots were transferred to a 60 °C growth chamber under dim light conditions (5 μmol·m−2·s−1). After 2.5 h of treatment, plants were moved back to the normal growth condition to revive. The percentages of surviving plants were calculated after 7 days of recovery. Six replicates were tested and each replicate was performed with 20 plants.
Leaf chlorophyll content was measured by homogenizing plants of each genotype using a TissueLyser II in the presence of 80% (v/v) ice cold acetone. After centrifugation for 13 min at 4600 rpm, the supernatant was collected and the pellet was macerated with acetone again and centrifuged as before. The absorbance of combined supernatant was determined according to the method described previously [83]. The absorbance was measured using a spectrophotometer at 663 nm for chlorophyll a and 645 nm for chlorophyll b. The Arnon equation was used for calculation of chlorophyll a concentration, Chl a = 12.7 × OD663 − 2.69 × OD645, while for chlorophyll b the equation was Chl b = 22.9 × OD645 − 4.68 × OD663, and for total chlorophyll content was C= 20.2 × D645 + 8.02 × D663. Six independent biological replicates were performed for this analysis.

4.7. RNA Isolation and qRT-PCR Analysis under Dehydration and ABA Treatments

Total RNA was extracted from Col-0 and AdoIspS transgenic plants using the Trizol reagent (Invitrogen) and treated with DNase I (Sigma) to eliminate genomic DNA contamination. After RNA quantification using a spectrophotometer and integrity control on agarose gel, 1 µg of total RNA was reverse-transcribed using SuperScriptIII (Invitrogen) to synthesize the first strand of cDNA. Quantitative real-time PCR (qRT-PCR) was performed using Platinum SYBR Green qPCR SuperMix-UDG (Invitrogen) according to the manufacturer’s instructions in a Bio-Rad C1000 Thermal Cycler detection system programmed as in Reference [84]. In brief, the qPCR reaction was performed by adding 1 µL of 10-fold diluted cDNA (5 ng of starting RNA), 200 nM of each primer, 6.25 µL of Platinum® SYBR® Green qPCR SuperMix-UDG (Invitrogen) and H2O to reach a final volume of 12.5 µL. The qRT-PCR program was set as follows: 2 min at 50 °C, 2 min at 95 °C, 40 cycles of 15 s at 95 °C, and 30 s at 60 °C. The melting curves were recorded for every gene after Cycle 40 by constantly raising the temperature from 65 °C to 90 °C. A standard curve of qPCR reaction was generated from five points of a 4-fold dilution series. The slope (S) of the standard curve was used to calculate the amplification efficiency (E) of each primer pair as follows: E = 10 (−1/S). The qRT-PCR results are from at least three technical and three biological replicates. The relative transcription level of each gene was calculated with the 2−ΔΔCT method and normalized to the mean of internal control Actin for the same sample. Primers used for this analysis are listed in Supplementary Table S3.

4.8. Statistical Analysis

Data with one independent variable (factor) were analyzed using one-way ANOVA analysis. Data with one independent variable (factor) were analyzed using two-way (two-factor) ANOVA analysis. Tukey’s multiple comparison and least-significant-difference (LSD) tests were used to identify significant differences. Differences were considered significant if p ≤ 0.05 in the two-sided test. Compact letter display was used to summarize the differences among means. All analyses were run in R version 4.0.0 (2020. 04.24 [85]) using the scripts provided in Reference [86].

Supplementary Materials

Supplementary materials can be found at https://www.mdpi.com/1422-0067/21/12/4276/s1.

Author Contributions

Conceptualization, L.T., M.L. and C.V.; methodology, J.X. and M.L.; validation, M.L. and C.V.; resources, M.L. and C.V.; data curation, J.X., M.L. and C.V.; writing—original draft preparation, J.X.; writing—review and editing, L.T., M.L. and C.V.; visualization, J.X., M.L. and C.V.; supervision, M.L. and C.V.; project administration, C.V.; funding acquisition, C.V. All authors have read and agreed to the published version of the manuscript.

Funding

This work was supported by the Autonomous Province of Trento (Italy) through core funding of the Ecogenomics group in Fondazione E. Mach and by the China Scholarship Council (J.X.: 201306300083).

Conflicts of Interest

The authors declare no conflict of interest.

Abbreviations

IspSIsoprene synthase
ABAAbscisic acid
ROSReactive oxygen species
DMADPdimethylallyl diphosphate
MEPmethylerythritol 4-phosphate
PEGPolyethylene glycol
MDAmalondialdehyde
qRT-PCRQuantitative real time polymerase chain reaction
TCATrichloroacetic acid
TBAThiobarbituate acid

References

  1. Trenberth, K.E.; Dai, A.; van Schrier, G.D.; Jones, P.D.; Barichivich, J.; Briffa, K.R.; Sheffield, J. Global warming and changes in drought. Nat. Clim. Chang. 2014, 4, 17–22. [Google Scholar] [CrossRef]
  2. Vickers, C.E.; Possell, M.; Cojocariu, C.I.; Velikova, V.B.; Laothawornkitkul, J.; Ryan, A.; Mullineaux, P.M.; Hewitt, C.N. Isoprene synthesis protects transgenic tobacco plants from oxidative stress. Plant Cell Environ. 2009, 32, 520–531. [Google Scholar] [CrossRef] [PubMed]
  3. Sindelarova, K.; Granier, C.; Bouarar, I.; Guenther, A.; Tilmes, S.; Stavrakou, T.; Müller, J.F.; Kuhn, U.; Stefani, P.; Knorr, W. Global data set of biogenic VOC emissions calculated by the MEGAN model over the last 30 years. Atmos. Chem. Phys. 2014, 14, 9317–9341. [Google Scholar] [CrossRef] [Green Version]
  4. Su, L.; Patton, E.G.; de Arellano, J.V.G.; Guenther, A.B.; Kaser, L.; Yuan, B.; Xiong, F.; Shepson, P.B.; Zhang, L.; Miller, D.O.; et al. Understanding isoprene photooxidation using observations and modeling over a subtropical forest in the southeastern US. Atmos. Chem. Phys. 2016, 16, 7725–7741. [Google Scholar] [CrossRef] [Green Version]
  5. Loreto, F.; Fineschi, S. Reconciling functions and evolution of isoprene emission in higher plants. New Phytol. 2015, 206, 578–582. [Google Scholar] [CrossRef] [PubMed]
  6. Brilli, F.; Barta, C.; Fortunati, A.; Lerdau, M.; Loreto, F.; Centritto, M. Response of isoprene emission and carbon metabolism to drought in white poplar (Populus alba) saplings. New Phytol. 2007, 175, 244–254. [Google Scholar] [CrossRef]
  7. Harrison, S.P.; Morfopoulos, C.; Dani, K.G.S.; Prentice, I.C.; Arneth, A.; Atwell, B.J.; Barkley, M.P.; Leishman, M.R.; Loreto, F.; Medlyn, B.E.; et al. Volatile isoprenoid emissions from plastid to planet. New Phytol. 2013, 197, 49–57. [Google Scholar] [CrossRef]
  8. Velikova, V.; Loreto, F. On the relationship between isoprene emission and thermotolerance in Phragmites australis leaves exposed to high temperatures and during the recovery from a heat stress. Plant Cell Environ. 2005, 28, 318–327. [Google Scholar] [CrossRef]
  9. Centritto, M.; Haworth, M.; Marino, G.; Pallozzi, E.; Tsonev, T.; Velikova, V.; Nogues, I.; Loreto, F. Isoprene emission aids recovery of photosynthetic performance in transgenic Nicotiana tabacum following high intensity acute UV-B exposure. Plant Sci. 2014, 226, 82–91. [Google Scholar] [CrossRef]
  10. Vickers, C.E.; Gershenzon, J.; Lerdau, M.T.; Loreto, F. A unified mechanism of action for volatile isoprenoids in plant abiotic stress. Nat. Chem. Biol. 2009, 5, 283–291. [Google Scholar] [CrossRef]
  11. Sharkey, T.D.; Singsaas, E.L. Why plants emit isoprene. Nature 1995, 374, 769. [Google Scholar] [CrossRef]
  12. Tattini, M.; Loreto, F.; Fini, A.; Guidi, L.; Brunetti, C.; Velikova, V.; Gori, A.; Ferrini, F. Isoprenoids and phenylpropanoids are part of the antioxidant defense orchestrated daily by drought-stressed Platanus × acerifolia plants during Mediterranean summers. New Phytol. 2015, 207, 613–626. [Google Scholar] [CrossRef] [PubMed]
  13. Affek, H.P.; Yakir, D. Protection by isoprene against singlet oxygen in leaves. Plant Physiol. 2002, 129, 269–277. [Google Scholar] [CrossRef] [PubMed] [Green Version]
  14. Velikova, V.; Edreva, A.; Loreto, F. Endogenous isoprene protects Phragmites australis leaves against singlet oxygen. Physiol. Plant. 2004, 122, 219–225. [Google Scholar] [CrossRef]
  15. Velikova, V.; Sharkey, T.D.; Loreto, F. Stabilization of thylakoid membranes in isoprene-emitting plants reduces formation of reactive oxygen species. Plant Signal. Behav. 2012, 7, 139–141. [Google Scholar] [CrossRef] [Green Version]
  16. Vanzo, E.; Merl-Pham, J.; Velikova, V.; Ghirardo, A.; Lindermayr, C.; Hauck, S.M.; Bernhardt, J.; Riedel, K.; Durner, J.; Schnitzler, J.P. Modulation of protein s-nitrosylation by isoprene emission in poplar. Plant Physiol. 2016, 170, 1945–1961. [Google Scholar] [CrossRef] [Green Version]
  17. Sharkey, T.D. Is it useful to ask why plants emit isoprene? Plant Cell Environ. 2013, 36, 517–520. [Google Scholar] [CrossRef] [Green Version]
  18. Miller, B.; Oschinski, C.; Zimmer, W. First isolation of an isoprene synthase gene from poplar and successful expression of the gene in Escherichia coli. Planta 2001, 213, 483–487. [Google Scholar] [CrossRef]
  19. Sharkey, T.D.; Monson, R.K. Isoprene research–60 years later, the biology is still enigmatic. Plant Cell Environ. 2017, 40, 1671–1678. [Google Scholar] [CrossRef]
  20. Pollastri, S.; Tsonev, T.; Loreto, F. Isoprene improves photochemical efficiency and enhances heat dissipation in plants at physiological temperatures. J. Exp. Bot. 2014, 65, 1565–1570. [Google Scholar] [CrossRef] [Green Version]
  21. Behnke, K.; Ehlting, B.; Teuber, M.; Bauerfeind, M.; Louis, S.; Hänsch, R.; Polle, A.; Bohlmann, J.; Schnitzler, J.-P. Transgenic, non-isoprene emitting poplars don’t like it hot. Plant J. 2007, 51, 485–499. [Google Scholar] [CrossRef] [PubMed]
  22. Loivamäki, M.; Gilmer, F.; Fischbach, R.J.; Sörgel, C.; Bachl, A.; Walter, A.; Schnitzler, J.P. Arabidopsis, a model to study biological functions of isoprene emission? Plant Physiol. 2007, 144, 1066–1078. [Google Scholar] [CrossRef] [PubMed]
  23. Sasaki, K.; Saito, T.; Lämsä, M.; Oksman-Caldentey, K.M.; Suzuki, M.; Ohyama, K.; Muranaka, T.; Ohara, K.; Yazaki, K. Plants utilize isoprene emission as a thermotolerance mechanism. Plant Cell Physiol. 2007, 48, 1254–1262. [Google Scholar] [CrossRef] [PubMed] [Green Version]
  24. Ryan, A.C.; Hewitt, C.N.; Possell, M.; Vickers, C.E.; Purnell, A.; Mullineaux, P.M.; Davies, W.J.; Dodd, I.C. Isoprene emission protects photosynthesis but reduces plant productivity during drought in transgenic tobacco (Nicotiana tabacum) plants. New Phytol. 2014, 201, 205–216. [Google Scholar] [CrossRef]
  25. Tattini, M.; Velikova, V.; Vickers, C.; Brunetti, C.; Di Ferdinando, M.; Trivellini, A.; Fineschi, S.; Agati, G.; Ferrini, F.; Loreto, F. Isoprene production in transgenic tobacco alters isoprenoid, non-structural carbohydrate and phenylpropanoid metabolism, and protects photosynthesis from drought stress. Plant Cell Environ. 2014, 37, 1950–1964. [Google Scholar] [CrossRef] [Green Version]
  26. Jensen, A.B.; Busk, P.K.; Figueras, M.; Albà, M.M.; Peracchia, G.; Messeguer, R.; Goday, A.; Pagès, M. Drought signal transduction in plants. Plant Growth Regul. 1996, 20, 105–110. [Google Scholar] [CrossRef]
  27. Shinozaki, K.; Yamaguchi-Shinozaki, K. Gene expression and signal transduction in water-stress response. Plant Physiol. 1997, 115, 327–334. [Google Scholar] [CrossRef] [Green Version]
  28. Desikan, R.; Cheung, M.K.; Bright, J.; Henson, D.; Hancock, J.T.; Neill, S.J. ABA, hydrogen peroxide and nitric oxide signalling in stomatal guard cells. J. Exp. Bot. 2004, 55, 205–212. [Google Scholar] [CrossRef] [Green Version]
  29. Lee, D.K.; Kim, H., II; Jang, G.; Chung, P.J.; Jeong, J.S.; Kim, Y.S.; Bang, S.W.; Jung, H.; Choi, Y.D.; Kim, J.K. The NF-YA transcription factor OsNF-YA7 confers drought stress tolerance of rice in an abscisic acid independent manner. Plant Sci. 2015, 241, 199–210. [Google Scholar] [CrossRef]
  30. Lake, J.A.; Woodward, F.I. Response of stomatal numbers to CO2 and humidity: Control by transpiration rate and abscisic acid. New Phytol. 2008, 179, 397–404. [Google Scholar] [CrossRef]
  31. Rock, C.D. Pathways to abscisic acid-regulated gene expression. New Phytol. 2000, 148, 357–396. [Google Scholar] [CrossRef]
  32. Xiong, L.; Zhu, J.-K. Update on abscisic acid biosynthesis. Plant Physiol. 2003, 133, 29–36. [Google Scholar] [CrossRef] [Green Version]
  33. Barta, C.; Loreto, F. The relationship between the methyl-erythritol phosphate pathway leading to emission of volatile isoprenoids and abscisic acid content in leaves. Plant Physiol. 2006, 141, 1676–1683. [Google Scholar] [CrossRef] [PubMed] [Green Version]
  34. Sade, N.; Gebremedhin, A.; Moshelion, M. Risk-taking plants: Anisohydric behavior as a stress-resistance trait. Plant Signal. Behav. 2012, 7, 767–770. [Google Scholar] [CrossRef] [PubMed] [Green Version]
  35. Pou, A.; Medrano, H.; Tomàs, M.; Martorell, S.; Ribas-Carbó, M.; Flexas, J. Anisohydric behaviour in grapevines results in better performance under moderate water stress and recovery than isohydric behaviour. Plant Soil 2012, 359, 335–349. [Google Scholar] [CrossRef]
  36. Jones, H.G. Irrigation scheduling: Advantages and pitfalls of plant-based methods. J. Exp. Bot. 2004, 55, 2427–2436. [Google Scholar] [CrossRef] [PubMed] [Green Version]
  37. Soar, C.J.; Speirs, J.; Maffei, S.M.; Penrose, A.B.; McCarthy, M.G.; Loveys, B.R. Grape vine varieties Shiraz and Grenache differ in their stomatal response to VPD: Apparent links with ABA physiology and gene expression in leaf tissue. Aust. J. Grape Wine Res. 2006, 12, 2–12. [Google Scholar] [CrossRef]
  38. Lovisolo, C.; Perrone, I.; Carra, A.; Ferrandino, A.; Flexas, J.; Medrano, H.; Schubert, A. Drought-induced changes in development and function of grapevine (Vitis spp.) organs and in their hydraulic and non-hydraulic interactions at the whole-plant level: A physiological and molecular update. Funct. Plant Biol. 2010, 37, 98–116. [Google Scholar] [CrossRef]
  39. Chaves, M.M.; Zarrouk, O.; Francisco, R.; Costa, J.M.; Santos, T.; Regalado, A.P.; Rodrigues, M.L.; Lopes, C.M. Grapevine under deficit irrigation: Hints from physiological and molecular data. Ann. Bot. 2010, 105, 661–676. [Google Scholar] [CrossRef] [PubMed] [Green Version]
  40. McDowell, N.; Pockman, W.T.; Allen, C.D.; Breshears, D.D.; Cobb, N.; Kolb, T.; Plaut, J.; Sperry, J.; West, A.; Williams, D.G.; et al. Mechanisms of Plant Survival and Mortality During Drought: Why Do Some Plants Survive While Others Succumb to Drought? New Phytol. 2008, 178, 719–739. [Google Scholar] [CrossRef] [PubMed]
  41. McDowell, N.G. Mechanisms linking drought, hydraulics, carbon metabolism, and vegetation mortality. Plant Physiol. 2011, 155, 1051–1059. [Google Scholar] [CrossRef] [Green Version]
  42. Sade, N.; Vinocur, B.J.; Diber, A.; Shatil, A.; Ronen, G.; Nissan, H.; Wallach, R.; Karchi, H.; Moshelion, M. Improving plant stress tolerance and yield production: Is the tonoplast aquaporin SlTIP2;2 a key to isohydric to anisohydric conversion? New Phytol. 2009, 181, 651–661. [Google Scholar] [CrossRef]
  43. Negin, B.; Moshelion, M. The evolution of the role of ABA in the regulation of water-use efficiency: From biochemical mechanisms to stomatal conductance. Plant Sci. 2016, 251, 82–89. [Google Scholar] [CrossRef] [PubMed]
  44. Tardieu, F.; Simonneau, T. Variability among species of stomatal control under fluctuating soil water status and evaporative demand: Modelling isohydric and anisohydric behaviours. J. Exp. Bot. 1998, 49, 419–432. [Google Scholar] [CrossRef] [Green Version]
  45. Li, M.; Xu, J.; Algarra Alarcon, A.; Carlin, S.; Barbaro, E.; Cappellin, L.; Velikova, V.; Vrhovsek, U.; Loreto, F.; Varotto, C. In planta recapitulation of isoprene synthase evolution from ocimene synthases. Mol. Biol. Evol. 2017, 34, 2583–2599. [Google Scholar] [CrossRef] [PubMed] [Green Version]
  46. Fu, Y.; Poli, M.; Sablok, G.; Wang, B.; Liang, Y.; La Porta, N.; Velikova, V.; Loreto, F.; Li, M.; Varotto, C. Dissection of early transcriptional responses to water stress in Arundo donax L. by unigene-based RNA-seq. Biotechnol. Biofuels 2016, 9. [Google Scholar] [CrossRef] [Green Version]
  47. Nackley, L.L.; Vogt, K.A.; Kim, S.H. Arundo donax water use and photosynthetic responses to drought and elevated CO2. Agric. Water Manag. 2014, 136, 13–22. [Google Scholar] [CrossRef]
  48. Mariani, C.; Cabrini, R.; Danin, A.; Piffanelli, P.; Fricano, A.; Gomarasca, S.; Dicandilo, M.; Grassi, F.; Soave, C. Origin, diffusion and reproduction of the giant reed (Arundo donax L.): A promising weedy energy crop. Ann. Appl. Biol. 2010, 157, 191–202. [Google Scholar] [CrossRef]
  49. Ahrar, M.; Doneva, D.; Tattini, M.; Brunetti, C.; Gori, A.; Rodeghiero, M.; Wohlfahrt, G.; Biasioli, F.; Varotto, C.; Loreto, F.; et al. Phenotypic differences determine drought stress responses in ecotypes of Arundo donax adapted to different environments. J. Exp. Bot. 2017, 68, 2439–2451. [Google Scholar] [CrossRef]
  50. Lantz, A.T.; Allman, J.; Weraduwage, S.M.; Sharkey, T.D. Isoprene: New insights into the control of emission and mediation of stress tolerance by gene expression. Plant Cell Environ. 2019, 42, 2808–2826. [Google Scholar] [CrossRef] [Green Version]
  51. Lee, S.C.; Luan, S. ABA signal transduction at the crossroad of biotic and abiotic stress responses. Plant Cell Environ. 2012, 35, 53–60. [Google Scholar] [CrossRef] [PubMed]
  52. Li, M.; Cappellin, L.; Xu, J.; Biasioli, F.; Varotto, C. High-throughput screening for in planta characterization of VOC biosynthetic genes by PTR-ToF-MS. J. Plant Res. 2020, 133, 123–131. [Google Scholar] [CrossRef] [Green Version]
  53. Sasaki, K.; Ohara, K.; Yazaki, K. Gene expression and characterization of isoprene synthase from Populus alba. FEBS Lett. 2005, 579, 2514–2518. [Google Scholar] [CrossRef] [Green Version]
  54. Hochberg, U.; Rockwell, F.E.; Holbrook, N.M.; Cochard, H. Iso/anisohydry: A plant–environment interaction rather than a simple hydraulic trait. Trends Plant Sci. 2018, 23, 112–120. [Google Scholar] [CrossRef]
  55. Zuo, Z.; Weraduwage, S.M.; Lantz, A.T.; Sanchez, L.M.; Weise, S.E.; Wang, J.; Childs, K.L.; Sharkey, T.D. Isoprene acts as a signaling molecule in gene networks important for stress responses and plant growth. Plant Physiol. 2019, 180, 124–152. [Google Scholar] [CrossRef] [Green Version]
  56. Nylander, M.; Svensson, J.; Palva, E.T.; Welin, B.V. Stress-induced accumulation and tissue-specific localization of dehydrins in Arabidopsis thaliana. Plant Mol. Biol. 2001, 45, 263–279. [Google Scholar] [CrossRef] [PubMed]
  57. Pandey, S.; Wang, R.S.; Wilson, L.; Li, S.; Zhao, Z.; Gookin, T.E.; Assmann, S.M.; Albert, R. Boolean modeling of transcriptome data reveals novel modes of heterotrimeric G-protein action. Mol. Syst. Biol. 2010, 6, 1–17. [Google Scholar] [CrossRef] [PubMed]
  58. Saez, A.; Rodrigues, A.; Santiago, J.; Rubio, S.; Rodriguez, P.L. HAB1-SWI3B interaction reveals a link between abscisic acid signaling and putative SWI/SNF chromatin-remodeling complexes in Arabidopsis. Plant Cell 2008, 20, 2972–2988. [Google Scholar] [CrossRef] [PubMed] [Green Version]
  59. Virlouvet, L.; Fromm, M. Physiological and transcriptional memory in guard cells during repetitive dehydration stress. New Phytol. 2015, 205, 596–607. [Google Scholar] [CrossRef] [Green Version]
  60. Virlouvet, L.; Ding, Y.; Fujii, H.; Avramova, Z.; Fromm, M. ABA signaling is necessary but not sufficient for RD29B transcriptional memory during successive dehydration stresses in Arabidopsis thaliana. Plant J. 2014, 79, 150–161. [Google Scholar] [CrossRef] [PubMed]
  61. Wang, R.S.; Pandey, S.; Li, S.; Gookin, T.E.; Zhao, Z.; Albert, R.; Assmann, S.M. Common and unique elements of the ABA-regulated transcriptome of Arabidopsis guard cells. BMC Genom. 2011, 12, 216. [Google Scholar] [CrossRef] [PubMed] [Green Version]
  62. Nonogaki, M.; Sall, K.; Nambara, E.; Nonogaki, H. Amplification of ABA biosynthesis and signaling through a positive feedback mechanism in seeds. Plant J. 2014, 78, 527–539. [Google Scholar] [CrossRef] [PubMed] [Green Version]
  63. Zhao, M.; Yang, S.; Liu, X.; Wu, K. Arabidopsis histone demethylases LDL1 and LDL2 control primary seed dormancy by regulating delay of germination 1 and ABA signaling-related genes. Front. Plant Sci. 2015, 6, 1–9. [Google Scholar] [CrossRef] [PubMed] [Green Version]
  64. Li, L.; Liu, S.; Li, M.; Su, L.; Ge, K.; Li, L.; Li, X.; Liu, X. Negative feedback regulation of ABA biosynthesis in peanut (Arachis hypogaea): A transcription factor complex inhibits AhNCED1 expression during water stress. Sci. Rep. 2016, 6, 1–11. [Google Scholar] [CrossRef] [PubMed] [Green Version]
  65. McAdam, S.A.M.; Brodribb, T.J. Mesophyll cells are the main site of abscisic acid biosynthesis in water-stressed leaves. Plant Physiol. 2018, 177, 911–917. [Google Scholar] [CrossRef] [PubMed] [Green Version]
  66. Harvey, C.M.; Sharkey, T.D. Exogenous isoprene modulates gene expression in unstressed Arabidopsis thaliana plants. Plant Cell Environ. 2016, 39, 1251–1263. [Google Scholar] [CrossRef] [Green Version]
  67. He, Y.; Gan, S. A novel zinc-finger protein with a proline-rich domain mediates ABA-regulated seed dormancy in Arabidopsis. Plant Mol. Biol. 2004, 54, 1–9. [Google Scholar] [CrossRef]
  68. Liu, C.; Zhang, X.; Zhang, K.; An, H.; Hu, K.; Wen, J.; Shen, J.; Ma, C.; Yi, B.; Tu, J.; et al. Comparative analysis of the Brassica napus root and leaf transcript profiling in response to drought stress. Int. J. Mol. Sci. 2015, 16, 18752–18777. [Google Scholar] [CrossRef] [Green Version]
  69. Lee, S.Y.; Boon, N.J.; Webb, A.A.R.; Tanaka, R.J. Synergistic activation of RD29A via integration of salinity stress and abscisic acid in arabidopsis thaliana. Plant Cell Physiol. 2016, 57, 2147–2160. [Google Scholar] [CrossRef] [PubMed] [Green Version]
  70. Steponkus, P.L.; Uemura, M.; Joseph, R.A.; Gilmour, S.J.; Thomashow, M.F. Mode of action of the COR15a gene on the freezing tolerance of Arabidopsis thaliana. Proc. Natl. Acad. Sci. USA 1998, 95, 14570–14575. [Google Scholar] [CrossRef] [PubMed] [Green Version]
  71. Thalhammer, A.; Bryant, G.; Sulpice, R.; Hincha, D.K. Disordered cold regulated15 proteins protect chloroplast membranes during freezing through binding and folding, but do not stabilize chloroplast enzymes in vivo. Plant Physiol. 2014, 166, 190–201. [Google Scholar] [CrossRef] [PubMed] [Green Version]
  72. Hundertmark, M.; Hincha, D.K. LEA (Late Embryogenesis Abundant) proteins and their encoding genes in Arabidopsis thaliana. BMC Genom. 2008, 9, 1–22. [Google Scholar] [CrossRef] [PubMed] [Green Version]
  73. Kishor, P.B.K.; Sreenivasulu, N. Is proline accumulation per se correlated with stress tolerance or is proline homeostasis a more critical issue? Plant Cell Environ. 2014, 37, 300–311. [Google Scholar] [CrossRef] [PubMed]
  74. Liu, W.; Le, A.; Hancock, C.; Lane, A.N.; Dang, C.V.; Fan, T.W.M.; Phang, J.M. Reprogramming of proline and glutamine metabolism contributes to the proliferative and metabolic responses regulated by oncogenic transcription factor c-MYC. Proc. Natl. Acad. Sci. USA 2012, 109, 8983–8988. [Google Scholar] [CrossRef] [PubMed] [Green Version]
  75. Liang, X.; Zhang, L.; Natarajan, S.K.; Becker, D.F. Proline mechanisms of stress survival. Antioxid. Redox Signal. 2013, 19, 998–1011. [Google Scholar] [CrossRef] [PubMed] [Green Version]
  76. Velikova, V.; Várkonyi, Z.; Szabó, M.; Maslenkova, L.; Nogues, I.; Kovács, L.; Peeva, V.; Busheva, M.; Garab, G.; Sharkey, T.D.; et al. Increased thermostability of thylakoid membranes in isoprene-emitting leaves probed with three biophysical techniques. Plant Physiol. 2011, 157, 905–916. [Google Scholar] [CrossRef] [Green Version]
  77. Siwko, M.E.; Marrink, S.J.; de Vries, A.H.; Kozubek, A.; Uiterkamp, A.J.M.S.; Mark, A.E. Does isoprene protect plant membranes from thermal shock? A molecular dynamics study. Biochim. Biophys. Acta Biomembr. 2007, 1768, 198–206. [Google Scholar] [CrossRef] [PubMed] [Green Version]
  78. Sharkey, T.D.; Wiberley, A.E.; Donohue, A.R. Isoprene emission from plants: Why and how. Ann. Bot. 2008, 101, 5–18. [Google Scholar] [CrossRef] [Green Version]
  79. Faralli, M.; Li, M.; Varotto, C. Shoot characterization of isoprene and ocimene-emitting transgenic arabidopsis plants under contrasting environmental conditions. Plants 2020, 9, 477. [Google Scholar] [CrossRef] [PubMed] [Green Version]
  80. Tocquin, P.; Corbesier, L.; Havelange, A.; Pieltain, A.; Kurtem, E.; Bernier, G.; Périlleux, C. A novel high efficiency, low maintenance, hydroponic system for synchronous growth and flowering of Arabidopsis thaliana. BMC Plant Biol. 2003, 3, 2–11. [Google Scholar] [CrossRef] [PubMed]
  81. Ren, X.; Chen, Z.; Liu, Y.; Zhang, H.; Zhang, M.; Liu, Q.; Hong, X.; Zhu, J.K.; Gong, Z. ABO3, a WRKY transcription factor, mediates plant responses to abscisic acid and drought tolerance in Arabidopsis. Plant J. 2010, 63, 417–429. [Google Scholar] [CrossRef] [PubMed] [Green Version]
  82. Heath, R.L.; Packer, L. Photoperoxidation in isolated chloroplasts. Arch. Biochem. Biophys. 1968, 125, 189–198. [Google Scholar] [CrossRef]
  83. Arnon, D.I. Copper enzymes in isolated chloroplasts. Polyphenoloxydase in Beta vulgaris. Plant Physiol. 1949, 24, 1–15. [Google Scholar] [CrossRef] [PubMed] [Green Version]
  84. Poli, M.; Salvi, S.; Li, M.; Varotto, C. Selection of reference genes suitable for normalization of qPCR data under abiotic stresses in bioenergy crop Arundo donax L. Sci. Rep. 2017, 7, 1–11. [Google Scholar] [CrossRef] [PubMed] [Green Version]
  85. R Core Team. R: A language and environment for statistical computing. R Foundation for Statistical Computing, Vienna, Austria. 2017. Available online: https://www.R-project.org/ (accessed on 3 June 2020).
  86. Mangiafico, S.S. Summary and Analysis of Extension Program Evaluation in R, version 1.18.1. 2016. Available online: http://rcompanion.org/handbook/ (accessed on 3 June 2020).
Figure 1. Effect of ABA on germination of transgenic lines overexpressing the IspS gene. (A) Germination rates of Col-0 and transgenic plants treated with different concentrations of ABA (0 µM, 0.3 µM, 0.5 µM) for 3 days. (B) Greening of cotyledons of Col-0 and transgenic plants exposed to different concentrations of ABA (0 µM, 0.3 µM, 0.5 µM) for 5 days. Histogram bars marked with the same letter do not significantly differ from each other (Tukey–Kramer test, p > 0.05). Error bars represent the SD of the means. In (C,D), representative pictures of germinating seedlings exposed to different concentrations of ABA at 3 days and 5 days after sowing are shown. Scale bar = 1 cm.
Ijms 21 04276 g001
Figure 2. Effect of ABA on fresh weight and root elongation of transgenic lines overexpressing the IspS gene. (A) Representative pictures of Col-0 and transgenic seedlings grown on vertical plates and treated for 1 week with 0 µm, 10 µm, or 20 µM ABA. Scale bar = 1 cm. (B) Total fresh weight and (C) root length of plants treated with different amounts of ABA. Histogram bars marked with the same letter do not significantly differ from each other (Tukey–Kramer test, p > 0.05). Error bars represent the SD of the means.
Ijms 21 04276 g002
Figure 3. Expression of ABA biosynthetic and signaling genes in response to ABA and PEG stresses. (AD) qRT–PCR analysis of ABA biosynthetic and signaling genes in the leaf tissue of IspS transgenic plants at different time-points after ABA treatment. (E-H) qRT–PCR analysis of ABA biosynthetic genes and signaling genes in the roots of IspS transgenic plants after ABA treatment. Histogram bars marked with the same letter do not significantly differ from each other (Tukey–Kramer test, p > 0.05). Error bars represent the SD of the means.
Ijms 21 04276 g003
Figure 4. Effect of PEG-induced osmotic and water-limitation stress on root elongation. (A) Root length of Col-0 and transgenic plants exposed to various concentration of PEG 6000. Histogram bars marked with the same letter do not significantly differ from each other (Tukey–Kramer test, p > 0.05). Line bars represent the SD of the means. (B) Representative pictures of root growth of Col-0 and transgenic plants exposed to various concentrations of PEG 6000. Scale bar = 1 cm.
Ijms 21 04276 g004
Figure 5. Water-stress tolerance of Arabidopsis plants overexpressing AdoIspS. (A) Drought resistance of Col-0 and AdoIspS transgenic plants. Plants were directly exposed to air for 24 h to induce dehydration. After rehydration for 48 h, the representative images were taken (Scale bar = 3 cm), and (B) the percentage of plants that survived was determined. (C) Lipid peroxidation was assessed by MDA accumulation at different time points. Histogram bars marked with the same letter do not significantly differ from each other (Tukey–Kramer test, p > 0.05). Line bars represent the SD of the means.
Ijms 21 04276 g005
Figure 6. Water loss and stomatal aperture of Arabidopsis plants overexpressing IspS. (A,B) Water loss from the leaves of Col-0 and transgenic plants at various time-points after leaf detachment. Asterisks indicate significant differences between Col-0 and the transgenic lines (t-test, p < 0.05). Line bars report the standard deviation of the mean. (C) Stomatal apertures in Col-0 and IspS transgenic plants treated with ABA. Histogram bars marked with the same letter do not significantly differ from each other (Tukey–Kramer test, p > 0.05). Line bars represent the SD of the means. (D) Representative images of stomata from the different genotypes before and after ABA treatment. Scale bar = 10 µm.
Ijms 21 04276 g006
Figure 7. Expression of drought-responsive genes following dehydration stress. (AD) qRT–PCR analysis of drought-inducible genes in IspS transgenic plants in response to dehydration at different time-points. Histogram bars marked with the same letter do not significantly differ from each other (Tukey–Kramer test, p > 0.05). Line bars represent the SD of the means.
Ijms 21 04276 g007
Figure 8. Thermal tolerance of Col-0 and IspS seedlings. Seven day old seedlings were exposed to heat shock. After 7 days recovery, representative images were taken (Scale bar = 1 cm) (A), and the chlorophyll content (B), fresh weight (C), and survival rate (D) were measured in each line. Histogram bars marked with the same letter do not significantly differ from each other (Tukey–Kramer test, p > 0.05). Line bars represent the SD of the means.
Ijms 21 04276 g008
Figure 9. Thermal tolerance of Col-0 and IspS plants grown hydroponically. (A) Thermal tolerance of Col-0 and IspS transgenic plants grown in hydroponic medium. Three week old plants were treated with heat shock, representative images were taken (Scale bar = 1 cm) (A), and the percentages of surviving plants (B) were measured after 1 week of recovery. (C) Total weight of seeds produced per plant in Col-0 and IspS lines under normal growth and heat-shock condition. Histogram bars marked with the same letter do not significantly differ from each other (Tukey–Kramer test, p > 0.05). Line bars represent the SD of the means.
Ijms 21 04276 g009

