Zeb2 Regulates Myogenic Differentiation in Pluripotent Stem Cells

 , , , and
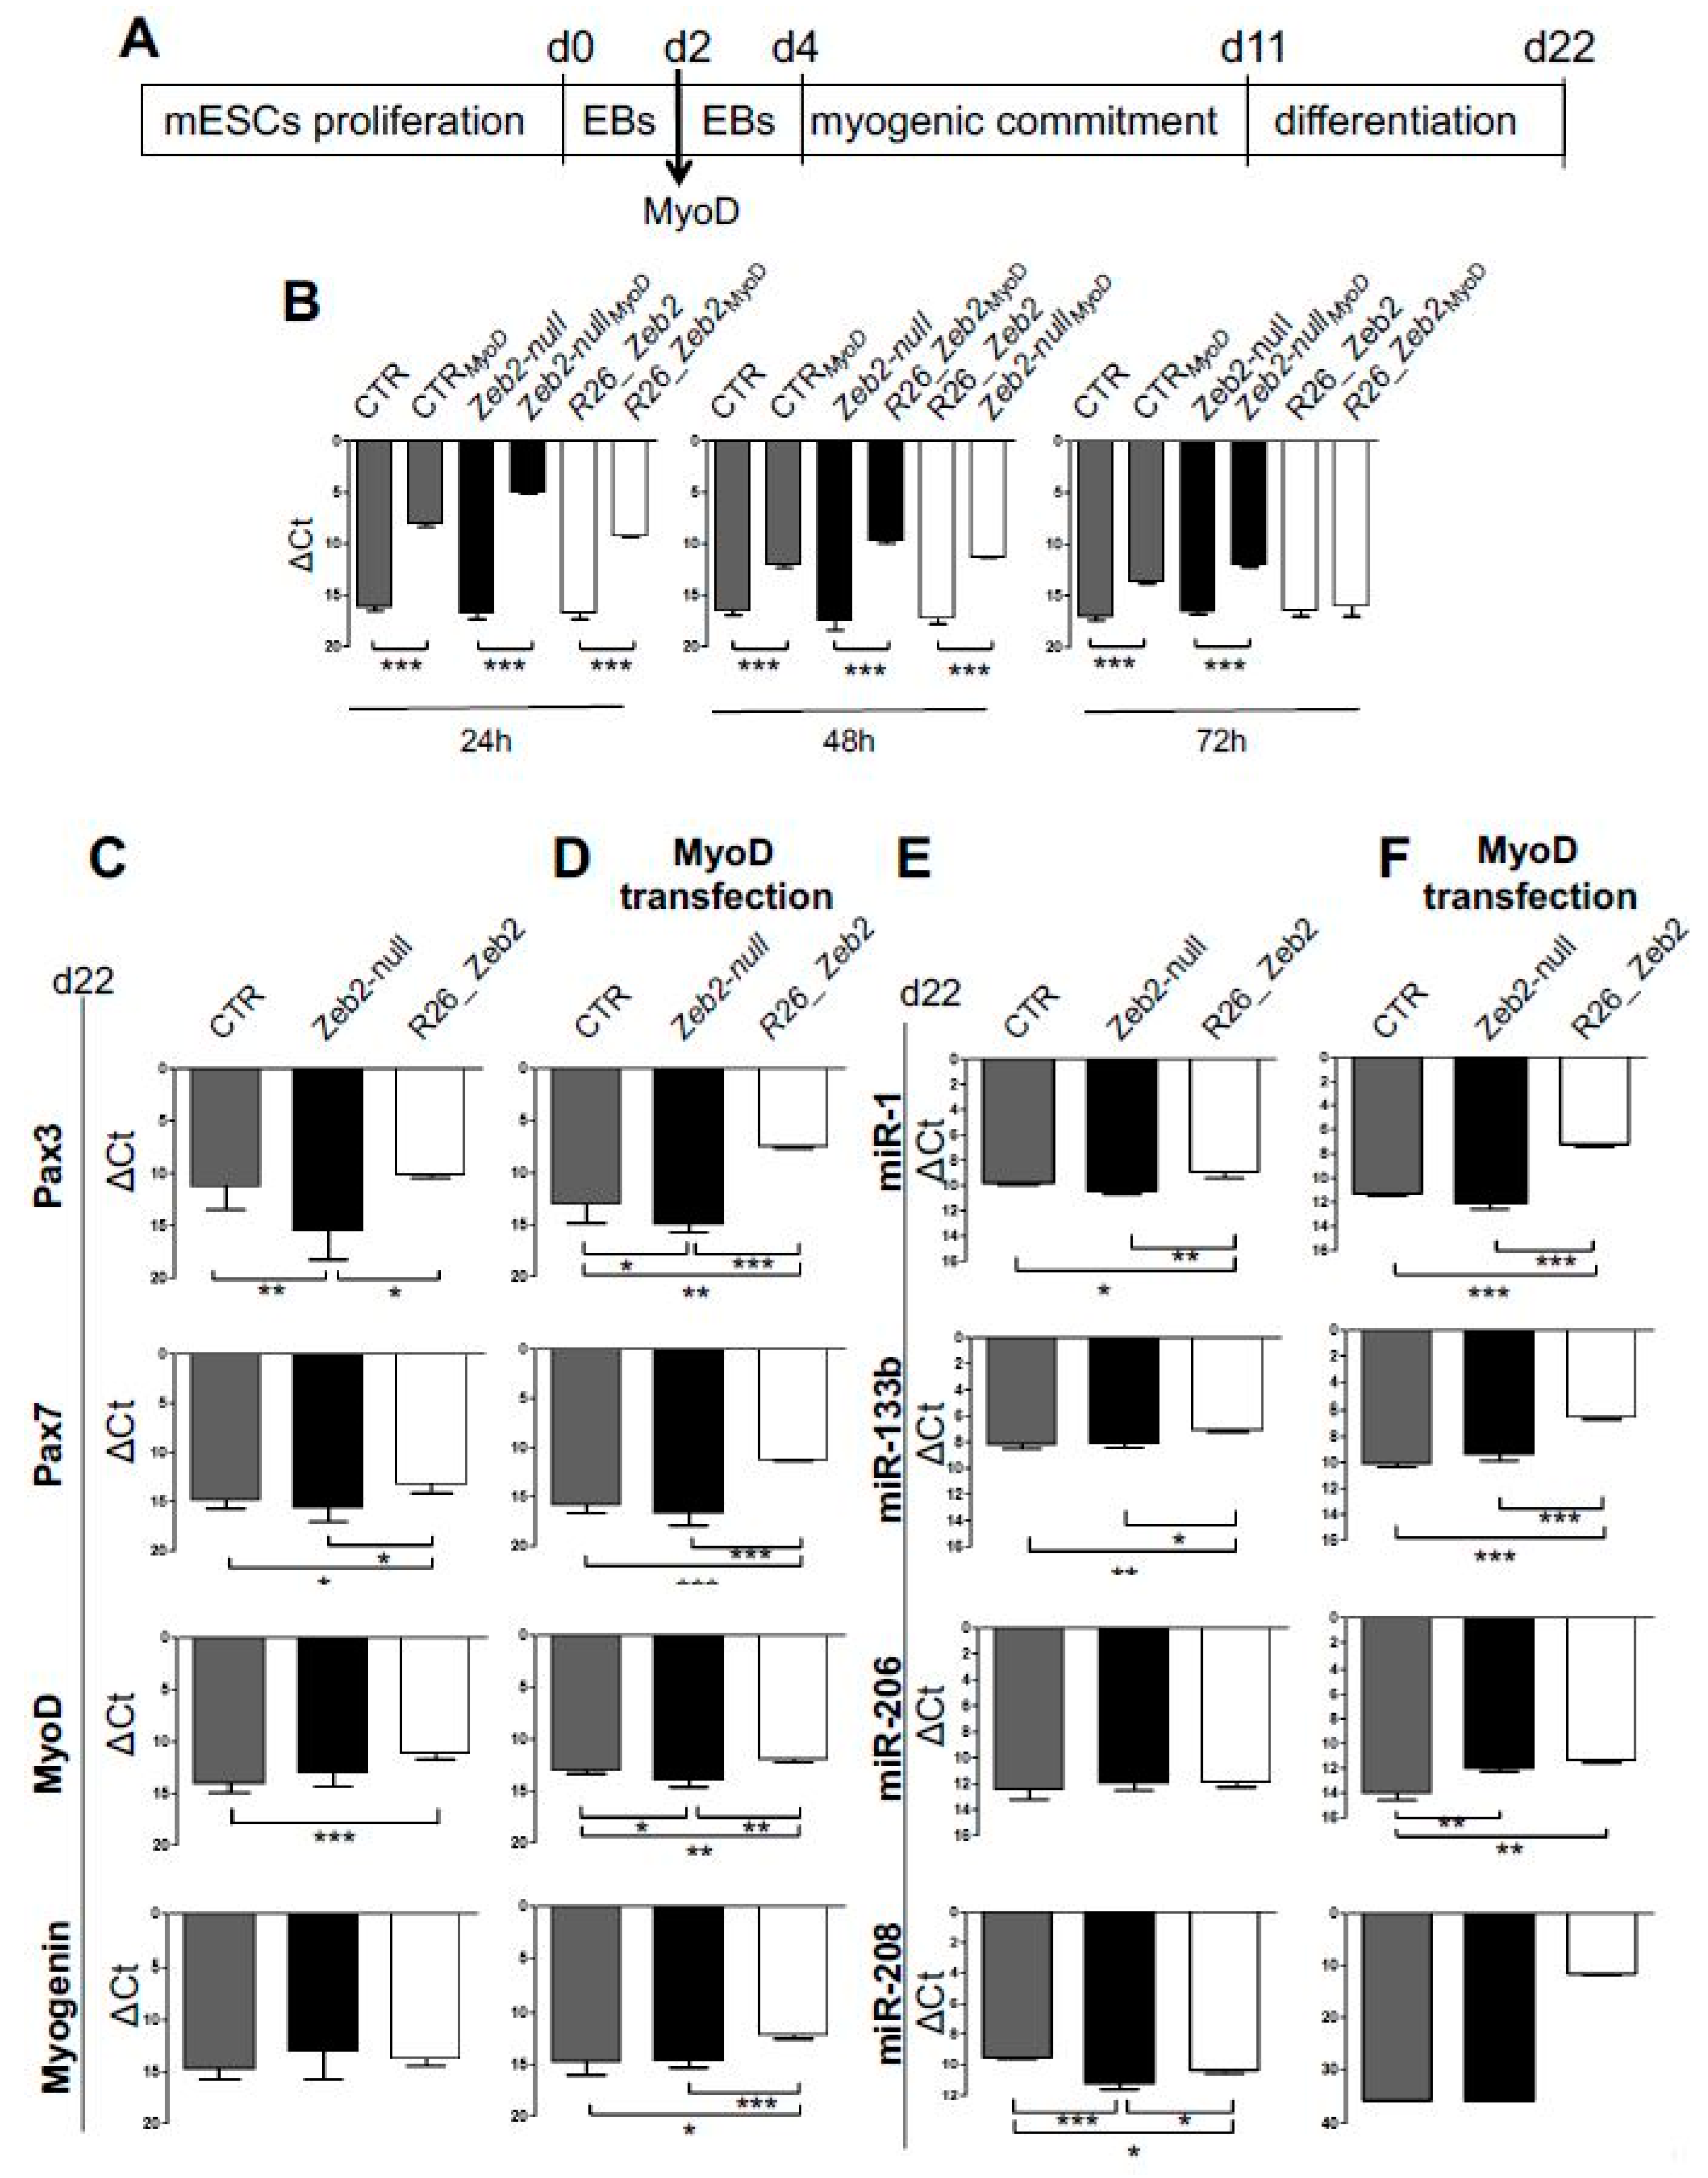
Abstract
:1. Introduction
2. Results
2.1. The Upregulation of Zeb2 Positively Affects Myogenic Markers in mESCs Subjected to Skeletal Muscle Differentiation
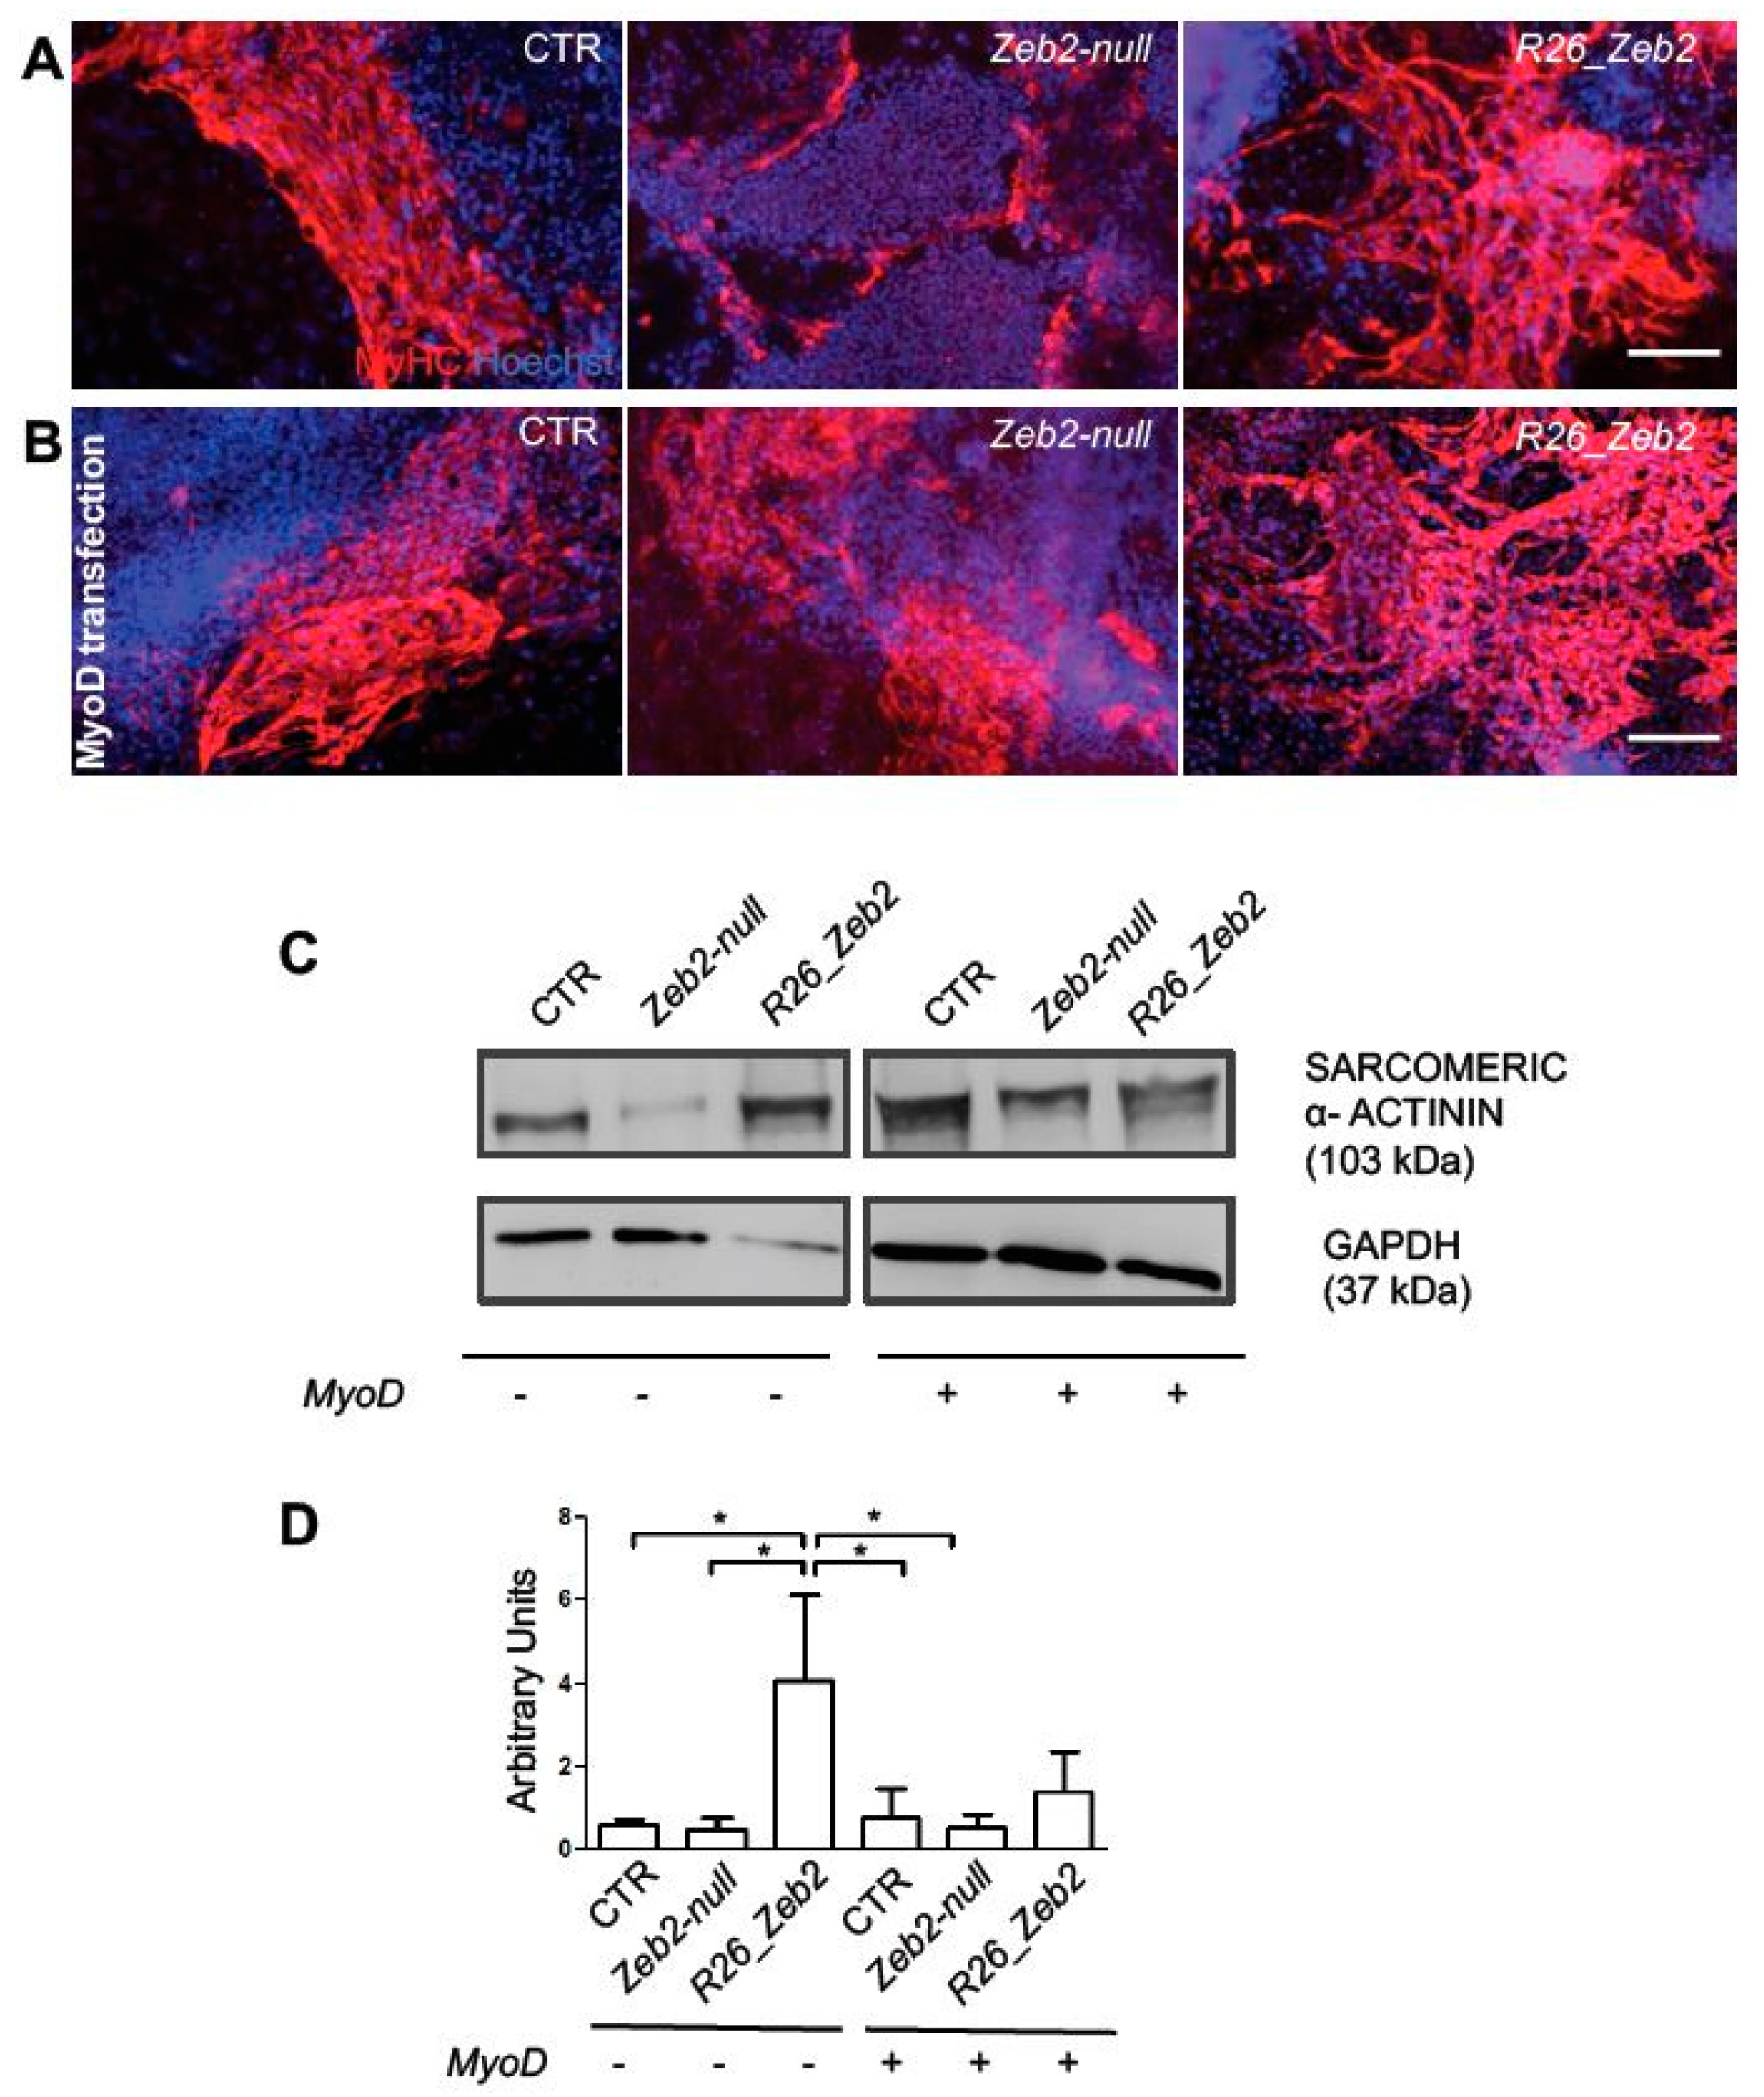
2.2. Zeb2 Enhances Skeletal Muscle Differentiation in Cultured Cells
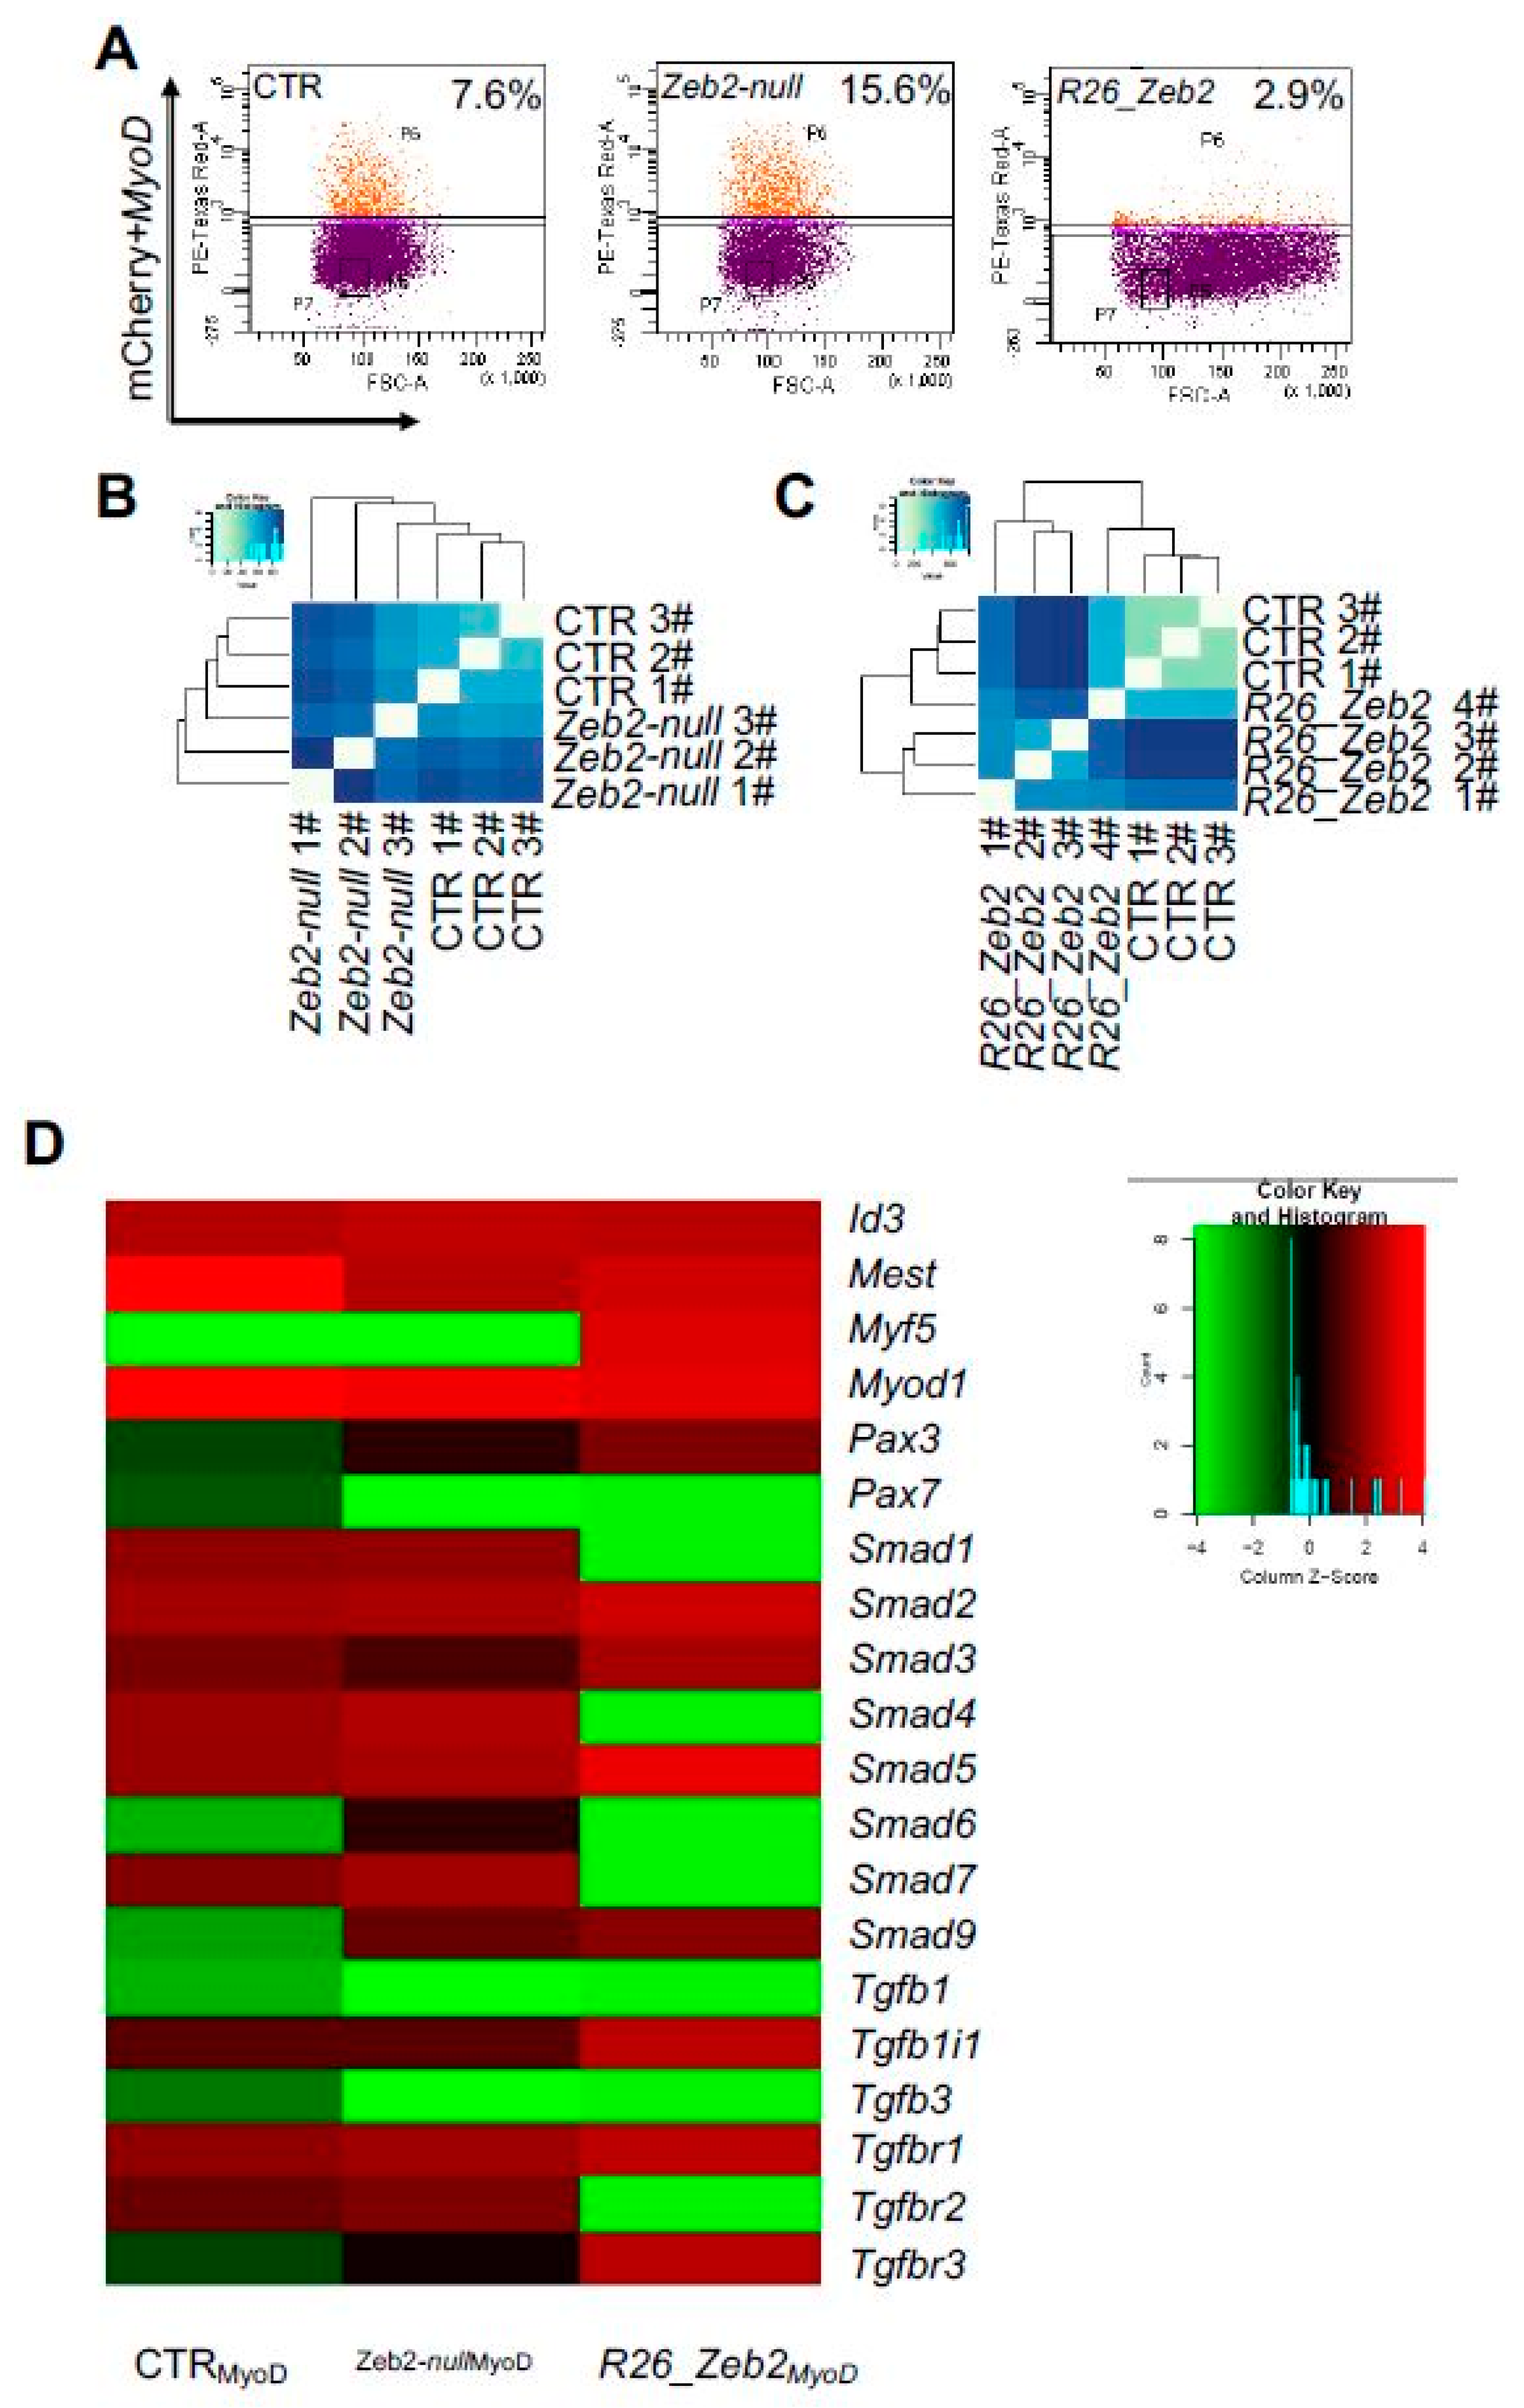
2.3. Fluorescence-activated Cell Sorting-isolated CTR, Zeb2-null and R26_Zeb2 mCherry/MyoD-positive Cells and Single-cell RNA-sequencing
2.4. GFP+ R26_Zeb2 Progenitor Cells Contiribute to Adult Myogenesis
3. Discussion
4. Materials and Methods
4.1. Cell Culture and in vitro Skeletal Muscle Differentiation of mESCs
4.2. RNA Extraction and Quantitative Real-Time PCR Analysis
4.3. miRNA Isolation and Quantification
4.4. Immunofluorescence Analysis
4.5. Western Blotting
4.6. FACS-isolation and Single cell RNA-Sequencing Analysis of CTR, Zeb2-null and R26_Zeb2 mESCs
4.7. RNA Sequencing and Bioinformatics Analysis
4.8. In vivo Experiments
4.9. Statistical Analysis
Supplementary Materials
Author Contributions
Funding
Acknowledgments
Conflicts of Interest
References
- Verschueren, K.; Remacle, J.E.; Collart, C.; Kraft, H.; Baker, B.S.; Tylzanowski, P.; Nelles, L.; Wuytens, G.; Su, M.T.; Bodmer, R.; et al. SIP1, a novel zinc finger/homeodomain repressor, interacts with Smad proteins and binds to 5’-CACCT sequences in candidate target genes. J. Biol. Chem. 1999, 274, 20489–20498. [Google Scholar] [CrossRef] [PubMed] [Green Version]
- Funahashi, J.; Kamachi, Y.; Goto, K.; Kondoh, H. Identification of nuclear factor delta EF1 and its binding site essential for lens-specific activity of the delta 1-crystallin enhancer. Nucleic Acids Res. 1991, 19, 3543–3547. [Google Scholar] [CrossRef] [PubMed]
- Remacle, J.E.; Kraft, H.; Lerchner, W.; Wuytens, G.; Collart, C.; Verschueren, K.; Smith, J.C.; Huylebroeck, D. New mode of DNA binding of multi-zinc finger transcription factors: DeltaEF1 family membersbind with two hands to two target sites. EMBO J. 1999, 18, 5073–5084. [Google Scholar] [CrossRef] [Green Version]
- Miyoshi, T.; Maruhashi, M.; Van De Putte, T.; Kondoh, H.; Huylebroeck, D.; Higashi, Y. Complementary expression pattern of Zfhx1 genes Sip1 and deltaEF1 in the mouse embryo and their genetic interaction revealed by compound mutants. Dev. Dyn. 2006, 235, 1941–1952. [Google Scholar] [CrossRef]
- Van Grunsven, L.A.; van Grunsven, L.A.; Taelman, V.; Michiels, C.; Opdecamp, K.; Huylebroeck, D.; Bellefroid, E.J. DeltaEF1 and SIP1 are differentially expressed and have overlapping activities during Xenopus embryogenesis. Dev. Dyn. 2006, 235, 1491–1500. [Google Scholar] [CrossRef]
- Conidi, A.; Cazzola, S.; Beets, K.; Coddens, K.; Collart, C.; Cornelis, F.; Cox, L.; Joke, D.; Dobreva, M.P.; Dries, R.; et al. Few Smad proteins and many Smad-interacting proteins yield multiple functions and action modes in TGFβ/BMP signaling in vivo. Cytokine Growth Factor Rev. 2011, 22, 287–300. [Google Scholar] [CrossRef]
- Conidi, A.; van den Berghe, V.; Leslie, K.; Stryjewska, A.; Xue, H.; Chen, Y.G.; Seuntjens, E.; Huylebroeck, D. Four amino acids within a tandem QxVx repeat in a predicted extended α-helix of the Smad-binding domain of Sip1 are necessary for binding to activated Smad proteins. PLoS ONE 2013, 8, 1–16. [Google Scholar] [CrossRef] [Green Version]
- El-Kasti, M.M.; Wells, T.; Carter, D.A. A novel long-range enhancer regulates postnatal expression of Zeb2: Implications for Mowat-Wilson syndrome phenotypes. Hum. Mol. Genet. 2012, 21, 5429–5442. [Google Scholar] [CrossRef] [Green Version]
- Weng, Q.; Chen, Y.; Wang, H.; Xu, X.; Yang, B.; He, Q.; Shou, W.; Chen, Y.; Higashi, Y.; van den Berghe, V.; et al. Dual-mode modulation of Smad signaling by Smad-interacting protein Sip1 is required for myelination in the central nervous system. Neuron 2012, 73, 713–728. [Google Scholar] [CrossRef] [Green Version]
- Wu, L.M.; Wang, J.; Conidi, A.; Zhao, C.; Wang, H.; Ford, Z.; Zhang, L.; Zweier, C.; Ayee, B.G.; Maurel, P.; et al. Zeb2 recruits HDAC-NuRD to inhibit Notch and controls Schwann cell differentiation and remyelination. Nat. Neurosci. 2016, 19, 1060–1072. [Google Scholar] [CrossRef]
- Quintes, S.; Brinkmann, B.G.; Ebert, M.; Fröb, F.; Kungl, T.; Arlt, F.A.; Tarabykin, V.; Huylebroeck, D.; Meijer, D.; Suter, U.; et al. Zeb2 is essential for Schwann cell differentiation, myelination and nerve repair. Nat. Neurosci. 2016, 19, 1050–1059. [Google Scholar] [CrossRef] [PubMed] [Green Version]
- Garavelli, L.; Zollino, M.; Mainardi, P.C.; Gurrieri, F.; Rivieri, F.; Soli, F.; Verri, R.; Albertini, E.; Favaron, E.; Zignani, M.; et al. Mowat-Wilson syndrome: Facial phenotype changing with age: Study of 19 Italian patients and review of the literature. Am. J. Med. Genet. Part A 2009, 149A, 417–426. [Google Scholar] [CrossRef] [PubMed]
- Ivanovski, I.; Djuric, O.; Caraffi, S.G.; Santodirocco, D.; Pollazzon, M.; Rosato, S.; Cordelli, D.M.; Abdalla, E.; Accorsi, P.; Adam, M.P.; et al. Phenotype and genotype of 87 patients with Mowat-Wilson syndrome and recommendations for care. Genet. Med. 2018, 20, 965–975. [Google Scholar] [CrossRef] [PubMed] [Green Version]
- Stryjewska, A.; Dries, R.; Pieters, T.; Verstappen, G.; Conidi, A.; Coddens, K.; Francis, A.; Umans, L.; van IJcken, W.F.; Berx, G.; et al. Zeb2 regulates cell fate at the exit from epiblast state in mouse embryonic stem cells. Stem Cells. 2017, 35, 611–625. [Google Scholar] [CrossRef] [PubMed]
- Krempler, A.; Brenig, B. Zinc finger proteins: Watchdogs in muscle development. Mol. Gen. Genet. 1999, 261, 209–215. [Google Scholar] [CrossRef] [PubMed]
- Sekido, R.; Murai, K.; Funahashi, J.; Kamachi, Y.; Fujisawa-Sehara, A.; Nabeshima, Y.; Kondoh, H. The delta-crystallin enhancer-binding protein delta EF1 is a repressor of E2-box-mediated gene activation. Mol. Cell Biol. 1994, 14, 5692–5700. [Google Scholar] [CrossRef] [Green Version]
- Maruhashi, M.; Van De Putte, T.; Huylebroeck, D.; Kondoh, H.; Higashi, Y. Involvement of SIP1 in positioning of somite boundaries in the mouse embryo. Dev. Dyn. 2005, 234, 332–338. [Google Scholar] [CrossRef]
- Bonfanti, C.; Rossi, G.; Tedesco, F.S.; Giannotta, M.; Benedetti, S.; Tonlorenzi, R.; Antonini, S.; Marazzi, G.; Dejana, E.; Sassoon, D.; et al. PW1/Peg3 expression regulates key properties that determine mesoangioblast stem cell competence. Nat. Commun. 2015, 6, 6364. [Google Scholar] [CrossRef] [Green Version]
- Camps, J.; Grosemans, H.; Gijsbers, R.; Maes, C.; Sampaolesi, M. growth factor screening in dystrophic muscles reveals PDGFB/PDGFRB-mediated migration of interstitial stem cells. Int. J. Mol. Sci. 2019, 20, 5. [Google Scholar] [CrossRef] [Green Version]
- Higashi, Y.; Maruhashi, M.; Nelles, L.; Van de Putte, T.; Verschueren, K.; Miyoshi, T.; Yoshimoto, A.; Kondoh, H.; Huylebroeck, D. Generation of the floxed allele of the SIP1 (Smad-interacting protein 1) gene for cre-mediated conditional knockout in the mouse. Genesis 2002, 32, 82–84. [Google Scholar] [CrossRef]
- Tedesco, F.S.; Gerli, M.F.; Perani, L.; Benedetti, S.; Ungaro, F.; Cassano, M.; Antonini, S.; Tagliafico, E.; Artusi, V.; Longa, E.; et al. Transplantation of genetically corrected human iPSC-derived progenitors in mice with limb-girdle muscular dystrophy. Sci. Transl. Med. 2012, 4, 140ra89. [Google Scholar] [CrossRef] [PubMed]
- Quattrocelli, M.; Palazzolo, G.; Floris, G.; Schöffski, P.; Anastasia, L.; Orlacchio, A.; Vandendriessche, T.; Chuah, M.K.; Cossu, G.; Verfaillie, C.; et al. Intrinsic cell memory reinforces myogenic commitment of pericyte-derived iPSCs. J. Pathol. 2011, 223, 593–603. [Google Scholar] [CrossRef] [PubMed]
- Maffioletti, S.M.; Gerli, M.F.; Ragazzi, M.; Dastidar, S.; Benedetti, S.; Loperfido, M.; VandenDriessche, T.; Chuah, M.K.; Tedesco, F.S. Efficient derivation and inducible differentiation of expandable skeletal myogenic cells from human ES and patient-specific iPS cells. Nat. Protoc. 2015, 10, 941–958. [Google Scholar] [CrossRef] [PubMed]
- Quattrocelli, M.; Swinnen, M.; Giacomazzi, G.; Camps, J.; Barthélemy, I.; Ceccarelli, G.; Caluwé, E.; Grosemans, H.; Thorrez, L.; Pelizzo, G.; et al. Mesodermal iPSC-derived progenitor cells functionally regenerate cardiac and skeletal muscle. J. Clin. Investig. 2015, 125, 4463–4482. [Google Scholar] [CrossRef] [Green Version]
- Sharma, M.; Juvvuna, P.K.; Kukreti, H.; McFarlane, C. Mega roles of microRNAs in regulation of skeletal muscle health and disease. Front. Physiol. 2014, 5, 1–9. [Google Scholar] [CrossRef] [Green Version]
- Chen, X.; He, L.; Zhao, Y.; Li, Y.; Zhang, S.; Sun, K.; So, K.; Chen, F.; Zhou, L.; Lu, L.; et al. Malat1 regulates myogenic differentiation and muscle regeneration through modulating MyoD transcriptional activity. Cell Discov. 2017, 3, 1–23. [Google Scholar] [CrossRef]
- Van den Berghe, V.; Stappers, E.; Vandesande, B.; Dimidschstein, J.; Kroes, R.; Francis, A.; Conidi, A.; Lesage, F.; Dries, R.; Cazzola, S.; et al. Directed migration of cortical interneurons depends on the cell-autonomous action of Sip 1. Neuron 2013, 77, 70–82. [Google Scholar] [CrossRef] [Green Version]
- Van Helden, M.J.; Goossens, S.; Daussy, C.; Mathieu, A.L.; Faure, F.; Marҫais, A.; Vandamme, N.; Farla, N.; Mayol, K.; Viel, S.; et al. Terminal NK cell maturation is controlled by concerted actions of T-bet and Zeb2 and is essential for melanoma rejection. Exp. Med. 2015, 212, 2015–2025. [Google Scholar] [CrossRef] [Green Version]
- Postigo, A.A.; Dean, D.C. ZEB, a vertebrate homolog of Drosophila Zfh-1, is a negative regulator of muscle differentiation. EMBO J. 1997, 16, 3935–3943. [Google Scholar] [CrossRef] [Green Version]
- Vandewalle, C.; Van Roy, F.; Berx, G. The role of the ZEB family of transcription factors in development and disease. The role of the ZEB family of transcription factors in development and disease. Cell Mol. Life Sci. 2009, 66, 773–787. [Google Scholar] [CrossRef]
- Crist, C.G.; Buckingham, M. MicroRNAs gain magnitude in muscle. Cell Cycle 2009, 8, 3627–3628. [Google Scholar] [CrossRef] [PubMed]
- Chen, J.F.; Mandel, E.M.; Thomson, J.M.; Wu, Q.; Callis, T.E.; Hammond, S.M.; Conlon, F.L.; Wang, D.Z. The role of microRNA-1 and microRNA-133 in skeletal muscle proliferation and differentiation. Nat. Genet. 2006, 38, 228–233. [Google Scholar] [CrossRef] [PubMed]
- Scicchitano, B.M.; Dobrowolny, G.; Sica, G.; Musarò, A. Molecular insights into muscle homeostasis, atrophy and wasting. Curr. Genom. 2018, 19, 356–369. [Google Scholar] [CrossRef] [PubMed]
- Di Filippo, E.S.; Mancinelli, R.; Pietrangelo, T.; La Rovere, R.M.; Quattrocelli, M.; Sampaolesi, M.; Fulle, S. Myomir dysregulation and reactive oxygen species in aged human satellite cells. Biochem. Biophys. Res. Commun. 2016, 473, 462–470. [Google Scholar] [CrossRef] [PubMed] [Green Version]
- Costamagna, D.; Quattrocelli, M.; van Tienen, F.; Umans, L.; de Coo, I.F.; Zwijsen, A.; Huylebroeck, D.; Sampaolesi, M. Smad1/5/8 are myogenic regulators of murine and human mesoangioblasts. J. Mol. Cell Biol. 2016, 8, 73–87. [Google Scholar] [CrossRef] [PubMed] [Green Version]
- Sohni, A.; Bartoccetti, M.; Khoueiry, R.; Spans, L.; Vande Velde, J.; De Troyer, L.; Pulakanti, K.; Claessens, F.; Rao, S.; Koh, K.P.; et al. Dynamic switching of active promoter and enhancer domains regulates Tet1 and Tet2 expression during cell state transitions between pluripotency and differentiation. Mol. Cell Biol. 2015, 35, 1026–1042. [Google Scholar] [CrossRef] [Green Version]
- Picelli, S.; Faridani, O.R.; Björklund, A.K.; Winberg, G.; Sagasser, S.; Sandberg, R. Full-lenght RNA-seq from single cells using Smart-seq2. Nat. Protoc. 2014, 9, 171–181. [Google Scholar] [CrossRef]
- Anders, S.; Huber, W. Differential expression analysis for sequence count data. Genome Biol. 2010, 11, 1–12. [Google Scholar] [CrossRef] [Green Version]


© 2020 by the authors. Licensee MDPI, Basel, Switzerland. This article is an open access article distributed under the terms and conditions of the Creative Commons Attribution (CC BY) license (http://creativecommons.org/licenses/by/4.0/).
Share and Cite
Di Filippo, E.S.; Costamagna, D.; Giacomazzi, G.; Cortés-Calabuig, Á.; Stryjewska, A.; Huylebroeck, D.; Fulle, S.; Sampaolesi, M. Zeb2 Regulates Myogenic Differentiation in Pluripotent Stem Cells. Int. J. Mol. Sci. 2020, 21, 2525. https://doi.org/10.3390/ijms21072525
Di Filippo ES, Costamagna D, Giacomazzi G, Cortés-Calabuig Á, Stryjewska A, Huylebroeck D, Fulle S, Sampaolesi M. Zeb2 Regulates Myogenic Differentiation in Pluripotent Stem Cells. International Journal of Molecular Sciences. 2020; 21(7):2525. https://doi.org/10.3390/ijms21072525
Chicago/Turabian StyleDi Filippo, Ester Sara, Domiziana Costamagna, Giorgia Giacomazzi, Álvaro Cortés-Calabuig, Agata Stryjewska, Danny Huylebroeck, Stefania Fulle, and Maurilio Sampaolesi. 2020. "Zeb2 Regulates Myogenic Differentiation in Pluripotent Stem Cells" International Journal of Molecular Sciences 21, no. 7: 2525. https://doi.org/10.3390/ijms21072525