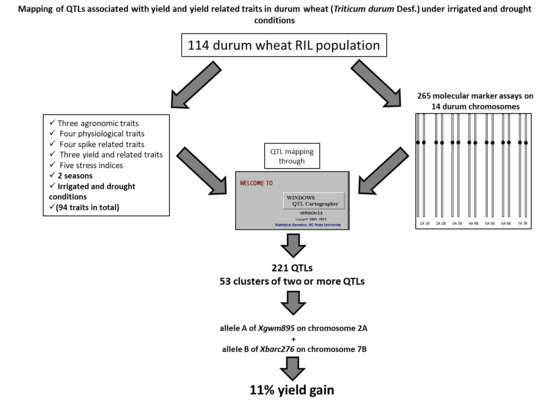
Mapping of QTLs Associated with Yield and Yield Related Traits in Durum Wheat (Triticum durum Desf.) Under Irrigated and Drought Conditions

 , ,
, ,
Abstract
:
1. Introduction
2. Results
2.1. Phenotypic Variation
2.2. Agronomic Traits
2.3. Physiological Traits
2.4. Spike-Related Traits
2.5. Yield and Related Traits
2.6. Stress Indices
2.7. Correlations
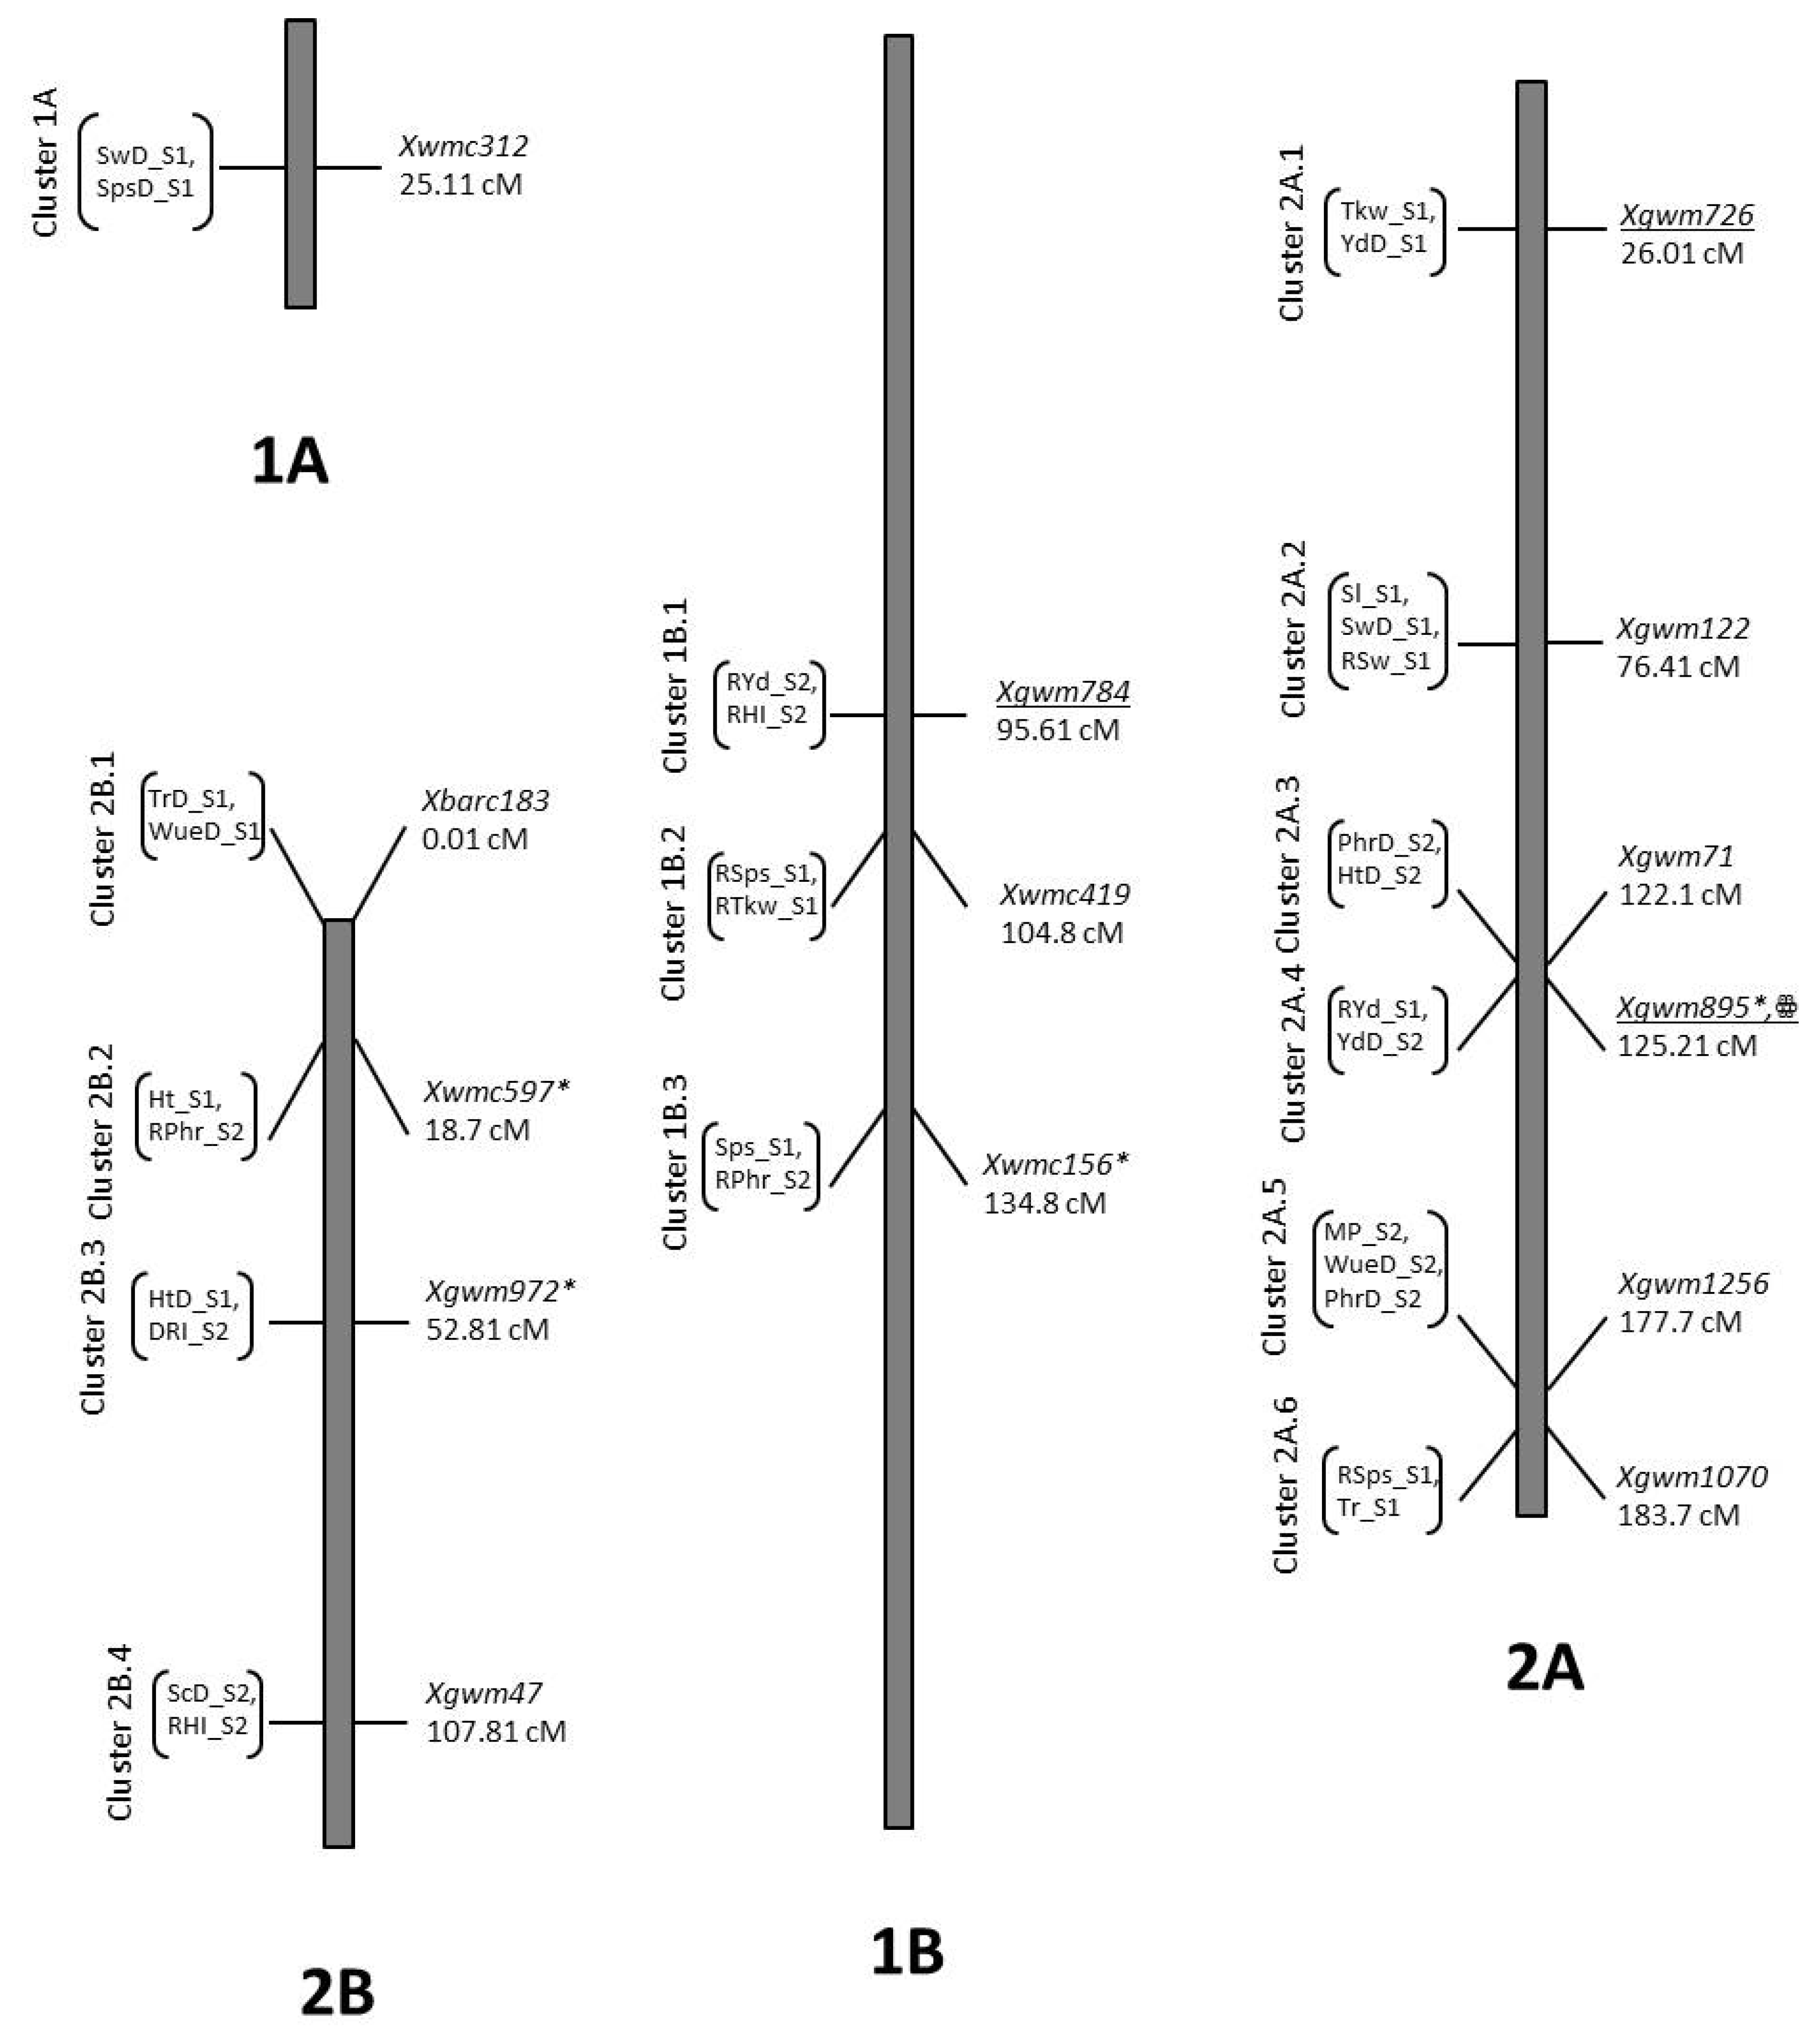
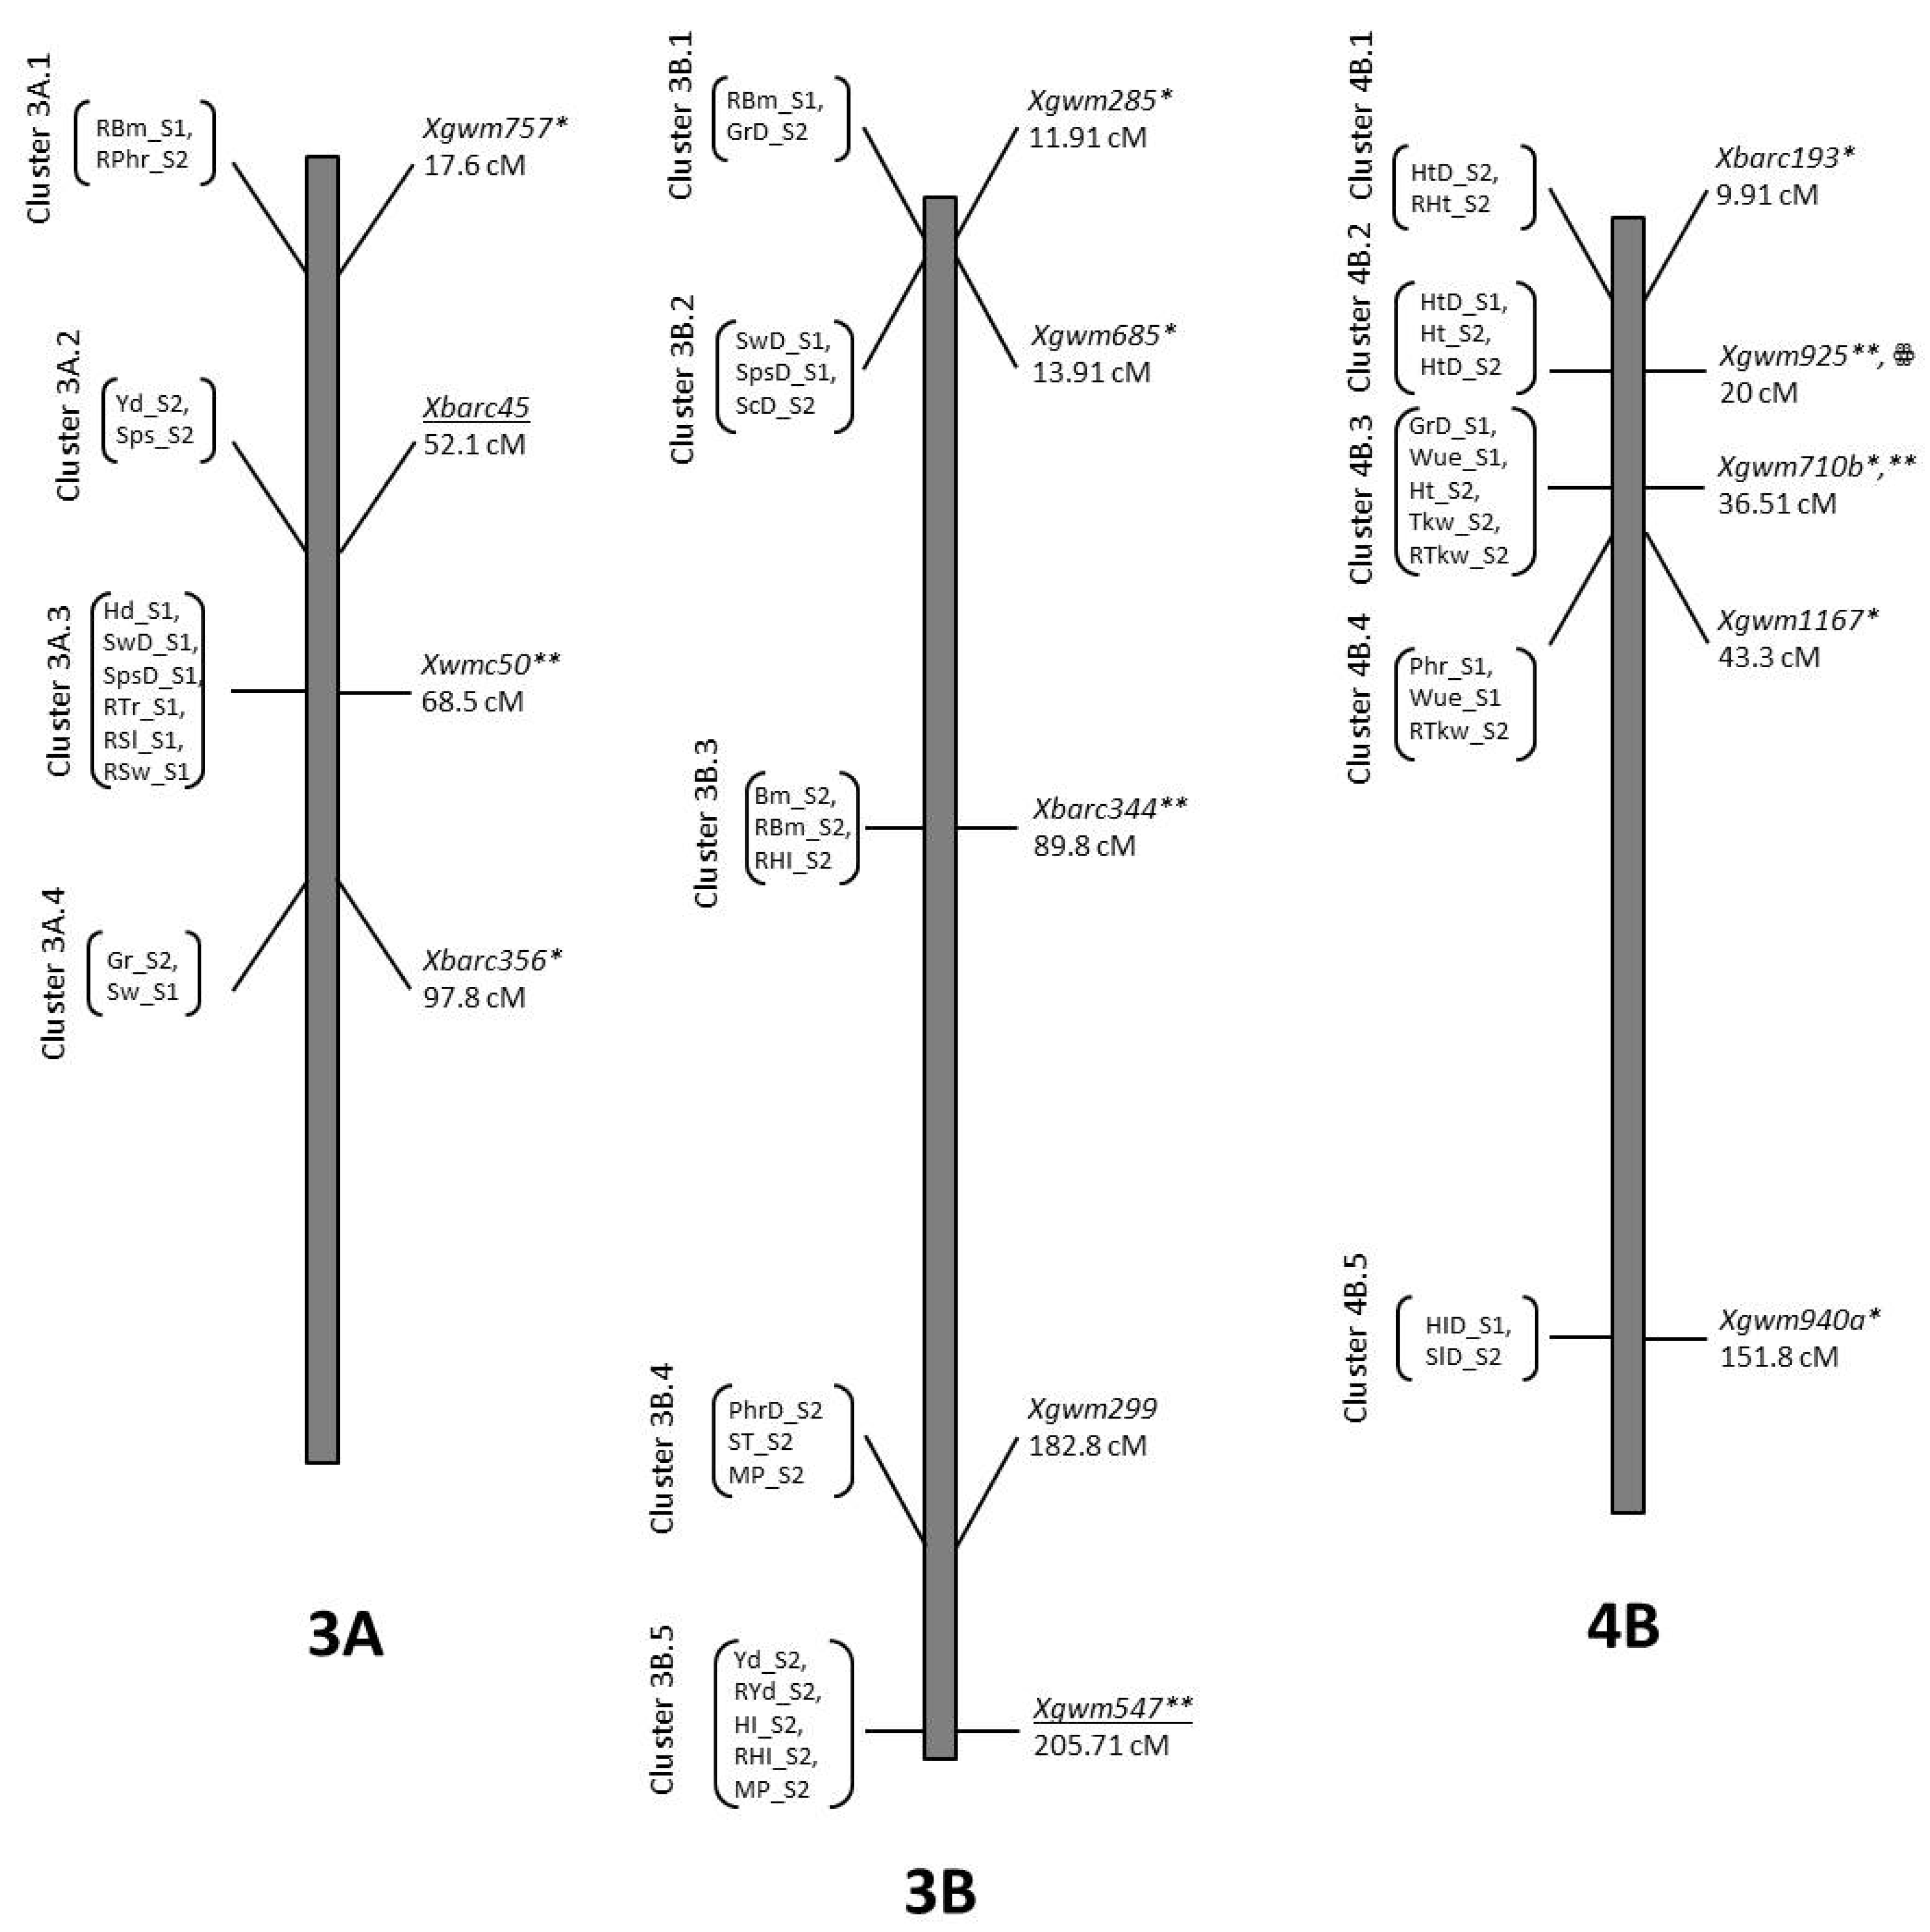
2.8. QTL Mapping
2.8.1. Agronomic Traits
2.8.2. Physiological Traits
2.8.3. Spike Related Traits
2.8.4. Yield and Related Traits
2.8.5. Stress Indices
3. Discussion
3.1. Phenotypic Differences between Treatments and Seasons
3.2. Agronomic Traits
3.3. Physiological Traits
3.4. Spike-Related Traits
3.5. Yield and Related Traits
3.6. Stress Indices
3.7. Co-Location QTLs and MAS for Durum Wheat Breeding
4. Materials and Methods
4.1. Experimental Design and Traits Measured
4.1.1. Agronomic Traits
4.1.2. Physiological Traits
4.1.3. Spike-Related Traits
4.1.4. Yield and Related Traits
4.1.5. Stress Indices
4.2. Data Analysis
4.3. Genotyping and Genetic Mapping
5. Conclusions
Supplementary Materials
Author Contributions
Funding
Acknowledgments
Conflicts of Interest
Abbreviations
| QTL | Quantitative trait loci |
| LOD | Log of odds |
| S1 | Season 1 (2016-17) |
| S2 | Season 2 (2017-18) |
| Gr | Germination |
| Hd | Heading time |
| Ph | Plant height |
| Tr | Transpiration rate |
| Phr | Photosynthetic rate |
| Sc | Stomatal conductance |
| Wue | Water use efficiency |
| Sl | Spike length |
| Sw | Spike weight |
| Sps | Seeds per spike |
| Tkw | Thousand kernel weight |
| Bm | Biomass |
| Yd | Yield |
| HI | Harvest index |
| STI | Stress tolerance index |
| SSI | Stress susceptibility index |
| MP | Mean productivity |
| DRI | Drought resistance index |
| ST | Stress tolerance |
References
- Lev-Yadun, S.; Gopher, A.; Abbo, S. The cradle of agriculture. Science 2000, 288, 1602–1603. [Google Scholar] [CrossRef] [PubMed]
- Tilman, D.; Balzer, C.; Hill, J.; Befort, B.L. Global food demand and the sustainable intensification of agriculture. Proc. Nat. Acad. Sci. USA 2011, 108, 20260–20264. [Google Scholar] [CrossRef] [PubMed] [Green Version]
- Breakout session P1.1 National Food Security–The Wheat Initiative–an International Research Initiative for Wheat Improvement. Available online: http://www.fao.org/docs/eims/upload/306175/Briefing%20Paper%20(3)-Wheat%20Initative%20-%20H%C3%A9l%C3%A8ne%20Lucas.pdf (accessed on 22 December 2019).
- Ames, N.P.; Clarke, J.M.; Marchylo, B.A.; Dexter, J.E.; Woods, S.M. Effect of environment and genotype on durum wheat gluten strength and pasta viscoelasticity. Cereal Chem. 1999, 76, 582–586. [Google Scholar] [CrossRef]
- World Pasta Market and Turkey. Available online: http://www.magazinebbm.com/english/world-pasta-market-and-turkey/.html (accessed on 22 December 2019).
- International Grains Council. Available online: http://www.igc.int/en/Default.aspx (accessed on 22 December 2019).
- Araus, J.L.; Bort, J.; Steduto, P.; Villegas, D.; Royo, C. Breeding cereals for Mediterranean conditions: ecophysiological clues for biotechnology application. Ann. Appl. Biol. 2003, 142, 129–141. [Google Scholar] [CrossRef]
- Araus, J.L.; Slafer, G.A.; Reynolds, M.P.; Royo, C. Plant breeding and drought in C3 cereals: what should we breed for? Ann. Bot. 2002, 89, 925–940. [Google Scholar] [CrossRef] [PubMed]
- Condon, A.G.; Richards, R.A.; Rebetzke, G.J.; Farquhar, G.D. Breeding for high water-use efficiency. J. Exp. Bot. 2004, 55, 2447–2460. [Google Scholar] [CrossRef] [Green Version]
- Ludlow, M.M.; Muchow, R.C. A critical evaluation of traits for improving crop yields in water-limited environments. Adv. Agron. 1990, 43, 107–153. [Google Scholar]
- Rajaram, S. Prospects and promise of wheat breeding in the 21st century. In Wheat in a Global Environment; Springer: Dordrecht, The Netherlands, 2001; pp. 37–52. [Google Scholar]
- Ashraf, M.; Harris, P. Abiotic Stresses: Plant Resistance through Breeding and Molecular Approaches; CRC Press: Boca Raton, FL, USA, 2005. [Google Scholar]
- Sangtarash, M.H. Responses of different wheat genotypes to drought stress applied at different growth stages. Pak. J. Biol. Sci. 2010, 13, 114–119. [Google Scholar] [CrossRef] [Green Version]
- Clarke, J.M.; Richards, R.A.; Condon, A.G. Effect of drought stress on residual transpiration and its relationship with water use of wheat. Can. J. Plant Sci. 1991, 71, 695–702. [Google Scholar] [CrossRef] [Green Version]
- Blum, A. Plant Breeding for Stress Environments; CRC Press: Boca Raton, FL, USA, 1998. [Google Scholar]
- Zaharieva, M.; Gaulin, E.; Havaux, M.; Acevedo, E.; Monneveux, P. Drought and heat responses in the wild wheat relative Aegilops geniculata Roth. Crop Sci. 2001, 41, 1321–1329. [Google Scholar] [CrossRef]
- Nachit, M.M.; Elouafi, I. Durum wheat adaptation in the Mediterranean dryland: Breeding, stress physiology, and molecular markers. In Challenges and Strategies of Dryland Agriculture, (Challengesandst); Crop Science Society of America and American Society of Agronomy: Madison, WI, USA, 2004; pp. 203–218, CSSA special Publication no. 32. [Google Scholar]
- Houshmand, S.; Arzani, A.; Mirmohammadi-Maibody, S.A.M. Effects of salinity and drought stress on grain quality of durum wheat. Commun. Soil Sci. Plant 2014, 45, 297–308. [Google Scholar] [CrossRef]
- Royo, C.; Di Fonzo, N.; Nachit, M.M.; Araus, J.L. Enhancing genetic grain yield potential and yield stability in durum wheat. In Proceedings of the Seminar Durum Wheat Improvement in the Mediterranean Region: New Challenges. Options Méditerranéennes, Zaragoza, Spain, 12–14 April 2000; Volume 40, pp. 88–93. [Google Scholar]
- Mitchell, J.; Siamhan, D.M.; Wamala, M.; Risimeri, J.E.; Chinyamakobvu, E.; Henderson, S.; Fukai, S. The use of seedling leaf death score for evaluation of drought resistance of rice. Field Crop Res. 1998, 55, 129–139. [Google Scholar] [CrossRef]
- Akram, M. Growth and yield components of wheat under water stress of different growth stages. Ban. J. Agric. Res. 2011, 36, 455–468. [Google Scholar] [CrossRef] [Green Version]
- Khakwani, A.A.; Dennett, M.; Munir, M. Drought tolerance screening of wheat varieties by inducing water stress conditions. Songklanakarin J. Sci. Technol. 2011, 33, 135–142. [Google Scholar]
- Ramirez-Vallejo, P.; Kelly, J.D. Traits related to drought resistance in common bean. Euphytica 1998, 99, 127–136. [Google Scholar] [CrossRef]
- Mitra, J. Genetics and genetic improvement of drought resistance in crop plants. Curr. Sci. 2001, 80, 758–763. [Google Scholar]
- Fernandez, G.C. Effective selection criteria for assessing plant stress tolerance. In Proceedings of the International Symposium on Adaptation of Vegetables and other Food Crops in Temperature and Water Stress, Shanhua, Taiwan, 13–16 August 1992; pp. 257–270. [Google Scholar]
- Hall, A. Is dehydration tolerance relevant to genotypic difference in leaf senescence and crop adaption to dry environments. In Plant Responses to Cellular Dehydration during Environmental Stress; Close, T.J., Bray, E.A., Eds.; The American Soc. Plant Pathologists: Rockville, MD, USA, 1993; pp. 1–10. [Google Scholar]
- Blanco, A.; Bellomo, M.; Cenci, A.; De Giovanni, C.; D’ovidio, R.; Iacono, E.; Laddomada, B.; Pagnotta, M.; Porceddu, E.; Sciancalepore, A. A genetic linkage map of durum wheat. Theor. Appl. Genet. 1998, 97, 721–728. [Google Scholar] [CrossRef]
- Nachit, M.M.; Elouafi, I.; Pagnotta, M.A.; El-Saleh, A.; Iacono, E.; Labhilili, M.; Asbati, A.; Azrak, M.; Hazzam, H.; Benscher, D.; et al. Molecular linkage map for an intraspecific recombinant inbred population of durum wheat (Triticum turgidum L. var. durum). Theor. Appl. Genet. 2001, 102, 177–186. [Google Scholar] [CrossRef]
- Maccaferri, M.; Sanguineti, M.C.; Corneti, S.; Ortega, J.L.A.; Salem, M.B.; Bort, J.; DeAmbrogio, E.; del Moral, L.F.G.; Demontis, A.; El-Ahmed, A.; et al. Quantitative trait loci for grain yield and adaptation of durum wheat (Triticum durum Desf.) across a wide range of water availability. Genetics 2008, 178, 489–511. [Google Scholar] [CrossRef] [Green Version]
- Sourdille, P.; Perretant, M.; Charmet, G.; Leroy, P.; Gautier, M.; Joudrier, P.; Nelson, J.; Sorrells, M.E.; Bernard, M. Linkage between RFLP markers and genes affecting kernel hardness in wheat. Theor. Appl. Genet. 1996, 93, 580–586. [Google Scholar] [CrossRef]
- Nauraein, M.; Mohammadi, S.A.; Ahrizad, S.; Moghaddam, M.; Sadeghzadeh, B. Evaluation of drought tolerance indices in wheat recombinant inbred population. Ann. Biol. Res. 2013, 4, 113–122. [Google Scholar]
- Börner, A.; Schumann, E.; Fürste, A.; Cöster, H.; Leithold, B.; Röder, M.S.; Weber, W.E. Mapping of quantitative trait loci determining agronomic important characters in hexaploid wheat (Triticum aestivum L.). Theor. Appl. Genet. 2002, 105, 921–936. [Google Scholar] [CrossRef] [PubMed]
- Dolferus, R.; Ji, X.M.; Richards, R.A. Abiotic stress control of grain number in cereals. Plant Sci. 2011, 181, 331–347. [Google Scholar] [CrossRef] [PubMed]
- Bennett, D.; Reynolds, M.; Mullan, D.; Izanloo, A.; Kuchel, H.; Langridge, P.; Schnurbusch, T. Detection of two major grain yield QTL in bread wheat (Triticum aestivum L.) under heat, drought and high yield potential environments. Theor. Appl. Genet. 2012, 173, 1473–1485. [Google Scholar] [CrossRef] [PubMed]
- Rehman-Arif, M.A.; Börner, A. Mapping of QTL associated with seed longevity in durum wheat (Triticum durum Desf.). J. Appl. Genet. 2019, 60, 33–36. [Google Scholar] [CrossRef] [PubMed]
- Peleg, Z.V.I.; Fahima, T.; Krugman, T.; Abbo, S.; Yakir, D.A.N.; Korol, A.B.; Saranga, Y. Genomic dissection of drought resistance in durum wheat× wild emmer wheat recombinant inbreed line population. Plant Cell Environ. 2009, 32, 758–779. [Google Scholar] [CrossRef] [PubMed]
- Panio, G.; Motzo, R.; Mastrangelo, A.M.; Marone, D.; Cattivelli, L.; Giunta, F.; De Vita, P. Molecular mapping of stomatal-conductance-related traits in durum wheat (Triticum turgidum ssp. durum). Ann. Appl. Biol. 2013, 162, 258–270. [Google Scholar] [CrossRef]
- Xu, Y.F.; Li, S.S.; Li, L.H.; Ma, F.F.; Fu, X.Y.; Shi, Z.L.; Xu, H.X.; Ma, P.T.; An, D.G. QTL mapping for yield and photosynthetic related traits under different water regimes in wheat. Mol. Breed. 2017, 37, 34. [Google Scholar] [CrossRef]
- Hu, J.; Wang, X.; Zhang, G.; Jiang, P.; Chen, W.; Hao, Y.; Ma, X.; Xu, S.; Jia, J.; Kong, L.; et al. QTL mapping for yield-related traits in wheat based on four RIL populations. Theor. Appl. Genet. 2020, 133, 917–933. [Google Scholar] [CrossRef]
- Nagel, M.; Navakode, S.; Scheibal, V.; Baum, M.; Nachit, M.; Röder, M.S.; Börner, A. The genetic basis of durum wheat germination and seedling growth under osmotic stress. Biol. Plant. 2014, 58, 681–688. [Google Scholar] [CrossRef]
- Wang, S.G.; Jia, S.S.; Sun, D.Z.; Wang, H.Y.; Dong, F.F.; Ma, H.X.; Jing, R.L.; Ma, G. Genetic basis of traits related to stomatal conductance in wheat cultivars in response to drought stress. Photosynthetica 2015, 53, 299–305. [Google Scholar] [CrossRef]
- Blanco, A.; Simeone, R.; Gadaleta, A. Detection of QTL for grain protein content in durum wheat. Theor. Appl. Genet. 2006, 112, 1195–1204. [Google Scholar] [CrossRef] [PubMed]
- Patil, R.M.; Tamhankar, S.A.; Oak, M.D.; Raut, A.L.; Honrao, B.K.; Rao, V.S.; Misra, S.C. Mapping of QTL for agronomic traits and kernel characters in durum wheat (Triticum durum Desf.). Euphytica 2013, 190, 117–129. [Google Scholar] [CrossRef]
- Kumar, N.; Kulwal, P.L.; Balyan, H.S.; Gupta, P.K. QTL mapping for yield and yield contibuting traits in two mapping populations fo bread wheat. Mol. Breed. 2007, 19, 163–177. [Google Scholar] [CrossRef]
- Blanco, A.; Mangini, G.; Giancaspro, A.; Giove, S.; Colasuonno, P.; Simeone, R.; Signorile, A.; De Vita, P.; Mastrangelo, A.M.; Cattivelli, L.; et al. Relationships between grain protein content and grain yield components through quantitative trait locus analyses in a recombinant inbred line population derived from two elite durum wheat cultivars. Mol. Breed. 2012, 30, 79–92. [Google Scholar] [CrossRef]
- Roncallo, P.F.; Akkiraju, P.C.; Cervigni, G.L.; Echenique, V.C. QTL mapping and analysis of epistatic interactions for grain yield and yield-related traits in Triticum turgidum L. var. durum. Euphytica 2017, 213, 277. [Google Scholar] [CrossRef]
- Cuthbert, J.L.; Somers, D.J.; Brûlé-Babel, A.L.; Brown, P.D.; Crow, G.H. Molecular mapping of quantitative trait loci for yield and yield components in spring wheat (Triticum aestivum L.). Theo. Appl. Genet. 2008, 117, 595–608. [Google Scholar] [CrossRef]
- Ain, Q.; Rasheed, A.; Anwar, A.; Mahmood, T.; Imtiaz, M.; Xia, X.; He, Z.; Quraishi, U.M. Genome-wide association for grain yield under rainfed conditions in historical wheat cultivars from Pakistan. Front. Plant Sci. 2015, 6, 743. [Google Scholar] [CrossRef] [Green Version]
- Qaseem, M.F.; Qureshi, R.; Shaheen, H.; Shafqat, N. Genome-wide association analyses for yield and yield-related traits in bread wheat (Triticum aestivum L.) under pre-anthesis combined heat and drought stress in field conditions. PloS ONE 2019, 14, e213407. [Google Scholar] [CrossRef] [Green Version]
- Golabadi, M.A.; Arzani, A.; Mirmohammadi-Maibody, S.A.M. Assessment of drought tolerance in segregating populations in durum wheat. Afr. J. Agric. Res. 2006, 5, 162–171. [Google Scholar]
- Ballesta, P.; Freddy Mora, F.; Del-Pozo, A. Association mapping of drought tolerance indices in wheat: QTL-rich regions on chromosome 4A. Sci. Agricola 2020, 77, 2. [Google Scholar] [CrossRef] [Green Version]
- Golabadi, M.; Arzani, A.; Mirmohammadi-Maibody, S.A.M.; Sayed-Tabatabaei, B.E.; Mohammadi, S.A. Identification of microsatellite markers linked with yield components under drought stress at terminal growth stages in durum wheat. Euphytica 2011, 177, 207–221. [Google Scholar] [CrossRef]
- Wang, S.; Basten, C.J.; Zeng, Z.B. Windows QTL Cartographer 2.5. Department of Statistics, North Carolina State University, Raleigh. Available online: http://statgen.ncsu.edu/qtlcart/WQTLCart.html (accessed on 22 December 2019).


| S1 | S2 | p-Value | ||||
|---|---|---|---|---|---|---|
| Trait | Range | Mean ± SD | Trait | Range | Mean ± SD | |
| Agronomic Traits | ||||||
| Gr_S1 | 50–100 | 81.86 ± 9.63 | Gr_S2 | 80–100 | 96.00 ± 3.72 | PS = *** |
| GrD_S1 | 47.5–100 | 72.55 ± 9.96 | GrD_S2 | 70–100 | 91.24 ± 5.56 | PT = *** |
| RGr_S1 | 66.7–100 | 88.24 ± 11.78 | RGr_S2 | 73.68–100 | 95.11 ± 5.30 | PG = * |
| PS*T = * | ||||||
| Hd_S1 | 80–128 | 100.47 ± 11.79 | Hd_S2 | 84–120 | 98.31 ± 7.19 | PT = *** |
| HdD_S1 | 80–126 | 93.94 ± 12.41 | HdD_S2 | 78.5–114.5 | 92.32 ± 6.79 | PS*T = * |
| RHd_S1 | 51–121.78 | 94.30 ± 3.38 | RHd_S2 | 80–101.66 | 94.18 ± 2.70 | |
| Ht_S1 | 61–148 | 114.78 ± 23.82 | Ht_S2 | 62–185 | 111.36 ± 26.31 | PS = *** |
| HtD_S1 | 53–110 | 80.24 ± 12.45 | HtD_S2 | 51–109.83 | 83.65 ± 14.14 | PT = *** |
| RHt_S1 | 45.07–99.1 | 74.14 ± 10.05 | RHt_S2 | 56.15–98.03 | 76.51 ± 8.94 | |
| Physiological Traits | ||||||
| Tr_S1 | 22.55–56.02 | 37.38 ± 6.86 | Tr_S2 | 20.02–48.25 | 34.17 ± 6.51 | PT = *** |
| TrD_S1 | 5.17–27.8 | 15.56 ± 4.65 | TrD_S2 | 8.59–19.68 | 15.06 ± 1.90 | PG = ** |
| RTr_S1 | 14.2–95.5 | 42.98 ± 15.98 | RTr_S2 | 21.28-73.24 | 45.43 ± 9.78 | PT*G = * |
| Sc_S1 | 675.08–3743.6 | 1492.70 ± 527.26 | Sc_S2 | 526.72–2059.5 | 1143.90 ± 293.57 | PS = *** |
| ScD_S1 | 118.33–675.08 | 342.96 ± 114.03 | ScD_S2 | 99.85–486.87 | 262.53 ± 93.35 | PT = *** |
| RSc_S1 | 3.16–61.2 | 25.29 ± 11.39 | RSc_S2 | 10.14–47.19 | 23.50 ± 8.17 | PG = *** |
| PS*T = ** | ||||||
| PT*G = ** | ||||||
| PS*T = * | ||||||
| Phr_S1 | 2.5–10.2 | 3.97 ± 1.24 | Phr_S2 | 1.79–8.6 | 3.49 ± 1.25 | PS = *** |
| PhrD_S1 | 1.25–3.84 | 2.22 ± 0.44 | PhrD_S2 | 0.57–3.78 | 1.72 ± 0.67 | PT = *** |
| RPhr_S1 | 14.93–93 | 58.96 ± 15.51 | RPhr_S2 | 15.95–97.81 | 50.94 ± 15.76 | PG = * |
| PS*T = ** | ||||||
| Wue_S1 | 7.32–30.59 | 11.89 ± 4.03 | Wue_S2 | 4.41–36.12 | 11.14 ± 6.30 | PS = ** |
| WueD_S1 | 5.95–54.63 | 16.04 ± 7.93 | WueD_S2 | 3.29–31.33 | 11.43 ± 5.14 | PT = *** |
| RWue_S1 | 30.56–659.29 | 144.41 ± 87.62 | RWue_S2 | 24.38–225.63 | 113.98 ± 41.44 | PS*T = ** |
| Spike Related Traits | ||||||
| Sl_S1 | 6.4–12.06 | 8.25 ± 0.96 | Sl_S2 | 5.8–9.96 | 7.60 ± 0.71 | PS = * |
| SlD_S1 | 4.43–9.58 | 7.13 ± 1.11 | SlD_S2 | 4.4–9 | 6.86 ± 0.66 | PT = *** |
| RSl_S1 | 56.51–99.43 | 86.71 ± 11.40 | RSl_S2 | 74.48–100 | 90.64 ± 6.81 | PS*T = *** |
| PT*G = * | ||||||
| Sps_S1 | 24.6–62.6 | 43.35 ± 9.60 | Sps_S2 | 32.8–91.3 | 47.15 ± 8.18 | PT = *** |
| SpsD_S1 | 16.6–56.6 | 33.44 ± 7.75 | SpsD_S2 | 15.8–48.1 | 35.52 ± 5.73 | |
| RSps_S1 | 43.24–99.44 | 78.75 ± 14.88 | RSps_S2 | 34.35–99.75 | 77.17 ± 13.78 | |
| Sw_S1 | 1.45–4.94 | 3.05 ± 0.65 | Sw_S2 | 1.58–4.96 | 2.92 ± 0.65 | PT = *** |
| SwD_S1 | 1.19–3.76 | 2.30 ± 0.57 | SwD_S2 | 1.28–3.66 | 2.25 ± 0.41 | |
| RSw_S1 | 42.41–100 | 77.19 ± 15.48 | RSw_S2 | 43.2–99.66 | 78.98 ± 14.60 | |
| Tkw_S1 | 27.52–61.94 | 48.88 ± 5.30 | Tkw_S2 | 31.09–56.4 | 42.08 ± 6.26 | PT = *** |
| TkwD_S1 | 26.4–55.21 | 45.07 ± 4.95 | TkwD_S2 | 26.53–54.87 | 38.99 ± 5.57 | PG = ** |
| RTkw_S1 | 67.96–99.91 | 92.37 ± 6.66 | RTkw_S2 | 69.54–99.93 | 92.20 ± 5.66 | |
| Yield and Related Traits | ||||||
| Bm_S1 | 1180.8–6266.5 | 3535.80 ± 1086.20 | Bm_S2 | 1120–9000 | 3551.20 ± 1172.60 | PT = *** |
| BmD_S1 | 453.6–2282.6 | 1070.50 ± 349.64 | BmD_S2 | 420–2320 | 1191.40 ± 373.78 | PS*G= * |
| RBm_S1 | 10.03–92.01 | 32.15 ± 12.00 | RBm_S2 | 12–62.42 | 34.60 ± 11.05 | |
| Yd_S1 | 305.68–1882.7 | 1033.10 ± 361.77 | Yd_S2 | 306–1821 | 1010.10 ± 335.93 | PT = *** |
| YdD_S1 | 120.73–639.19 | 350.92 ± 109.75 | YdD_S2 | 138–792 | 332.46 ± 116.73 | PG = * |
| RYd_S1 | 12.5–70.93 | 36.39 ± 12.21 | RYd_S2 | 11.92–67.08 | 34.89 ± 12.27 | PS*G= *** |
| PS*T*G=** | ||||||
| HI_S1 | 11.58–66.6 | 30.50 ± 10.09 | HI_S2 | 15.65–46.27 | 28.56 ± 6.38 | PT = *** |
| HID_S1 | 14.16–60.49 | 33.59 ± 7.96 | HID_S2 | 12.38–44 | 28.47 ± 6.68 | PG = *** |
| RHI_S1 | 40.55–219.08 | 117.66 ± 36.37 | RHI_S2 | 41.31–250.31 | 103.30 ± 30.84 | PT*G =*** |
| Stress Indices | ||||||
| STI_S1 | 0.06–1.04 | 0.36 ± 0.20 | STI_S2 | 0.06–1.41 | 0.35 ± 0.21 | NA |
| MP_S1 | 266.51–1236.5 | 693.77 ± 213.97 | MP_S2 | 258–1306.5 | 674.98 ± 198.37 | NA |
| ST_S1 | 158.19–1509 | 685.70 ± 322.29 | ST_S2 | 120–1401 | 684.24 ± 297.06 | NA |
| SSI_S1 | 0.44–1.32 | 0.96 ± 0.18 | SSI_S2 | 0.49–1.31 | 0.97 ± 0.18 | NA |
| DRI_S1 | 49.91–1255.7 | 389.18 ± 208.56 | DRI_S2 | 49.97–1211.8 | 371.11 ± 229.50 | NA |
| Trait | QTL Designation | Chr | Pos | LOD | Closest Marker | Add. Effect | R2 | Donor |
|---|---|---|---|---|---|---|---|---|
| Agronomic Traits | ||||||||
| Gr_S2 | QGr_S2.NIAB-1B.1 | 1B | 19.81 | 3.75 | Xgwm752 | −1.75 | 0.18 | B2 |
| Gr_S2 | QGr_S2.NIAB-1B.2 | 1B | 31.01 | 5.41 | Xbarc8 | −1.77 | 0.18 | B2 |
| Gr_S2 | QGr_S2.NIAB-3As | 3A | 96.91 | 2.23 | Xbarc356 | 1.05 | 0.07 | O5 |
| GrD_S2 | QGrD_S2.NIAB-3Bt | 3B | 11.91 | 2.51 | Xgwm285 | 1.59 | 0.07 | O5 |
| GrD_S1 | QGrD_S1.NIAB-4Baa | 4B | 36.51 | 2.04 | Xgwm710b | −2.64 | 0.06 | B2 |
| Gr_S1 | QGr_S1.NIAB-5A.1 | 5A | 73.71 | 2.51 | Xbarc342 | 3.06 | 0.08 | O5 |
| Gr_S1 | QGr_S1.NIAB-5A.2hh | 5A | 171.81 | 3.59 | Xgwm1171b | −4.27 | 0.18 | B2 |
| GrD_S1 | QGrD_S1.NIAB-5B | 5B | 48.71 | 2.81 | Xgwm1165 | −3.31 | 0.1 | B2 |
| GrD_S2 | QGrD_S2.NIAB-5B.1nn | 5B | 207.51 | 2.6 | Xbarc266 | −1.71 | 0.08 | B2 |
| RGr_S2 | QRGr_S2.NIAB-5B.1nn | 5B | 207.51 | 2.87 | Xbarc266 | −2.02 | 0.1 | B2 |
| GrD_S2 | QGrD_S2.NIAB-5B.2 | 5B | 247.11 | 2.95 | Xbarc59 | −1.69 | 0.09 | B2 |
| GrD_S2 | QGrD_S2.NIAB-5B.3pp | 5B | 256.01 | 2.03 | Xgwm790 | −1.4 | 0.06 | B2 |
| RGr_S2 | QRGr_S2.NIAB-5B.2pp | 5B | 261.01 | 2.31 | Xgwm790 | −1.76 | 0.09 | B2 |
| Gr_S2 | QGr_S2.NIAB-6B | 6A | 121.51 | 3.09 | Xgwm4915 | 1.44 | 0.14 | O5 |
| Gr_S1 | QGr_S1.NIAB-6B.1rr | 6B | 141.41 | 2.9 | Xbarc178 | −3.64 | 0.12 | B2 |
| Gr_S1 | QGr_S1.NIAB-6B.2 | 6B | 147.11 | 3.02 | Xbarc247 | −3.53 | 0.11 | B2 |
| RGr_S1 | QRGr_S1.NIAB-7B | 7B | 216.21 | 2.25 | Xgwm983 | −3.69 | 0.08 | B2 |
| HdD_S1 | QHdD_S1.NIAB-2A | 2A | 5.81 | 2.21 | Xgwm1244 | −4.23 | 0.08 | B2 |
| Hd_S1 | QHd_S1.NIAB-3Aq | 3A | 73.51 | 4.54 | Xwmc50 | −5.11 | 0.17 | B2 |
| HdD_S1 | QHdD_S1.NIAB-3A | 3A | 44.51 | 2.1 | Xgwm779 | −4.47 | 0.09 | B2 |
| Hd_S1 | QHd_S1.NIAB-5Agg | 5A | 169.81 | 2.52 | Xbarc165 | −4.36 | 0.12 | B2 |
| HdD_S2 | QHdD_S2.NIAB-5Ahh | 5A | 188.01 | 3.39 | Xgwm1171b | −3.02 | 0.18 | B2 |
| RHd_S1 | QRHd_S1.NIAB-6B | 6B | 123.6 | 2.35 | Xgwm963a | 2.5 | 0.1 | O5 |
| RHd_S1 | QRHd_S1.NIAB-7B | 7B | 42.5 | 4.35 | Xgwm195 | 4.02 | 0.16 | O5 |
| RHd_S1 | QRHd_S1.NIAB-7Bccc | 7B | 223.8 | 2.05 | Xwmc396 | −2.3 | 0.08 | B2 |
| PhD_S2 | QPhD_S2.NIAB-2Ah | 2A | 121.31 | 2.04 | Xgwm71 | 3.64 | 0.06 | O5 |
| Ph_S1 | QPh_S1.NIAB-2Bl | 2B | 19.71 | 2.18 | Xwmc597 | 6.88 | 0.07 | O5 |
| PhD_S1 | QPhD_S1.NIAB-3A | 3A | 14.61 | 2.86 | Xbarc294 | −3.99 | 0.09 | B2 |
| PhD_S1 | QPhD_S1.NIAB-2Bm | 2B | 52.81 | 2.29 | Xgwm972 | −3.41 | 0.06 | B2 |
| Ph_S2 | QRPh_S2.NIAB.3A | 3A | 13.01 | 2.21 | Xbarc57 | 2.39 | 0.06 | B2 |
| Ph_S2 | QRPh_S2.NIAB.4By | 4B | 9.91 | 2.8 | Xbarc193 | −2.66 | 0.08 | B2 |
| PhD_S2 | QPhD_S2.NIAB-4B.1y | 4B | 14.91 | 2.92 | Xbarc193 | 4.78 | 0.1 | O5 |
| PhD_S1 | QPhD_S1.NIAB-4Bz | 4B | 15.91 | 5.2 | Xgwm925 | 6.15 | 0.22 | O5 |
| Ph_S2 | QPh_S2.NIAB-4B.1z | 4B | 24.01 | 2.21 | Xgwm925 | 8.37 | 0.09 | O5 |
| PhD_S2 | QPhD_S2.NIAB-4B.2z | 4B | 25.01 | 2.51 | Xgwm925 | 4.69 | 0.1 | O5 |
| Ph_S2 | QPh_S2.NIAB-4B.2aa | 4B | 35.71 | 2.99 | Xgwm710b | 8.58 | 0.1 | O5 |
| Ph_S1 | QPh_S1.NIAB-5Aee | 5A | 46.91 | 2 | Xgwm129 | 6.04 | 0.06 | O5 |
| PhD_S2 | QPhD_S2.NIAB-5Aii | 5A | 277.71 | 2.3 | Xgwm126 | −4.36 | 0.09 | B2 |
| Ph_S2 | QPh_S2.NIAB-5Ajj | 5A | 334.41 | 2.42 | Xbarc261 | −7.91 | 0.08 | B2 |
| RPh_S1 | QRPh_S1.NIAB-5A | 5A | 311.71 | 3.3 | Xgwm995 | 3.68 | 0.1 | O5 |
| Ph_S1 | QPh_S1.NIAB-6A | 6A | 51.31 | 3.16 | Xgwm4608 | −8.31 | 0.1 | B2 |
| PhD_S2 | QPhD_S2.NIAB-7A | 7A | 144.21 | 2.04 | Xwmc488 | 3.68 | 0.06 | O5 |
| RPh_S1 | QRPh_S1.NIAB-7Bbbb | 7B | 252.61 | 2.92 | Xgwm112 | 3.84 | 0.09 | O5 |
| RPh_S2 | QRPh_S2.NIAB.7B | 7B | 288.81 | 4.78 | Xwmc517 | 4.73 | 0.16 | O5 |
| Physiological Traits | ||||||||
| Tr_S1 | QTr_S1.NIAB-2A | 2A | 189.71 | 2.8 | Xgwm382 | −2.41 | 0.11 | B2 |
| TrD_S1 | QTrD_S1.NIAB-2Bk | 2B | 0.01 | 4.13 | Xbarc183 | 1.9 | 0.12 | O5 |
| RTr_S1 | QRTr_S1.NIAB-3Aq | 3A | 73.51 | 3.49 | Xwmc50 | 5.87 | 0.13 | O5 |
| TrD_S1 | QTrD_S1.NIAB-3Ar | 3A | 77.51 | 3.48 | Xgwm5 | 1.74 | 0.13 | O5 |
| RTr_S2 | QRTr_S2.NIAB.3B | 3B | 152.31 | 2.2 | Xgwm655 | −11.61 | 0.14 | B2 |
| Tr_S2 | QTr_S2.NIAB.5Aii | 5A | 274.71 | 2.41 | Xgwm126 | −1.1 | 0.07 | B2 |
| TrD_S1 | QTrD_S1.NIAB-5Bkk | 5B | 13.41 | 2.24 | Xgwm540a | −1.24 | 0.06 | B2 |
| RTr_S2 | QRTr_S2.NIAB.5Bmm | 5B | 158.91 | 2.03 | Xgwm408 | −8.41 | 0.06 | B2 |
| Tr_S2 | QTr_S2.NIAB.5Bmm | 5B | 158.11 | 2.9 | Xgwm408 | 1.34 | 0.09 | O5 |
| Tr_S2 | QTr_S2.NIAB.6Aqq | 6A | 246.21 | 2.55 | Xwmc621 | 1.45 | 0.12 | O5 |
| TrD_S1 | QTrD_S1.NIAB-7B | 7B | 51.11 | 3.07 | Xgwm400 | 1.68 | 0.11 | O5 |
| TrD_S1 | QTrD_S1.NIAB-7B.2aaa | 7B | 219.11 | 2.48 | Xbarc276 | −1.31 | 0.07 | B2 |
| RTr_S1 | QRTr_S1.NIAB-7Bccc | 7B | 238.91 | 2.19 | Xwmc396 | 5.65 | 0.11 | O5 |
| Tr_S1 | QTr_S1.NIAB-7Bbbb | 7B | 248.91 | 3.03 | Xgwm112 | −2.69 | 0.14 | B2 |
| Sc_S1 | QSc_S1.NIAB-1B.1 | 1B | 168.61 | 2.47 | Xbarc61 | 168.28 | 0.08 | O5 |
| Sc_S1 | QSc_S1.NIAB-1B.2 | 1B | 192.41 | 5.03 | Xwmc134 | −245.34 | 0.17 | B2 |
| ScD_S2 | QScD_S2.NIAB-2Bn | 2B | 107.81 | 2.17 | Xgwm47 | 1.81 | 0.07 | O5 |
| ScD_S2 | QScD_S2.NIAB-3Bu | 3B | 13.91 | 2.96 | Xgwm685 | −2.18 | 0.09 | B2 |
| RSc_S2 | QRSc_S2.NIAB-5Aii | 5A | 272.61 | 2.41 | Xgwm126 | 10.03 | 0.1 | O5 |
| Sc_S2 | QSc_S2.NIAB-5Bmm | 5B | 158.11 | 2.83 | Xgwm408 | 4.29 | 0.09 | O5 |
| Sc_S2 | QSc_S2.NIAB-6A.1 | 6A | 80.01 | 2.01 | Xbarc107 | −3.28 | 0.05 | B2 |
| Sc_S2 | QSc_S2.NIAB-6A.2qq | 6A | 244.21 | 2.44 | Xwmc621 | 4.88 | 0.13 | O5 |
| ScD_S1 | QScD_S1.NIAB-7Att | 7A | 0.01 | 2.92 | Xgwm1171a | 37.93 | 0.09 | O5 |
| RPhr_S2 | QRPhr_S2.NIAB-1Bd | 1B | 140.81 | 3.65 | Xwmc156 | 6.26 | 0.15 | O5 |
| PhrD_S2 | QPhrD_S2.NIAB-2A.1h | 2A | 121.31 | 3.15 | Xgwm71 | 0.14 | 0.1 | O5 |
| PhrD_S2 | QPhrD_S2.NIAB-2A.2j | 2A | 175.21 | 5.41 | Xgwm1256 | −0.25 | 0.24 | B2 |
| RPhr_S2 | QRPhr_S2.NIAB-2Bl | 2B | 18.71 | 2.25 | Xwmc597 | 4.63 | 0.07 | O5 |
| RPhr_S2 | QRPhr_S2.NIAB-3A.1o | 3A | 17.61 | 3.68 | Xgwm757 | −5.44 | 0.12 | B2 |
| Phr_S2 | QPhr_S2.NIAB-3Ar | 3A | 77.51 | 4.5 | Xgwm5 | 0.12 | 0.17 | O5 |
| RPhr_S2 | QRPhr_S2.NIAB-3A.2 | 3A | 108.01 | 2.36 | Xgwm666 | −4.58 | 0.07 | B2 |
| PhrD_S2 | QPhrD_S2.NIAB-3B.1w | 3B | 181.81 | 3.75 | Xgwm299 | −0.15 | 0.13 | B2 |
| PhrD_S2 | QPhrD_S2.NIAB-3B.2w | 3B | 186.81 | 2.82 | Xgwm299 | −0.14 | 0.1 | B2 |
| Phr_S1 | QPhr_S1.NIAB-4Bbb | 4B | 43.31 | 2.34 | Xgwm1167 | −0.34 | 0.07 | B2 |
| Phr_S2 | QPhr_S2.NIAB-5B | 5B | 6.41 | 4.5 | Xgwm191 | 0.09 | 0.14 | O5 |
| Phr_S1 | QPhr_S1.NIAB-6A | 6A | 2.01 | 2.15 | Xgwm459 | −0.31 | 0.06 | B2 |
| Phr_S1 | QPhr_S1.NIAB-6B | 6B | 0.01 | 2.47 | Xgwm940b | −0.37 | 0.08 | B2 |
| RPhr_S2 | QRPhr_S2.NIAB-6B | 6B | 60.81 | 2.09 | Xbarc136 | 8.31 | 0.28 | O5 |
| Phr_S2 | QPhr_S2.NIAB-7A | 7A | 186.41 | 3.14 | Xgwm276 | −0.09 | 0.13 | B2 |
| PhrD_S2 | QPhrD_S2.NIAB-7B | 7B | 106.81 | 2.06 | Xwmc182 | 0.12 | 0.06 | O5 |
| RPhr_S2 | QRPhr_S2.NIAB-7Bxx | 7B | 150.61 | 2.31 | Xgwm46 | −4.71 | 0.08 | B2 |
| WueD_S2 | QWueD_S2.NIAB-2Aj | 2A | 166.21 | 2.33 | Xgwm1256 | −1.56 | 0.19 | B2 |
| WueD_S1 | QWueD_S1.NIAB-2Bk | 2B | 0.01 | 3.71 | Xbarc183 | −0.03 | 0.11 | B2 |
| WueD_S1 | QWueD_S1.NIAB-4B | 4B | 31.71 | 2.6 | Xbarc199 | −0.02 | 0.08 | B2 |
| Wue_S1 | QWue_S1.NIAB-4B.1aa | 4B | 36.51 | 3.06 | Xgwm710b | −0.01 | 0.1 | B2 |
| Wue_S1 | QWue_S1.NIAB-4B.2bb | 4B | 43.31 | 2.12 | Xgwm1167 | −0.01 | 0.07 | B2 |
| WueD_S2 | QWueD_S2.NIAB-5A | 5A | 259.01 | 4.5 | Xwmc727 | 1.88 | 0.22 | O5 |
| Wue_S2 | QWue_S2.NIAB-5Aii | 5A | 269.61 | 2 | Xgwm126 | 0.93 | 0.08 | O5 |
| Wue_S2 | QWue_S2.NIAB-5Bmm | 5B | 158.91 | 2.12 | Xgwm408 | −0.88 | 0.06 | B2 |
| Wue_S1 | QWue_S1.NIAB-7A | 7A | 18.01 | 2.69 | Xwmc283 | −0.01 | 0.09 | B2 |
| WueD_S2 | QWueD_S2.NIAB-7Bxx | 7B | 149.61 | 2 | Xgwm46 | −0.86 | 0.06 | B2 |
| Wue_S1 | QWue_S1.NIAB-7B | 7B | 329.61 | 2.08 | Xbarc32 | 0.01 | 0.07 | O5 |
| Spike Related Traits | ||||||||
| Sl_S1 | QSl_S1.NIAB-2Ag | 2A | 76.41 | 6.89 | Xgwm122 | 0.46 | 0.21 | O5 |
| SlD_S1 | QSlD_S1.NIAB-2B | 2B | 33.21 | 4.23 | Xbarc55 | −0.57 | 0.16 | B2 |
| RSl_S1 | QRSl_S1.NIAB-3Aq | 3A | 61.11 | 2.1 | Xwmc50 | −5.64 | 0.13 | B2 |
| SlD_S2 | QSlD_S2.NIAB-4Bcc | 4B | 151.81 | 2.34 | Xgwm940a | −0.18 | 0.08 | B2 |
| Sl_S1 | QSl_S1.NIAB-4B | 4B | 154.81 | 3.8 | Xgwm935a | −0.33 | 0.19 | B2 |
| Sl_S2 | QSl_S2.NIAB-5B | 5B | 33.31 | 3.04 | Xgwm1180 | −0.24 | 0.1 | B2 |
| SlD_S2 | QSlD_S2.NIAB-7Avv | 7A | 217.81 | 2.13 | Xgwm332 | −0.17 | 0.07 | B2 |
| Sl_S2 | QSl_S2.NIAB-7A | 7A | 278.21 | 4.05 | Xgwm1061 | −0.27 | 0.14 | B2 |
| RSl_S2 | QRSl_S2.NIAB-7Bww | 7B | 89.91 | 3.86 | Xgwm573 | 3.11 | 0.18 | O5 |
| RSl_S1 | QRSl_S1.NIAB-7B | 7B | 117.61 | 2.38 | Xgwm1184 | −5.05 | 0.1 | B2 |
| SwD_S1 | QSwD_S1.NIAB-1Aa | 1A | 27.11 | 2.71 | Xwmc312 | 0.18 | 0.09 | O5 |
| Sw_S1 | QSw_S1.NIAB-1A | 1A | 30.11 | 5.25 | Xwmc93a | 0.29 | 0.19 | O5 |
| SwD_S1 | QSwD_S1.NIAB-2Ag | 2A | 76.41 | 2.22 | Xgwm122 | 0.14 | 0.06 | O5 |
| RSw_S1 | QRSw_S1.NIAB-2Ag | 2A | 76.41 | 3.38 | Xgwm122 | 5.1 | 0.1 | O5 |
| SwD_S1 | QSwD_S1.NIAB-3Aq | 3A | 68.51 | 2.55 | Xwmc50 | −0.16 | 0.08 | B2 |
| RSw_S1 | QRSw_S1.NIAB-3Aq | 3A | 72.51 | 3.02 | Xwmc50 | −5.64 | 0.12 | B2 |
| Sw_S1 | QSw_S1.NIAB-3As | 3A | 97.81 | 2.62 | Xbarc356 | 0.2 | 0.08 | O5 |
| SwD_S1 | QSwD_S1.NIAB-3Bu | 3B | 13.91 | 2.82 | Xgwm685 | 0.18 | 0.08 | O5 |
| RSw_S1 | QRSw_S1.NIAB-3Bw | 3B | 194.81 | 2.28 | Xgwm299 | −5.65 | 0.12 | B2 |
| SwD_S1 | QSwD_S1.NIAB-5Add | 5A | 0.01 | 2.94 | Xgwm154 | 0.18 | 0.09 | O5 |
| SwD_S2 | QSwD_S2.NIAB-5Aii | 5A | 277.71 | 2.14 | Xgwm126 | −0.12 | 0.09 | B2 |
| RSw_S1 | QRSw_S1.NIAB-5Ajj | 5A | 337.41 | 3.1 | Xbarc261 | −5.74 | 0.13 | B2 |
| RSw_S2 | QRSw_S2.NIAB-5B.1oo | 5B | 237.11 | 2.42 | Xgwm1072 | 4.68 | 0.09 | O5 |
| RSw_S2 | QRSw_S2.NIAB-5B.2pp | 5B | 260.01 | 3.65 | Xgwm790 | 5.87 | 0.15 | O5 |
| SwD_S1 | QSwD_S1.NIAB-5B | 5B | 270.91 | 2.23 | Xgwm605 | 0.14 | 0.06 | O5 |
| SwD_S2 | QSwD_S2.NIAB-7Auu | 7A | 57.81 | 2 | Xwmc405 | −0.12 | 0.08 | B2 |
| RSw_S1 | QRSw_S1.NIAB-7A | 7A | 98.81 | 2.59 | Xgwm710a | −4.37 | 0.07 | B2 |
| RSw_S1 | QRSw_S1.NIAB-7Bww | 7B | 92.21 | 3.09 | Xgwm573 | 5.36 | 0.09 | O5 |
| SpsD_S1 | QSpsD_S1.NIAB-1Aa | 1A | 25.11 | 2.41 | Xwmc312 | 2.11 | 0.06 | O5 |
| RSps_S1 | QRSps_S1.NIAB-1Bc | 1B | 104.61 | 2.12 | Xwmc419 | −4.03 | 0.06 | B2 |
| Sps_S1 | QSps_S1.NIAB-1B.1d | 1B | 143.81 | 2.5 | Xwmc156 | 3.22 | 0.11 | O5 |
| Sps_S1 | QSps_S1.NIAB-1B.2 | 1B | 154.61 | 2.75 | Xwmc548 | 2.91 | 0.08 | O5 |
| Sps_S2 | QSps_S2.NIAB-3Ap | 3A | 56.11 | 2.5 | Xbarc45 | 2.63 | 0.1 | O5 |
| SpsD_S1 | QSpsD_S1.NIAB-3Aq | 3A | 68.51 | 3.6 | Xwmc50 | −2.6 | 0.1 | B2 |
| Sps_S1 | QSps_S1.NIAB-3B | 3B | 8.31 | 2 | Xgwm625 | 2.4 | 0.06 | O5 |
| SpsD_S1 | QSpsD_S1.NIAB-3Bu | 3B | 13.91 | 3.61 | Xgwm685 | 2.67 | 0.1 | O5 |
| RSps_S1 | QRSps_S1.NIAB-3Bw | 3B | 182.81 | 2.63 | Xgwm299 | 4.51 | 0.08 | O5 |
| Sps_S2 | QSps_S2.NIAB-4B | 4B | 155.91 | 2.94 | Xwmc428 | −3.29 | 0.09 | B2 |
| SpsD_S1 | QSpsD_S1.NIAB-5Add | 5A | 1.01 | 2.84 | Xgwm154 | 2.43 | 0.08 | O5 |
| Sps_S1 | QSps_S1.NIAB-5B.1kk | 5B | 13.41 | 2.3 | Xgwm540a | −3.34 | 0.07 | B2 |
| RSps_S1 | QRSps_S1.NIAB-5Bll | 5B | 132.21 | 4.41 | Xgwm1043 | 8.72 | 0.33 | O5 |
| RSps_S2 | QRSps_S2.NIAB-5B.2ll | 5B | 143.21 | 2.14 | Xgwm1043 | 3.9 | 0.07 | O5 |
| SpsD_S2 | QSpsD_S2.NIAB-5B | 5B | 218.31 | 3.22 | Xbarc232 | 2 | 0.11 | O5 |
| RSps_S2 | QRSps_S2.NIAB-5B.2oo | 5B | 232.71 | 2.83 | Xgwm1072 | 4.41 | 0.09 | O5 |
| Sps_S2 | QSps_S2.NIAB-5Boo | 5B | 233.11 | 2.27 | Xgwm1072 | −2.17 | 0.07 | B2 |
| Sps_S1 | QSps_S1.NIAB-5B.2 | 5B | 273.91 | 2.85 | Xbarc243 | 2.9 | 0.09 | O5 |
| SpsD_S2 | QSpsD_S2.NIAB-7Byy | 7B | 172.61 | 2.1 | Xwmc218 | −2.36 | 0.07 | B2 |
| RTkw_S1 | QRTkw_S1.NIAB-1Bc | 1B | 102.61 | 2.05 | Xwmc419 | −2.01 | 0.08 | B2 |
| TkwD_S1 | QTkwD_S1.NIAB-1B.1 | 1B | 221.11 | 2.26 | Xgwm268 | 1.56 | 0.09 | O5 |
| TkwD_S1 | QTkwD_S1.NIAB-1B.2 | 1B | 230.31 | 2.21 | Xgwm153 | 1.32 | 0.06 | O5 |
| Tkw_S1 | QTkw_S1.NIAB-2Af | 2A | 17.51 | 2.11 | Xgwm726 | 1.88 | 0.08 | O5 |
| RTkw_S2 | QRTkw_S2.NIAB-4B.1aa | 4B | 35.71 | 3.98 | Xgwm710b | −1.93 | 0.11 | B2 |
| Tkw_S2 | QTkw_S2.NIAB-4Baa | 4B | 35.71 | 2.74 | Xgwm710b | 1.98 | 0.09 | O5 |
| RTkw_S2 | QRTkw_S2.NIAB-4B.2bb | 4B | 42.51 | 4.24 | Xgwm1167 | −1.98 | 0.12 | B2 |
| RTkw_S1 | QRTkw_S1.NIAB-5Aff | 5A | 124.71 | 3.22 | Xgwm1236 | −2.51 | 0.12 | B2 |
| TkwD_S1 | QTkwD_S1.NIAB-5Aff | 5A | 126.71 | 2 | Xgwm1236 | −1.38 | 0.07 | B2 |
| TkwD_S2 | QTkwD_S2.NIAB-5Aii | 5A | 277.71 | 2.62 | Xgwm126 | −1.85 | 0.1 | B2 |
| RTkw_S2 | QRTkw_S2.NIAB-5B | 5B | 62.01 | 2.01 | Xbarc128 | −1.38 | 0.05 | B2 |
| Tkw_S1 | QTkw_S1.NIAB-6Brr | 6B | 144.11 | 2.55 | Xbarc178 | 1.86 | 0.08 | O5 |
| TkwD_S1 | QTkwD_S1.NIAB-6Bss | 6B | 160.61 | 2.74 | Xgwm889 | 1.61 | 0.09 | O5 |
| RTkw_S2 | QRTkw_S2.NIAB-7A | 7A | 113.41 | 2.14 | Xwmc603 | −1.35 | 0.05 | B2 |
| Tkw_S1 | QTkw_S1.NIAB-7Avv | 7A | 220.81 | 2.93 | Xgwm332 | 2.03 | 0.1 | O5 |
| RTkw_S1 | QRTkw_S1.NIAB-7B | 7B | 275.21 | 2.66 | Xbarc258 | −2.09 | 0.09 | B2 |
| Yield and Related Traits | ||||||||
| RBm_S1 | QRBm_S1.NIAB-3Ao | 3A | 16.61 | 2.32 | Xgwm757 | −1.29 | 0.06 | B2 |
| RBm_S1 | QRBm_S1.NIAB-3Bt | 3B | 11.91 | 2.06 | Xgwm285 | −1.22 | 0.05 | B2 |
| RBm_S2 | QRBm_S2.NIAB-3Bv | 3B | 88.11 | 2.85 | Xbarc344 | 3.88 | 0.1 | O5 |
| Bm_S2 | QBm_S2.NIAB-3Bv | 3B | 89.11 | 2.22 | Xbarc344 | −349.5 | 0.07 | B2 |
| BmD_S1 | QBmD_S1.NIAB-4B | 4B | 88.31 | 3.56 | Xgwm998 | 130.01 | 0.11 | O5 |
| RBm_S1 | QRBm_S1.NIAB-5Aee | 5A | 46.91 | 2.4 | Xgwm129 | −1.39 | 0.07 | B2 |
| Bm_S2 | QBm_S2.NIAB-5Boo | 5B | 232.71 | 2.65 | Xgwm1072 | −389.16 | 0.08 | B2 |
| RBm_S2 | QRBm_S2.NIAB-5Boo | 5B | 232.71 | 2.03 | Xgwm1072 | 3.04 | 0.07 | O5 |
| RBm_S1 | QRBm_S1.NIAB-5Bpp | 5B | 259.01 | 3.45 | Xgwm790 | −1.78 | 0.11 | B2 |
| RBm_S1 | QRBm_S1.NIAB-7A | 7A | 213.91 | 2.83 | Xbarc253 | −1.46 | 0.08 | B2 |
| RBm_S2 | QRBm_S2.NIAB-7A | 7A | 91.51 | 2.21 | Xbarc1025 | −3.38 | 0.08 | B2 |
| BmD_S2 | QBmD_S2.NIAB-7Auu | 7A | 52.81 | 2.73 | Xwmc405 | −150.39 | 0.13 | B2 |
| Bm_S1 | QBm_S1.NIAB-7B.1 | 7B | 137.51 | 3.06 | Xgwm540b | −558.27 | 0.1 | B2 |
| Bm_S1 | QBm_S1.NIAB-7B.2 | 7B | 164.41 | 3.16 | Xwmc476 | 640.83 | 0.13 | O5 |
| RBm_S2 | QRBm_S2.NIAB-7B.1yy | 7B | 172.61 | 3.55 | Xwmc218 | −4.24 | 0.12 | B2 |
| RBm_S2 | QRBm_S2.NIAB-7B.2 | 7B | 179.41 | 3.39 | Xgwm963b | −4.14 | 0.11 | B2 |
| RBm_S2 | QRBm_S2.NIAB-7B.3zz | 7B | 184.41 | 2.43 | Xgwm1085 | −3.75 | 0.08 | B2 |
| Bm_S1 | QBm_S1.NIAB-7B.3aaa | 7B | 218.21 | 2 | Xbarc276 | −334.54 | 0.07 | B2 |
| BmD_S2 | QBmD_S2.NIAB-7Baaa | 7B | 221.11 | 2 | Xbarc276 | −113.28 | 0.07 | B2 |
| RYd_S2 | QRYd_S2.NIAB-1Bb | 1B | 95.61 | 2.07 | Xgwm784 | 3.61 | 0.06 | O5 |
| YdD_S1 | QYdD_S1.NIAB-2Af | 2A | 26.01 | 2.65 | Xgwm726 | 37.77 | 0.09 | O5 |
| YdD_S2 | QYdD_S2.NIAB-2Ai | 2A | 124.61 | 2.51 | Xgwm895 | 34.89 | 0.08 | O5 |
| RYd_S1 | QRYd_S1.NIAB-2Ai | 2A | 125.21 | 2.44 | Xgwm895 | −4.07 | 0.07 | B2 |
| Yd_S2 | QYd_S2.NIAB-3Ap | 3A | 52.11 | 2.38 | Xbarc45 | 96.11 | 0.07 | O5 |
| RYd_S2 | QRYd_S2.NIAB-3Bx | 3B | 205.71 | 3.58 | Xgwm547 | −4.91 | 0.11 | B2 |
| Yd_S2 | QYd_S2.NIAB-3Bx | 3B | 205.71 | 2.2 | Xgwm547 | 91.54 | 0.06 | O5 |
| Yd_S1 | QYd_S1.NIAB-5Agg | 5A | 158.81 | 2.09 | Xbarc165 | 99.37 | 0.07 | O5 |
| RYd_S2 | QRYd_S2.NIAB-5Ahh | 5A | 193.01 | 4.04 | Xgwm1171b | −7.68 | 0.3 | B2 |
| YdD_S1 | QYdD_S1.NIAB-5Bll | 5B | 143.21 | 2.66 | Xgwm1043 | 38.45 | 0.09 | O5 |
| YdD_S1 | QYdD_S1.NIAB-6B | 6B | 9.91 | 2.29 | Xgwm1199 | −35.55 | 0.08 | B2 |
| RYd_S1 | QRYd_S1.NIAB-6B | 6B | 121.71 | 2.09 | Xgwm963a | −3.85 | 0.07 | B2 |
| Yd_S1 | QYd_S1.NIAB-7Baaa | 7B | 218.21 | 2.52 | Xbarc276 | −117.78 | 0.08 | B2 |
| YdD_S2 | QYdD_S2.NIAB-7Baaa | 7B | 219.11 | 3 | Xbarc276 | −39.23 | 0.09 | B2 |
| RHI_S2 | QRHI_S2.NIAB-1Bb | 1B | 93.11 | 2.22 | Xgwm784 | 9.7 | 0.07 | O5 |
| RHI_S2 | QRHI_S2.NIAB-2Bn | 2B | 108.81 | 2.4 | Xgwm47 | −10.1 | 0.08 | B2 |
| RHI_S2 | QRHI_S2.NIAB-3B.1v | 3B | 89.81 | 2.91 | Xbarc344 | −10.71 | 0.09 | B2 |
| HI_S2 | QHI_S2.NIAB-3Bx | 3B | 205.71 | 2.42 | Xgwm547 | 2.03 | 0.08 | O5 |
| RHI_S2 | QRHI_S2.NIAB-3B.2x | 3B | 205.71 | 2.8 | Xgwm547 | −10.17 | 0.09 | B2 |
| HID_S2 | QHID_S2.NIAB-4B | 4B | 130.61 | 2.5 | Xbarc60 | 2.02 | 0.08 | O5 |
| HID_S1 | QHID_S1.NIAB-4Bcc | 4B | 151.21 | 2.59 | Xgwm940a | 3.31 | 0.09 | O5 |
| HI_S1 | QHI_S1.NIAB-5B | 5B | 228.61 | 2.77 | Xwmc28 | 3.19 | 0.1 | O5 |
| HID_S2 | QHID_S2.NIAB-5Bll | 5B | 143.21 | 3.3 | Xgwm1043 | 2.24 | 0.11 | O5 |
| HID_S2 | QHID_S2.NIAB-7A | 7A | 108.61 | 2.42 | Xbarc108 | 1.8 | 0.07 | O5 |
| RHI_S2 | QRHI_S2.NIAB-7Bzz | 7B | 184.41 | 2.91 | Xgwm1085 | 11.25 | 0.09 | O5 |
| HI_S1 | QHI_S1.NIAB-7B | 7B | 336.01 | 2.42 | Xwmc273 | 2.95 | 0.08 | O5 |
| Stress Indices | ||||||||
| STI_S2 | QSTI_S2.NIAB-4A.1 | 4A | 44.51 | 2.73 | Xbarc246 | 0.06 | 0.09 | O5 |
| STI_S2 | QSTI_S2.NIAB-4A.2 | 4A | 100.81 | 2.13 | Xgwm1234 | −0.06 | 0.06 | B2 |
| STI_S1 | QSIT_S1.NIAB-6Bss | 6B | 159.91 | 2.14 | Xgwm889 | 0.06 | 0.07 | O5 |
| STI_S2 | QSTI_S2.NIAB-7Att | 7A | 0.01 | 3.36 | Xgwm1171a | −0.07 | 0.11 | B2 |
| MP_S1 | QMP_S1.NIAB-1B | 1B | 72.01 | 2.28 | Xgwm762 | 87.36 | 0.08 | O5 |
| MP_S2 | QMP_S2.NIAB-1B | 1B | 116.81 | 2.21 | Xbarc207 | −61.49 | 0.08 | B2 |
| MP_S2 | QMP_S2.NIAB-2Aj | 2A | 158.21 | 2.04 | Xgwm1256 | 97.14 | 0.22 | O5 |
| MP_S2 | QMP_S2.NIAB-3B.1w | 3B | 194.81 | 2.87 | Xgwm299 | 82.74 | 0.16 | O5 |
| MP_S2 | QMP_S2.NIAB-3B.2x | 3B | 205.71 | 3.72 | Xgwm547 | 75.53 | 0.13 | O5 |
| MP_S1 | QMP_S1.NIAB-5Agg | 5A | 158.81 | 2.4 | Xbarc165 | 63.78 | 0.08 | O5 |
| ST_S2 | QST_S2.NIAB-3Bw | 3B | 192.81 | 2.22 | Xgwm299 | 99.6 | 0.11 | O5 |
| ST_S1 | QST_S1.NIAB-5Agg | 5A | 165.81 | 2.12 | Xbarc165 | 112.92 | 0.11 | O5 |
| ST_S2 | QST_S2.NIAB-5Ahh | 5A | 179.81 | 3.43 | Xgwm1171b | 116.02 | 0.13 | O5 |
| DRI_S2 | QDRI_S2.NIAB-2Bm | 2B | 52.21 | 2.02 | Xgwm972 | 59.7 | 0.06 | O5 |
| DRI_S2 | QDRI_S2.NIAB-4A | 4A | 64.31 | 2.47 | Xbarc343 | 82.63 | 0.1 | O5 |
| DRI_S2 | QDRI_S2.NIAB-5Ahh | 5A | 186.01 | 2.59 | Xgwm1171b | −81.06 | 0.11 | B2 |
| DRI_S1 | QDRI_S1.NIAB-5Ahh | 5A | 188.01 | 4.63 | Xgwm1171b | −111.01 | 0.26 | B2 |
| DRI_S1 | QDRI_S1.NIAB-5Boo | 5B | 232.71 | 2.44 | Xgwm1072 | 63.65 | 0.08 | O5 |
| Trait | Xgwm895, 2A | Xbarc276, 7B | Combination | ||||
|---|---|---|---|---|---|---|---|
| A allele | B allele | A allele | B allele | AA | BB | AB | |
| Yd_S1 | 5.5 | −9.31 | 5.5 | 6.6 | −4 | −1.89 | 2.16 |
| YdD_S1 | 0.18 | −1.6 | 0.18 | 0.66 | 0.61 | −1.83 | −0.15 |
| RYd_S1 | −6.65 | 6.82 | −6.65 | −4.66 | 1.56 | 2.26 | −14.1 |
| Yd_S2 | 6.16 | −9.35 | 6.16 | 2.57 | 0.92 | −10.78 | 10.2 |
| YdD_S2 | 5.27 | −8.4 | 5.27 | 4.39 | 22.98 | −10.43 | 11.3 |
| RYd_S2 | −1.59 | 1.85 | −1.59 | 2.61 | −3.04 | 4.74 | −0.39 |
| Traits | Control | Drought | Relative | Time | |
|---|---|---|---|---|---|
| Agronomic Traits | |||||
| 1 | Germination | Gr_S1, Gr_S2 | GrD_S1, GrD_S2 | RGr_S1, RGr_S2 | 24th Nov |
| 2 | Heading date | Hd_S1, Hd_S2 | HdD_S1, HdD_S2 | RHd_S1, RHd_S2 | 50% spike emerg |
| 3 | Plant height | Ph_S1, Ph_S2 | PhD_S1, PhD_S2 | RPh_S1, RPh_S2 | Before harvest |
| Physiological Traits | |||||
| 4 | Transpiration rate | Tr_S1, Tr_S2 | TrD_S1, TrD_S2 | RTr_S1, RTr_S1 | 7th Feb |
| 5 | Stomatal conductance | Sc_S1, Sc_S2 | ScD_S1, ScD_S2 | RSc_S1, RSc_S2 | 7th Feb |
| 6 | Photosynthetic rate | Phr_S1, Phr_S2 | PhrD_S1, PhrD_S2 | RPhr_S1, RPhr_S2 | 7th Feb |
| 7 | Water use efficiency | Wue_S1, Wue_S2 | WueD_S1, WueD_S2 | RWue_S1, RWue_S2 | 7th Feb |
| Spike-Related Traits | |||||
| 8 | Spike length | Sl_S1, Sl_S2 | SlD_S1, SlD_S2 | RSl_S1, RSl_S2 | After harvest |
| 9 | Spike weight | Sw_S1, Sw_S2 | SwD_S1, SwD_S2 | RSw_S1, RSw_S2 | After harvest |
| 10 | Seeds per spike | Sps_S1, Sps_S2 | SpsD_S1, SpsD_S2 | RSps_S1, RSps_S2 | After harvest |
| 11 | Thousand kernel weight | Tkw_S1, Tkw_S2 | TkwD_S1, TkwD_S2 | RTkw_S1, RTkw_S2 | After harvest |
| Traits | Control | Drought | Time | ||
| Yield and Related Traits | |||||
| 12 | Biomass | Bm_S1, Bm_S2 | BmD_S1, BmD_S2 | After harvest | |
| 13 | Yield | Yd_S1, Yd_S2 | YdD_S1, YdD_S2 | After harvest | |
| 14 | Harvest Index | HI_S1, HI_S2 | HID_S1, HID_S2 | After harvest | |
| Index | Abbrev. | Formula | Time | ||
| Stress Indices | |||||
| 15 | Stress Tolerance Index (STI) | STI_S1, STI_S2 | After harvest | ||
| 16 | Mean Productivity (MP) | MP_S1, MP_S2 | After harvest | ||
| 17 | Stress Tolerance (ST) | ST_S1, ST_S2 | After harvest | ||
| 18 | Stress Susceptibility Index (SSI) | SSI_S1, SSI_S2 | / | After harvest | |
| 19 | Drought Resistance Index (DRI) | DRI_S1, DR_S2 | After harvest | ||
| where Ys = yield under stress, = mean yield under stress, Yp = yield under control and = mean yield under control | |||||
© 2020 by the authors. Licensee MDPI, Basel, Switzerland. This article is an open access article distributed under the terms and conditions of the Creative Commons Attribution (CC BY) license (http://creativecommons.org/licenses/by/4.0/).
Share and Cite
Rehman Arif, M.A.; Attaria, F.; Shokat, S.; Akram, S.; Waheed, M.Q.; Arif, A.; Börner, A. Mapping of QTLs Associated with Yield and Yield Related Traits in Durum Wheat (Triticum durum Desf.) Under Irrigated and Drought Conditions. Int. J. Mol. Sci. 2020, 21, 2372. https://doi.org/10.3390/ijms21072372
Rehman Arif MA, Attaria F, Shokat S, Akram S, Waheed MQ, Arif A, Börner A. Mapping of QTLs Associated with Yield and Yield Related Traits in Durum Wheat (Triticum durum Desf.) Under Irrigated and Drought Conditions. International Journal of Molecular Sciences. 2020; 21(7):2372. https://doi.org/10.3390/ijms21072372
Chicago/Turabian StyleRehman Arif, Mian Abdur, Fauzia Attaria, Sajid Shokat, Saba Akram, Muhammad Qandeel Waheed, Anjuman Arif, and Andreas Börner. 2020. "Mapping of QTLs Associated with Yield and Yield Related Traits in Durum Wheat (Triticum durum Desf.) Under Irrigated and Drought Conditions" International Journal of Molecular Sciences 21, no. 7: 2372. https://doi.org/10.3390/ijms21072372