Marek’s Disease Virus Infection Induced Mitochondria Changes in Chickens


1
Institute of Animal Husbandry and Veterinary Medicine, Beijing Academy of Agriculture and Forestry Sciences, Beijing 100094, China
2
Department of Animal and Avian Sciences, University of Maryland, College Park, MD 20740, USA
3
USDA, Agriculture Research Service, Avian Disease and Oncology Laboratory, East Lansing, MI 48823, USA
*
Author to whom correspondence should be addressed.
Int. J. Mol. Sci. 2019, 20(13), 3150; https://doi.org/10.3390/ijms20133150
Submission received: 23 May 2019
/
Revised: 24 June 2019
/
Accepted: 26 June 2019
/
Published: 27 June 2019
(This article belongs to the Special Issue Exploring the Genotype–Phenotype Map: Regulatory Pathways)
Abstract
:Mitochondria are crucial cellular organelles in eukaryotes and participate in many cell processes including immune response, growth development, and tumorigenesis. Marek’s disease (MD), caused by an avian alpha-herpesvirus Marek’s disease virus (MDV), is characterized with lymphomas and immunosuppression. In this research, we hypothesize that mitochondria may play roles in response to MDV infection. To test it, mitochondrial DNA (mtDNA) abundance and gene expression in immune organs were examined in two well-defined and highly inbred lines of chickens, the MD-susceptible line 72 and the MD-resistant line 63. We found that mitochondrial DNA contents decreased significantly at the transformation phase in spleen of the MD-susceptible line 72 birds in contrast to the MD-resistant line 63. The mtDNA-genes and the nucleus-genes relevant to mtDNA maintenance and transcription, however, were significantly up-regulated. Interestingly, we found that POLG2 might play a potential role that led to the imbalance of mtDNA copy number and gene expression alteration. MDV infection induced imbalance of mitochondrial contents and gene expression, demonstrating the indispensability of mitochondria in virus-induced cell transformation and subsequent lymphoma formation, such as MD development in chicken. This is the first report on relationship between virus infection and mitochondria in chicken, which provides important insights into the understanding on pathogenesis and tumorigenesis due to viral infection.
1. Introduction
Mitochondria, the well-known cytoplasmic organelles for energy making in eukaryotic cells, play important roles in many cell processes, such as small molecules metabolism [1], ion homeostasis [2], immune response [3,4], cell proliferation, and apoptosis [5,6]. Mitochondrion is very special because it contains its own genome (mtDNA), which is a circular molecule and encodes a total of 13 proteins that are all core components of oxidative phosphorylation. There may be hundreds of mitochondria in one cell and one mitochondrion may have multiple copies of mtDNA. It is speculated that the copy number of mtDNA plays a part in mitochondrial biogenesis and regulates mitochondrial functions. Diploid cells may contain a range of 1–10,000 mtDNA molecules depending on cell types and can change over time, where cells with greater energy needs usually have more mitochondria or mtDNA than cells with less needs [7,8]. The change in mtDNA contents is reported to be a useful clinical biomarker for disease diagnose [9,10].
Mitochondria are very essential in immune response because they not only involve in the immune and inflammation pathways, but also regulate the activation, proliferation, and function of leukocytes, including macrophages, B and T cells [11,12,13]. Due to the multifunctional characteristics, mitochondria usually serve as the targets of pathogens including viruses [14]. Viral infection can either activate or inhibit mitochondrial functions, alter mitochondrial contents, and influence gene expressions [15]. In return, mtDNA contents often negatively correlate with immune pathways [16] and subsequently influence virus infection and proliferation. Moreover, depletion and damages of mtDNA can lead to inflammation and apoptosis, and ultimately trick oncogenesis in host.
Marek’s disease (MD) is a highly infectious oncogenic disease of chicken, caused by Marek’s disease virus (MDV), an alpha-herpesvirus. MDV is a DNA herpesvirus that integrates into the host genome upon infection [17,18,19], and is characterized by T cell transformation and fatal lymphomas in visceral organs [20,21]. Nowadays, we have known that genetic and epigenetic background of host have significant effects on MD incidence [22,23,24]. Two highly inbred lines of chickens have been developed for more than half a century at the Avian Disease and Oncology Laboratory (ADOL) [25]. One of the inbred lines, the line 63, was selected for resistance to tumors, while the other, the line 72, was selected for susceptibility, which provides valuable and unique models for immunity and tumorigenesis researches. Recently, a long intergenic non-coding RNA, GALMD3, was identified being highly expressed post MDV-infection, which might cause mitochondrial dysfunction and lead to MD in chickens [26]. Although a great amount of efforts has been made for deciphering the virus infection and the host response, the link between MDV infection and mitochondria dynamics remains unclear.
To fill the gap about the function and regulation of mitochondria in MD, this study was designed to examine mitochondrial DNA copy number variation and changes in mitochondrial as well as mitochondria-related nuclear gene expression in three immune organs (bursa of Fabricius, thymus, and spleen). To our knowledge, this is the very first study aimed to explore mitochondrial role in viral infection in chickens.
2. Results
2.1. Mitochondrial DNA Copy Number Variation
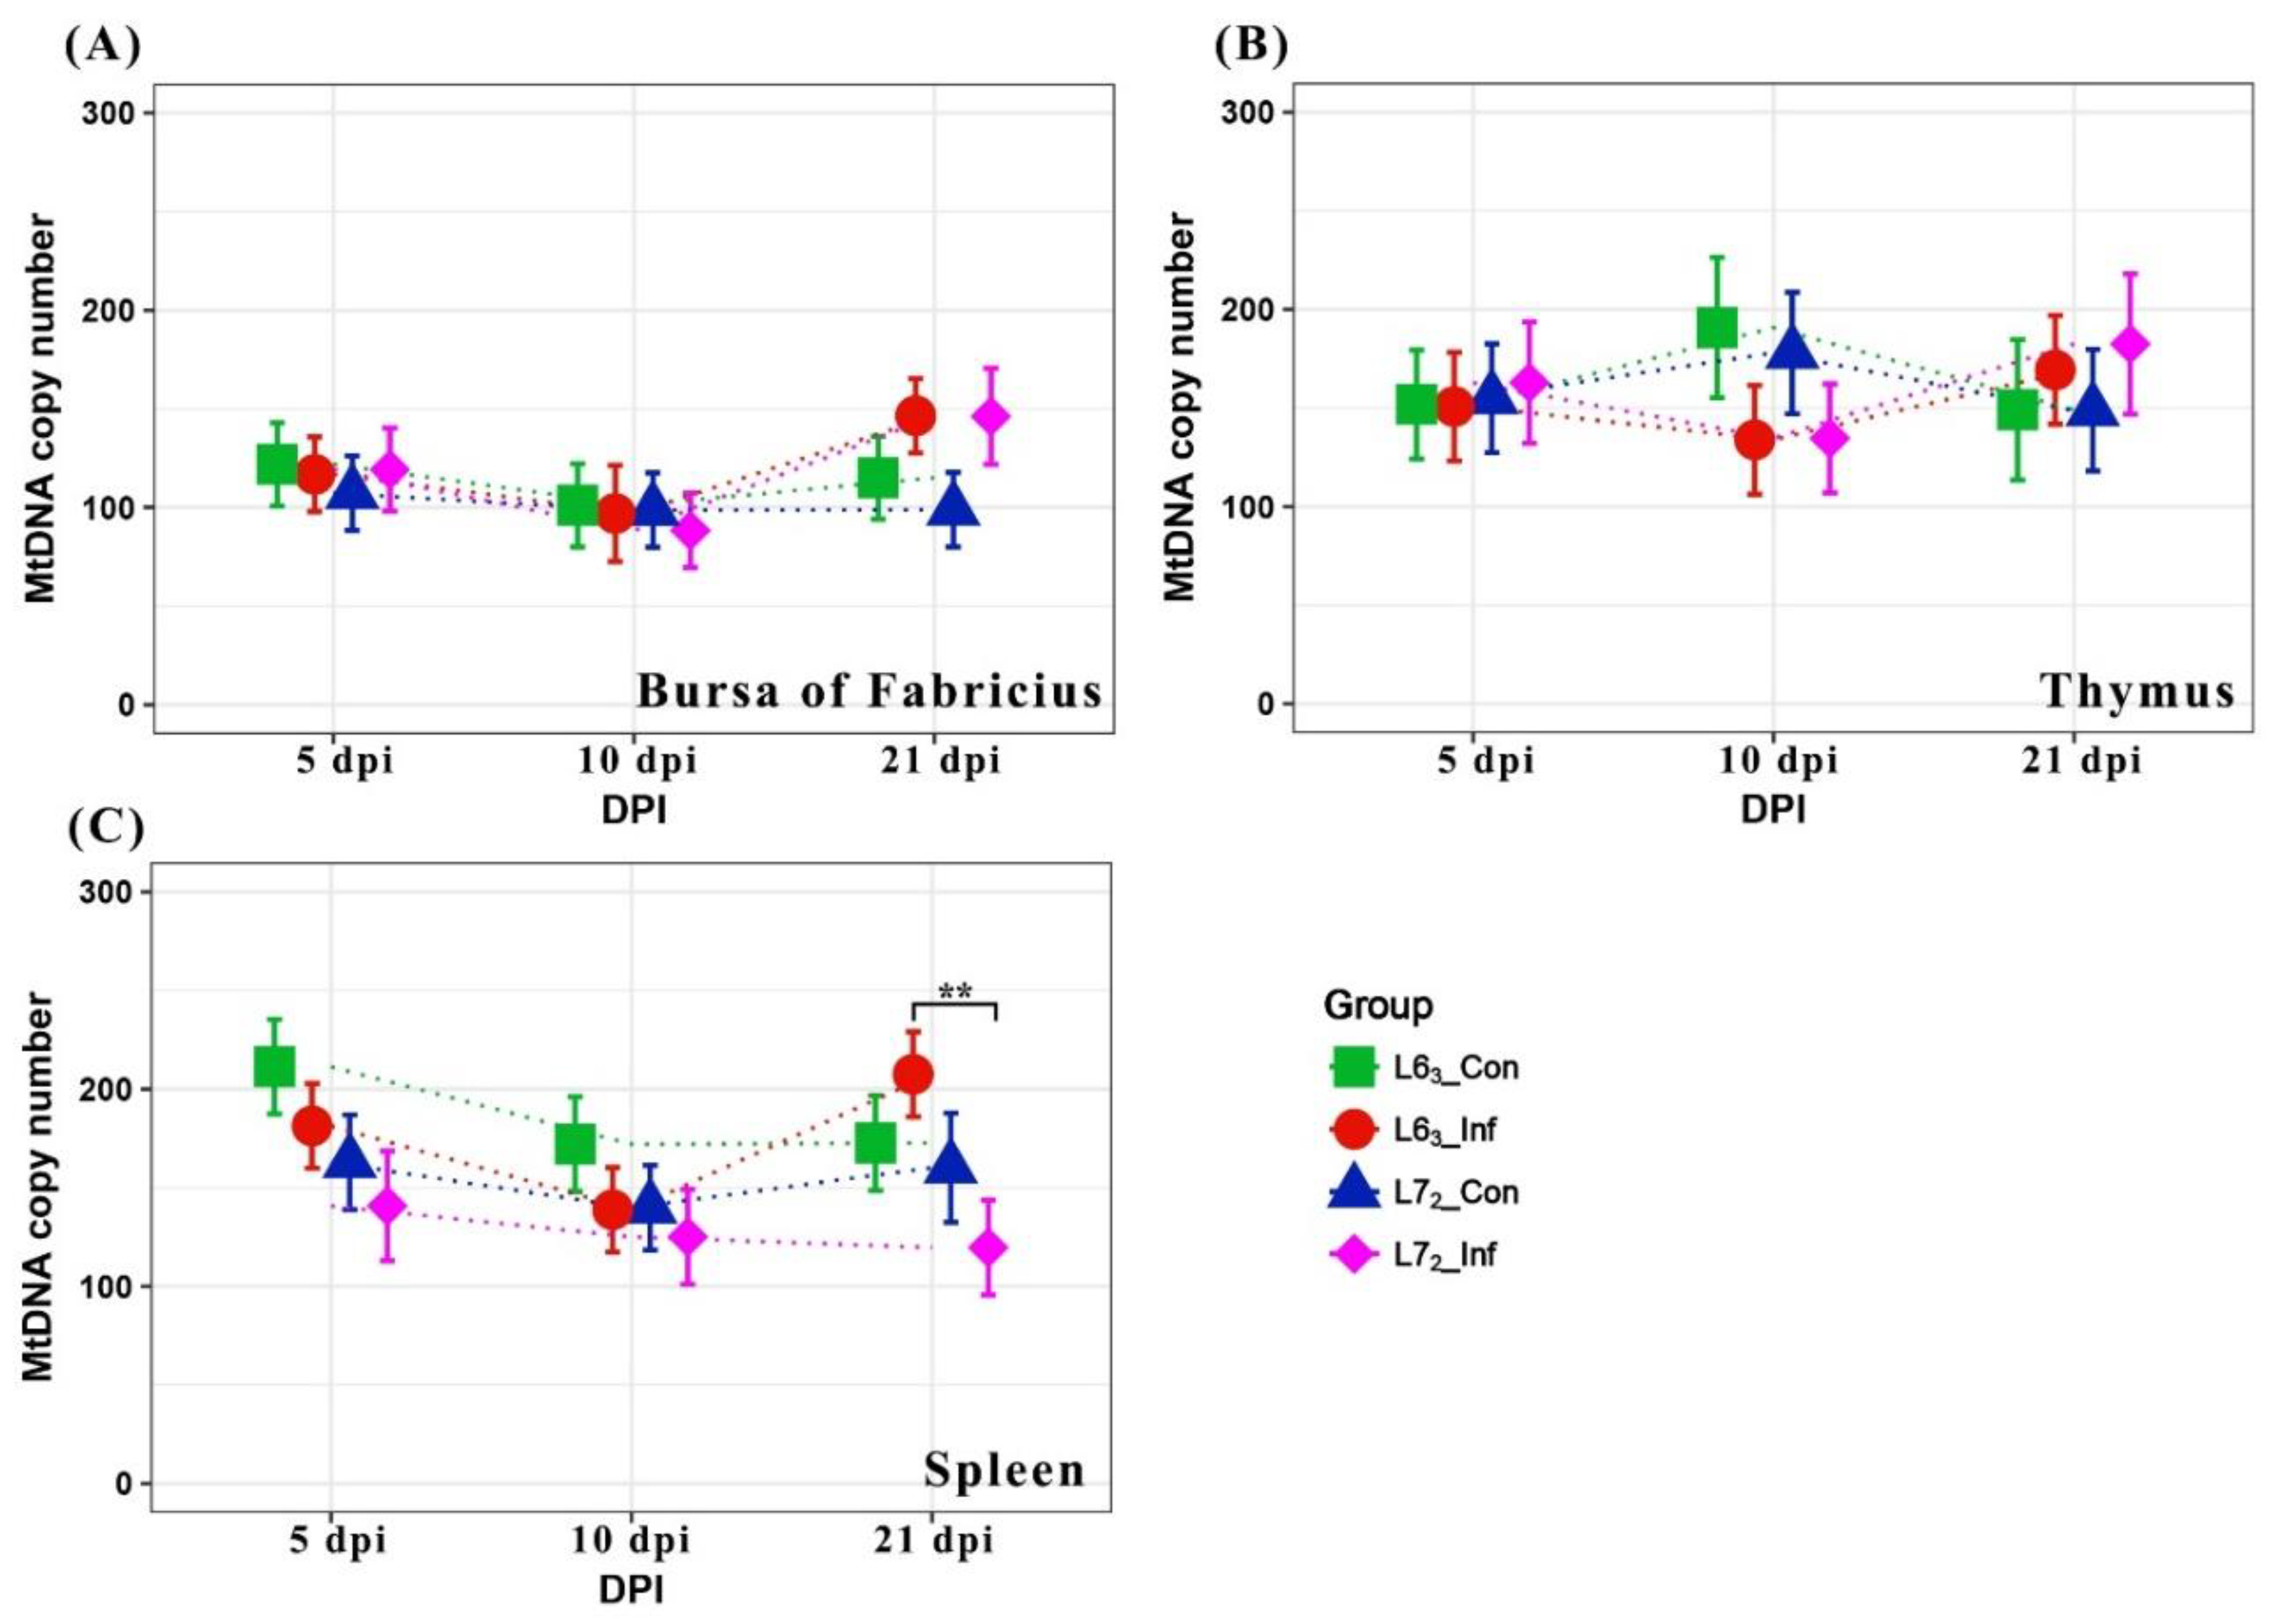
The relative content of mtDNA was determined using qPCR analysis of three mitochondrial genes ND2, ND3, and COX1, which encode the NADH dehydrogenase subunit 2 and 3, and the cytochrome C oxidase subunit 1, respectively. The nuclear gene β-actin was used as a control. The standard curves showed that the three mitochondrial genes and the β-actin control had similar amplification efficiencies, with ND2 and β-actin having the values of 0.90 and 0.95, respectively (Figure S1). Comparison analyses of mtDNA were calculated separately for the three lymphoid organs. The copies of mtDNA per cell predicted with the three mitochondrial genes against the control β-actin showed a relative order of ND3>COX1>ND2, though mtDNA variations generated from the three mitochondrial genes exhibited similar trends (see Figure 1 and Figure S2).
The mtDNA copy numbers based on the ND2 gene over three time-points in the three lymphoid organs are demonstrated in Figure 1. In bursa, the copy numbers of mtDNA remained relatively constant over time in all groups and no difference was observed between the two lines (p > 0.05). Likewise, no statistically significant changes in mtDNA contents were detected in thymus (p > 0.05). Nevertheless, a significant difference was observed between the two MDV-infected groups at 21 dpi (p ≤ 0.01) in spleen, due to a continuously decrease of mtDNA contents in the susceptible birds and an increasing recovery in the resistant birds. The findings implied that 21 dpi was a very important stage for the mitochondria changes after MDV infection. Hence, transcriptome sequencing at this time-point was carried out to further explore the underlying mechanisms.
2.2. The Expressions of Mitochondrial DNA-coding Genes
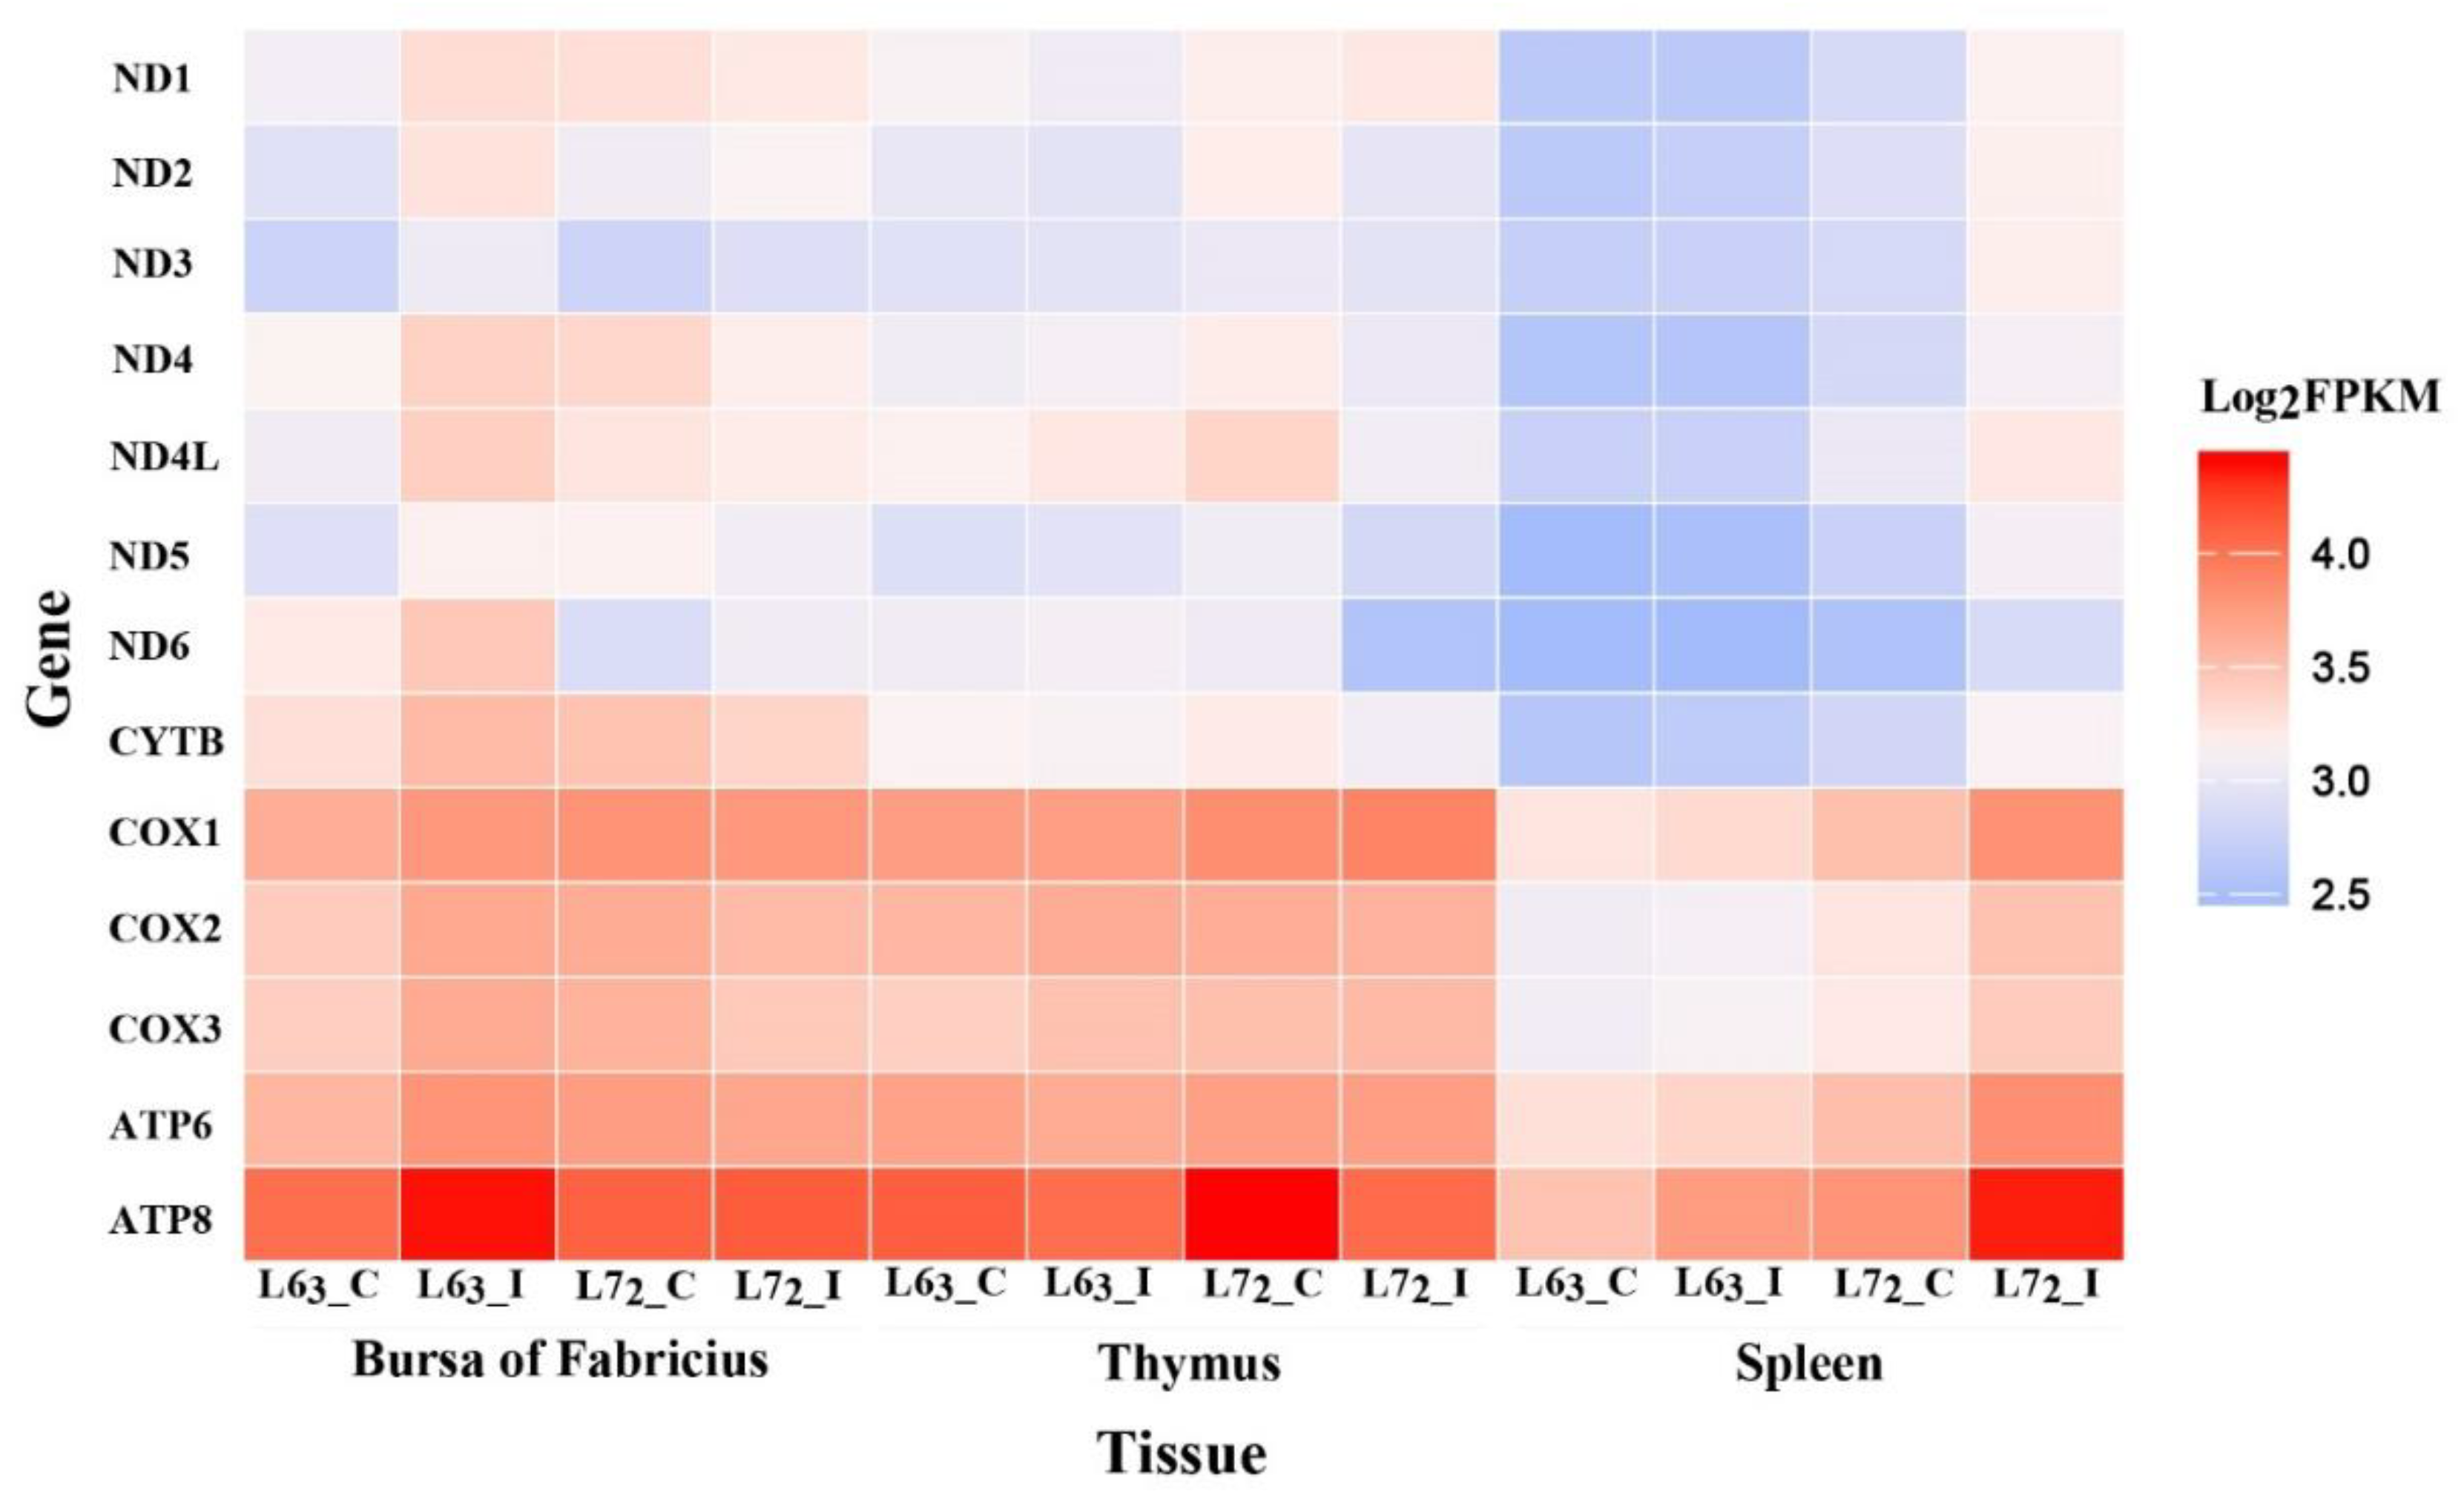
To ascertain whether the mitochondrial gene expression was also altered in MD, the 13 mtDNA protein coding genes were examined using RNA sequencing data (Figure 2). Two of the 13 genes, ATP6 and ATP8 that encode subunits of the Complex V, showed the higher expression levels, while the genes, ND1, ND2, ND3, ND4, ND4L, ND5, and ND6 that encode the NADH dehydrogenase (Complex I) subunits, showed the lower expressions. We also found gene expressions were obviously lower in spleen in contrast to those of bursa and thymus. Additionally, the expression levels of the mtDNA genes were noticeably higher in spleen of the line 72 MDV challenged birds than those of the other three groups.
Specific mitochondrial genes with differential expression levels in different comparisons are given in Table 1. After MDV infection, seven and ten out of the 13 mitochondrial genes were up-regulated in spleen of resistant and susceptible lines, respectively. In line 63, the expressions of ND1, ND2, ND4, ND5, COX1, COX2, and CYTB were significantly up-regulated with fold changes all between 0 and 1. Besides, ND3, ND6 and ATP6 were also expressed significantly higher after MDV infection in the line 72 birds than in the controls. All of the ten up-regulated genes in line 72 after infection showed big fold changes. Moreover, the expression levels of eight genes in line 72, such as ND1, ND2, ND3, ND4, ND5, CYTB, COX2, and ATP6, were higher than those in line 63 (fold changes > 1).
However, no mitochondrial genes changed in bursa of both lines after MDV infection in contrast to the non-infected controls. Uniquely, ND6 was the only down-regulated gene by MDV challenge in thymus of the line 72 birds.
2.3. Differentially Expressed MitoProteome Nuclear Genes
By comparing with the known human and mouse MitoProteome genes (the mitochondrial protein encoding genes), 873 nuclear genes were identified in the chicken genome. Those were further investigated based on the RNA sequencing data and differentially expressed gene (DEG) analysis results performed between lines and treatments.
2.3.1. Mitochondria-Related Nuclear DEGs Induced by MDV
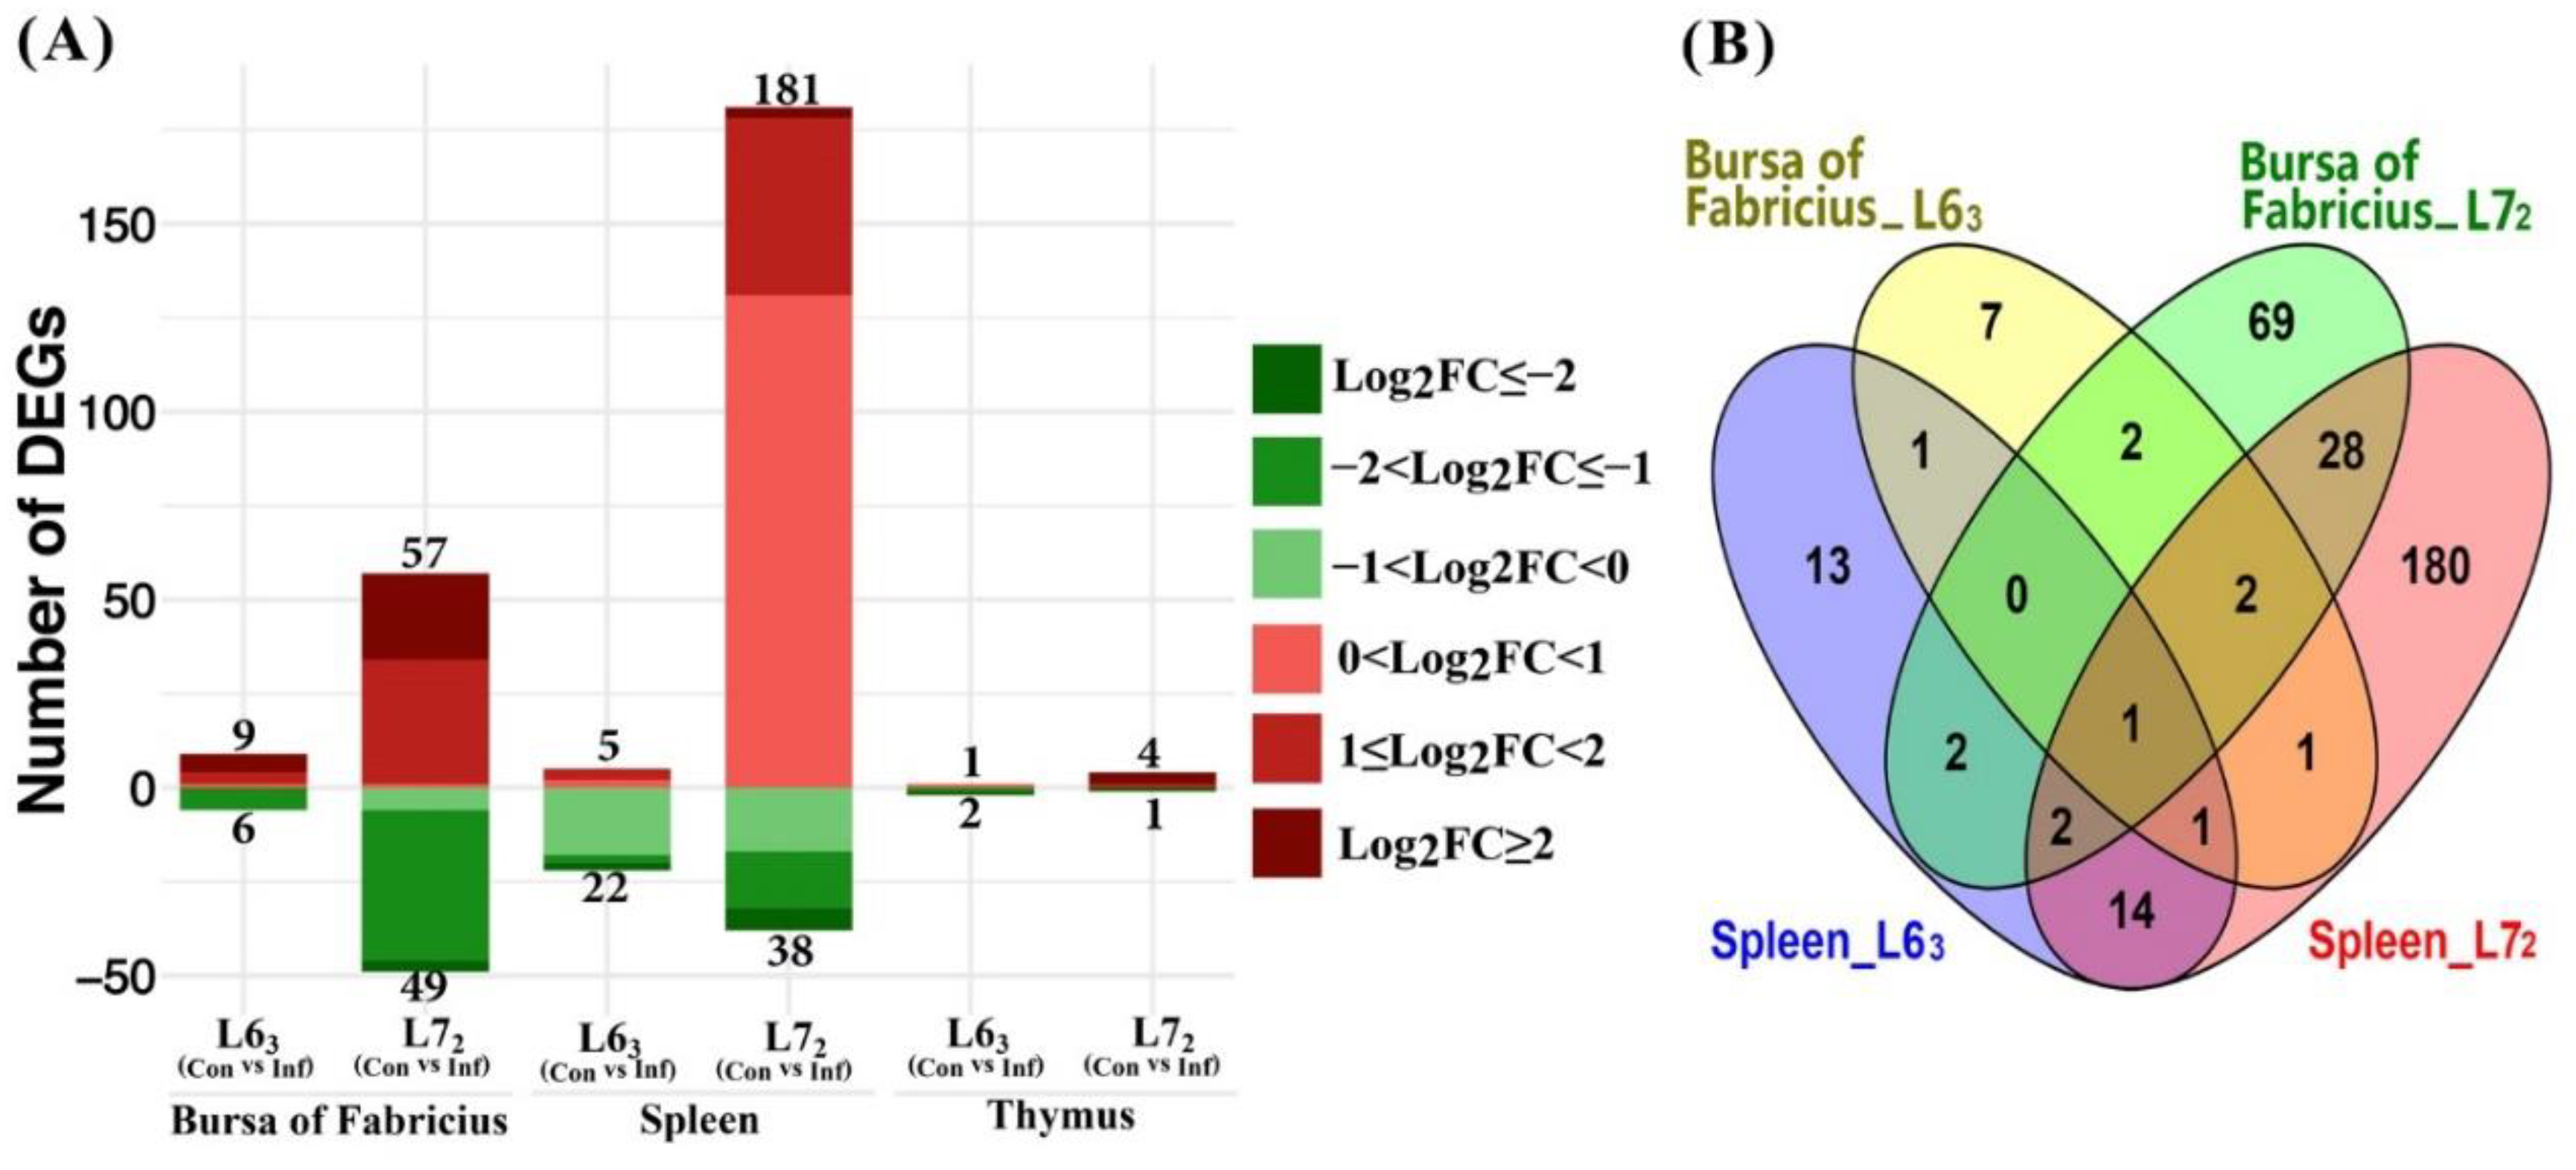
The numbers of differentially expressed nucleus-encoded MitoProteome genes cross the three lymphoid organ tissues between the two lines post MDV challenge are shown in Figure 3. The contrast between MDV-infection and non-infection indicated that MDV challenge induced significantly more DEGs in line 72 than in line 63, and in the line 72 birds most of the DEGs were up-regulated, especially in spleen (Figure 3A). Compared to non-infected control birds, only 27 genes changed in spleen of the line 63 birds, while 219 genes were differentially expressed in spleen of the line 72 birds, which consisted of a quarter (219/873) of all the studied chicken MitoProteome nuclear genes. Among the 219 DEGs observed in spleen of line 72, 181 genes were up-regulated and 38 were down-regulated. In contrast, the number of genes in thymus that changed following infection was very small. Only three DEGs were identified in thymus of the line 63 birds, with the gene AMN being up-regulated and TDRKH and SUOX being down-regulated. Meanwhile, four genes (STOM, OSBPL1A, ACOT9 and C15orf48) were up-regulated and only one gene TDRKH was down-regulated in thymus of the line 72 birds (see Table S1). Interestingly, the TDRKH gene was down-regulated by a fold change lower than –2 in both lines. Similarly, the number of significantly changed genes in bursa of line 63 and 72 also had a distinct difference, with the DEG numbers being 15 and 106, respectively.
Since there were only a small number of DEGs identified in thymus, DEG comparison was only performed between the bursa and the spleen (Figure 3B). There were five DEGs in common between the two lines, while 10 and 101 DEGs exclusively between line 63 and line 72 in bursa, respectively. The five common DEGs were TYSND1, ABCB8, MRPL17, MSRB3, and PDK4. The first three DEGs were up-regulated and the last two were down-regulated in line 63, while all were up-regulated in line 72 (Table S1). However, there were 11 DEGs in common between lines 63 and 72, with 16 and 211 DEGs being exclusively identified in the line 63 and line 72, respectively, in spleen tissues. The 11 common nuclear DEGs were ABAT, COX11, MSRB3, FKBP10, ME3, CYP11A1, SLC25A30, BCL2, ACSS3, AIFM2, and PMP22. Additionally, we noticed that there were 3 and 24 genes in common between bursa and spleen tissues in the control and infection comparison subsets (L63 vs. L72), respectively. Of note, MSRB3 was the only gene dysregulated in both bursa and spleen upon MDV challenge in both lines with opposite directions in the two tissues. In bursa the expression of MSRB3 was up-regulated, while in spleen it was down-regulated.
2.3.2. Mitochondria-Related Nuclear DEGs between Two Chicken Lines
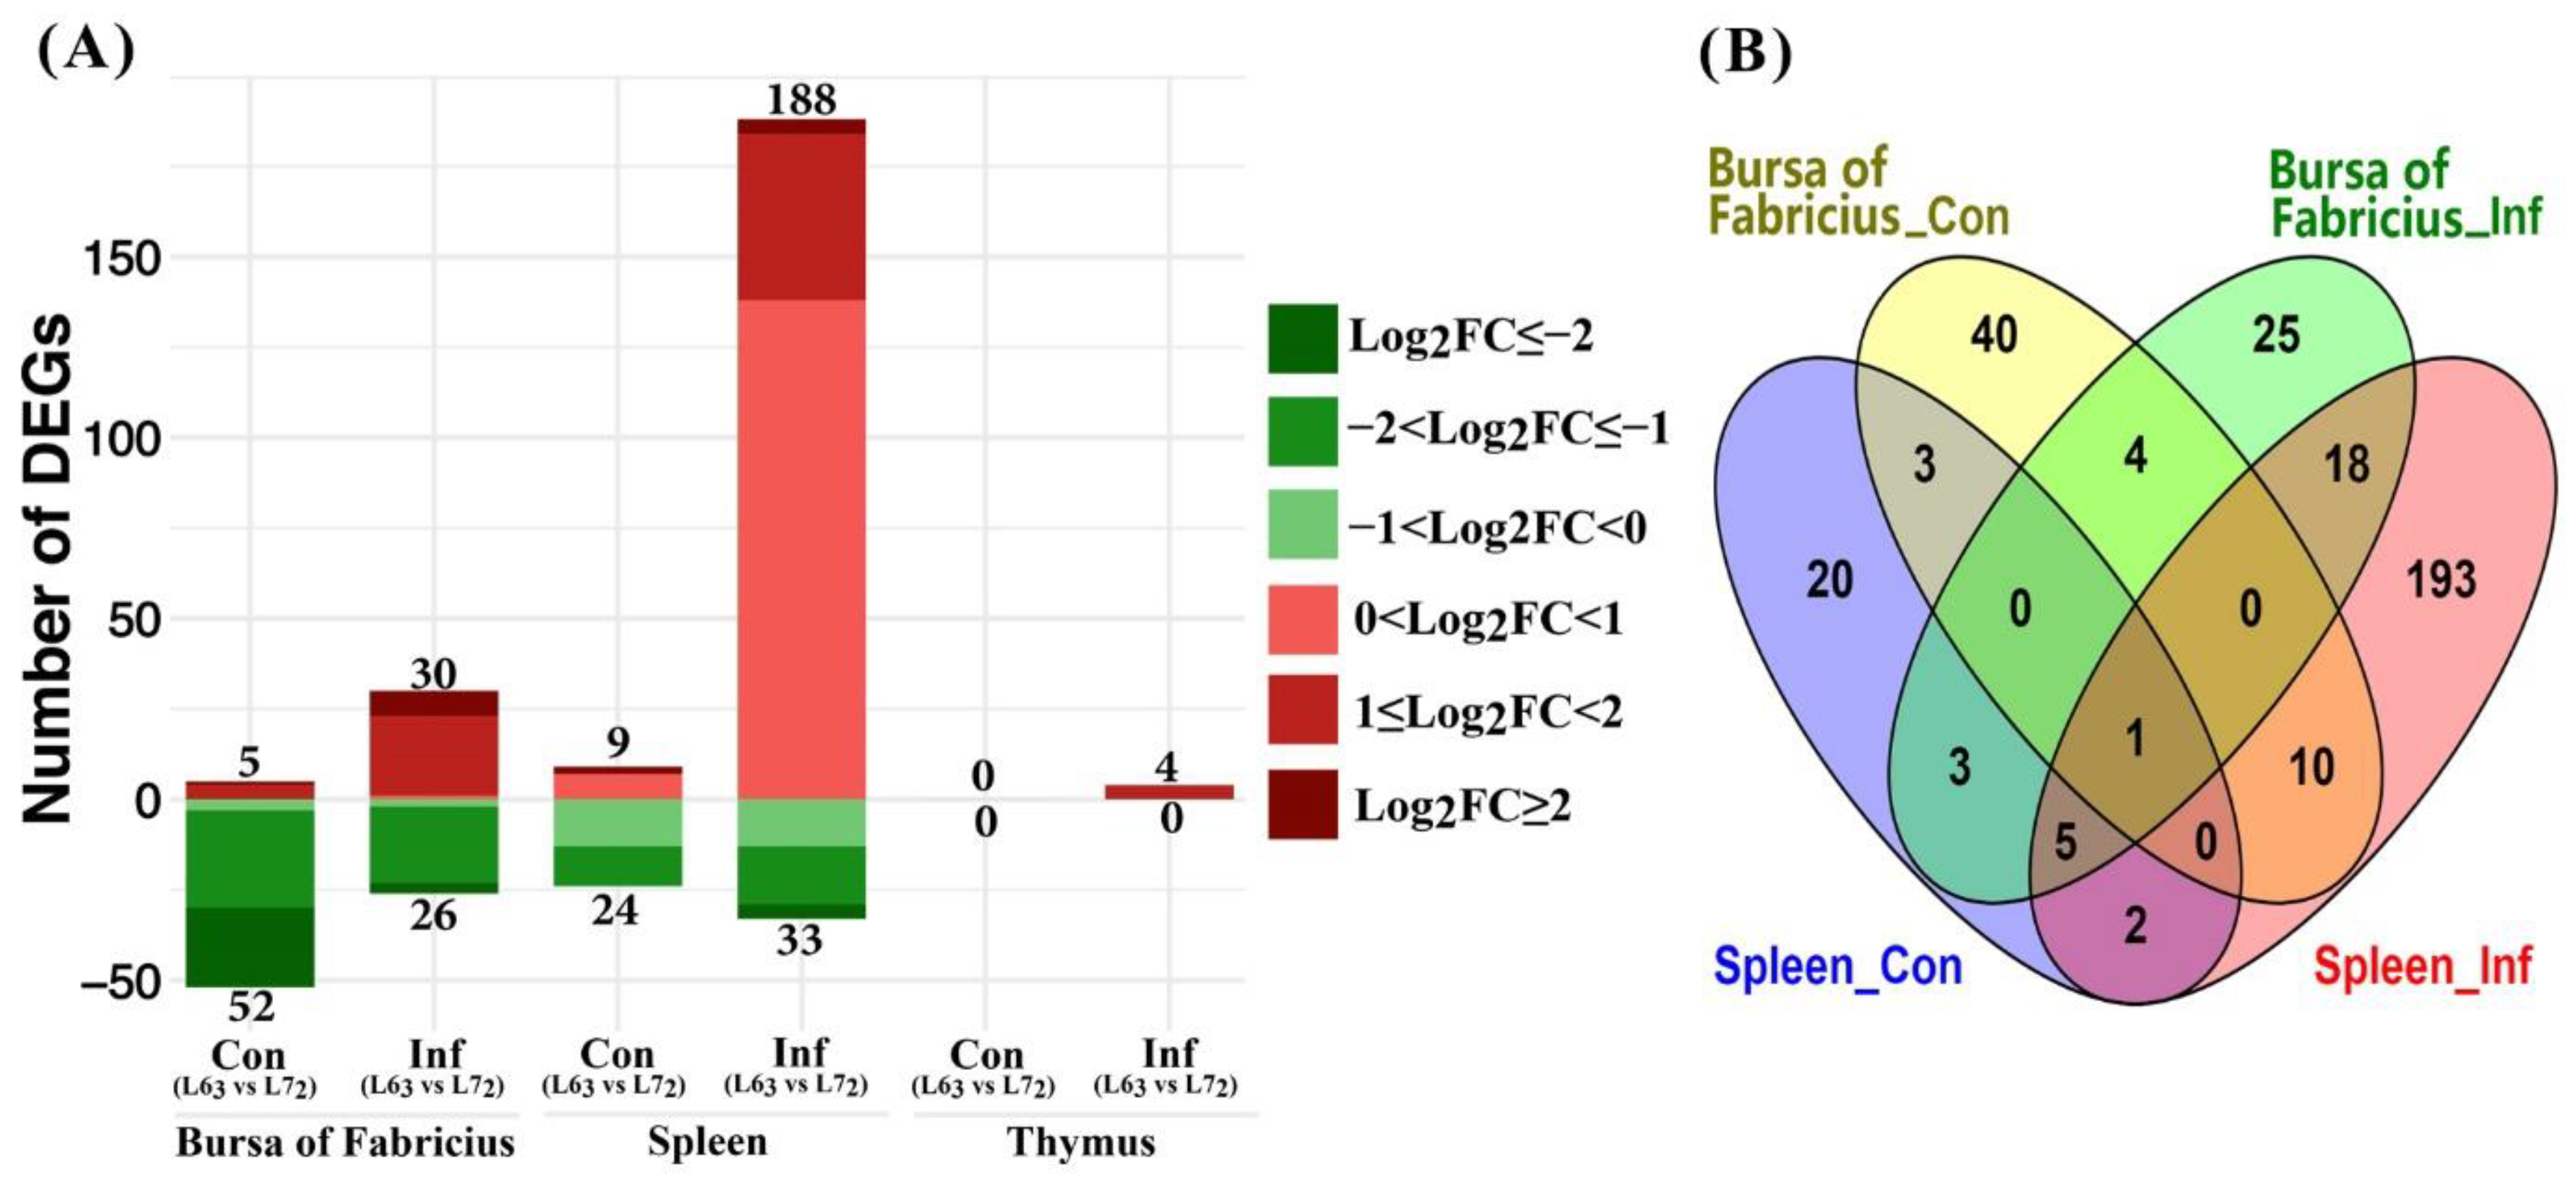
The contrasts between the two chicken lines (Figure 4A) showed that there was a total of 221 DEGs in spleen of the line 72 challenged birds compared to line 63 ones; 188 of those DEGs were up-regulated. In contrast, more DEGs (24 out of 33) were expressed at lower levels in spleen of the line 72 control birds than the line 63 birds. In spleen, there were eight DEGs in common between the line comparisons (L63 vs. L72) of MDV challenge and control groups (Figure 4B). These genes were CMPK2, HK2, C15orf48, HEBP1, VDAC1, STOML1, ACSS3, and GLDC. Among which, the CMPK2 gene in line 72 was over 2-fold up-regulated.
In bursa tissues, 56 and 57 DEGs were identified between the two lines of the MDV challenge groups and the control groups, respectively. Relatively, more DEGs were up-regulated post MDV challenge in line 72 birds in contrast to the line 63 birds. Again, more DEGs from the comparison of control groups expressed at lower levels in the line 72 than line 63. Five genes, SCCPDH, LAP3, CHCHD10, STOML1, and TDRKH, were in common between the MDV challenged and control groups of bursa tissues.
No DEG was identified in thymus between the lines of control groups. Four DEGs, STOM, STOML1, ACOT9, and C15orf48, were identified between the lines in the MDV challenged groups of thymus tissues, which were all up-regulated in expression in the line 72 birds in contrast to the line 63. Additionally, we compared DEGs between the bursa and spleen tissues and noticed that 24 DEGs were in common between the two tissues in the infected groups, while only three were, in the control groups.
2.3.3. Canonical Pathways Prediction
To better understand the biological functions of those differentially expressed mitochondria-relevant nuclear genes, DEGs from the bursa and spleen within the four comparisons were submitted to Ingenuity Pathway Analysis (IPA). Because the DEG numbers in thymus were very small, here we didn’t do the IPA analysis for the thymus. IPA predicts the significance of certain pathways with p-value and z-score, which reflect the percentage of genes in the database that are in the pathway and whether the pathway is activated or inhibited, respectively.
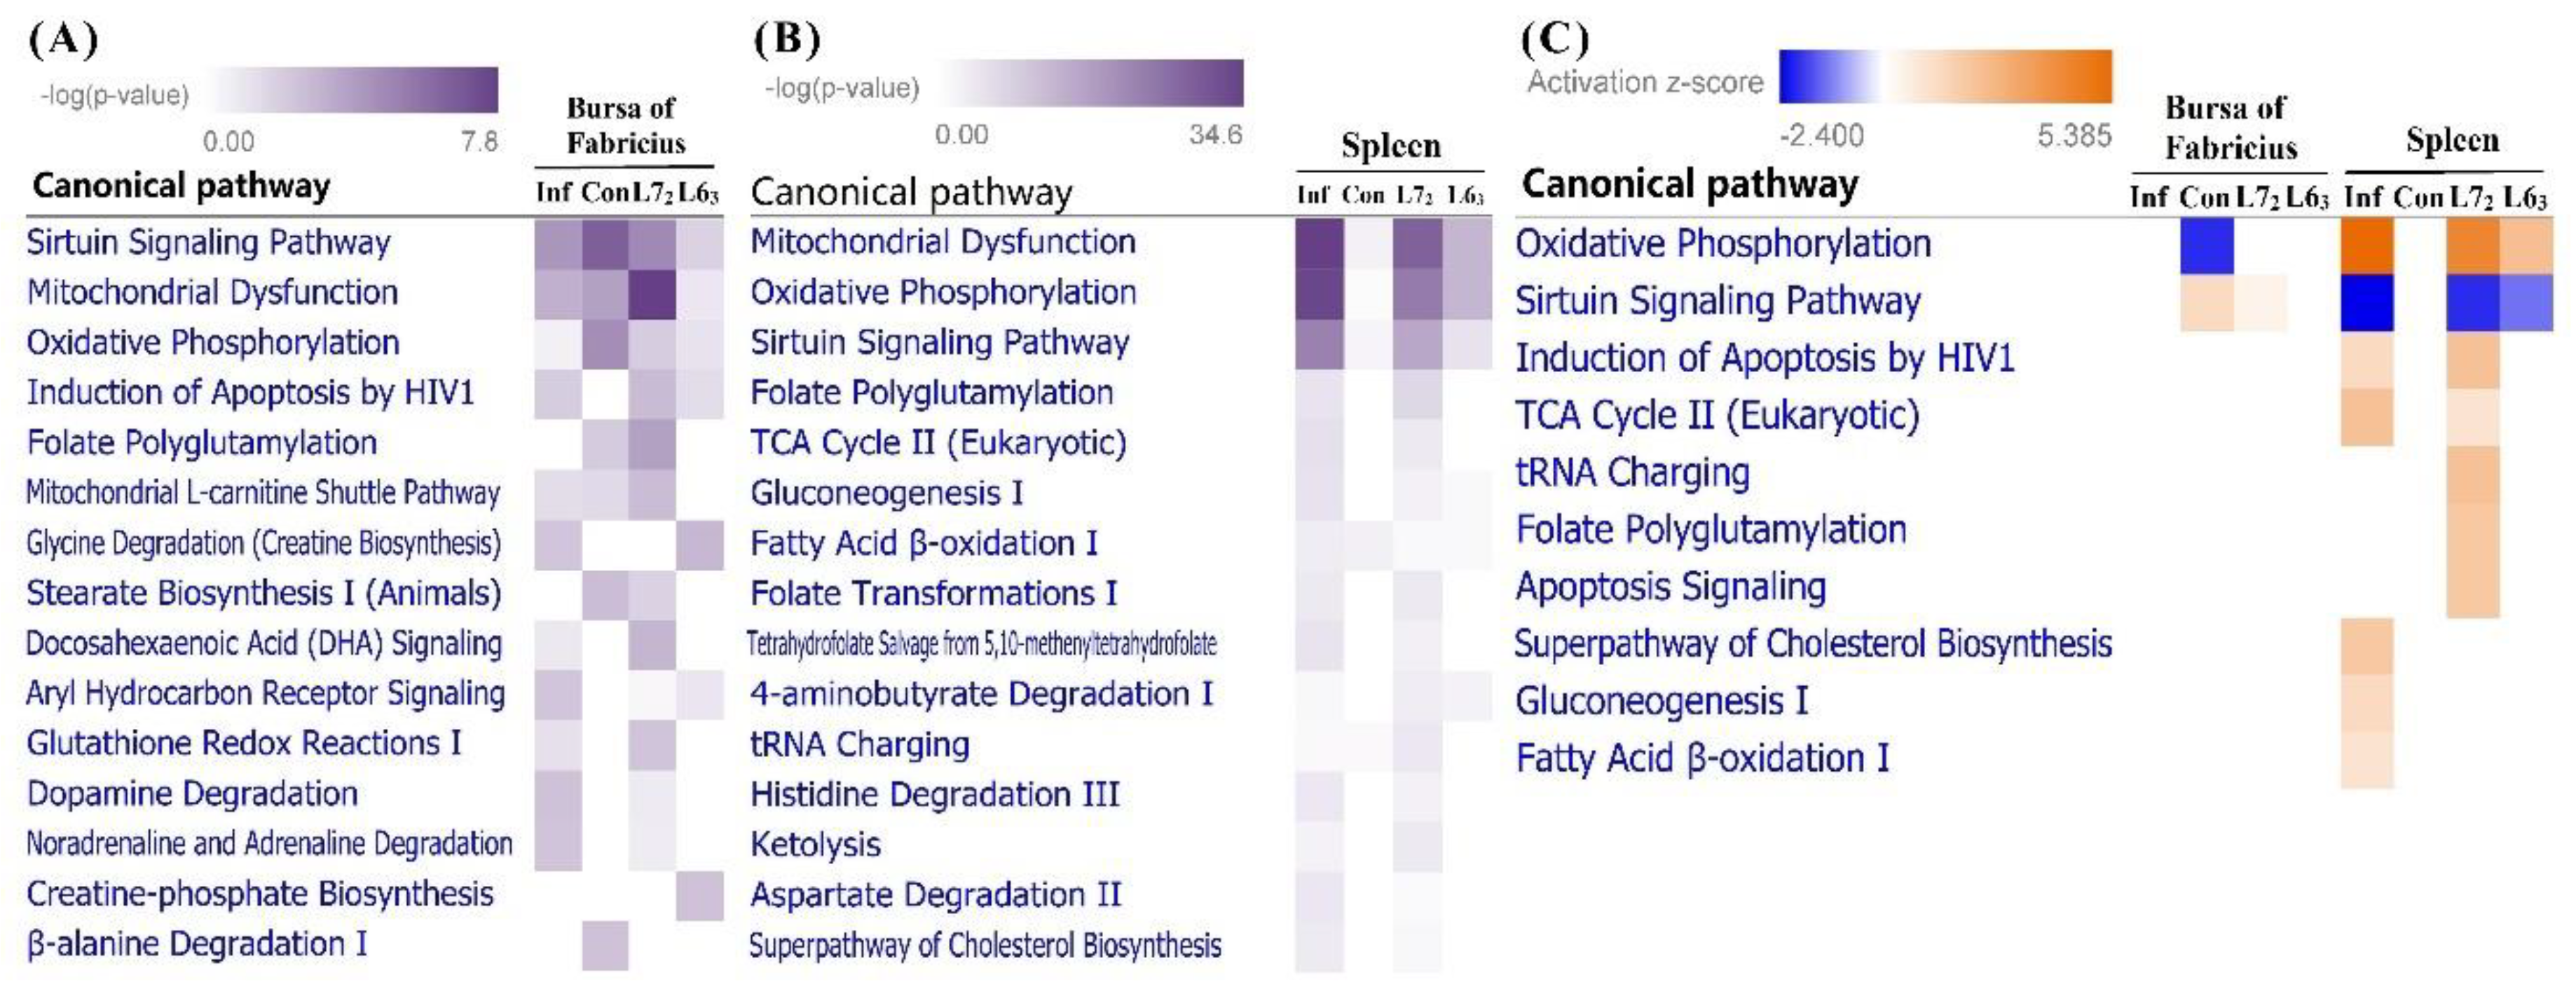
Totally, IPA showed that DEGs in bursa and spleen were significantly enriched in 76 and 101 pathways, respectively (see Tables S2 and S3, p ≤ 0.05). After infection, DEGs in bursa of line 63 were enriched in four significant pathways (sirtuin signaling pathway, induction of apoptosis by HIV1, glycine degradation and creatine-phosphate biosynthesis) in contrast with the 51 enriched pathways in line 72. DEGs from spleen of line 63 and 72 in response to MDV infection were significantly enriched in 20 and 66 pathways, respectively. When comparing the top important pathways in bursa and spleen, we found a considerable number of pathways associated with the mitochondrial function and metabolism, such as sirtuin signaling pathway, mitochondrial dysfunction, oxidative phosphorylation (OXPHOS), and folate polyglutamylation (Figure 5A,B).
In bursa, the OXPHOS pathway was significantly inhibited in line 72 control birds compared to line 63 counterparts, while the sirtuin signaling pathway was activated (Figure 5C). Conversely, those two pathways showed opposite regulation directions in spleen, with the OXPHOS pathway being significantly activated and the sirtuin signaling pathway being inhibited in infected birds, especially in line 72. Furthermore, genes involved in the two oppositely regulated pathways were checked. Four genes (NDUFA2, NDUFB2, NDUFS5, and NDUFV1), down-regulated in line 72 normal birds than line 63, were shared in the two pathways in bursa. Those four genes encode subunits of mitochondrial complex I (NADH dehydrogenase), which is the first enzyme complex in the respiratory chain. Meanwhile, for the spleen 11 genes were shared in the two pathways, including eight from complex I (NDUFA8, NDUFB1, NDUFB3, NDUFB4, NDUFB5, NDUFB8, NDUFB9, and NDUFS6), one from complex Ⅱ (SDHA), and two from complex V (ATP5B and ATP5C1).
Very interestingly, we noticed that many genes that encodes the mitochondrial oxidative phosphorylation complexes were up-regulated in spleen of line 72 with MDV infection. When compared to line 63, 28 genes were higher expressed in line 72, including ten from complex I (NDUFA8, NDUFAB1, NDUFB1, NDUFB3, NDUFB, NDUFB5, NDUFB8, NDUFB9, NDUFS6, and NDUFV3), two from complex II (SDHA and SDHA2), five from complex III (UQCC1, UQCRB, UQCR10, UQCRC1, and UQCRH), six from complex IV (COX4I1, COX5A, COX6B1, COX7A2, COX11, and COX17) as well as five from complex V (ATP5B, ATP5C1, ATP10D, ATP5G3, and ATP5S).
In addition, several other pathways associated with energy metabolism, such as TCA cycle, gluconeogenesis, and fatty acid β-oxidation, were also activated in susceptible birds, implicating the high-energy demands in this organ.
Meanwhile, two pathways relating with apoptosis (induction of apoptosis by HIV1 and apoptosis signaling) were also activated in spleen of line 72 after infection with MDV, suggesting the non-negligible role of apoptosis in MDV inducing tumorigenesis.
2.3.4. Nuclear Genes Involving in the mtDNA Replication, Transcription and Maintenance
Subsequently, some important nuclear genes, which play essential roles in mtDNA replication, transcription and viability maintenance, were further investigated. No relevant genes were found to be differentially expressed in thymus at 21 dpi while many were found to be dysregulated in the other two lymphoid organs, especially in spleen (Table 2). In bursa, SLC25A4, also known as ANT1, was the only significantly up-regulated gene in both lines upon MDV infection and the expression of this gene in line 72 was lower than in line 63, whether challenged or not.
In spleen of the MD-susceptible and -resistant lines, infection had contrasting effects on the expression of genes relating to mtDNA replication and transcription. Upon MDV infection, only POLG2 were up-regulated in line 63, while five genes (TWNK, SSBP1, DNA2, MGME1, and SLC25A4) showed up-regulation in line 72. Moreover, the expression of eight important genes (TWNK, SSBP1, DNA2, MGME1, SLC25A4, TFAM, MTERF2, and SUPV3L1) were significantly higher in line 72 infected chickens comparing to the line 63 counterparts, indicating that MDV infection can significantly up-regulate those genes that are closely related to mtDNA replication, transcription, and maintenance. Obviously, the POLG2 gene expression level was lower in the spleen of line 72 infected birds comparing to line 63, because this gene increased in line 63 while it remained unchanged in line 72.
3. Discussion
3.1. MtDNA Content and Gene Expression
To our knowledge, this is one of few studies to explore the relationship between mtDNA and avian herpesvirus infection, especially covering the three phases of MDV infection. At 10 dpi, a slight decreasing tendency was observed in thymus with the infection for both lines, indicating that the latency period in thymus deserves further studies. It was reported that herpes simplex virus type 1 (HSV-1) and HSV-2 in human trigger mtDNA damage or loss following by mitochondrial dysfunction and the depleting of mRNA encoded by the mitochondrial genomes [15,27]. Similarly, in our study the mtDNA contents deduced significantly in spleen of the MDV-infected line 72 birds. Interestingly, a significantly elevated mitochondrial gene transcriptional activity was observed. However, mtDNA content alone cannot be used as a surrogate for the respiratory activity in abnormal situations, for example, tumors [28]. At 21 dpi, about 40 percentage cells in spleen were MDV-integrated, whereas only 3.7% cells in thymus were MDV-integrated and bursa had the media number of cells being integrated [18]. Importantly, the virus genome integrating into the host genome is a key feature of tumor cell population [17]. Many studies have implicated that oncoviruses, viruses that transform cells into tumors, can modulate mitochondrial functions and bioenergetics by altering mitochondrial pathways, for example, reprogramming of energy metabolism [29]. Hence, we consider that further studies need to explore the regulatory mechanisms of the transformed cells working with mitochondrial together, which may manipulate cell signaling and energy metabolism of host to fulfill its high-energy demand in virus proliferation phase.
3.2. Mitochondria-Related Nuclear Genes and Pathway Analysis
The mitochondrial biogenesis consists of a great deal of proteins. Besides the 13 proteins that encoded by its own genome, there still remain 1000–1500 mitochondrial proteins being encoded by the nuclear genome and imported into mitochondria from the cytoplasm [30]. When comparing the expression of those mitochondria-related nuclear genes in the three immune organs, we found that the thymus had the smallest transcriptional response while the spleen possessed the maximum number of differentially changed genes, which is in consistent with the results from others [31]. As expected, many genes and pathways were altered in spleen of the MD-susceptible birds compared to MD-resistant ones. First, oxidative phosphorylation (OXPHOS), one of the most important function in mitochondria, was significantly activated in spleen of line 72 infected birds. On which, 28 genes included in the mitochondrial oxidative phosphorylation complexes were up-regulated. Besides, several other pathways associated with energy metabolism including gluconeogenesis and fatty acid β-oxidation were also significantly activated in the spleen in line 72. Cancer cells use glucose and glutamine to promote cell growth and proliferation, a process known as metabolic reprogramming [32]. In this process, OXPHOS is essential not only for fulfilling the increased demands for energy to support the high rate of proliferation but also for macromolecules biosynthesis that are critical for enhanced tumor growth [33,34,35]. Coincidentally, the cholesterol biosynthesis pathway, often elevated in proliferating normal tissues and tumors [36], was also activated in line 72. Taken together, we speculate that the transformed lymphocyte in spleen of the MD-susceptible chickens rewired the metabolic process in mitochondria to fulfill the high energy demands.
Another important pathway in MDV infection is sirtuin signaling pathway, which is famous for the roles in metabolism, aging, and cancer [37,38,39]. Sirtuins are nicotinamide adenine dinucleotide (NAD+)-dependent deacetylases and can acetylate metabolic proteins, such as tricarboxylic acid (TCA) cycle enzymes, fatty acid oxidation enzymes, and subunits of OXPHOS complexes in response to metabolic stress [40]. Mammals have seven sirtuins, three out of which, SIRT3, SIRT4, and SIRT5, are found to be located in mitochondria [41]. The genes SIRT3, SIRT4, and SIRT5 were detected to be dysregulated in bursa and spleen of chickens, illustrating their importance in mitochondrial basic biology upon MDV infection. Additionally, apoptosis signaling is also an import part in spleen upon MDV infection, in which mitochondria play a pivotal role as well. A series of genes responsible for cell programmed death or tumorigenesis were found to be dysregulated, for example, the gene MSRB3, PNPT1, AIFM2, and so on. It is considered that down-regulation of MSRB3 could increase the levels of cellular reactive oxygen species (ROS) and active intrinsic mitochondrial pathway through increasing the Bax to Bcl-2 ratio and cytochrome c releasing, finally inducing cell apoptosis [5]. Interestingly, the gene MSRB3 showed conversely regulating styles in bursa and spleen, down-regulated in spleen and up-regulated in bursa. Coincidentally, MDV infection in line 72 increased the expression of BAK1 (pro-apoptotic) and meanwhile decreased the expression of BCL2 (anti-apoptotic) in spleen, and meanwhile, the CYCS expression was up-regulated, indicating the active apoptosis process in this organ. Another gene PNPT1, which was documented recently to be released from mitochondria coordinately with CYCS and to possess a new pro-apoptotic role, was similarly increased in line 72 spleen samples after infection. Additionally, the AIFM2 gene, a gene with pro-apoptotic function and often being down-regulated in various cancers [42] was indeed significantly decreased in spleen of the line 72 infected birds. Moreover, two mPTP genes VDAC1 and VDAC2, which was reported to be activated by linc-GALMD3, an up-regulated long intergenic non-coding RNA in MDV infection leading to apoptosis and cell death [26], were also found significantly up-regulated in spleen samples of the line 72 infected birds. It has been reported that several viruses can induce apoptosis of lymphoid through multiple pathways. MDV replicates in the infected B and T cells may induce apoptosis of various cells including virus-infected cells or transformed cells, resulting in a depletion of lymphocytes and transient immunosuppression in the host [43].
3.3. The Mitochondrial DNA Replication and Transcription upon MDV Infection
Although the mitochondria have their own genome, the replication and transcription of mtDNA are completely controlled by the nuclear genome. It is estimated that 250–300 nuclear proteins are dedicated to the replication, transcription, maintenance, and copy number control of this muticopy genome [44]. Many out of the well-appreciated genes, e.g., TWNK, SSBP1, DNA2, MGME1, and SLC25A4 were all detected to be significantly up-regulated in spleen of the line 72 infected birds. TWNK is a mitochondrial 5′–3′ helicase, which binds to and unwinds double stranded DNA and is necessary for replication of mtDNA [45,46]. SSBP1 is the mitochondrial single stranded binding protein, whose function is to restrict initiation of light-strand mtDNA synthesis to the specific origin of light-strand DNA synthesis [47] and SSBP1 also interacts with TWINK and polymerase gamma (Polγ), the only DNA polymerase in mitochondria, to ensure their functions [48]. DNA2, MGME1, and SLC25A4 are three genes essential for mitochondrial genome processing, maintenance, and stability, and mutations in those genes are often responsible for the loss of mitochondrial copy numbers [49,50,51,52]. It is also implicated that the high expression of DNA2 may promote the cancer cells proliferation [53]. Besides, three other important genes MTERF2, SUPV3L1, and TFAM also highly expressed in the line 72 infected birds. The MTERF2 gene belongs to the mitochondrial transcription termination factor (MTERF) family, which has been reported to be linked with the regulation of mtDNA replication and transcription [54,55]. In human MTERF2 is highly expressed in tissues that are highly dependent on the mitochondrial energy production and may regulate oxidative phosphorylation by modulating mitochondrial DNA transcription [56,57]. The MTERF family in mammals has four members, named MTERF1 to MTERF4, in which MTERF1 was explored more widely. MTERF1 is considered as a “contrahelicase” in mtDNA replication and may prevent collisions between mtDNA replication and transcription [58]. Thereby, it is possible that MTERF2 had the similar role and further work is deserved to exploit MTERF2 functions in chicken. Additionally, mitochondrial helicase SUV3 (encoded by SUPV3L1) is predominantly required for the processing of mitochondrial polycistronic transcripts [59]. It is known that SUV3 can interact with polynucleotide phosphorylase (PNPase), that is encoded by PNPT1, to form SUV3·PNPase complex and modulate mt-mRNA poly(A) tail lengths in response to changes in energetic states of mitochondria [60], suggesting its crucial role in control of the amount and translation of each mitochondrial mRNA. The protein encoded by the TFAM gene is one of the essential components for the mitochondrial DNA transcription, replication, organization, and maintenance [61,62], which can bind, unwind and bend DNA to initiate the mitochondrial transcription. T cells with TFAM being depleted proliferated less than wild type T cells [63]. In spleen of the line 72 infected birds, the TFAM gene was significantly up-regulated in contrast the counterparts of line 63. Meanwhile, it has been shown that TFAM expression is regulated by PPARGC1A. Interestingly, the expression of PPARGC1A was also up-regulated in spleen of the line 72 infected birds. Combining with the higher expression of mitochondrial genes, it is conceivable that the proliferation of T cells was activated at 21 dpi in spleen of the line 72 birds infected with MDV.
Of note, only the POLG2 gene in spleen of the MD-resistant line 63 infected birds was significantly up-regulated. POLG2 encodes the accessory subunits of DNA polymerase gamma (Polγ), which is the only DNA replicative polymerase involved in the human mitochondria and is crucial for the replication and repair of mtDNA [64,65]. Polγ has two subunits: A catalytic subunit and an accessory subunit, which were encoded by POLG and POLG2, respectively. POLG2 could enhance interactions with the DNA template and increases both the catalytic activity and the processivity of POLG, suggesting it is the major regulator of polymerase activity. In Drosophila melanogaster, over-expression of POLG2 rather than POLG can definitely increase the amount of mtDNA within individual cells [66]. In human, mutations in POLG2 have a dominant negative effect and lead to multiple mtDNA deletions [67]. In neuronally-differentiated (ND)-PC12 cells being quiescently infected with herpes simplex virus type 1 (HSV-1), POLG2 was also noted to be down-regulated [68]. Accordingly, we speculate that the upregulation of POLG2 played a key role in the mtDNA maintenance in line 63.
4. Materials and Methods
4.1. Ethics Statement
The study protocols for animal experiments were in strict accordance with the Animal Care and Use Committee (ACUC) Guidelines approved by USDA, ADOL (April 2005, Project Number 6040-31320-009-00-D) and the Guide for the Care and Use of Laboratory Animals by Institute for Laboratory Animal Research (Eighth Edition, 2011).
4.2. Chickens, Treatment, and Samples
Chicks were obtained from the specified-pathogen-free (SPF) parent flocks of lines 63 and 72, and were housed in a BSL-2 facility on the farm of the Avian Disease and Oncology Laboratory (ADOL, East Lansing, Michigan, USDA). On the fifth day after hatching, young birds were randomly selected and divided into challenge and control groups in each line. The birds of challenge groups for both lines were given a dosage of 500 plaque-forming units (PFU) of 648A passage 40 MDV intra-abdominally each. Chicks of different treatment groups were housed separately in negatively pressured isolators of uniform conditions. Bursa of Fabricius (referred as bursa in this paper), thymus, and spleen samples were collected at 5, 10, and 21 days post-infection (dpi) from 5 birds per line, per group at each of the time-points, which were individually placed in RNAlater (Qiagen, Valencia, CA, USA) immediately and stored at −80 °C until further analysis. Firstly, mtDNA copy number were detected in all 60 samples (3 tissues × 5 individuals × 4 groups). Then, according to the mtDNA variation results, tissues at 21 dpi were decided for gene expression experiment and two individuals were randomly selected from each group.
4.3. Quantification of mtDNA Copy Number
Genomic DNA was isolated from all of the sampled tissues using Wizard Genomic DNA Purification Kit (Promega, Madison, WI, USA). The DNA concentration was detected using Synergy HTX Multi-Reader (BioTek, Winooski, VT, USA) and adjusted to 50ng/uL. The relative amounts of mtDNA were determined by qPCR. The β-actin gene was used as the reference nuclear gene with the primers: β-actin_F GAGAAATTGTGCGTGACATCA, β-actin_R CCTGAACCTCTCATTGCCA. Three mitochondrial genes, ND2, ND3, and COX1, were selected in this study, which were described by Reverter et al. [7]. The PCR amplicons were generated on a C1000 Touch™ thermal cycler (BioRad, Hercules, CA, USA) in a 10 μL reaction, which contained 5 μL of 2×SYBR Green PCR mix (Biorad), 3 μL of ddH2O, 1 μL primers (10 pmol/μL per primer) and 1 μL DNA template (50 ng/μL). The reactions for each sample were carried out in triplicates along with a negative control (without template). To construct the standard curves, a pooled template was prepared with equal amount of DNA from each of the 30 individual samples (10 for each tissue) and 1:10 dilution series ranging from 1 mg to 0.001 ng were made and used.
Relative mtDNA copy numbers were calculated following equation [7]: MtDNA copy number = 21+(Ctn_gene−Ctmt_gene), where Ct represents the average cycle threshold. The mtDNA copy number data from the three tissues were analyzed separately. The PROC GLM procedure in SAS 9.4 was used to carry out the analysis.
4.4. RNA Sequencing
Total RNA samples extracted from all three tissues at 21dpi from two randomly selected individuals in each group were used for deep sequencing. The RNA extraction, cDNA synthesis, library preparation, transcriptome sequencing, and qPCR validation were carried out following the reported protocols [69]. Raw RNA-seq data were treated with Trimmomatic first for quality control and mapped onto the chicken reference genome (Gallus gallus Galgal 5.0) using HISAT2. Differential expression analyses were performed with Cuffdiff tools for comparisons between the treatment groups within each line, and also between the lines within each treatment group. Fragments per kilobase of transcript per million (FPKM) was used as the relative gene expression level. Genes showing a p-value ≤ 0.05 and a false discovery rate (FDR) ≤ 0.1 were considered differentially expressed genes (DEGs).
4.5. MitoProteome Gene Differential Expression Analysis and Pathway Analysis
To fully use the available mitochondrial information, 1158 human MitoProteome genes were downloaded from the website https://www.broadinstitute.org/files/shared/metabolism/mitocarta/human.mitocarta2.0.html, which released the nuclear and mitochondrial DNA genes encoding proteins with strong support of mitochondrial localization [70]. Gene names were directly compared with those in chicken. Finally, 886 genes were matched including 13 mtDNA encoded protein genes as well as 873 mitochondria-related nuclear genes. The gene expression and differential expression data of those MitoProteome genes were picked out from the RNA-seq results for further analysis. The Ingenuity Pathway Analysis (IPA) software was used for gene pathway analysis.
5. Conclusions
In summary, in this study we have investigated the variability of mtDNA copy number and gene expression level in the three lymphoid organs in response to MDV challenge. We found that MDV challenge had little impact on mtDNA contents in chickens of the MD-resistant line, but the mitochondrial DNA abundance and gene expression level were obviously altered at the transformation phase, especially in spleen, in chickens of the MD-susceptible line. MDV infection significantly increased the mitochondrial gene expression in the spleen tissue of the MD-susceptible birds, albeit a significant decrease of the mtDNA copy number was observed. Meanwhile, many of the nuclear genes related to mitochondrial genome maintenance and gene expression were up-regulated except for POLG2, which was conversely up-regulated in the MD-resistant line. The data indicated that the POLG2 gene may be a potential regulator for the conflict between the mtDNA copy number and the gene expression of mitochondria in the MD-susceptible birds, directly resulting in imbalance between metabolic and cell signaling and finally the MD pathogenesis and oncogenesis. Further work is warranted to look into mtDNA replication and gene transcription as well as the mitochondria regulation mechanism in relation with MDV infection in chicken.
Supplementary Materials
Supplementary materials can be found at https://www.mdpi.com/1422-0067/20/13/3150/s1.
Author Contributions
Conceptualization, Q.C., Y.D. and J.S.; Funding acquisition, Q.C. and J.S.; Methodology, Q.C., W.C. and L.L.; Project administration, J.S.; Resources, Y.D. and H.Z.; Writing – original draft, Q.C. and J.S.; Writing – review & editing, Y.D. and H.Z.
Funding
This work was supported by the U.S. Department of Agriculture (USDA)-Nation Research Initiative/National Institute of Food and Agriculture (NRI/NIFA) [2011-67015-30183]; Beijing Municipal Science and Technology Project [D171100007817003]; the Innovation Program of Beijing Academy of Agriculture and Forestry Sciences [KJCX20170105]; and the China Scholarship Council (CSC).
Acknowledgments
The authors are grateful to Nishanth E. Sunny from University of Maryland, College Park, MD, USA, for his valuable suggestions and comments.
Conflicts of Interest
The authors declare no conflict of interest.
References
- Mayr, J.A. Lipid metabolism in mitochondrial membranes. J. Inherit. Metab. Dis. 2015, 38, 137–144. [Google Scholar] [CrossRef] [PubMed]
- Wang, C.H.; Wei, Y.H. Role of mitochondrial dysfunction and dysregulation of Ca(2+) homeostasis in the pathophysiology of insulin resistance and type 2 diabetes. J. Biomed. Sci. 2017, 24, 70. [Google Scholar] [CrossRef] [PubMed]
- Monlun, M.; Hyernard, C.; Blanco, P.; Lartigue, L.; Faustin, B. Mitochondria as Molecular Platforms Integrating Multiple Innate Immune Signalings. J. Mol. Biol. 2017, 429, 1–13. [Google Scholar] [CrossRef] [PubMed]
- West, A.P.; Shadel, G.S. Mitochondrial DNA in innate immune responses and inflammatory pathology. Nat. Rev. Immunol. 2017, 17, 363–375. [Google Scholar] [CrossRef] [PubMed]
- Kwak, G.H.; Kim, T.H.; Kim, H.Y. Down-regulation of MsrB3 induces cancer cell apoptosis through reactive oxygen species production and intrinsic mitochondrial pathway activation. Biochem. Biophys. Res. Commun. 2017, 483, 468–474. [Google Scholar] [CrossRef]
- Yan, X.J.; Yu, X.; Wang, X.P.; Jiang, J.F.; Yuan, Z.Y.; Lu, X.; Lei, F.; Xing, D.M. Mitochondria play an important role in the cell proliferation suppressing activity of berberine. Sci. Rep. 2017, 7, 41712. [Google Scholar] [CrossRef] [PubMed]
- Reverter, A.; Okimoto, R.; Sapp, R.; Bottje, W.G.; Hawken, R.; Hudson, N.J. Chicken muscle mitochondrial content appears co-ordinately regulated and is associated with performance phenotypes. Biol. Open 2017, 6, 50–58. [Google Scholar] [CrossRef]
- Weikard, R.; Kuehn, C. Different mitochondrial DNA copy number in liver and mammary gland of lactating cows with divergent genetic background for milk production. 2018. [Google Scholar] [CrossRef]
- Mengel-From, J.; Thinggaard, M.; Dalgard, C.; Kyvik, K.O.; Christensen, K.; Christiansen, L. Mitochondrial DNA copy number in peripheral blood cells declines with age and is associated with general health among elderly. Hum. Genet. 2014, 133, 1149–1159. [Google Scholar] [CrossRef] [Green Version]
- Ashar, F.N.; Zhang, Y.; Longchamps, R.J.; Lane, J.; Moes, A.; Grove, M.L.; Mychaleckyj, J.C.; Taylor, K.D.; Coresh, J.; Rotter, J.I.; et al. Association of Mitochondrial DNA Copy Number With Cardiovascular Disease. Jama Cardiol. 2017, 2, 1247–1255. [Google Scholar] [CrossRef]
- Leavy, O. T cells: Mitochondria and T cell activation. Nat. Rev. Immunol. 2013, 13, 224. [Google Scholar] [CrossRef]
- Liu, P.S.; Ho, P.C. Mitochondria: A master regulator in macrophage and T cell immunity. Mitochondrion 2018, 41, 45–50. [Google Scholar] [CrossRef] [PubMed]
- Sandoval, H.; Kodali, S.; Wang, J. Regulation of B cell fate, survival, and function by mitochondria and autophagy. Mitochondrion 2018, 41, 58–65. [Google Scholar] [CrossRef] [PubMed]
- Anand, S.K.; Tikoo, S.K. Viruses as modulators of mitochondrial functions. Adv. Virol. 2013, 2013, 738794. [Google Scholar] [CrossRef] [PubMed]
- Saffran, H.A.; Pare, J.M.; Corcoran, J.A.; Weller, S.K.; Smiley, J.R. Herpes simplex virus eliminates host mitochondrial DNA. Embo Rep. 2007, 8, 188–193. [Google Scholar] [CrossRef] [PubMed]
- Weinberg, S.E.; Sena, L.A.; Chandel, N.S. Mitochondria in the regulation of innate and adaptive immunity. Immunity 2015, 42, 406–417. [Google Scholar] [CrossRef] [PubMed]
- Robinson, C.M.; Hunt, H.D.; Cheng, H.H.; Delany, M.E. Chromosomal integration of an avian oncogenic herpesvirus reveals telomeric preferences and evidence for lymphoma clonality. Herpesviridae 2010, 1, 5. [Google Scholar] [CrossRef] [PubMed]
- Robinson, C.M.; Cheng, H.H.; Delany, M.E. Temporal kinetics of Marek’s disease herpesvirus: Integration occurs early after infection in both B and T cells. Cytogenet. Genome Res. 2014, 144, 142–154. [Google Scholar] [CrossRef]
- McPherson, M.C.; Delany, M.E. Virus and host genomic, molecular, and cellular interactions during Marek’s disease pathogenesis and oncogenesis. Poult. Sci. 2016, 95, 412–429. [Google Scholar] [CrossRef]
- McPherson, M.C.; Cheng, H.H.; Delany, M.E. Marek’s disease herpesvirus vaccines integrate into chicken host chromosomes yet lack a virus-host phenotype associated with oncogenic transformation. Vaccine 2016, 34, 5554–5561. [Google Scholar] [CrossRef]
- Boodhoo, N.; Gurung, A.; Sharif, S.; Behboudi, S. Marek’s disease in chickens: A review with focus on immunology. Vet. Res. 2016, 47, 119. [Google Scholar] [CrossRef]
- Luo, J.; Yu, Y.; Chang, S.; Tian, F.; Zhang, H.; Song, J. DNA Methylation Fluctuation Induced by Virus Infection Differs between MD-resistant and -susceptible Chickens. Front. Genet. 2012, 3, 20. [Google Scholar] [CrossRef] [PubMed] [Green Version]
- Xie, Q.; Chang, S.; Dong, K.; Dunn, J.R.; Song, J.; Zhang, H. Genomic Variation between Genetic Lines of White Leghorns Differed in Resistance to Marek’s Disease. J. Clin. Epigenetics 2017, 03. [Google Scholar] [CrossRef]
- Xu, L.; He, Y.; Ding, Y.; Sun, G.; Carrillo, J.A.; Li, Y.; Ghaly, M.M.; Ma, L.; Zhang, H.; Liu, G.E.; et al. Characterization of Copy Number Variation’s Potential Role in Marek’s Disease. Int. J. Mol. Sci. 2017, 18. [Google Scholar] [CrossRef] [PubMed]
- Bacon, L.D.; Hunt, H.D.; Cheng, H.H. A review of the development of chicken lines to resolve genes determining resistance to diseases. Poult. Sci. 2000, 79, 1082–1093. [Google Scholar] [CrossRef] [PubMed]
- Han, B.; He, Y.; Zhang, L.; Ding, Y.; Lian, L.; Zhao, C.; Song, J.; Yang, N. Long intergenic non-coding RNA GALMD3 in chicken Marek’s disease. Sci. Rep. 2017, 7, 10294. [Google Scholar] [CrossRef] [PubMed]
- Chodkowski, M.; Serafinska, I.; Brzezicka, J.; Golke, A.; Slonska, A.; Krzyzowska, M.; Orlowski, P.; Baska, P.; Banbura, M.W.; Cymerys, J. Human herpesvirus type 1 and type 2 disrupt mitochondrial dynamics in human keratinocytes. 2018. [Google Scholar] [CrossRef]
- Reznik, E.; Miller, M.L.; Şenbabaoğlu, Y.; Riaz, N.; Sarungbam, J.; Tickoo, S.K.; Al-Ahmadie, H.A.; Lee, W.; Seshan, V.E.; Hakimi, A.A. Mitochondrial DNA copy number variation across human cancers. eLife 2016, 5, e10769. [Google Scholar] [CrossRef] [PubMed]
- Mesri, E.A.; Feitelson, M.A.; Munger, K. Human viral oncogenesis: A cancer hallmarks analysis. Cell Host Microbe 2014, 15, 266–282. [Google Scholar] [CrossRef]
- Calvo, S.E.; Mootha, V.K. The mitochondrial proteome and human disease. Annu. Rev. Genom. Hum. Genet. 2010, 11, 25–44. [Google Scholar] [CrossRef] [PubMed]
- Smith, J.; Sadeyen, J.R.; Paton, I.R.; Hocking, P.M.; Salmon, N.; Fife, M.; Nair, V.; Burt, D.W.; Kaiser, P. Systems analysis of immune responses in Marek’s disease virus-infected chickens identifies a gene involved in susceptibility and highlights a possible novel pathogenicity mechanism. J. Virol. 2011, 85, 11146–11158. [Google Scholar] [CrossRef]
- Gonzalez Herrera, K.N.; Lee, J.; Haigis, M.C. Intersections between mitochondrial sirtuin signaling and tumor cell metabolism. Crit. Rev. Biochem. Mol. Biol. 2015, 50, 242–255. [Google Scholar] [CrossRef]
- Viale, A.; Pettazzoni, P.; Lyssiotis, C.A.; Ying, H.; Sanchez, N.; Marchesini, M.; Carugo, A.; Green, T.; Seth, S.; Giuliani, V.; et al. Oncogene ablation-resistant pancreatic cancer cells depend on mitochondrial function. Nature 2014, 514, 628–632. [Google Scholar] [CrossRef] [PubMed] [Green Version]
- Sullivan, L.B.; Gui, D.Y.; Hosios, A.M.; Bush, L.N.; Freinkman, E.; Vander Heiden, M.G. Supporting Aspartate Biosynthesis Is an Essential Function of Respiration in Proliferating Cells. Cell 2015, 162, 552–563. [Google Scholar] [CrossRef] [PubMed] [Green Version]
- Molina, J.R.; Sun, Y.; Protopopova, M.; Gera, S.; Bandi, M.; Bristow, C.; McAfoos, T.; Morlacchi, P.; Ackroyd, J. An inhibitor of oxidative phosphorylation exploits cancer vulnerability. Nat. Med. 2018, 24, 1036–1046. [Google Scholar] [CrossRef] [PubMed] [Green Version]
- Cruz, P.M.; Mo, H.; McConathy, W.J.; Sabnis, N.; Lacko, A.G. The role of cholesterol metabolism and cholesterol transport in carcinogenesis: A review of scientific findings, relevant to future cancer therapeutics. Front. Pharmacol. 2013, 4, 119. [Google Scholar] [CrossRef] [PubMed]
- Bringman-Rodenbarger, L.R.; Guo, A.H.; Lyssiotis, C.A.; Lombard, D.B. Emerging Roles for SIRT5 in Metabolism and Cancer. Antioxid. Redox Signal. 2018, 28, 677–690. [Google Scholar] [CrossRef]
- Chalkiadaki, A.; Guarente, L. The multifaceted functions of sirtuins in cancer. Nat. Rev. Cancer 2015, 15, 608–624. [Google Scholar] [CrossRef] [PubMed]
- O’Callaghan, C.; Vassilopoulos, A. Sirtuins at the crossroads of stemness, aging, and cancer. Aging Cell 2017, 16, 1208–1218. [Google Scholar] [CrossRef]
- Zhao, S.; Xu, W.; Jiang, W.; Yu, W.; Lin, Y.; Zhang, T.; Yao, J.; Zhou, L.; Zeng, Y.; Li, H.; et al. Regulation of cellular metabolism by protein lysine acetylation. Sci. (New YorkN.Y.) 2010, 327, 1000–1004. [Google Scholar] [CrossRef]
- Bonda, D.J.; Lee, H.G.; Camins, A.; Pallas, M.; Casadesus, G.; Smith, M.A.; Zhu, X. The sirtuin pathway in ageing and Alzheimer disease: Mechanistic and therapeutic considerations. Lancet. Neurol. 2011, 10, 275–279. [Google Scholar] [CrossRef]
- Gong, M.; Hay, S.; Marshall, K.R.; Munro, A.W.; Scrutton, N.S. DNA binding suppresses human AIF-M2 activity and provides a connection between redox chemistry, reactive oxygen species, and apoptosis. J. Biol. Chem. 2007, 282, 30331–30340. [Google Scholar] [CrossRef]
- Gurung, A.; Kamble, N.; Kaufer, B.B.; Pathan, A.; Behboudi, S. Association of Marek’s Disease induced immunosuppression with activation of a novel regulatory T cells in chickens. Plos Pathog. 2017, 13, e1006745. [Google Scholar] [CrossRef] [PubMed]
- Pearce, S.F.; Rebelo-Guiomar, P.; D’Souza, A.R.; Powell, C.A.; Van Haute, L.; Minczuk, M. Regulation of Mammalian Mitochondrial Gene Expression: Recent Advances. Trends Biochem. Sci. 2017, 42, 625–639. [Google Scholar] [CrossRef] [PubMed] [Green Version]
- Korhonen, J.A.; Gaspari, M.; Falkenberg, M. TWINKLE Has 5’ -> 3’ DNA helicase activity and is specifically stimulated by mitochondrial single-stranded DNA-binding protein. J. Biol. Chem. 2003, 278, 48627–48632. [Google Scholar] [CrossRef] [PubMed]
- Milenkovic, D.; Matic, S.; Kuhl, I.; Ruzzenente, B.; Freyer, C.; Jemt, E.; Park, C.B.; Falkenberg, M.; Larsson, N.G. TWINKLE is an essential mitochondrial helicase required for synthesis of nascent D-loop strands and complete mtDNA replication. Hum. Mol. Genet. 2013, 22, 1983–1993. [Google Scholar] [CrossRef] [PubMed]
- Miralles Fuste, J.; Shi, Y.; Wanrooij, S.; Zhu, X.; Jemt, E.; Persson, O.; Sabouri, N.; Gustafsson, C.M.; Falkenberg, M. In vivo occupancy of mitochondrial single-stranded DNA binding protein supports the strand displacement mode of DNA replication. Plos Genet. 2014, 10, e1004832. [Google Scholar] [CrossRef] [PubMed]
- Ruhanen, H.; Borrie, S.; Szabadkai, G.; Tyynismaa, H.; Jones, A.W.; Kang, D.; Taanman, J.W.; Yasukawa, T. Mitochondrial single-stranded DNA binding protein is required for maintenance of mitochondrial DNA and 7S DNA but is not required for mitochondrial nucleoid organisation. Biochim. Et Biophys. Acta 2010, 1803, 931–939. [Google Scholar] [CrossRef] [PubMed]
- Kaukonen, J.; Juselius, J.K.; Tiranti, V.; Kyttala, A.; Zeviani, M.; Comi, G.P.; Keranen, S.; Peltonen, L.; Suomalainen, A. Role of adenine nucleotide translocator 1 in mtDNA maintenance. Sci. (New YorkN.Y.) 2000, 289, 782–785. [Google Scholar] [CrossRef] [PubMed]
- Kornblum, C.; Nicholls, T.J.; Haack, T.B.; Scholer, S.; Peeva, V.; Danhauser, K.; Hallmann, K.; Zsurka, G.; Rorbach, J.; Iuso, A.; et al. Loss-of-function mutations in MGME1 impair mtDNA replication and cause multisystemic mitochondrial disease. Nat. Genet. 2013, 45, 214–219. [Google Scholar] [CrossRef] [PubMed] [Green Version]
- Ahmed, N.; Ronchi, D.; Comi, G.P. Genes and Pathways Involved in Adult Onset Disorders Featuring Muscle Mitochondrial DNA Instability. Int. J. Mol. Sci. 2015, 16, 18054–18076. [Google Scholar] [CrossRef] [Green Version]
- Thompson, K.; Majd, H.; Dallabona, C.; Reinson, K.; King, M.S.; Alston, C.L.; He, L.; Lodi, T.; Jones, S.A.; Fattal-Valevski, A.; et al. Recurrent De Novo Dominant Mutations in SLC25A4 Cause Severe Early-Onset Mitochondrial Disease and Loss of Mitochondrial DNA Copy Number. Am. J. Hum. Genet. 2016, 99, 860–876. [Google Scholar] [CrossRef] [Green Version]
- Jia, P.P.; Junaid, M.; Ma, Y.B.; Ahmad, F.; Jia, Y.F.; Li, W.G.; Pei, D.S. Role of human DNA2 (hDNA2) as a potential target for cancer and other diseases: A systematic review. Dna Repair 2017, 59, 9–19. [Google Scholar] [CrossRef] [PubMed]
- Hyvarinen, A.K.; Pohjoismaki, J.L.; Reyes, A.; Wanrooij, S.; Yasukawa, T.; Karhunen, P.J.; Spelbrink, J.N.; Holt, I.J.; Jacobs, H.T. The mitochondrial transcription termination factor mTERF modulates replication pausing in human mitochondrial DNA. Nucleic Acids Res. 2007, 35, 6458–6474. [Google Scholar] [CrossRef] [PubMed] [Green Version]
- Pellegrini, M.; Asin-Cayuela, J.; Erdjument-Bromage, H.; Tempst, P.; Larsson, N.G.; Gustafsson, C.M. MTERF2 is a nucleoid component in mammalian mitochondria. Biochim. Et Biophys. Acta 2009, 1787, 296–302. [Google Scholar] [CrossRef] [PubMed] [Green Version]
- Chen, Y.; Zhou, G.; Yu, M.; He, Y.; Tang, W.; Lai, J.; He, J.; Liu, W.; Tan, D. Cloning and functional analysis of human mTERFL encoding a novel mitochondrial transcription termination factor-like protein. Biochem. Biophys. Res. Commun. 2005, 337, 1112–1118. [Google Scholar] [CrossRef] [PubMed]
- Han, Y.; Gao, P.; Qiu, S.; Zhang, L.; Yang, L.; Zuo, J.; Zhong, C.; Zhu, S.; Liu, W. MTERF2 contributes to MPP(+)-induced mitochondrial dysfunction and cell damage. Biochem. Biophys. Res. Commun. 2016, 471, 177–183. [Google Scholar] [CrossRef] [PubMed]
- Shi, Y.; Posse, V.; Zhu, X.; Hyvarinen, A.K.; Jacobs, H.T.; Falkenberg, M.; Gustafsson, C.M. Mitochondrial transcription termination factor 1 directs polar replication fork pausing. Nucleic Acids Res. 2016, 44, 5732–5742. [Google Scholar] [CrossRef]
- Clemente, P.; Pajak, A.; Laine, I.; Wibom, R.; Wedell, A.; Freyer, C.; Wredenberg, A. SUV3 helicase is required for correct processing of mitochondrial transcripts. Nucleic Acids Res. 2015, 43, 7398–7413. [Google Scholar] [CrossRef] [Green Version]
- Wang, D.D.; Guo, X.E.; Modrek, A.S.; Chen, C.F.; Chen, P.L.; Lee, W.H. Helicase SUV3, polynucleotide phosphorylase, and mitochondrial polyadenylation polymerase form a transient complex to modulate mitochondrial mRNA polyadenylated tail lengths in response to energetic changes. J. Biol. Chem. 2014, 289, 16727–16735. [Google Scholar] [CrossRef]
- Litonin, D.; Sologub, M.; Shi, Y.; Savkina, M.; Anikin, M.; Falkenberg, M.; Gustafsson, C.M.; Temiakov, D. Human mitochondrial transcription revisited: Only TFAM and TFB2M are required for transcription of the mitochondrial genes in vitro. J. Biol. Chem. 2010, 285, 18129–18133. [Google Scholar] [CrossRef]
- Stiles, A.R.; Simon, M.T.; Stover, A.; Eftekharian, S.; Khanlou, N.; Wang, H.L.; Magaki, S.; Lee, H.; Partynski, K.; Dorrani, N.; et al. Mutations in TFAM, encoding mitochondrial transcription factor A, cause neonatal liver failure associated with mtDNA depletion. Mol. Genet. Metab. 2016, 119, 91–99. [Google Scholar] [CrossRef]
- Baixauli, F.; Acin-Perez, R.; Villarroya-Beltri, C.; Mazzeo, C.; Nunez-Andrade, N.; Gabande-Rodriguez, E.; Ledesma, M.D.; Blazquez, A.; Martin, M.A.; Falcon-Perez, J.M.; et al. Mitochondrial Respiration Controls Lysosomal Function during Inflammatory T Cell Responses. Cell Metab. 2015, 22, 485–498. [Google Scholar] [CrossRef] [PubMed] [Green Version]
- Hudson, G.; Chinnery, P.F. Mitochondrial DNA polymerase-gamma and human disease. Hum. Mol. Genet. 2006, 15, R244–R252. [Google Scholar] [CrossRef]
- Garcia-Gomez, S.; Reyes, A.; Martinez-Jimenez, M.I.; Chocron, E.S.; Mouron, S.; Terrados, G.; Powell, C.; Salido, E.; Mendez, J.; Holt, I.J.; et al. PrimPol, an archaic primase/polymerase operating in human cells. Mol. Cell 2013, 52, 541–553. [Google Scholar] [CrossRef] [PubMed]
- Lefai, E.; Fernandez-Moreno, M.A.; Alahari, A.; Kaguni, L.S.; Garesse, R. Differential regulation of the catalytic and accessory subunit genes of Drosophila mitochondrial DNA polymerase. J. Biol. Chem. 2000, 275, 33123–33133. [Google Scholar] [CrossRef] [PubMed]
- Varma, H.; Faust, P.L.; Iglesias, A.D.; Lagana, S.M.; Wou, K.; Hirano, M.; DiMauro, S.; Mansukani, M.M.; Hoff, K.E.; Nagy, P.L.; et al. Whole exome sequencing identifies a homozygous POLG2 missense variant in an infant with fulminant hepatic failure and mitochondrial DNA depletion. Eur. J. Med Genet. 2016, 59, 540–545. [Google Scholar] [CrossRef] [PubMed] [Green Version]
- Danaher, R.J.; McGarrell, B.S.; Stromberg, A.J.; Miller, C.S. Herpes simplex virus type 1 modulates cellular gene expression during quiescent infection of neuronal cells. Arch. Virol. 2008, 153, 1335–1345. [Google Scholar] [CrossRef] [PubMed]
- He, Y.; Ding, Y.; Zhan, F.; Zhang, H.; Han, B.; Hu, G.; Zhao, K.; Yang, N.; Yu, Y.; Mao, L.; et al. The conservation and signatures of lincRNAs in Marek’s disease of chicken. Sci. Rep. 2015, 5, 15184. [Google Scholar] [CrossRef] [PubMed]
- Cotter, D.; Guda, P.; Fahy, E.; Subramaniam, S. MitoProteome: Mitochondrial protein sequence database and annotation system. Nucleic Acids Res. 2004, 32, D463–D467. [Google Scholar] [CrossRef]
Figure 1.
The mitochondrial DNA (mtDNA) copy number variation (means ± standard error) over three time-points. (A), (B) and (C) show the mtDNA abundance in bursa of Fabricius, thymus, and spleen, respectively. MtDNA copies per cell were generated with ND2 and β-actin qPCR data. Birds used in each group were five. The symbols * and ** indicate statistical significance at p ≤ 0.05 and p ≤ 0.01 levels, respectively, between lines or treatment groups.

Figure 2.
The expression of the 13 mtDNA protein coding genes. The average fragments per kilobase of transcript per million (FPKM) value of the two replicates was used as the gene expression and the heatmap was plotted based on log2FPKM. Each row represents an individual gene and each column represents the tissue and group type. The color legend represents the characteristic level, with red indicating high expression level and the blue indicating low expression level. Color density indicates different range of Log2FPKM.

Figure 3.
Differentially expressed mitochondria-related nuclear genes in response to Marek’s disease virus (MDV) challenge (FDR ≤ 0.1). (A) Number of up- or down-regulated DEGs in three lymphoid organs. Up-regulated and down-regulated genes are displayed in red and green color, separately. Color density indicates different range of Log2 (fold change) (log2FC). (B) Venn diagram showing the number of overlapped DEGs in bursa of Fabricius and spleen from line 63 and 72.

Figure 4.
Differentially expressed mitochondria-related nuclear genes between the two lines chickens under each treatment (FDR ≤ 0.1). (A) Number of up- or down-regulated DEGs in three lymphoid organs. Up-regulated and down-regulated genes are displayed in red and green color, separately. Color density indicates different range of Log2fold change (log2FC). (B) Venn diagram showing the number of overlapped DEGs in bursa of Fabricius and spleen from the control and infected groups.

Figure 5.
Ingenuity Pathway Analysis (IPA). (A) Top 15 canonical pathways based on the DEGs in bursa of Fabricius. (B) Top 15 canonical pathways based on the DEGs in spleen. (C) The canonical pathways with absolute z-score ≥1 in bursa and spleen. Pathways are sorted by p-value or absolute z-score, and the intensity of colors indicates the higher or lower value.


Table 1.
Differentially expressed mitochondrial DNA genes in three lymphoid organs.
| Tissue | Comparison | Up-Regulated Gene | Down-Regulated Gene |
|---|---|---|---|
| Bursa of Fabricius | Con (L63 vs. L72) | ND6 | |
| Thymus | L72 (Con vs. Inf) | ND6 | |
| Spleen | L63 (Con vs. Inf) | ND1, ND2, ND4, ND5, COX1, COX2, CYTB | |
| L72 (Con vs. Inf) | ND1, ND2, ND3, ND4, ND5, ND6, COX1, COX2, CYTB, ATP6 | ||
| Con (L63 vs. L72) | ND6 | ||
| Inf (L63 vs. L72) | ND1, ND2, ND3, ND4, ND5, COX2, CYTB, ATP6 |
Table 2.
Dysregulated nuclear genes involved in the mtDNA replication, transcription, and maintenance.
Table 2.
Dysregulated nuclear genes involved in the mtDNA replication, transcription, and maintenance.
| Tissue | Comparison Subset | Up-Regulated Gene | Down-Regulated Gene |
|---|---|---|---|
| Bursa of Fabricius | L63 (Con vs. Inf) | SLC25A4 | POLG2 |
| L72 (Con vs. Inf) | SLC25A4 | DNA2, MGME1, TK2 | |
| Con (L63 vs. L72) | SLC25A4, MPV17 | ||
| Inf (L63 vs. L72) | SLC25A4, DNA2, TK2 | ||
| Spleen | L63 (Con vs. Inf) | POLG2 | |
| L72 (Con vs. Inf) | TWNK, SSBP1, DNA2, MGME1, SLC25A4 | ||
| Inf (L63 vs. L72) | TWNK, SSBP1, DNA2, MGME1, SLC25A4, TFAM, MTERF2, SUPV3L1 | POLG2 |
© 2019 by the authors. Licensee MDPI, Basel, Switzerland. This article is an open access article distributed under the terms and conditions of the Creative Commons Attribution (CC BY) license (http://creativecommons.org/licenses/by/4.0/).
Share and Cite
MDPI and ACS Style
Chu, Q.; Ding, Y.; Cai, W.; Liu, L.; Zhang, H.; Song, J. Marek’s Disease Virus Infection Induced Mitochondria Changes in Chickens. Int. J. Mol. Sci. 2019, 20, 3150. https://doi.org/10.3390/ijms20133150
AMA Style
Chu Q, Ding Y, Cai W, Liu L, Zhang H, Song J. Marek’s Disease Virus Infection Induced Mitochondria Changes in Chickens. International Journal of Molecular Sciences. 2019; 20(13):3150. https://doi.org/10.3390/ijms20133150
Chicago/Turabian StyleChu, Qin, Yi Ding, Wentao Cai, Lei Liu, Huanmin Zhang, and Jiuzhou Song. 2019. "Marek’s Disease Virus Infection Induced Mitochondria Changes in Chickens" International Journal of Molecular Sciences 20, no. 13: 3150. https://doi.org/10.3390/ijms20133150
Note that from the first issue of 2016, this journal uses article numbers instead of page numbers. See further details here.