Context-Dependent Effect of Glucocorticoids on the Proliferation, Differentiation, and Apoptosis of Regulatory T Cells: A Review of the Empirical Evidence and Clinical Applications


Abstract
:
1. Introduction
2. Treg Subsets and Functions
3. Effect of GCs on Treg Cell Number: In Vitro Findings
3.1. Effects on non-Activated Treg Cells
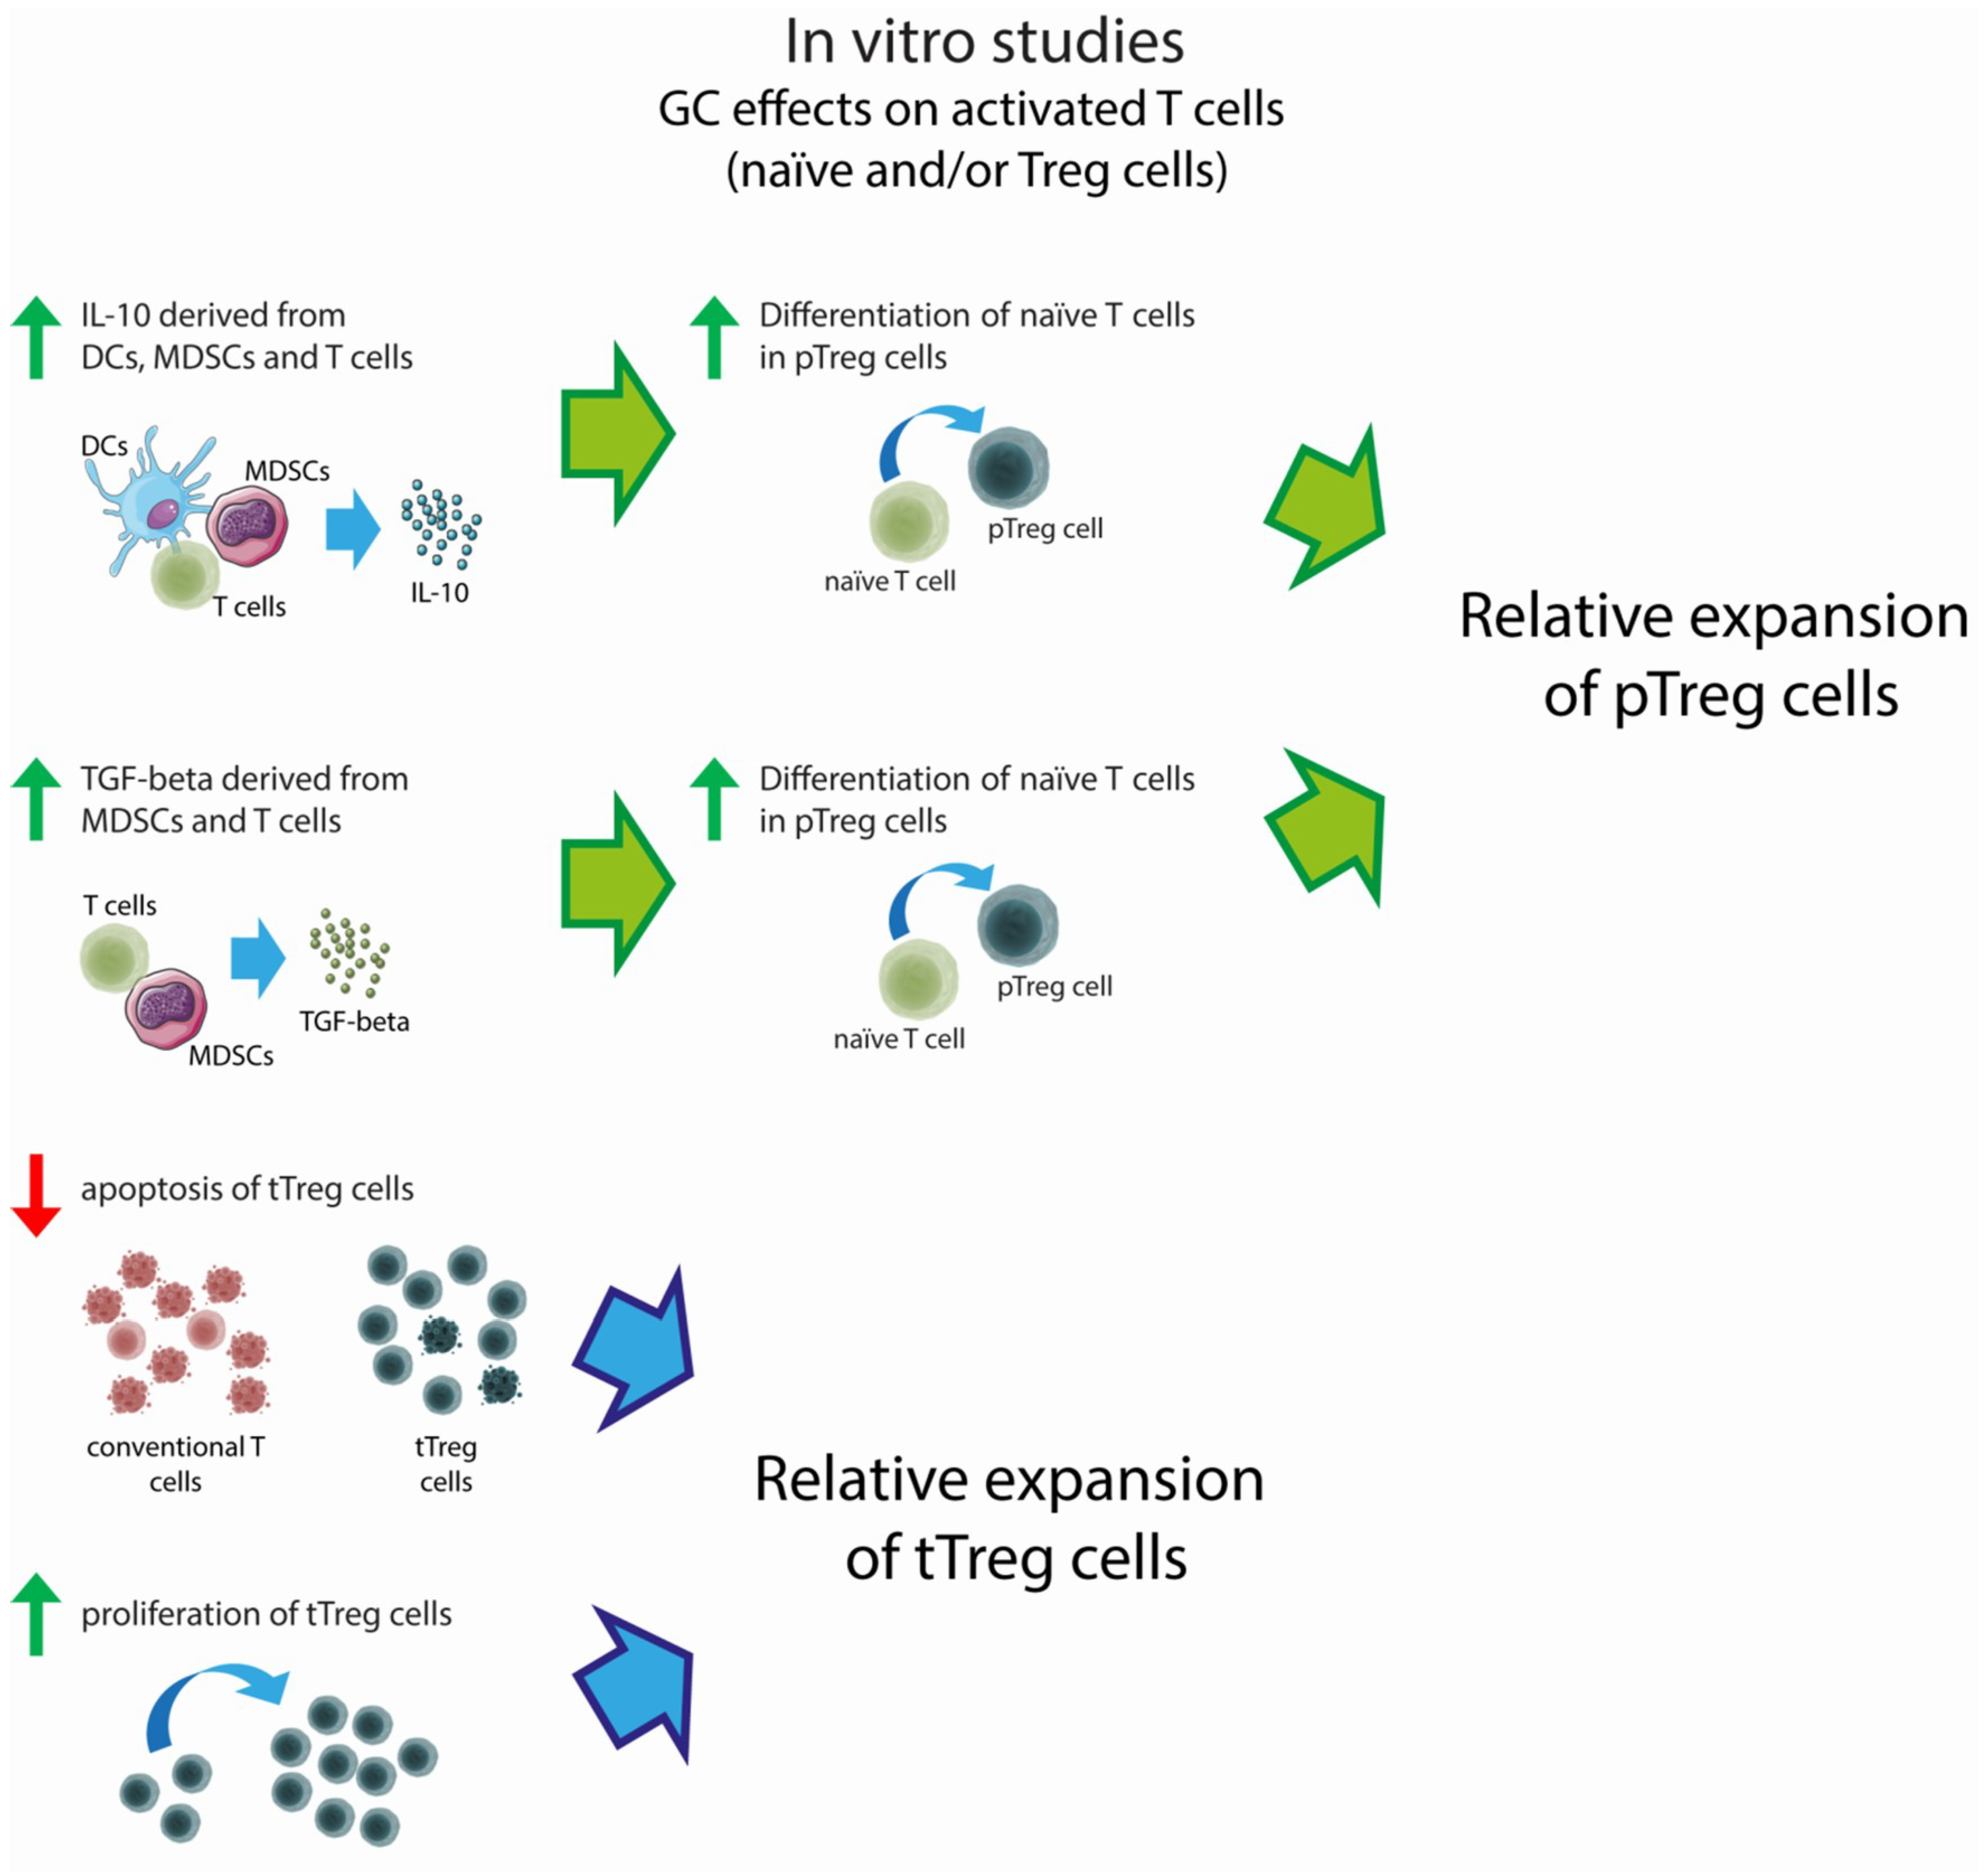
3.2. Effects on Activated Treg Cells
3.3. Effects on non-T Immune Cells
4. Effect of GCs on Treg Cell Number: In Vivo Findings in Healthy Humans and Animals
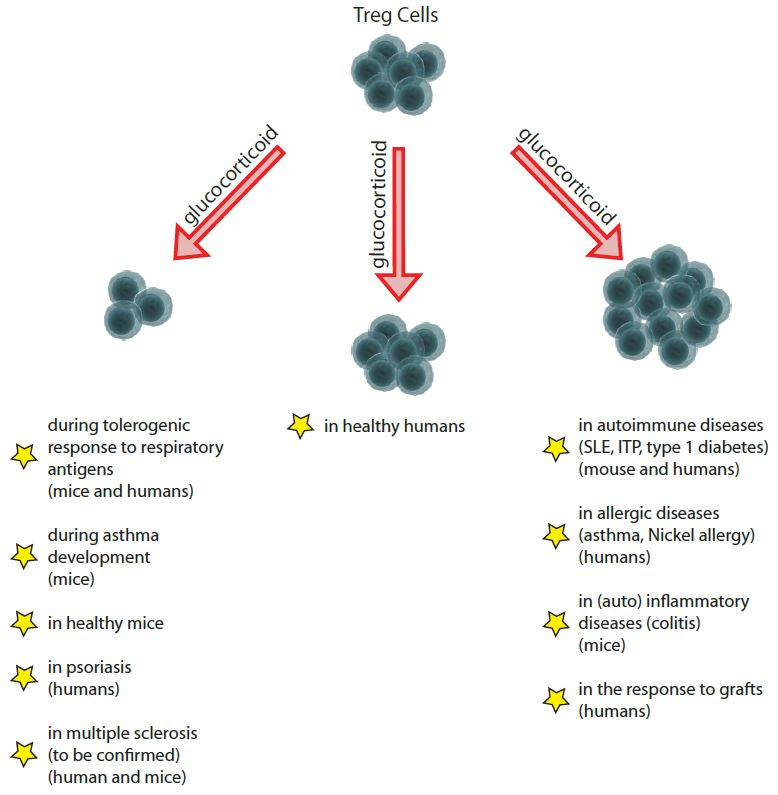
5. Effect of GCs on Treg Cell Number: In Vivo Findings during Development of Immune Response
5.1. Effects during the Tolerogenic Respiratory Response to Allergens and Sensitization to Respiratory Allergens
5.2. Effect during Immune Response against Alloantigens or Autoantigens in Systems Other Than the Respiratory System
5.3. Effect during Graft Response
6. Effect of GCs on Treg Cell Number: In Vivo Findings in Established Autoimmune, Allergic, and (auto)Inflammatory Diseases
6.1. Effects in Autoimmune Diseases
6.2. Effects in Asthma
6.3. Effects on Multiple Sclerosis
6.4. Effects on Skin Diseases
7. Effect of GCs on Treg Cell Number: In Vivo Findings in Tumors
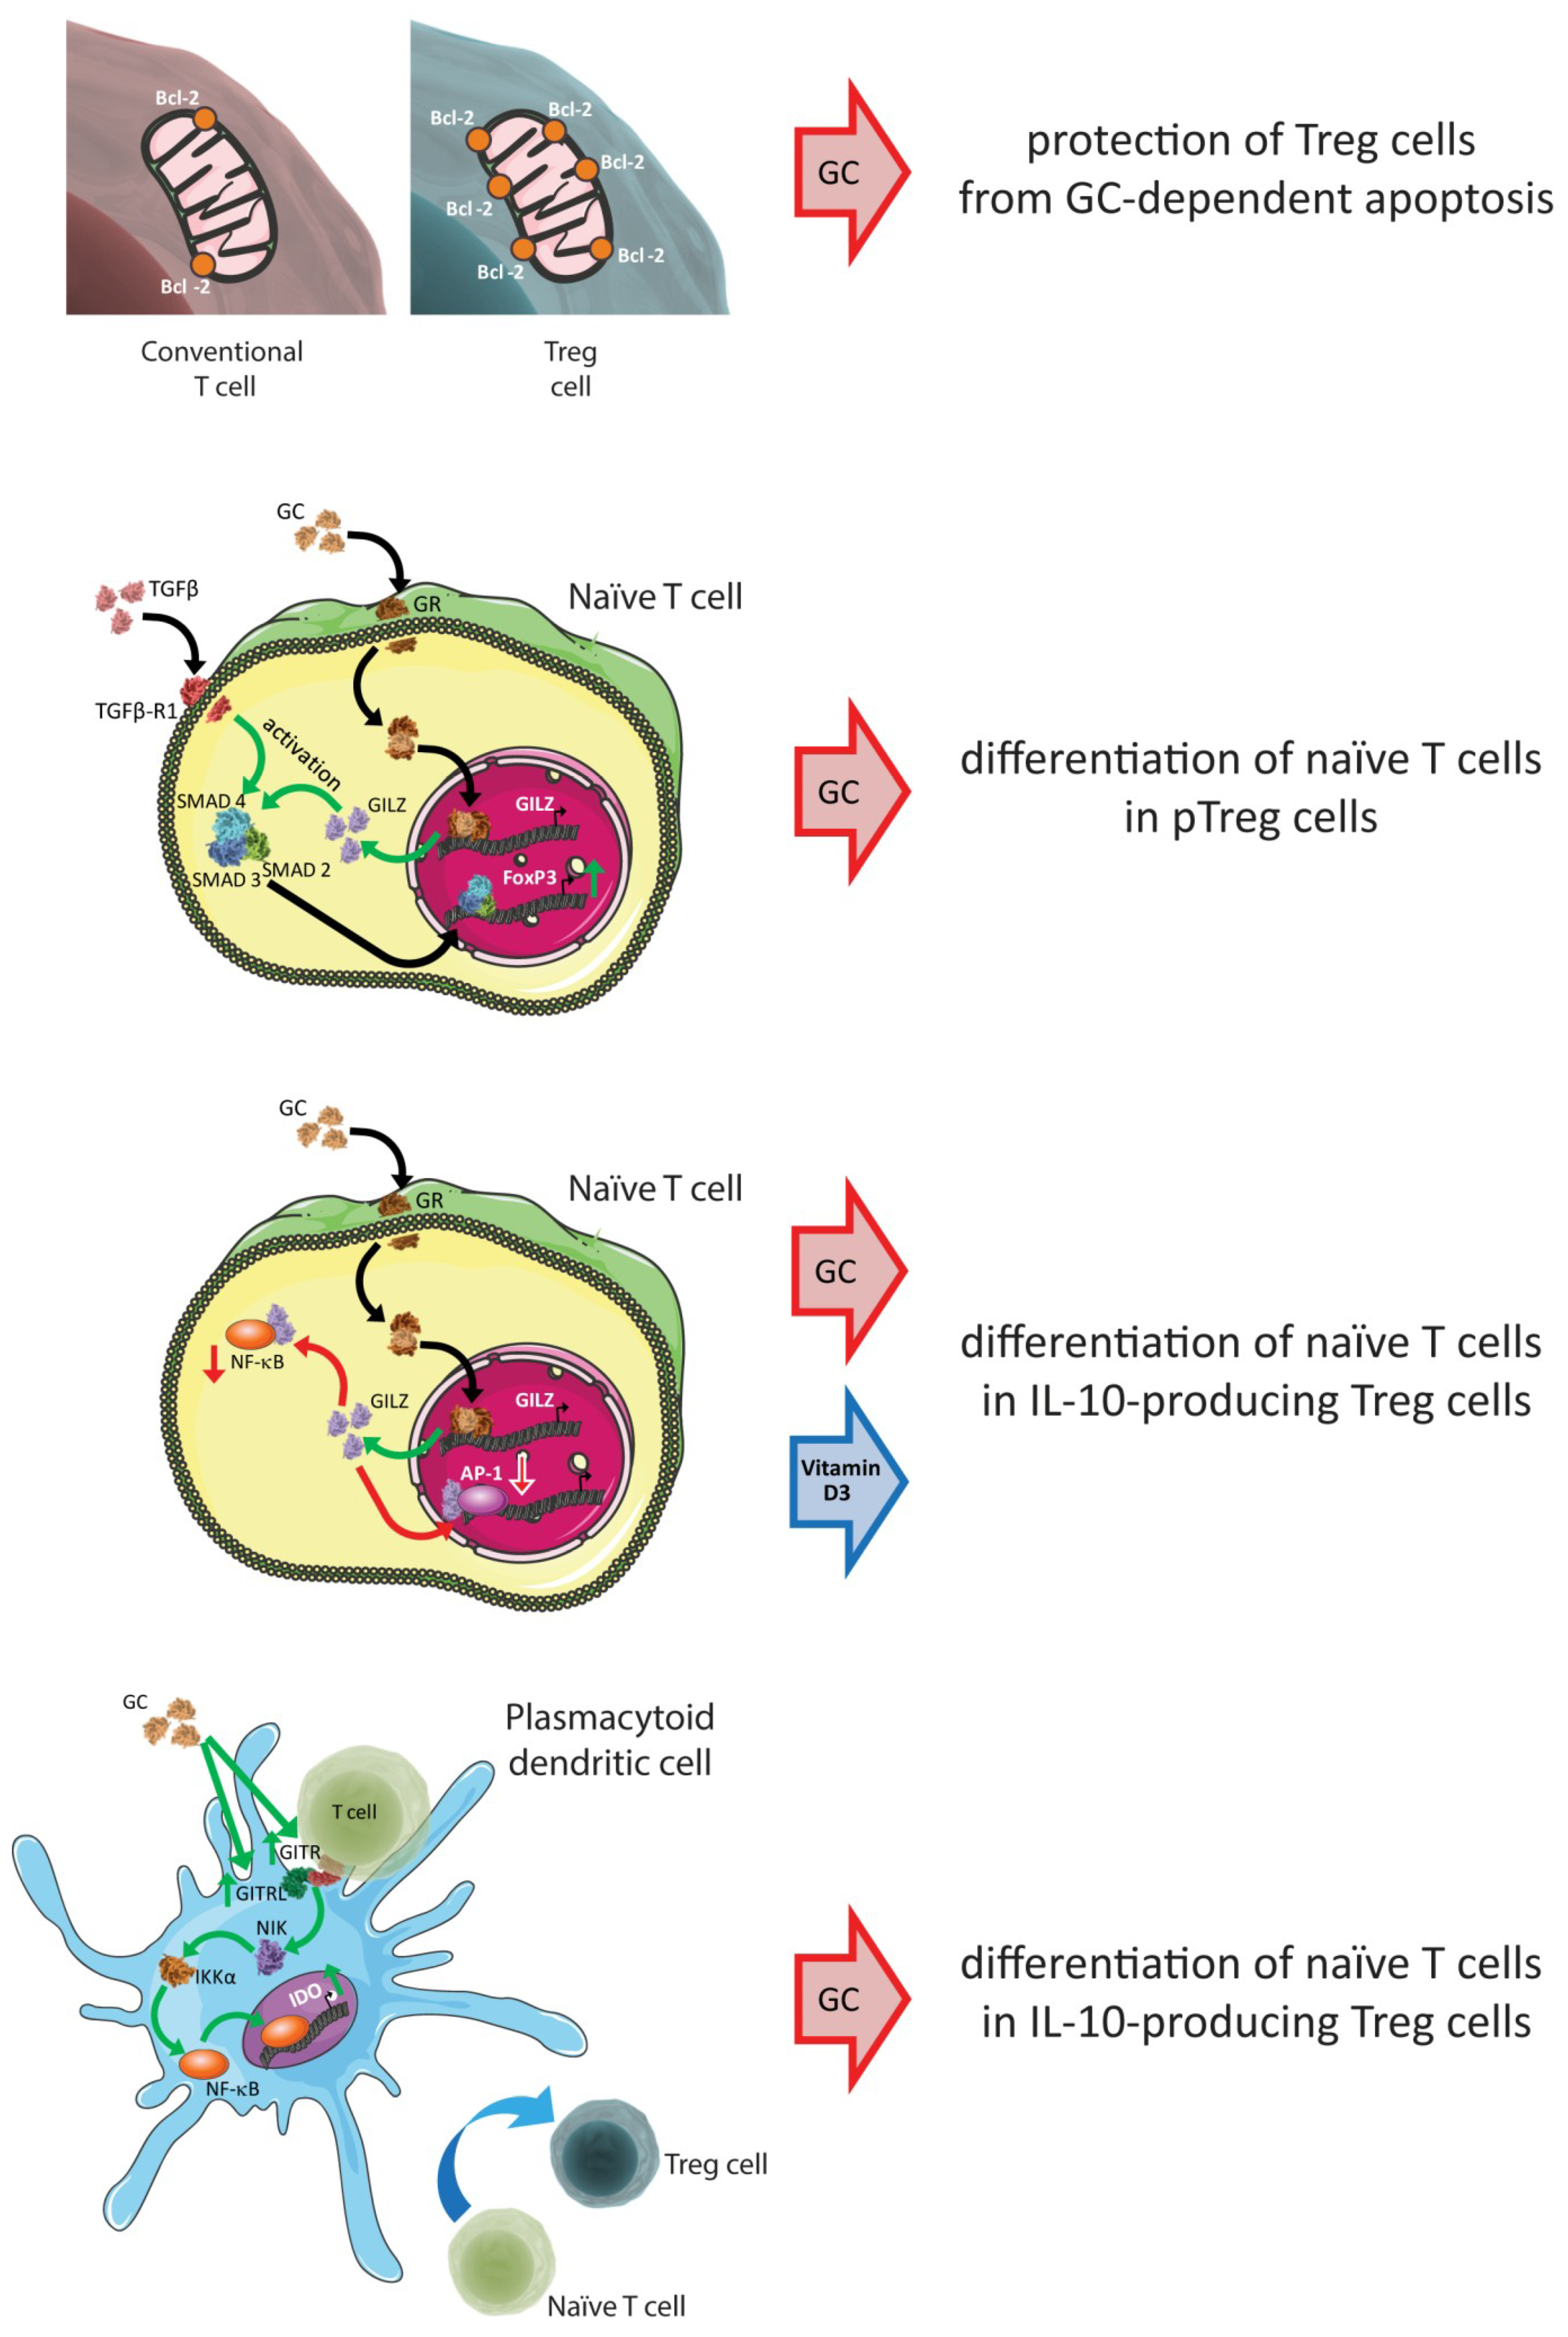
8. Key Signaling Molecules that Determine Treg Survival/Expansion/Differentiation
9. Concluding Remarks
Author Contributions
Funding
Acknowledgments
Conflicts of Interest
Abbreviations
References
- Cain, D.W.; Cidlowski, J.A. Immune regulation by glucocorticoids. Nat. Rev. Immunol. 2017, 17, 233–247. [Google Scholar] [CrossRef] [PubMed]
- Zielińska, K.A.; Van Moortel, L.; Opdenakker, G.; De Bosscher, K.; Van den Steen, P.E. Endothelial Response to Glucocorticoids in Inflammatory Diseases. Front. Immunol. 2016, 7, 592. [Google Scholar] [CrossRef] [PubMed]
- Perretti, M.; D’Acquisto, F. Annexin A1 and glucocorticoids as effectors of the resolution of inflammation. Nat. Rev. Immunol. 2009, 9, 62–70. [Google Scholar] [CrossRef] [PubMed]
- Oppong, E.; Cato, A.C.B. Effects of Glucocorticoids in the Immune System. In Glucocorticoid Signaling; Advances in Experimental Medicine and Biology; Wang, J.-C., Harris, C., Eds.; Springer: New York, NY, USA, 2015; Volume 872, pp. 217–233. ISBN 978-1-4939-2895-8. [Google Scholar]
- Nocentini, G.; Ronchetti, S.; Bruscoli, S.; Riccardi, C. The Clinical Pharmacology of Past, Present, and Future Glucocorticoids. In Systemic Corticosteroids for Inflammatory Disorders in Pediatrics; Cimaz, R., Ed.; Springer International Publishing: Cham, Switzerland, 2015; pp. 43–58. ISBN 978-3-319-16056-6. [Google Scholar]
- Nocentini, G.; Migliorati, G.; Riccardi, C. The Molecular and Cellular Mechanisms Responsible for the Anti-inflammatory and Immunosuppressive Effects of Glucocorticoids. In Systemic Corticosteroids for Inflammatory Disorders in Pediatrics; Cimaz, R., Ed.; Springer International Publishing: Cham, Switzerland, 2015; pp. 25–41. ISBN 978-3-319-16056-6. [Google Scholar]
- McColl, A.; Michlewska, S.; Dransfield, I.; Rossi, A.G. Effects of Glucocorticoids on Apoptosis and Clearance of Apoptotic Cells. Sci. World J. 2007, 7, 1165–1181. [Google Scholar] [CrossRef] [PubMed]
- Saffar, A.S.; Ashdown, H.; Gounni, A.S. The Molecular Mechanisms of Glucocorticoids-Mediated Neutrophil Survival. Curr. Drug Targets 2011, 12, 556–562. [Google Scholar] [CrossRef] [PubMed]
- Schweingruber, N.; Reichardt, S.D.; Lühder, F.; Reichardt, H.M. Mechanisms of Glucocorticoids in the Control of Neuroinflammation. J. Neuroendocrinol. 2012, 24, 174–182. [Google Scholar] [CrossRef] [PubMed]
- Pufall, M.A. Glucocorticoids and Cancer. Adv. Exp. Med. Biol. 2015, 872, 315–333. [Google Scholar] [PubMed] [Green Version]
- Mitre-Aguilar, I.B.; Cabrera-Quintero, A.J.; Zentella-Dehesa, A. Genomic and non-genomic effects of glucocorticoids: Implications for breast cancer. Int. J. Clin. Exp. Pathol. 2015, 8, 1–10. [Google Scholar] [PubMed]
- Viegas, L.R.; Hoijman, E.; Beato, M.; Pecci, A. Mechanisms involved in tissue-specific apopotosis regulated by glucocorticoids. J. Steroid Biochem. Mol. Biol. 2008, 109, 273–278. [Google Scholar] [CrossRef] [PubMed]
- Ferrara, G.; Petrillo, G.M.; Giani, T.; Marrani, E.; Filippeschi, C.; Oranges, T.; Simonini, G.; Cimaz, R. Clinical Use and Molecular Action of Corticosteroids in the Pediatric Age. Int. J. Mol. Sci. 2019, 20, 444. [Google Scholar] [CrossRef] [PubMed]
- Vandewalle, J.; Luypaert, A.; De Bosscher, K.; Libert, C. Therapeutic Mechanisms of Glucocorticoids. Trends Endocrinol. Metab. 2018, 29, 42–54. [Google Scholar] [CrossRef] [PubMed]
- Adcock, I.M.; Caramori, G. Cross-talk between pro-inflammatory transcription factors and glucocorticoids. Immunol. Cell Biol. 2001, 79, 376–384. [Google Scholar] [CrossRef] [PubMed] [Green Version]
- Straub, R.H.; Cutolo, M. Glucocorticoids and chronic inflammation. Rheumatology 2016, 55, ii6–ii14. [Google Scholar] [CrossRef] [PubMed]
- Beck, I.M.E.; Vanden Berghe, W.; Vermeulen, L.; Yamamoto, K.R.; Haegeman, G.; De Bosscher, K. Crosstalk in Inflammation: The Interplay of Glucocorticoid Receptor-Based Mechanisms and Kinases and Phosphatases. Endocr. Rev. 2009, 30, 830–882. [Google Scholar] [CrossRef] [PubMed] [Green Version]
- Surjit, M.; Ganti, K.P.; Mukherji, A.; Ye, T.; Hua, G.; Metzger, D.; Li, M.; Chambon, P. Widespread Negative Response Elements Mediate Direct Repression by Agonist- Liganded Glucocorticoid Receptor. Cell 2011, 145, 224–241. [Google Scholar] [CrossRef] [PubMed] [Green Version]
- Ayroldi, E.; Cannarile, L.; Migliorati, G.; Nocentini, G.; Delfino, D.V.; Riccardi, C. Mechanisms of the anti-inflammatory effects of glucocorticoids: Genomic and nongenomic interference with MAPK signaling pathways. FASEB J. 2012, 26, 4805–4820. [Google Scholar] [CrossRef] [PubMed]
- Busillo, J.M.; Cidlowski, J.A. The five Rs of glucocorticoid action during inflammation: Ready, reinforce, repress, resolve, and restore. Trends Endocrinol. Metab. 2013, 24, 109–119. [Google Scholar] [CrossRef] [PubMed]
- Vandevyver, S.; Dejager, L.; Tuckermann, J.; Libert, C. New Insights into the Anti-inflammatory Mechanisms of Glucocorticoids: An Emerging Role for Glucocorticoid-Receptor-Mediated Transactivation. Endocrinology 2013, 154, 993–1007. [Google Scholar] [CrossRef] [PubMed] [Green Version]
- Ronchetti, S.; Migliorati, G.; Riccardi, C. Glucocorticoid-Induced Immunomodulation. In Molecular Immunotoxicology; Wiley Online Books; Wiley-VCH Verlag GmbH & Co. KGaA: Weinheim, Germany, 2014; pp. 209–226. ISBN 9783527676965. [Google Scholar]
- Strehl, C.; Buttgereit, F. Unraveling the functions of the membrane-bound glucocorticoid receptors: First clues on origin and functional activity. Ann. N. Y. Acad. Sci. 2014, 1318, 1–6. [Google Scholar] [CrossRef] [PubMed]
- De Lucena, D.D.; Rangel, É.B. Glucocorticoids use in kidney transplant setting. Expert Opin. Drug Metab. Toxicol. 2018, 14, 1023–1041. [Google Scholar] [CrossRef] [PubMed]
- Pazdrak, K.; Kurosky, A. Functional Proteomics for the Characterization of Impaired Cellular Responses to Glucocorticoids in Asthma. Adv. Exp. Med. Biol. 2014, 795, 255–270. [Google Scholar] [PubMed]
- Oray, M.; Abu Samra, K.; Ebrahimiadib, N.; Meese, H.; Foster, C.S. Long-term side effects of glucocorticoids. Expert Opin. Drug Saf. 2016, 15, 457–465. [Google Scholar] [CrossRef] [PubMed]
- De Bosscher, K.; Vanden Berghe, W.; Haegeman, G. Cross-talk between nuclear receptors and nuclear factor κB. Oncogene 2006, 25, 6868. [Google Scholar] [CrossRef] [PubMed]
- Liberman, A.C.; Refojo, D.; Druker, J.; Toscano, M.; Rein, T.; Holsboer, F.; Arzt, E. The activated glucocorticoid receptor inhibits the transcription factor T-bet by direct protein-protein interaction. FASEB J. 2007, 21, 1177–1188. [Google Scholar] [CrossRef] [PubMed]
- Hirsch, G.; Lavoie-Lamoureux, A.; Beauchamp, G.; Lavoie, J.-P. Neutrophils Are Not Less Sensitive Than Other Blood Leukocytes to the Genomic Effects of Glucocorticoids. PLoS ONE 2012, 7, e44606. [Google Scholar] [CrossRef] [PubMed]
- Bush, K.A.; Krukowski, K.; Eddy, J.L.; Janusek, L.W.; Mathews, H.L. Glucocorticoid receptor mediated suppression of natural killer cell activity: Identification of associated deacetylase and corepressor molecules. Cell. Immunol. 2012, 275, 80–89. [Google Scholar] [CrossRef] [PubMed] [Green Version]
- Matyszak, M.K.; Citterio, S.; Rescigno, M.; Ricciardi-Castagnoli, P. Differential effects of corticosteroids during different stages of dendritic cell maturation. Eur. J. Immunol. 2000, 30, 1233–1242. [Google Scholar] [CrossRef] [Green Version]
- Hamdi, H.; Godot, V.; Maillot, M.-C.; Prejean, M.V.; Cohen, N.; Krzysiek, R.; Lemoine, F.M.; Zou, W.; Emilie, D. Induction of antigen-specific regulatory T lymphocytes by human dendritic cells expressing the glucocorticoid-induced leucine zipper. Blood 2007, 110, 211–219. [Google Scholar] [CrossRef] [PubMed] [Green Version]
- Riccardi, C.; Bruscoli, S.; Ayroldi, E.; Agostini, M.; Migliorati, G. GILZ, a glucocorticoid hormone induced gene, modulates T lymphocytes activation and death through interaction with NF-kB. In Progress in Basic and Clinical Immunology; Mackiewicz, A., Kurpisz, M., Żeromski, J., Eds.; Springer: Boston, MA, USA, 2001; pp. 31–39. ISBN 978-1-4615-0685-0. [Google Scholar]
- Ehrchen, J.; Steinmuller, L.; Barczyk, K.; Tenbrock, K.; Nacken, W.; Eisenacher, M.; Nordhues, U.; Sorg, C.; Sunderkotter, C.; Roth, J. Glucocorticoids induce differentiation of a specifically activated, anti-inflammatory subtype of human monocytes. Blood 2006, 109, 1265–1274. [Google Scholar] [CrossRef] [PubMed] [Green Version]
- Heideveld, E.; Hampton-O’Neil, L.A.; Cross, S.J.; van Alphen, F.P.J.; van den Biggelaar, M.; Toye, A.M.; van den Akker, E. Glucocorticoids induce differentiation of monocytes towards macrophages that share functional and phenotypical aspects with erythroblastic island macrophages. Haematologica 2018, 103, 395–405. [Google Scholar] [CrossRef] [PubMed]
- Tang, Z.; Niven-Fairchild, T.; Tadesse, S.; Norwitz, E.R.; Buhimschi, C.S.; Buhimschi, I.A.; Guller, S. Glucocorticoids Enhance CD163 Expression in Placental Hofbauer Cells. Endocrinology 2013, 154, 471–482. [Google Scholar] [CrossRef] [PubMed] [Green Version]
- Ashwell, J.D.; Lu, F.W.M.; Vacchio, M.S. Glucocorticoids in T Cell Development and Function. Annu. Rev. Immunol. 2000, 18, 309–345. [Google Scholar] [CrossRef] [PubMed]
- Bianchini, R.; Nocentini, G.; Krausz, L.T.; Fettucciari, K.; Coaccioli, S.; Ronchetti, S.; Riccardi, C. Modulation of Pro- and Antiapoptotic Molecules in Double-Positive (CD4+CD8+) Thymocytes following Dexamethasone Treatment. J. Pharmacol. Exp. Ther. 2006, 319, 887–897. [Google Scholar] [CrossRef] [PubMed] [Green Version]
- Pálinkás, L.; Talabér, G.; Boldizsár, F.; Bartis, D.; Németh, P.; Berki, T. Developmental shift in TcR-mediated rescue of thymocytes from glucocorticoid-induced apoptosis. Immunobiology 2008, 213, 39–50. [Google Scholar] [CrossRef] [PubMed]
- Ramírez, F.; Fowell, D.J.; Puklavec, M.; Simmonds, S.; Mason, D. Glucocorticoids promote a TH2 cytokine response by CD4+ T cells in vitro. J. Immunol. 1996, 156, 2406–2412. [Google Scholar] [PubMed]
- Liberman, A.C.; Druker, J.; Refojo, D.; Holsboer, F.; Arzt, E. Glucocorticoids inhibit GATA-3 phosphorylation and activity in T cells. FASEB J. 2009, 23, 1558–1571. [Google Scholar] [CrossRef] [PubMed]
- Petrillo, M.G.; Fettucciari, K.; Montuschi, P.; Ronchetti, S.; Cari, L.; Migliorati, G.; Mazzon, E.; Bereshchenko, O.; Bruscoli, S.; Nocentini, G.; et al. Transcriptional regulation of kinases downstream of the T cell receptor: Another immunomodulatory mechanism of glucocorticoids. BMC Pharmacol. Toxicol. 2014, 15, 35. [Google Scholar] [CrossRef] [PubMed]
- Flammer, J.R.; Rogatsky, I. Minireview: Glucocorticoids in Autoimmunity: Unexpected Targets and Mechanisms. Mol. Endocrinol. 2011, 25, 1075–1086. [Google Scholar] [CrossRef] [PubMed] [Green Version]
- Momčilović, M.; Miljković, Ž.; Popadić, D.; Marković, M.; Savić, E.; Ramić, Z.; Miljković, D.; Mostarica-Stojković, M. Methylprednisolone inhibits interleukin-17 and interferon-gamma expression by both naive and primed T cells. BMC Immunol. 2008, 9, 47. [Google Scholar] [CrossRef] [PubMed]
- Zacharchuk, C.M.; Merćep, M.; Chakraborti, P.K.; Simons, S.S.; Ashwell, J.D. Programmed T lymphocyte death. Cell activation- and steroid-induced pathways are mutually antagonistic. J. Immunol. 1990, 145, 4037–4045. [Google Scholar] [PubMed]
- Nocentini, G.; Cari, L.; Migliorati, G.; Riccardi, C. Treatment of Autoimmune Diseases and Prevention of Transplant Rejection and Graft-Versus-Host Disease by Regulatory T Cells: The State of the Art and Perspectives. In The Epigenetics of Autoimmunity; Elsevier: Amsterdam, The Netherlands, 2018; Volume 5, pp. 321–357. ISBN 2542-5358. [Google Scholar]
- Daryabor, G.; Kabelitz, D.; Kalantar, K. An update on immune dysregulation in obesity-related insulin resistance. Scand. J. Immunol. 2018, e12747. [Google Scholar] [CrossRef] [PubMed]
- Nosalski, R.; McGinnigle, E.; Siedlinski, M.; Guzik, T.J. Novel Immune Mechanisms in Hypertension and Cardiovascular Risk. Curr. Cardiovasc. Risk Rep. 2017, 11, 12. [Google Scholar] [CrossRef] [PubMed]
- Scott, B.N.V.; Sarkar, T.; Kratofil, R.M.; Kubes, P.; Thanabalasuriar, A. Unraveling the host’s immune response to infection: Seeing is believing. J. Leukoc. Biol. 2019. [Google Scholar] [CrossRef] [PubMed]
- David, T.; Ling, S.F.; Barton, A. Genetics of immune-mediated inflammatory diseases. Clin. Exp. Immunol. 2018, 193, 3–12. [Google Scholar] [CrossRef] [PubMed] [Green Version]
- Vignali, D.A.A.; Collison, L.W.; Workman, C.J. How regulatory T cells work. Nat. Rev. Immunol. 2008, 8, 523–532. [Google Scholar] [CrossRef] [PubMed] [Green Version]
- Lawson, C.A.; Brown, A.K.; Bejarano, V.; Douglas, S.H.; Burgoyne, C.H.; Greenstein, A.S.; Boylston, A.W.; Emery, P.; Ponchel, F.; Isaacs, J.D. Early rheumatoid arthritis is associated with a deficit in the CD4+CD25high regulatory T cell population in peripheral blood. Rheumatology 2006, 45, 1210–1217. [Google Scholar] [CrossRef] [PubMed] [Green Version]
- Gerli, R.; Nocentini, G.; Alunno, A.; Bocci, E.B.; Bianchini, R.; Bistoni, O.; Riccardi, C. Identification of regulatory T cells in systemic lupus erythematosus. Autoimmun. Rev. 2009, 8, 426–430. [Google Scholar] [CrossRef] [PubMed]
- Miyara, M.; Gorochov, G.; Ehrenstein, M.; Musset, L.; Sakaguchi, S.; Amoura, Z. Human FoxP3+ regulatory T cells in systemic autoimmune diseases. Autoimmun. Rev. 2011, 10, 744–755. [Google Scholar] [CrossRef] [PubMed]
- Petrillo, M.G.; Ronchetti, S.; Ricci, E.; Alunno, A.; Gerli, R.; Nocentini, G.; Riccardi, C. GITR+ regulatory T cells in the treatment of autoimmune diseases. Autoimmun. Rev. 2015, 14, 117–126. [Google Scholar] [CrossRef] [PubMed]
- Brusko, T.M.; Putnam, A.L.; Bluestone, J.A. Human regulatory T cells: Role in autoimmune disease and therapeutic opportunities. Immunol. Rev. 2008, 223, 371–390. [Google Scholar] [CrossRef] [PubMed]
- Long, S.A.; Buckner, J.H. CD4+FOXP3+ T Regulatory Cells in Human Autoimmunity: More Than a Numbers Game. J. Immunol. 2011, 187, 2061–2066. [Google Scholar] [CrossRef] [PubMed] [Green Version]
- Nocentini, G.; Alunno, A.; Petrillo, M.G.; Bistoni, O.; Bartoloni, E.; Caterbi, S.; Ronchetti, S.; Migliorati, G.; Riccardi, C.; Gerli, R. Expansion of regulatory GITR+CD25low/−CD4+ T cells in systemic lupus erythematosus patients. Arthritis Res. Ther. 2014, 16, 444. [Google Scholar] [CrossRef] [PubMed]
- Bonelli, M.; Savitskaya, A.; Steiner, C.-W.; Rath, E.; Smolen, J.S.; Scheinecker, C. Phenotypic and Functional Analysis of CD4+CD25-Foxp3+ T Cells in Patients with Systemic Lupus Erythematosus. J. Immunol. 2009, 182, 1689–1695. [Google Scholar] [CrossRef] [PubMed] [Green Version]
- Whiteside, T.L. What are regulatory T cells (Treg) regulating in cancer and why? Semin. Cancer Biol. 2012, 22, 327–334. [Google Scholar] [CrossRef] [PubMed] [Green Version]
- Cari, L.; Nocentini, G.; Migliorati, G.; Riccardi, C. Potential effect of tumor-specific Treg-targeted antibodies in the treatment of human cancers: A bioinformatics analysis. Oncoimmunology 2018, 7, e1387705. [Google Scholar] [CrossRef] [PubMed]
- Niccolai, E.; Ricci, F.; Russo, E.; Nannini, G.; Emmi, G.; Taddei, A.; Ringressi, M.N.; Melli, F.; Miloeva, M.; Cianchi, F.; et al. The Different Functional Distribution of “Not Effector” T Cells (Treg/Tnull) in Colorectal Cancer. Front. Immunol. 2017, 8, 1900. [Google Scholar] [CrossRef] [PubMed]
- Chaput, N.; Louafi, S.; Bardier, A.; Charlotte, F.; Vaillant, J.-C.; Ménégaux, F.; Rosenzwajg, M.; Lemoine, F.; Klatzmann, D.; Taieb, J. Identification of CD8+CD25+Foxp3+ suppressive T cells in colorectal cancer tissue. Gut 2009, 58, 520–529. [Google Scholar] [CrossRef] [PubMed]
- Amedei, A.; Niccolai, E.; Benagiano, M.; Della Bella, C.; Cianchi, F.; Bechi, P.; Taddei, A.; Bencini, L.; Farsi, M.; Cappello, P.; et al. Ex vivo analysis of pancreatic cancer-infiltrating T lymphocytes reveals that ENO-specific Tregs accumulate in tumor tissue and inhibit Th1/Th17 effector cell functions. Cancer Immunol. Immunother. 2013, 62, 1249–1260. [Google Scholar] [CrossRef] [PubMed]
- Wang, M.; Chen, B.; Sun, X.-X.; Zhao, X.-D.; Zhao, Y.-Y.; Sun, L.; Xu, C.-G.; Shen, B.; Su, Z.-L.; Xu, W.-R.; et al. Gastric cancer tissue-derived mesenchymal stem cells impact peripheral blood mononuclear cells via disruption of Treg/Th17 balance to promote gastric cancer progression. Exp. Cell Res. 2017, 361, 19–29. [Google Scholar] [CrossRef] [PubMed]
- Arpaia, N.; Green, J.A.; Moltedo, B.; Arvey, A.; Hemmers, S.; Yuan, S.; Treuting, P.M.; Rudensky, A.Y. A Distinct Function of Regulatory T Cells in Tissue Protection. Cell 2015, 162, 1078–1089. [Google Scholar] [CrossRef] [PubMed] [Green Version]
- Burzyn, D.; Kuswanto, W.; Kolodin, D.; Shadrach, J.L.; Cerletti, M.; Jang, Y.; Sefik, E.; Tan, T.G.; Wagers, A.J.; Benoist, C.; et al. A Special Population of Regulatory T Cells Potentiates Muscle Repair. Cell 2013, 155, 1282–1295. [Google Scholar] [CrossRef] [PubMed] [Green Version]
- Mock, J.R.; Garibaldi, B.T.; Aggarwal, N.R.; Jenkins, J.; Limjunyawong, N.; Singer, B.D.; Chau, E.; Rabold, R.; Files, D.C.; Sidhaye, V.; et al. Foxp3+ regulatory T cells promote lung epithelial proliferation. Mucosal Immunol. 2014, 7, 1440–1451. [Google Scholar] [CrossRef] [PubMed] [Green Version]
- Sakaguchi, S.; Sakaguchi, N.; Asano, M.; Itoh, M.; Toda, M. Immunologic self-tolerance maintained by activated T cells expressing IL-2 receptor alpha-chains (CD25). Breakdown of a single mechanism of self-tolerance causes various autoimmune diseases. J. Immunol. 1995, 155, 1151–1164. [Google Scholar] [PubMed]
- Wildin, R.S.; Ramsdell, F.; Peake, J.; Faravelli, F.; Casanova, J.-L.; Buist, N.; Levy-Lahad, E.; Mazzella, M.; Goulet, O.; Perroni, L.; et al. X-linked neonatal diabetes mellitus, enteropathy and endocrinopathy syndrome is the human equivalent of mouse scurfy. Nat. Genet. 2001, 27, 18–20. [Google Scholar] [CrossRef] [PubMed]
- Hori, S.; Nomura, T.; Sakaguchi, S. Control of regulatory T cell development by the transcription factor Foxp3. Science 2003, 299, 1057–1061. [Google Scholar] [CrossRef] [PubMed]
- Rodríguez-Perea, A.L.; Arcia, E.D.; Rueda, C.M.; Velilla, P.A. Phenotypical characterization of regulatory T cells in humans and rodents. Clin. Exp. Immunol. 2016, 185, 281–291. [Google Scholar] [CrossRef] [PubMed]
- Baecher-Allan, C.; Wolf, E.; Hafler, D.A. MHC Class II Expression Identifies Functionally Distinct Human Regulatory T Cells. J. Immunol. 2006, 176, 4622–4631. [Google Scholar] [CrossRef] [PubMed] [Green Version]
- Gavin, M.A.; Torgerson, T.R.; Houston, E.; DeRoos, P.; Ho, W.Y.; Stray-Pedersen, A.; Ocheltree, E.L.; Greenberg, P.D.; Ochs, H.D.; Rudensky, A.Y. Single-cell analysis of normal and FOXP3-mutant human T cells: FOXP3 expression without regulatory T cell development. Proc. Natl. Acad. Sci. USA 2006, 103, 6659–6664. [Google Scholar] [CrossRef] [PubMed] [Green Version]
- Morgan, M.E.; van Bilsen, J.H.M.; Bakker, A.M.; Heemskerk, B.; Schilham, M.W.; Hartgers, F.C.; Elferink, B.G.; van der Zanden, L.; de Vries, R.R.P.; Huizinga, T.W.J.; et al. Expression of FOXP3 mRNA is not confined to CD4+CD25+ T regulatory cells in humans. Hum. Immunol. 2005, 66, 13–20. [Google Scholar] [CrossRef] [PubMed]
- Ziegler, S.F. FOXP3: Of Mice and Men. Annu. Rev. Immunol. 2006, 24, 209–226. [Google Scholar] [CrossRef] [PubMed]
- Abraham, M.; Karni, A.; Dembinsky, A.; Miller, A.; Gandhi, R.; Anderson, D.; Weiner, H.L. In vitro induction of regulatory T cells by anti-CD3 antibody in humans. J. Autoimmun. 2008, 30, 21–28. [Google Scholar] [CrossRef] [PubMed] [Green Version]
- Allan, S.E.; Passerini, L.; Bacchetta, R.; Crellin, N.; Dai, M.; Orban, P.C.; Ziegler, S.F.; Roncarolo, M.G.; Levings, M.K. The role of 2 FOXP3 isoforms in the generation of human CD4+ Tregs. J. Clin. Investig. 2005, 115, 3276–3284. [Google Scholar] [CrossRef] [PubMed] [Green Version]
- Allan, S.E.; Crome, S.Q.; Crellin, N.K.; Passerini, L.; Steiner, T.S.; Bacchetta, R.; Roncarolo, M.G.; Levings, M.K. Activation-induced FOXP3 in human T effector cells does not suppress proliferation or cytokine production. Int. Immunol. 2007, 19, 345–354. [Google Scholar] [CrossRef] [PubMed] [Green Version]
- Mahic, M.; Yaqub, S.; Bryn, T.; Henjum, K.; Eide, D.M.; Torgersen, K.M.; Aandahl, E.M.; Taskén, K. Differentiation of naive CD4+ T cells into CD4+CD25+FOXP3+ regulatory T cells by continuous antigen stimulation. J. Leukoc. Biol. 2008, 83, 1111–1117. [Google Scholar] [CrossRef] [PubMed]
- Verhasselt, V.; Vosters, O.; Beuneu, C.; Nicaise, C.; Stordeur, P.; Goldman, M. Induction of FOXP3-expressing regulatory CD4 pos T cells by human mature autologous dendritic cells. Eur. J. Immunol. 2004, 34, 762–772. [Google Scholar] [CrossRef] [PubMed]
- Walker, M.R.; Carson, B.D.; Nepom, G.T.; Ziegler, S.F.; Buckner, J.H. De novo generation of antigen-specific CD4+CD25+ regulatory T cells from human CD4+CD25– cells. Proc. Natl. Acad. Sci. USA 2005, 102, 4103–4108. [Google Scholar] [CrossRef] [PubMed]
- Walker, M.R.; Kasprowicz, D.J.; Gersuk, V.H.; Bènard, A.; Van Landeghen, M.; Buckner, J.H.; Ziegler, S.F. Induction of FoxP3 and acquisition of T regulatory activity by stimulated human CD4+CD25– T cells. J. Clin. Investig. 2003, 112, 1437–1443. [Google Scholar] [CrossRef] [PubMed] [Green Version]
- Wang, J.; Ioan-Facsinay, A.; van der Voort, E.I.H.; Huizinga, T.W.J.; Toes, R.E.M. Transient expression of FOXP3 in human activated nonregulatory CD4+ T cells. Eur. J. Immunol. 2007, 37, 129–138. [Google Scholar] [CrossRef] [PubMed] [Green Version]
- Seo, N.; Hayakawa, S.; Takigawa, M.; Tokura, Y. Interleukin-10 expressed at early tumour sites induces subsequent generation of CD4+ T-regulatory cells and systemic collapse of antitumour immunity. Immunology 2001, 103, 449–457. [Google Scholar] [CrossRef] [PubMed] [Green Version]
- Zheng, S.G.; Gray, J.D.; Ohtsuka, K.; Yamagiwa, S.; Horwitz, D.A. Generation ex vivo of TGF-beta-producing regulatory T cells from CD4+CD25– precursors. J. Immunol. 2002, 169, 4183–4189. [Google Scholar] [CrossRef] [PubMed]
- Chen, W.; Jin, W.; Hardegen, N.; Lei, K.; Li, L.; Marinos, N.; McGrady, G.; Wahl, S.M. Conversion of Peripheral CD4 + CD25 − Naive T Cells to CD4 + CD25 + Regulatory T Cells by TGF-β Induction of Transcription Factor Foxp3. J. Exp. Med. 2003, 198, 1875–1886. [Google Scholar] [CrossRef] [PubMed]
- Fantini, M.C.; Becker, C.; Monteleone, G.; Pallone, F.; Galle, P.R.; Neurath, M.F. Cutting Edge: TGF- Induces a Regulatory Phenotype in CD4+CD25- T Cells through Foxp3 Induction and Down-Regulation of Smad7. J. Immunol. 2004, 172, 5149–5153. [Google Scholar] [CrossRef] [PubMed] [Green Version]
- Chen, Y.; Kuchroo, V.; Inobe, J.; Hafler, D.; Weiner, H. Regulatory T cell clones induced by oral tolerance: Suppression of autoimmune encephalomyelitis. Science 80- 1994, 265, 1237–1240. [Google Scholar] [CrossRef]
- Carrier, Y.; Yuan, J.; Kuchroo, V.K.; Weiner, H.L. Th3 Cells in Peripheral Tolerance. I. Induction of Foxp3-Positive Regulatory T Cells by Th3 Cells Derived from TGF- T Cell-Transgenic Mice. J. Immunol. 2007, 178, 179–185. [Google Scholar] [CrossRef] [PubMed]
- Barrat, F.J.; Cua, D.J.; Boonstra, A.; Richards, D.F.; Crain, C.; Savelkoul, H.F.; de Waal-Malefyt, R.; Coffman, R.L.; Hawrylowicz, C.M.; O’Garra, A. In Vitro Generation of Interleukin 10–producing Regulatory CD4 + T Cells Is Induced by Immunosuppressive Drugs and Inhibited by T Helper Type 1 (Th1)– and Th2-inducing Cytokines. J. Exp. Med. 2002, 195, 603–616. [Google Scholar] [CrossRef] [PubMed]
- Roncarolo, M.G.; Gregori, S.; Bacchetta, R.; Battaglia, M. Tr1 Cells and the Counter-Regulation of Immunity: Natural Mechanisms and Therapeutic Applications. In Current Topics in Microbiology and Immunology; Springer-Verlag: Berlin, Germany; New York, NY, USA, 2014; Volume 380, pp. 39–68. ISBN 9783662434918. [Google Scholar]
- Groux, H.; O’Garra, A.; Bigler, M.; Rouleau, M.; Antonenko, S.; de Vries, J.E.; Roncarolo, M.G. A CD4+ T-cell subset inhibits antigen-specific T-cell responses and prevents colitis. Nature 1997, 389, 737–742. [Google Scholar] [CrossRef] [PubMed]
- Bianchini, R.; Bistoni, O.; Alunno, A.; Petrillo, M.G.; Ronchetti, S.; Sportoletti, P.; Bocci, E.B.; Nocentini, G.; Gerli, R.; Riccardi, C. CD4(+) CD25(low) GITR(+) cells: A novel human CD4(+) T-cell population with regulatory activity. Eur. J. Immunol. 2011, 41, 2269–2278. [Google Scholar] [CrossRef] [PubMed]
- Alunno, A.; Petrillo, M.G.; Nocentini, G.; Bistoni, O.; Bartoloni, E.; Caterbi, S.; Bianchini, R.; Baldini, C.; Nicoletti, I.; Riccardi, C.; et al. Characterization of a new regulatory CD4+ T cell subset in primary Sjögren’s syndrome. Rheumatology 2013, 52, 1387–1396. [Google Scholar] [CrossRef] [PubMed]
- Nocentini, G.; Cari, L.; Migliorati, G.; Riccardi, C. The role of GITR single-positive cells in immune homeostasis. Immunity Inflamm. Dis. 2017, 5, 4–6. [Google Scholar] [CrossRef] [PubMed]
- Stock, P.; Akbari, O.; Berry, G.; Freeman, G.J.; DeKruyff, R.H.; Umetsu, D.T. Induction of T helper type 1–like regulatory cells that express Foxp3 and protect against airway hyper-reactivity. Nat. Immunol. 2004, 5, 1149–1156. [Google Scholar] [CrossRef] [PubMed]
- Karagiannidis, C.; Akdis, M.; Holopainen, P.; Woolley, N.J.; Hense, G.; Rückert, B.; Mantel, P.-Y.; Menz, G.; Akdis, C.A.; Blaser, K.; et al. Glucocorticoids upregulate FOXP3 expression and regulatory T cells in asthma. J. Allergy Clin. Immunol. 2004, 114, 1425–1433. [Google Scholar] [CrossRef] [PubMed]
- Li, J.; Wang, Z.; Hu, S.; Zhao, X.; Cao, L. Correction of abnormal T cell subsets by high-dose dexamethasone in patients with chronic idiopathic thrombocytopenic purpura. Immunol. Lett. 2013, 154, 42–48. [Google Scholar] [CrossRef] [PubMed]
- Pandolfi, J.; Baz, P.; Fernández, P.; Discianni Lupi, A.; Payaslián, F.; Billordo, L.A.; Fainboim, L.; Arruvito, L. Regulatory and effector T-cells are differentially modulated by Dexamethasone. Clin. Immunol. 2013, 149, 400–410. [Google Scholar] [CrossRef] [PubMed]
- Chen, X.; Murakami, T.; Oppenheim, J.J.; Howard, O.M.Z. Differential response of murine CD4 + CD25 + and CD4 + CD25-T cells to dexamethasone-induced cell death. Eur. J. Immunol. 2004, 34, 859–869. [Google Scholar] [CrossRef] [PubMed]
- Prado, C.; Gómez, J.; López, P.; de Paz, B.; Gutiérrez, C.; Suárez, A. Dexamethasone upregulates FOXP3 expression without increasing regulatory activity. Immunobiology 2011, 216, 386–392. [Google Scholar] [CrossRef] [PubMed]
- Xiang, L.; Marshall, G.D. Immunomodulatory effects of dexamethasone on gene expression of cytokine and stress hormone receptors in peripheral blood mononuclear cells. Int. Immunopharmacol. 2013, 17, 556–560. [Google Scholar] [CrossRef] [PubMed]
- Peek, E.J.; Richards, D.F.; Faith, A.; Lavender, P.; Lee, T.H.; Corrigan, C.J.; Hawrylowicz, C.M. Interleukin-10–Secreting “Regulatory” T Cells Induced by Glucocorticoids and β 2-Agonists. Am. J. Respir. Cell Mol. Biol. 2005, 33, 105–111. [Google Scholar] [CrossRef] [PubMed]
- Nocentini, G.; Giunchi, L.; Ronchetti, S.; Krausz, L.T.; Bartoli, A.; Moraca, R.; Migliorati, G.; Riccardi, C. A new member of the tumor necrosis factor/nerve growth factor receptor family inhibits T cell receptor-induced apoptosis. Proc. Natl. Acad. Sci. USA 1997, 94, 6216–6221. [Google Scholar] [CrossRef] [PubMed] [Green Version]
- Ronchetti, S.; Ricci, E.; Petrillo, M.G.; Cari, L.; Migliorati, G.; Nocentini, G.; Riccardi, C. Glucocorticoid-induced tumour necrosis factor receptor-related protein: A key marker of functional regulatory T cells. J. Immunol. Res. 2015, 2015, 171520. [Google Scholar] [CrossRef] [PubMed]
- Chung, I.Y.; Dong, H.F.; Zhang, X.; Hassanein, N.M.A.; Howard, O.M.Z.; Oppenheim, J.J.; Chen, X. Effects of IL-7 and dexamethasone: Induction of CD25, the high affinity IL-2 receptor, on human CD4+ cells. Cell. Immunol. 2004, 232, 57–63. [Google Scholar] [CrossRef] [PubMed]
- Steinbrink, K.; Graulich, E.; Kubsch, S.; Knop, J.; Enk, A.H. CD4(+) and CD8(+) anergic T cells induced by interleukin-10-treated human dendritic cells display antigen-specific suppressor activity. Blood 2002, 99, 2468–2476. [Google Scholar] [CrossRef] [PubMed]
- Rea, D.; van Kooten, C.; van Meijgaarden, K.E.; Ottenhoff, T.H.; Melief, C.J.; Offringa, R. Glucocorticoids transform CD40-triggering of dendritic cells into an alternative activation pathway resulting in antigen-presenting cells that secrete IL-10. Blood 2000, 95, 3162–3167. [Google Scholar] [PubMed]
- Xystrakis, E.; Kusumakar, S.; Boswell, S.; Peek, E.; Urry, Z.; Richards, D.F.; Adikibi, T.; Pridgeon, C.; Dallman, M.; Loke, T.-K.; et al. Reversing the defective induction of IL-10-secreting regulatory T cells in glucocorticoid-resistant asthma patients. J. Clin. Investig. 2006, 116, 146–155. [Google Scholar] [CrossRef] [PubMed]
- Unger, W.W.J.; Laban, S.; Kleijwegt, F.S.; van der Slik, A.R.; Roep, B.O. Induction of Treg by monocyte-derived DC modulated by vitamin D 3 or dexamethasone: Differential role for PD-L1. Eur. J. Immunol. 2009, 39, 3147–3159. [Google Scholar] [CrossRef] [PubMed]
- Volchenkov, R.; Karlsen, M.; Jonsson, R.; Appel, S. Type 1 Regulatory T Cells and Regulatory B Cells Induced by Tolerogenic Dendritic Cells. Scand. J. Immunol. 2013, 77, 246–254. [Google Scholar] [CrossRef] [PubMed] [Green Version]
- Stary, G.; Klein, I.; Bauer, W.; Koszik, F.; Reininger, B.; Kohlhofer, S.; Gruber, K.; Skvara, H.; Jung, T.; Stingl, G. Glucocorticosteroids Modify Langerhans Cells to Produce TGF- and Expand Regulatory T Cells. J. Immunol. 2011, 186, 103–112. [Google Scholar] [CrossRef] [PubMed]
- Hou, Y.; Feng, Q.; Xu, M.; Li, G.-S.; Liu, X.-N.; Sheng, Z.; Zhou, H.; Ma, J.; Wei, Y.; Sun, Y.-X.; et al. High-dose dexamethasone corrects impaired myeloid-derived suppressor cell function via Ets1 in immune thrombocytopenia. Blood 2016, 127, 1587–1597. [Google Scholar] [CrossRef] [PubMed] [Green Version]
- Liao, J.; Wang, X.; Bi, Y.; Shen, B.; Shao, K.; Yang, H.; Lu, Y.; Zhang, Z.; Chen, X.; Liu, H.; et al. Dexamethasone potentiates myeloid-derived suppressor cell function in prolonging allograft survival through nitric oxide. J. Leukoc. Biol. 2014, 96, 675–684. [Google Scholar] [CrossRef] [PubMed] [Green Version]
- Nakao, T.; Nakamura, T.; Masuda, K.; Matsuyama, T.; Ushigome, H.; Ashihara, E.; Yoshimura, N. Dexamethasone Prolongs Cardiac Allograft Survival in a Murine Model Through Myeloid-derived Suppressor Cells. Transplant. Proc. 2018, 50, 299–304. [Google Scholar] [CrossRef] [PubMed]
- Chen, L.; Jondal, M.; Yakimchuk, K. Regulatory effects of dexamethasone on NK and T cell immunity. Inflammopharmacology 2018, 26, 1331–1338. [Google Scholar] [CrossRef] [PubMed]
- Ugor, E.; Prenek, L.; Pap, R.; Berta, G.; Ernszt, D.; Najbauer, J.; Németh, P.; Boldizsár, F.; Berki, T. Glucocorticoid hormone treatment enhances the cytokine production of regulatory T cells by upregulation of Foxp3 expression. Immunobiology 2018, 223, 422–431. [Google Scholar] [CrossRef] [PubMed]
- Sbiera, S.; Dexneit, T.; Reichardt, S.D.; Michel, K.D.; van den Brandt, J.; Schmull, S.; Kraus, L.; Beyer, M.; Mlynski, R.; Wortmann, S.; et al. Influence of Short-Term Glucocorticoid Therapy on Regulatory T Cells In Vivo. PLoS ONE 2011, 6, e24345. [Google Scholar] [CrossRef] [PubMed]
- Chen, X.; Oppenheim, J.J.; Winkler-Pickett, R.T.; Ortaldo, J.R.; Howard, O.M.Z. Glucocorticoid amplifies IL-2-dependent expansion of functional FoxP3+CD4+CD25+ T regulatory cellsin vivo and enhances their capacity to suppress EAE. Eur. J. Immunol. 2006, 36, 2139–2149. [Google Scholar] [CrossRef] [PubMed] [Green Version]
- Boivin, R.; Vargas, A.; Cano, P.; Lavoie, J.-P. Glucocorticosteroids administration is associated with increased regulatory T cells in equine asthmatic lungs. Vet. Immunol. Immunopathol. 2018, 201, 67–71. [Google Scholar] [CrossRef] [PubMed]
- Banica, L.; Banica, L.; Besliu, A.; Banica, L.; Besliu, A.; Pistol, G.; Banica, L.; Besliu, A.; Pistol, G.; Stavaru, C.; et al. Quantification and molecular characterization of regulatory T cells in connective tissue diseases. Autoimmunity 2009, 42, 41–49. [Google Scholar] [CrossRef] [PubMed]
- Zuśka-Prot, M.; Maślanka, T. Effect of inhaled and systemic glucocorticoid treatment on CD4+ regulatory and effector T cells in a mouse model of allergic asthma. Int. Immunopharmacol. 2017, 45, 98–109. [Google Scholar] [CrossRef] [PubMed]
- Kawalkowska, J.Z.; Hemmerle, T.; Pretto, F.; Matasci, M.; Neri, D.; Williams, R.O. Targeted IL-4 therapy synergizes with dexamethasone to induce a state of tolerance by promoting Treg cells and macrophages in mice with arthritis. Eur. J. Immunol. 2016, 46, 1246–1257. [Google Scholar] [CrossRef] [PubMed] [Green Version]
- Olsen, P.C.; Kitoko, J.Z.; Ferreira, T.P.; De-Azevedo, C.T.; Arantes, A.C.; Martins, Μ.A. Glucocorticoids decrease Treg cell numbers in lungs of allergic mice. Eur. J. Pharmacol. 2015, 747, 52–58. [Google Scholar] [CrossRef] [PubMed]
- Wu, K.; Ma, J.; Bai, W.; Cui, X.; Han, T.; Wang, S.; Xie, Y.; Xie, Y. Short-term intratracheal use of PEG-modified IL-2 and glucocorticoid persistently alleviates asthma in a mouse model. Sci. Rep. 2016, 6, 31562. [Google Scholar] [CrossRef] [PubMed] [Green Version]
- Zhu, J.; Liu, X.; Wang, W.; Ouyang, X.; Zheng, W.; Wang, Q. Altered expression of regulatory T and Th17 cells in murine bronchial asthma. Exp. Ther. Med. 2017, 14, 714–722. [Google Scholar] [CrossRef] [PubMed] [Green Version]
- Chen, A.; Geng, Y.; Ke, H.; Constant, L.; Yan, Z.; Pan, Y.; Lee, P.; Tan, I.; Williams, K.; George, S.; et al. Cutting Edge: Dexamethasone Potentiates the Responses of Both Regulatory T Cells and B-1 Cells to Antigen Immunization in the ApoE−/− Mouse Model of Atherosclerosis. J. Immunol. 2014, 193, 35–39. [Google Scholar] [CrossRef] [PubMed]
- You, P.; Chen, N.; Su, L.; Peng, T.; Chen, G.; Liu, Y. Local level of TGF-β1 determines the effectiveness of dexamethasone through regulating the balance of Treg/Th17 cells in TNBS-induced mouse colitis. Exp. Ther. Med. 2018, 15, 3639–3649. [Google Scholar] [CrossRef] [PubMed] [Green Version]
- Zhang, J.; Gao, W.; Yang, X.; Kang, J.; Zhang, Y.; Guo, Q.; Hu, Y.; Xia, G.; Kang, Y. Tolerogenic Vaccination Reduced Effector Memory CD4 T Cells and Induced Effector Memory Treg Cells for Type I Diabetes Treatment. PLoS ONE 2013, 8, e70056. [Google Scholar] [CrossRef] [PubMed]
- Wust, S.; van den Brandt, J.; Tischner, D.; Kleiman, A.; Tuckermann, J.P.; Gold, R.; Luhder, F.; Reichardt, H.M. Peripheral T Cells Are the Therapeutic Targets of Glucocorticoids in Experimental Autoimmune Encephalomyelitis. J. Immunol. 2008, 180, 8434–8443. [Google Scholar] [CrossRef] [PubMed] [Green Version]
- Hartl, D.; Koller, B.; Mehlhorn, A.T.; Reinhardt, D.; Nicolai, T.; Schendel, D.J.; Griese, M.; Krauss-Etschmann, S. Quantitative and functional impairment of pulmonary CD4+CD25hi regulatory T cells in pediatric asthma. J. Allergy Clin. Immunol. 2007, 119, 1258–1266. [Google Scholar] [CrossRef] [PubMed]
- Seissler, N.; Schmitt, E.; Hug, F.; Sommerer, C.; Zeier, M.; Schaier, M.; Steinborn, A. Methylprednisolone treatment increases the proportion of the highly suppressive HLA-DR+-Treg-cells in transplanted patients. Transpl. Immunol. 2012, 27, 157–161. [Google Scholar] [CrossRef] [PubMed]
- Azab, N.A.; Bassyouni, I.H.; Emad, Y.; Abd El-Wahab, G.A.; Hamdy, G.; Mashahit, M.A. CD4+CD25+ regulatory T cells (TREG) in Systemic Lupus Erythematosus (SLE) patients: The possible influence of treatment with corticosteroids. Clin. Immunol. 2008, 127, 151–157. [Google Scholar] [CrossRef] [PubMed]
- Mathian, A.; Jouenne, R.; Chader, D.; Cohen-Aubart, F.; Haroche, J.; Fadlallah, J.; Claër, L.; Musset, L.; Gorochov, G.; Amoura, Z.; et al. Regulatory T Cell Responses to High-Dose Methylprednisolone in Active Systemic Lupus Erythematosus. PLoS ONE 2015, 10, e0143689. [Google Scholar] [CrossRef] [PubMed]
- Suarez, A.; Lopez, P.; Gomez, J.; Gutierrez, C. Enrichment of CD4+ CD25high T cell population in patients with systemic lupus erythematosus treated with glucocorticoids. Ann. Rheum. Dis. 2006, 65, 1512–1517. [Google Scholar] [CrossRef] [PubMed] [Green Version]
- Zhang, B.; Zhang, X.; Tang, F.; Zhu, L.; Liu, Y. Reduction of forkhead box P3 levels in CD4 + CD25 high T cells in patients with new-onset systemic lupus erythematosus. Clin. Exp. Immunol. 2008, 153, 182–187. [Google Scholar] [CrossRef] [PubMed]
- Li, Z.; Mou, W.; Lu, G.; Cao, J.; He, X.; Pan, X.; Xu, K. Low-dose rituximab combined with short-term glucocorticoids up-regulates Treg cell levels in patients with immune thrombocytopenia. Int. J. Hematol. 2011, 93, 91–98. [Google Scholar] [CrossRef] [PubMed]
- Ling, Y.; Cao, X.; Yu, Z.; Ruan, C. Circulating dendritic cells subsets and CD4 + Foxp3 + regulatory T cells in adult patients with chronic ITP before and after treatment with high-dose dexamethasome. Eur. J. Haematol. 2007, 79, 310–316. [Google Scholar] [CrossRef] [PubMed]
- Keijsers, R.R.M.C.; Joosten, I.; Hendriks, A.G.M.; Koenen, H.J.P.M.; van Erp, P.E.J.; van de Kerkhof, P.C.M. Balance of Treg versus T-effector cells during systemic treatment with adalimumab and topical treatment with calcipotriol-betamethasone dipropionate ointment. Exp. Dermatol. 2015, 24, 65–67. [Google Scholar] [CrossRef] [PubMed]
- Braitch, M.; Harikrishnan, S.; Robins, R.A.; Nichols, C.; Fahey, A.J.; Showe, L.; Constantinescu, C.S. Glucocorticoids increase CD4 + CD25 high cell percentage and Foxp3 expression in patients with multiple sclerosis. Acta Neurol. Scand. 2009, 119, 239–245. [Google Scholar] [CrossRef] [PubMed]
- Muls, N.G.V.; Dang, H.A.; Sindic, C.J.M.; van Pesch, V. Regulation of Treg-associated CD39 in multiple sclerosis and effects of corticotherapy during relapse. Multiple Scler. J. 2015, 21, 1533–1545. [Google Scholar] [CrossRef] [PubMed]
- Stock, P.; Akbari, O.; DeKruyff, R.H.; Umetsu, D.T. Respiratory Tolerance Is Inhibited by the Administration of Corticosteroids. J. Immunol. 2005, 175, 7380–7387. [Google Scholar] [CrossRef] [PubMed] [Green Version]
- Akbari, O.; DeKruyff, R.H.; Umetsu, D.T. Pulmonary dendritic cells producing IL-10 mediate tolerance induced by respiratory exposure to antigen. Nat. Immunol. 2001, 2, 725–731. [Google Scholar] [CrossRef] [PubMed]
- Akdis, M.; Verhagen, J.; Taylor, A.; Karamloo, F.; Karagiannidis, C.; Crameri, R.; Thunberg, S.; Deniz, G.; Valenta, R.; Fiebig, H.; et al. Immune Responses in Healthy and Allergic Individuals Are Characterized by a Fine Balance between Allergen-specific T Regulatory 1 and T Helper 2 Cells. J. Exp. Med. 2004, 199, 1567–1575. [Google Scholar] [CrossRef] [PubMed] [Green Version]
- Wang, W.; Jiang, T.; Zhu, Z.; Cui, J.; Zhu, L.; Ma, Z. Dexamethasone suppresses allergic rhinitis and amplifies CD4 + Foxp3 + regulatory T cells in vitro. Int. Forum Allergy Rhinol. 2015, 5, 900–906. [Google Scholar] [CrossRef] [PubMed]
- Majak, P.; Rychlik, B.; Stelmach, I. The effect of oral steroids with and without vitamin D3 on early efficacy of immunotherapy in asthmatic children. Clin. Exp. Allergy 2009, 39, 1830–1841. [Google Scholar] [CrossRef] [PubMed]
- Kang, Y.; Xu, L.; Wang, B.; Chen, A.; Zheng, G. Cutting Edge: Immunosuppressant as Adjuvant for Tolerogenic Immunization. J. Immunol. 2008, 180, 5172–5176. [Google Scholar] [CrossRef] [PubMed] [Green Version]
- Luan, Y.; Mosheir, E.; Menon, M.C.; Wilson, D.; Woytovich, C.; Ochando, J.; Murphy, B. Monocytic Myeloid-Derived Suppressor Cells Accumulate in Renal Transplant Patients and Mediate CD4 + Foxp3 + Treg Expansion. Am. J. Transplant. 2013, 13, 3123–3131. [Google Scholar] [CrossRef] [PubMed] [Green Version]
- Baruch, K.; Rosenzweig, N.; Kertser, A.; Deczkowska, A.; Sharif, A.M.; Spinrad, A.; Tsitsou-Kampeli, A.; Sarel, A.; Cahalon, L.; Schwartz, M. Breaking immune tolerance by targeting Foxp3+ regulatory T cells mitigates Alzheimer’s disease pathology. Nat. Commun. 2015, 6, 7967. [Google Scholar] [CrossRef] [PubMed] [Green Version]
- Herr, I.; Ucur, E.; Herzer, K.; Okouoyo, S.; Ridder, R.; Krammer, P.H.; von Knebel Doeberitz, M.; Debatin, K.-M. Glucocorticoid cotreatment induces apoptosis resistance toward cancer therapy in carcinomas. Cancer Res. 2003, 63, 3112–3120. [Google Scholar] [PubMed]
- Gassler, N.; Zhang, C.; Wenger, T.; Schnabel, P.A.; Dienemann, H.; Debatin, K.-M.; Mattern, J.; Herr, I. Dexamethasone-induced cisplatin and gemcitabine resistance in lung carcinoma samples treated ex vivo. Br. J. Cancer 2005, 92, 1084–1088. [Google Scholar] [CrossRef] [PubMed] [Green Version]
- Sidler, D.; Renzulli, P.; Schnoz, C.; Berger, B.; Schneider-Jakob, S.; Flück, C.; Inderbitzin, D.; Corazza, N.; Candinas, D.; Brunner, T. Colon cancer cells produce immunoregulatory glucocorticoids. Oncogene 2011, 30, 2411–2419. [Google Scholar] [CrossRef] [PubMed] [Green Version]
- De Lorenzo, B.H.P.; Novaes e Brito, R.R.; Paslar Leal, T.; Piqueira Garcia, N.; Martins Dos Santos, R.M.; Alvares-Saraiva, A.M.; Perez Hurtado, E.C.; Braga Dos Reis, T.C.; Duarte Palma, B. Chronic Sleep Restriction Impairs the Antitumor Immune Response in Mice. Neuroimmunomodulation 2018, 25, 59–67. [Google Scholar] [CrossRef] [PubMed]
- Maxwell, R.; Luksik, A.S.; Garzon-Muvdi, T.; Hung, A.L.; Kim, E.S.; Wu, A.; Xia, Y.; Belcaid, Z.; Gorelick, N.; Choi, J.; et al. Contrasting impact of corticosteroids on anti-PD-1 immunotherapy efficacy for tumor histologies located within or outside the central nervous system. Oncoimmunology 2018, 7, e1500108. [Google Scholar] [CrossRef] [PubMed]
- Cook, A.M.; McDonnell, A.M.; Lake, R.A.; Nowak, A.K. Dexamethasone co-medication in cancer patients undergoing chemotherapy causes substantial immunomodulatory effects with implications for chemo-immunotherapy strategies. Oncoimmunology 2016, 5, e1066062. [Google Scholar] [CrossRef] [PubMed]
- Kostopoulou, O.N.; Mohammad, A.-A.; Bartek, J.; Winter, J.; Jung, M.; Stragliotto, G.; Söderberg-Nauclér, C.; Landázuri, N. Glucocorticoids promote a glioma stem cell-like phenotype and resistance to chemotherapy in human glioblastoma primary cells: Biological and prognostic significance. Int. J. Cancer 2018, 142, 1266–1276. [Google Scholar] [CrossRef] [PubMed]
- Muthu Raja, K.R.; Kovarova, L.; Hajek, R. Induction by lenalidomide and dexamethasone combination increases regulatory cells of patients with previously untreated multiple myeloma. Leuk. Lymphoma 2012, 53, 1406–1408. [Google Scholar] [CrossRef] [PubMed]
- Kim, E.J.; Lee, J.G.; Kim, J.Y.; Song, S.H.; Joo, D.J.; Huh, K.H.; Kim, M.S.; Kim, B.S.; Kim, Y.S. Enhanced immune-modulatory effects of thalidomide and dexamethasone co-treatment on T cell subsets. Immunology 2017, 152, 628–637. [Google Scholar] [CrossRef] [PubMed]
- Scott, G.B.; Carter, C.; Parrish, C.; Wood, P.M.; Cook, G. Downregulation of myeloma-induced ICOS-L and regulatory T cell generation by lenalidomide and dexamethasone therapy. Cell. Immunol. 2015, 297, 1–9. [Google Scholar] [CrossRef] [PubMed]
- Huang, S.-T.J.; Cidlowski, J.A. Phosphorylation status modulates Bcl-2 function during glucocorticoid-induced apoptosis in T lymphocytes. FASEB J. 2002, 16, 825–832. [Google Scholar] [CrossRef] [PubMed]
- Josefowicz, S.Z.; Lu, L.-F.; Rudensky, A.Y. Regulatory T Cells: Mechanisms of Differentiation and Function. Annu. Rev. Immunol. 2012, 30, 531–564. [Google Scholar] [CrossRef] [PubMed]
- Yadav, M.; Stephan, S.; Bluestone, J.A. Peripherally Induced Tregs—Role in Immune Homeostasis and Autoimmunity. Front. Immunol. 2013, 4, 232. [Google Scholar] [CrossRef] [PubMed]
- Tone, Y.; Furuuchi, K.; Kojima, Y.; Tykocinski, M.L.; Greene, M.I.; Tone, M. Smad3 and NFAT cooperate to induce Foxp3 expression through its enhancer. Nat. Immunol. 2008, 9, 194–202. [Google Scholar] [CrossRef] [PubMed]
- D’Adamio, F.; Zollo, O.; Moraca, R.; Ayroldi, E.; Bruscoli, S.; Bartoli, A.; Cannarile, L.; Migliorati, G.; Riccardi, C. A new dexamethasone-induced gene of the leucine zipper family protects T lymphocytes from TCR/CD3-activated cell death. Immunity 1997, 7, 803–812. [Google Scholar] [CrossRef]
- Bereshchenko, O.; Coppo, M.; Bruscoli, S.; Biagioli, M.; Cimino, M.; Frammartino, T.; Sorcini, D.; Venanzi, A.; Di Sante, M.; Riccardi, C. GILZ promotes production of peripherally induced Treg cells and mediates the crosstalk between glucocorticoids and TGF-β signaling. Cell Rep. 2014, 7, 464–475. [Google Scholar] [CrossRef] [PubMed]
- Fan, H.; Morand, E.F. The Role of GILZ in Anti-Inflammatory and Immunosuppressive Actions of Glucocorticoids. In Glucocorticoids-New Recognition of Our Familiar Friend; Qian, X., Ed.; InTech: Rijeka, Croatia, 2012; p. 8. [Google Scholar]
- Ayroldi, E.; Migliorati, G.; Bruscoli, S.; Marchetti, C.; Zollo, O.; Cannarile, L.; D’Adamio, F.; Riccardi, C. Modulation of T-cell activation by the glucocorticoid-induced leucine zipper factor via inhibition of nuclear factor kappaB. Blood 2001, 98, 743–753. [Google Scholar] [CrossRef] [PubMed] [Green Version]
- Mittelstadt, P.R.; Ashwell, J.D. Inhibition of AP-1 by the Glucocorticoid-inducible Protein GILZ. J. Biol. Chem. 2001, 276, 29603–29610. [Google Scholar] [CrossRef] [PubMed] [Green Version]
- Ayroldi, E.; Zollo, O.; Macchiarulo, A.; Di Marco, B.; Marchetti, C.; Riccardi, C. Glucocorticoid-Induced Leucine Zipper Inhibits the Raf-Extracellular Signal-Regulated Kinase Pathway by Binding to Raf-1. Mol. Cell. Biol. 2002, 22, 7929–7941. [Google Scholar] [CrossRef] [PubMed] [Green Version]
- Ayroldi, E.; Zollo, O.; Bastianelli, A.; Marchetti, C.; Agostini, M.; Di Virgilio, R.; Riccardi, C. GILZ mediates the antiproliferative activity of glucocorticoids by negative regulation of Ras signaling. J. Clin. Investig. 2007, 117, 1605–1615. [Google Scholar] [CrossRef] [PubMed] [Green Version]
- Ito, T.; Yang, M.; Wang, Y.-H.; Lande, R.; Gregorio, J.; Perng, O.A.; Qin, X.-F.; Liu, Y.-J.; Gilliet, M. Plasmacytoid dendritic cells prime IL-10–producing T regulatory cells by inducible costimulator ligand. J. Exp. Med. 2007, 204, 105–115. [Google Scholar] [CrossRef] [PubMed] [Green Version]
- Grohmann, U.; Volpi, C.; Fallarino, F.; Bozza, S.; Bianchi, R.; Vacca, C.; Orabona, C.; Belladonna, M.L.; Ayroldi, E.; Nocentini, G.; et al. Reverse signaling through GITR ligand enables dexamethasone to activate IDO in allergy. Nat. Med. 2007, 13, 579–586. [Google Scholar] [CrossRef] [PubMed]
- Puccetti, P.; Grohmann, U. IDO and regulatory T cells: A role for reverse signalling and non-canonical NF-kappaB activation. Nat. Rev. Immunol. 2007, 7, 817–823. [Google Scholar] [CrossRef] [PubMed]


| Paper | Species (Strain) | Disease | Drug, Dose, and Days of treatment | Time Elapsed from the Last Treatment | Evaluated Tissue | Treg Population | Modulation of the Treg Subset (Significance) 1 | |
|---|---|---|---|---|---|---|---|---|
| Boivin et al. 2018 [121] | Horse (N.A.) | No disease | 14 day treatment with dexamethasone,.06 mg/Kg per day | on treatment | Bronchoalveolar lavage fluid | % FoxP3+ in CD4+ T cells | = vs. baseline | |
| Chen et al. 2004 [101] | Mouse (BALB/c) | No disease | 1 day treatment with dexamethasone, i.p., 5 mg/Kg | 1 day after the injection | Thymus | CD4+CD25+ absolute number | ↑(*) vs. untreated controls | |
| CD4+CD25+/CD4+CD25− ratio | ↑(**) vs. untreated controls | |||||||
| Spleen | CD4+CD25+/CD4+CD25− ratio | ↑(**) vs. untreated controls | ||||||
| 3 days after the injection | Thymus | CD4+CD25+ absolute number | ↑(*) vs. untreated controls | |||||
| CD4+CD25+/CD4+CD25− ratio | ↑(*) vs. untreated controls | |||||||
| 1, 3 and 5 day treatment with dexamethasone, i.p., 5 mg/Kg per day | 1 day after the first injection | Thymus | CD4+CD25+ absolute number | ↑(*) vs. untreated controls | ||||
| CD4+CD25+/CD4+CD25− ratio | ↑(*) vs. untreated controls | |||||||
| 1 day after the fifth injection | Thymus | CD4+CD25+ absolute number | ↑(**) vs. untreated controls | |||||
| CD4+CD25+/CD4+CD25− ratio | ↑(**) vs. untreated controls | |||||||
| 3 day treatment with dexamethasone, i.p., 5 mg/Kg per day | 1 day after the last injection | Thymus | CD4+CD8−CD25+ absolute number | ↑(**) vs. untreated controls | ||||
| Spleen | ↑(*) vs. untreated controls | |||||||
| Lymph nodes | ↑(*) vs. untreated controls | |||||||
| Chen et al. 2006 [120] | Mouse (BALB/c) | No disease | 1–5 day treatment with dexamethasone, i.p., 5 mg/Kg per day plus IL-2 300 000 IU per day | 1 day after the last injection | Spleen, lymph nodes | % CD25+ in CD4+ T cells | ↑(**) vs. untreated controls | |
| 3 day treatment with dexamethasone, i.p., 5 mg/Kg per day | 1 day after the last injection | Spleen | CD4+CD25+/CD4+CD25− ratio | ↑(**) vs. untreated controls | ||||
| CD4+CD25+ absolute number | ↓(*) vs. untreated controls | |||||||
| Lymph nodes, spleen, blood | % CD4+FoxP3+ in all cells | ↓(N.A.) vs. untreated controls | ||||||
| 3 day treatment with dexamethasone, i.p., 5 mg/Kg per day plus IL-2 300 000 IU per day | 1 day after the last injection | Spleen | CD4+CD25+/CD4+CD25− ratio | ↑(**) vs. untreated controls | ||||
| CD4+CD25+ absolute number | ↑(**) vs. untreated controls | |||||||
| % CD4+FoxP3+ in all cells | ↑(N.A.) vs. untreated controls | |||||||
| Lymph nodes, blood | % CD4+FoxP3+ in all cells | ↑(N.A.) vs. untreated controls | ||||||
| Lymph nodes, spleen, blood | % FoxP3+ in CD3+CD4+ T cells | ↑(N.A.) vs. untreated controls | ||||||
| 3 days after the last injection | Lymph nodes, spleen, blood | % FoxP3+ in CD3+CD4+ T cells | ↓(N.A.) vs. untreated controls | |||||
| 21 days after the last injection | Lymph nodes, spleen, blood | % FoxP3+ in CD3+CD4+ T cells | ↑(N.A.) vs. untreated controls | |||||
| Chen et al. 2018 [117] | Mouse (C57BL/6) | No disease | 3 day treatment with dexamethasone, i.p. 0.1 or 100 μg per day | 2 days after the last injection | Spleen | CD4+CD25+ absolute number | ↑(*) or ↑ (***) (0.1, 100μg respectively) vs. untreated control | |
| Sbiera et al.2011 [119] | Mouse (C57Bl/6) | No disease | 3 day treatment with dexamethasone, i.p., 0.8 mg/Kg per day (similar results with 4, 20, 100 mg/Kg per day) | After treatment | Spleen, blood | CD4+CD25highFoxP3+ absolute number | ↓(N.A.) vs. untreated controls | |
| % CD25highFoxP3+ in CD4+ T cells | ↓(N.A.) vs. untreated controls | |||||||
| Zuska-Prot et al. 2017 [123] | Mouse (BALB/c) | No disease | 9 day treatment with methylprednisolone (MP), i.m., 2 mg/Kg per day or 9 day treatment with Ciclesonide (CIC), inhaled, 160 μg per day | 1 day after the last treatment | Lung | CD4+CD25+FoxP3+ absolute number | CIC↓(***) vs. untreated controls | |
| mediastinal lymph nodes | CIC↓(***) vs. untreated controls MP ↓(***) vs. untreated controls | |||||||
| head and neck lymph nodes | CIC↓(***) vs. untreated controls MP ↓(***) vs. untreated controls | |||||||
| blood | CIC↓(***) vs. untreated controls MP↓(*) vs. untreated controls | |||||||
| Ugor et al. 2018 [118] | Mouse (BALB/c) | No disease | 1-4 day treatment with dexamethasone, i.p., 20 mg/Kg per day | 1 day after the last injection | thymus | % CD25+FoxP3+ in CD4+ T cells | ↑(N.A.) at day 1 vs. untreated controls (same result at day 2 and 4) | |
| 1 day treatment with dexamethasone, i.p., 20 mg/Kg per day | 4 or 8 h after the injection | blood | % CD25+FoxP3+ in CD4+ T cells | ↑(*) vs. untreated controls | ||||
| 4 day treatment with dexamethasone, i.p., 20 mg/Kg per day | 1 day after the last injection | thymus | CD4+CD25+FoxP3+ absolute number | = vs. untreated controls | ||||
| spleen | ↓(**) vs. untreated controls | |||||||
| lymph nodes | ↓(***) vs. untreated controls | |||||||
| peyer’s patches | ↓(*) vs. untreated controls | |||||||
| Kawalkowska et al. 2016 [124] | Mouse (DBA/1) | Arthritis | 10 day treatment with dexamethasone, i.p., 160 μg per dayplus IL-4, i.p., on day 1, 4, and 7 post disease onset | on treatment | joints of paw | % CD25+FoxP3+ in CD4+ T cells | ↑(**** vs. untreated controls) ↑(* vs. mice treated with Dex alone) | |
| on treatment | joints of paw | Th17/Tregs ratio | ↓(* vs. untreated controls) ↓(** vs. mice treated with Dex alone) | |||||
| 11 days after the last treatment | ||||||||
| Boivin et al. 2018 [121] | Horse (N.A.) | Severe asthma | 14 day treatment with dexamethasone, 0.06 mg/Kg per day | on treatment | bronchoalveolar lavage fluid | % FoxP3+ in CD4+ T cells | ↑(*** vs. healthy controls) ↑(* vs. baseline) | |
| Olsen et al. 2015 [125] | Mouse (A/J) | Asthma (sensitization and first OVA challenges) | • (protocol 1) treatment with dexamethasone, os, 1 mg/Kg, same days of challenge (3 days/week during 3 weeks) • (protocol 2) treatment with dexamethasone, os, 1 mg/Kg per day, (on the last week of challenge) • (protocol 3) treatment with budesonide, nebulized, 7.5 mg/mL, same days as protocol 2, 3 (inhalation cycles of 10 min each) • (protocol 4) treatment with budesonide, nebulized, 7.5 mg/mL, same days as protocol 2, 3 (inhalation cycles of 30 min each) | protocol 1, protocol 2, and protocol 3 | 1 day after the last treatment | bronchoalveolar lavage fluid | CD4+CD25+FoxP3+ absolute number | ↓(*) vs. untreated mice |
| lung | ||||||||
| protocol 1 | 7 days after the last treatment | bronchoalveolar lavage fluid | ||||||
| protocol 1, protocol 2, and protocol 3 | 1 day after the last treatment | lymph node | ||||||
| protocol 2, and protocol 3 | 1 day after the last treatment | thymus | ||||||
| protocol 2 and protocol 4 | 1 day after the last treatment | airways and lung | CD4+CD25+FoxP3+ absolute number | ↓(*) vs. untreated mice | ||||
| Mouse (BALB/c) | Asthma (HDM challenges) | protocol 2 and protocol 4 | 1 day after the last treatment | airways and lung | CD4+CD25+FoxP3+ absolute number | ↓(*) vs. untreated mice | ||
| Wu et al. 2016 [126] | Mouse (BALB/c) | Asthma (sensitization and first OVA challenges) | 3 day treatment with dexamethasone, ranging from 12.5 to 18.75 μg/day plus IL-2, intratracheal, ranging from 50000 to 75000 IU per day | 1 day after the last treatment | bronchoalveolar lavage fluid | CD4+CD25+ absolute number | ↑(*) vs. untreated asthmatic mice | |
| Zou et al. 2017 [127] | Mouse (BALB/c) | Asthma (sensitization and first OVA challenges) | 7 day treatment with dexamethasone, i.p., 1 mg/kg per day | N.A. | bronchoalveolar lavage fluid | % CD25+FoxP3+ in CD4+ T cells | ↓(**) vs. healthy controls ↑(N.A.) vs. asthmatic untreated mice | |
| pulmonary tissue | FoxP3 expression (evaluated by q-PCR, IHC, and SDS-PAGE) | ↓(**) vs. healthy controls ↑(N.A.) vs. asthmatic untreated mice | ||||||
| Zuska-Prot et al. 2017 [123] | Mouse (BALB/c) | asthma (sensitization and first OVA challenges) | treatment with Ciclesonide (CIC), inhaled, 160 μg/mouse per day or treatment with methylprednisolone (MP), i.m., 2 mg/kg per day | 4 days of treatment | on treatment | lung | CD4+CD25+FoxP3+ absolute number | OVA+CIC↓(***) vs. untreated controls OVA+MP↓(**) vs. untreated controls |
| Mediastinal lymph nodes | OVA+CIC↓(*) vs. untreated controls and healthy controls | |||||||
| 9 days of treatment | on treatment | lung | CD4+CD25+FoxP3+ absolute number | OVA+CIC↓(***) vs. untreated controls OVA+MP↓(**) vs. untreated controls | ||||
| mediastinal lymph nodes | OVA+CIC↓(***) vs. untreated controls OVA+MP↓(*) vs. untreated controls | |||||||
| head and neck lymph nodes | OVA+CIC↓(***) vs. untreated controls and healthy controls OVA+MP↓(***) vs. untreated controls and healthy controls | |||||||
| peripheral blood | OVA+CIC↓(***) vs. healthy controls OVA+MP↓(***) vs. healthy controls | |||||||
| 23 days of treatment | on treatment | lung | CD4+CD25+FoxP3+ absolute number | OVA+CIC↓(***) vs. untreated controls OVA+MP↓(***) vs. untreated controls | ||||
| mediastinal lymph nodes | OVA+CIC↓(***) vs. healthy controls and untreated controls OVA+MP↓(***) vs. healthy controls and untreated controls | |||||||
| head and neck lymph nodes | OVA+CIC↓(***) vs. untreated controls and healthy controls OVA+MP↓(***) vs. healthy controls | |||||||
| peripheral blood | OVA+CIC↓(***) vs. healthy controls and untreated controls OVA+MP↓(***) vs. healthy controls and untreated controls | |||||||
| Boivin et al. 2018 [121] | Horse (N.A.) | severe asthma | 14 day treatment with dexamethasone, 0.06 mg/Kg per day | on treatment | bronchoalveolar lavage fluid | % FoxP3+ in CD4+ T cells | ↑(*** vs. healthy controls) ↑(* vs. baseline) | |
| Chen et al. 2014 [128] | Mouse (APOE−/− C57BL/6) | atherosclerosis | 3 day treatment with dexamethasone, i.m., 4.5 mg/Kg on day 1, 2.25 mg/Kg on day 2 and 3 | 14 days after the last treatment | spleen | % FoxP3+ in CD4+ T cells | ↑(*) vs. untreated controls | |
| Nakao et al. 2018 [116] | Mouse (B6N) | cardiac graft | 6 day treatment with dexamethasone, i.p., 5 mg/Kg on day 0,2,4, and 6) | 4 days after the last treatment | spleen | % FoxP3+ in CD3+CD4+ | ↑(*) vs. untreated controls | |
| % FoxP3+ in splenocytes | ↑(***) vs. untreated controls | |||||||
| 6 day treatment with dexamethasone, i.p., 5 mg/Kg on day 0,2,4, and 6), plus anti-Gr-1 Ab, i.p., on postoperative days 1 and 4 | % FoxP3+ in CD3+CD4+ | ↓(***) vs. mice treated with dexamethasone alone | ||||||
| % FoxP3+ in splenocytes | ↓(***) vs. mice treated with dexamethasone alone | |||||||
| You et al. 2018 [129] | Mouse (BALB/c) | colitis | 4 day treatment with dexamethasone, orogastric gavage, 5 mg/Kg per day, plus AdTGF2 | N.A. | mesenteric lymph nodes | FoxP3 expression (q-PCR) | ↑(**) vs. mice treated with AdTGF-1 alone | |
| FoxP3+ absolute number | ||||||||
| Zhang et al. 2013 [130] | Mouse (NOD) | type I diabetes | (14-days protocol) treatment with dexamethasone in the two hind footpads, 16 mg/Kg on days 1, 4, 7, 10, plus injection of insuline peptide (B9-23) co-injected at day-7 | 7 days after the last treatment | spleen | % CD25+FoxP3+ in CD4+ T cells | ↑(*) vs. untreated controls, mice treated with dexamethasone alone and insuline peptide alone | |
| % FoxP3+IL-10+ in CD4+CD25+ T cells | ||||||||
| 45 days after the last treatment | % CD44+CD62L− in CD4+FoxP3+ T cells | ↑(*) vs. mice treated with insulin peptide | ||||||
| Chen et al. 2006 [120] | Mouse (C57BL/6) | experimental autoimmune encephalomyelitis (EAE) | 3 day prior to immunization treatment with dexamethasone, i.p., 5 mg/Kg plus IL-2, i.v., 4 μg | N.A. | spleen | % FoxP3+ in CD4+ T Cells | ↑(N.A.) vs. untreated EAE mice | |
| Wüst et al. 2008 [131] | mouse 3 (C57BL/6 Grflox) | experimental autoimmune encephalomyelitis (EAE) | 3 day treatment with dexamethasone, i.p., 100 mg/Kg per day | 58 h after the last treatment | spleen | % FoxP3+GITR+ in CD4+ Tcells | ↓(N.A.) vs. untreated controls | |
| MFI of FoxP3 | ↓(**) vs. untreated controls | |||||||
| mouse 3 (C57BL/6 Grlck) | % FoxP3+GITR+ in CD4+ T cells | ↓(N.A.) vs. untreated controls | ||||||
| MFI of FoxP3 | = vs. untreated controls | |||||||
| Paper | Disease | Drug, Dose, and Days of Treatment | Time Elapsed from the Last Treatment | Evaluated Tissue | Treg Population | Modulation of the Treg Subset (Significance) 1 |
|---|---|---|---|---|---|---|
| Sbiera et al. 2011 [119] | No disease | (14 days protocol) treatment with prednisolone, i.v., 250 μg/day, on days 1–3 i.v., 150 μg on day 4 os, 100 μg/day on days 5–9 os, 75 μg/day on days 10–11 os, 50 μg on day 12 os, 20 μg on day 13 os, 10 μg on day 14 | on treatment | peripheral blood mononuclear cells | % FoxP3+ in CD4+ T cells | ↓(*) vs. baseline |
| CD4+CD25highFoxP3+ absolute number | ↑(*) vs. baseline | |||||
| % CD127− in CD4+ T cells | ↑(*) vs. baseline | |||||
| CD4+CD25highFoxP3+CD127− absolute number | ↑(***) vs. baseline | |||||
| CD4+CD25highFoxP3+CTLA+ absolute number | ↑(*) vs. baseline | |||||
| Hartl et al. 2007 [132] | Asthma | 28 day treatment with inhaled fluticasone, 0.4 μg/day | after treatment | blood, bronchoalveolar lavage fluid | % CD25high in CD4+ T cells | ↑(* blood and ** bronchoalveolar lavage fluid) vs. baseline |
| at least 90 day treatment with inhaled fluticasone, 0.4 μg/day | on treatment | blood, bronchoalveolar lavage fluid | % CD25high in CD4+ T cells | ↑(* blood and ** bronchoalveolar lavage fluid) vs. untreated asthma patients | ||
| Karagiannidis et al. 2004 [98] | Severe asthma | treatment with inhaled fluticasone, 2 μg/day plus prednisolone, os, 42.2 μg/day | 12h after the last treatment | blood | CD4+CD25+CD45RO+CD62L+ absolute number | ↑(*) vs. baseline |
| 3h after the last treatment | peripheral blood mononuclear cells | FoxP3 expression in CD4+ T cells (q-PCR) | ||||
| on treatment | ↑(*) vs. healthy controls ↑(**) vs. untreated moderate asthma patients | |||||
| Moderate asthma | inhaled steroids | on treatment | peripheral blood mononuclear cells | % CD25high in CD4+ T cells | ↑(*) vs. healthy controls ↑(**) vs. baseline | |
| Seissler et al. 2012 [133] | Kidney transplant | 3 day treatment with methylprednisolone, 125 or 250 μg/day | on treatment | peripheral blood mononuclear cells | % DRhighCD45RA− in FoxP3+CD127low/− Treg cells | ↑(**) at day 1 and 2, vs. baseline ↑(*) at day 3 vs. baseline |
| % DR+CD45RA− in FoxP3+CD127low/− Treg cells | ↑(**) at day 1 vs. baseline ↑(*) at day 2 and 3 vs. baseline | |||||
| % DRlowCD45RA− in FoxP3+CD127low/− Treg cells | ↑(*) at day 1 vs. baseline | |||||
| % DR−CD45RA+ in FoxP3+CD127low/− Treg cells | ↓(**) at day 3 vs. baseline | |||||
| Azab et al. 2008 [134] | Systemic lupus erythematosus (SLE) | at least 90 day treatment with glucocorticoids therapy (various doses) | on treatment | peripheral blood mononuclear cells | MFI of CD25 in CD4+CD25+ T cells | ↑(*) vs. healthy controls |
| MFI of CD25 in CD4+CD25high T cells | ↑(*) vs. healthy controls | |||||
| % CD25+ in CD4+ T cells | ↑(*) vs. healthy controls and untreated patients | |||||
| Mathian et al. 2015 [135] | Systemic lupus erythematosus (SLE) | 3 day treatment with methylprednisolone, i.v., 500 or 1000 μg/day | on treatment | peripheral blood mononuclear cells | % FoxP3brightCD45RA− in CD4+ T cells | ↑(**) at day 1 and 3 vs. baseline ↑(***) at day 2 vs. baseline |
| Suarez et al. 2006 [136] | Systemic lupus erythematosus (SLE) | at least 90 day treatment with glucocorticoids therapy (various doses) | on treatment | blood | % CD25high in CD4+ T cells | ↑(*) vs. baseline ↑ (**) vs. healthy controls |
| Zhang et al. 2008 [137] | Systemic lupus erythematosus (SLE) | treatment with prednisolone, ≥1 μg/day plus intravenous cyclophosphamide, every 2–4 weeks | on treatment | peripheral blood mononuclear cells | % CD25high in CD4+ T cells | ↑(*) vs. baseline |
| Li et al. 2011 [138] | Immune thrombocytopenia | (28 days protocol) treatment with dexamethasone, os, 40 μg/day, on day 1–4 prednisone, os, 60 μg/day, on day 5–7 prednisone, os, 30 μg/day, on day 8–14 prednisone, os, 15 μg/day, on day 15–21 prednisone, os, 10 μg/day, on day 22–28 | on treatment | blood | CD4+CD25+CD127− absolute number | ↑(**) vs. baseline ↓(**) vs. day 14 of treatment |
| Li et al. 2013 [99] | Immune thrombocytopenia | 4 day treatment with dexamethasone, 40 μg/day | N.A. | peripheral blood mononuclear cells | FoxP3 expression (q-PCR) | ↑(**) vs. untreated patients |
| CD4+CD25highFoxP3+ absolute number | ↑(*) vs. untreated patients | |||||
| Ling et al. 2007 [139] | Immune thrombocytopenia | 4 day treatment with dexamethasone, os, 40 μg/day | 1 day after the last treatment | peripheral blood mononuclear cells | % FoxP3+ in CD4+ T cells | ↑(****) vs. baseline |
| Keijsers et al. 2015 [140] | Psoriasis | 56 day treatment with calcipotriol–betamethasone dipropionate ointment | after treatment | skin biopsies | FoxP3+ cells/mm2 (IHC) | ↓(**) vs. baseline |
| FoxP3/CD4 ratio (IHC) | ↓(*) vs. baseline | |||||
| Braitch et al. 2009 [141] | Multiple sclerosis (relapse) | 3 day treatment with methylprednisolone, i.v., 1000 μg/day | on treatment | peripheral blood mononuclear cells | CD4+ CD25high absolute number | ↑(**) vs. baseline |
| FoxP3/CD3 ratio (q-PCR) | ↑(**) vs. baseline | |||||
| Muls et al. 2015 [142] | Multiple sclerosis (relapse) | 5 day treatment with methylprednisolone, i.v., 1000 μg/day | on treatment | peripheral blood mononuclear cells | % CD25highFOXP3+ in lymphoid cells | ↓(****) vs. baseline |
| % CD25highFOXP3+ in CD4+ T cells | ↓(*) vs. baseline | |||||
| FoxP3 expression (q-PCR) in CD4+ T cells | ↓(**) vs. baseline | |||||
| CD4+CD25highFOXP3+CD39+ absolute number | ↑(*) vs. baseline |
© 2019 by the authors. Licensee MDPI, Basel, Switzerland. This article is an open access article distributed under the terms and conditions of the Creative Commons Attribution (CC BY) license (http://creativecommons.org/licenses/by/4.0/).
Share and Cite
Cari, L.; De Rosa, F.; Nocentini, G.; Riccardi, C. Context-Dependent Effect of Glucocorticoids on the Proliferation, Differentiation, and Apoptosis of Regulatory T Cells: A Review of the Empirical Evidence and Clinical Applications. Int. J. Mol. Sci. 2019, 20, 1142. https://doi.org/10.3390/ijms20051142
Cari L, De Rosa F, Nocentini G, Riccardi C. Context-Dependent Effect of Glucocorticoids on the Proliferation, Differentiation, and Apoptosis of Regulatory T Cells: A Review of the Empirical Evidence and Clinical Applications. International Journal of Molecular Sciences. 2019; 20(5):1142. https://doi.org/10.3390/ijms20051142
Chicago/Turabian StyleCari, Luigi, Francesca De Rosa, Giuseppe Nocentini, and Carlo Riccardi. 2019. "Context-Dependent Effect of Glucocorticoids on the Proliferation, Differentiation, and Apoptosis of Regulatory T Cells: A Review of the Empirical Evidence and Clinical Applications" International Journal of Molecular Sciences 20, no. 5: 1142. https://doi.org/10.3390/ijms20051142