Downregulation of the S1P Transporter Spinster Homology Protein 2 (Spns2) Exerts an Anti-Fibrotic and Anti-Inflammatory Effect in Human Renal Proximal Tubular Epithelial Cells

 ,
, 
Abstract
:1. Introduction
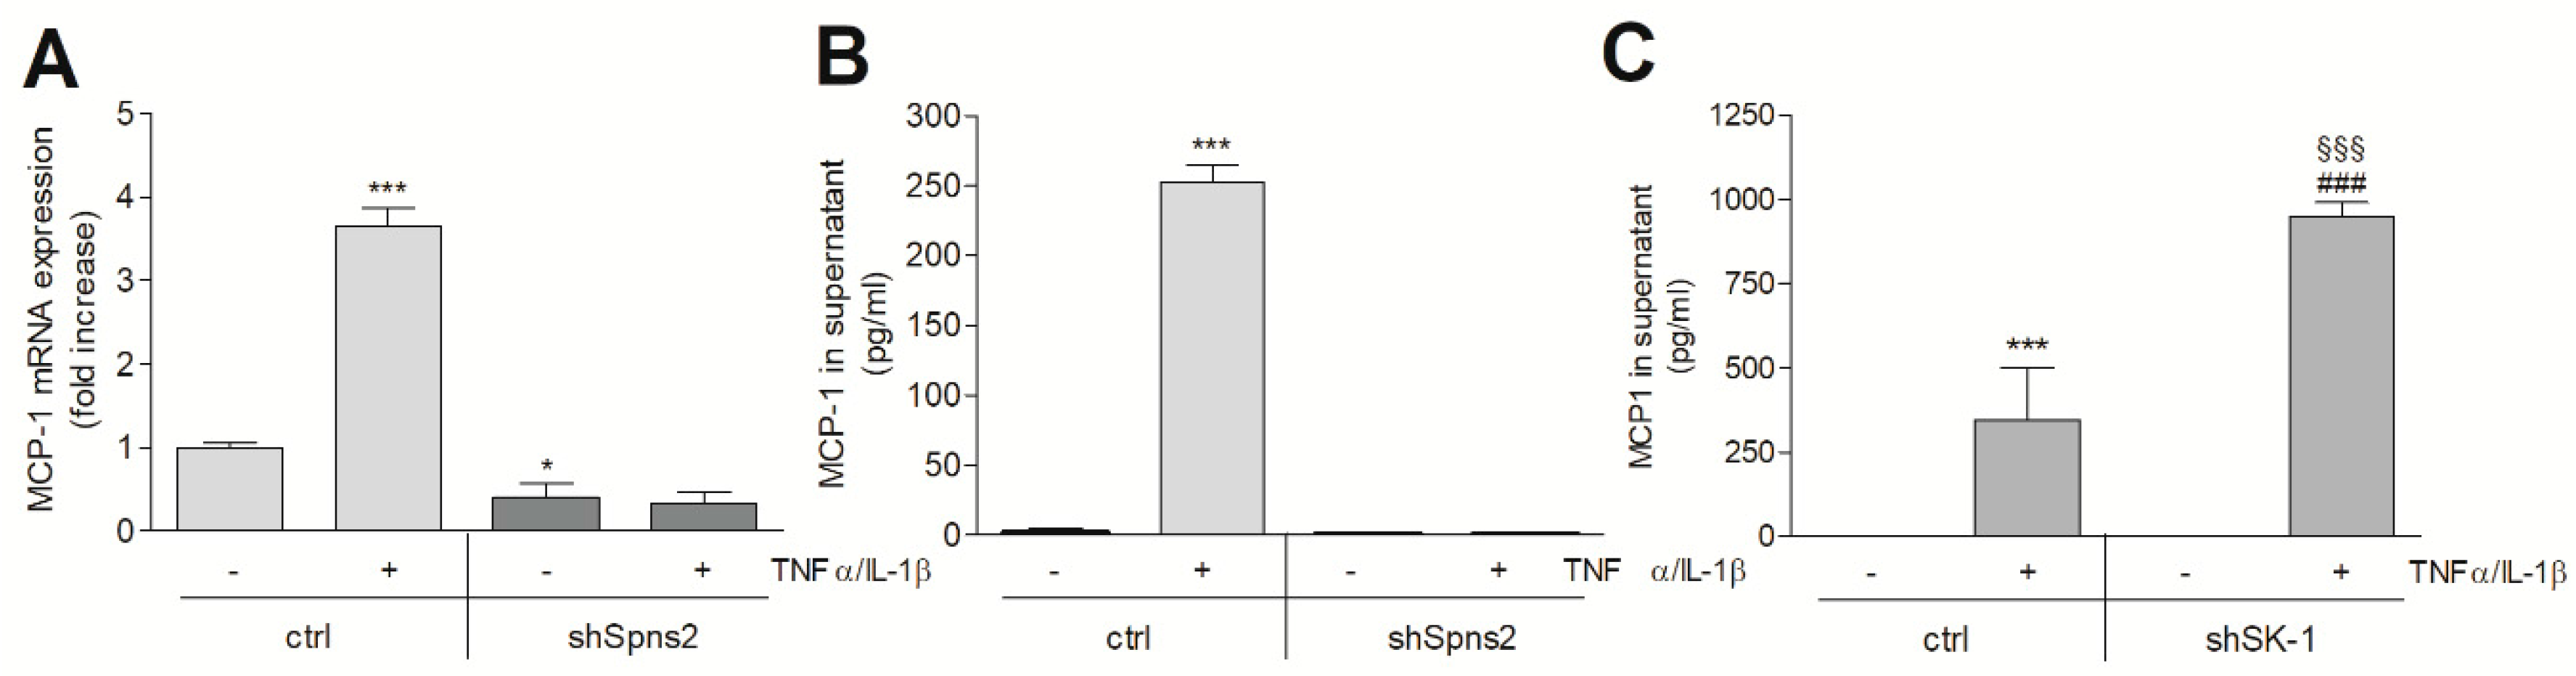
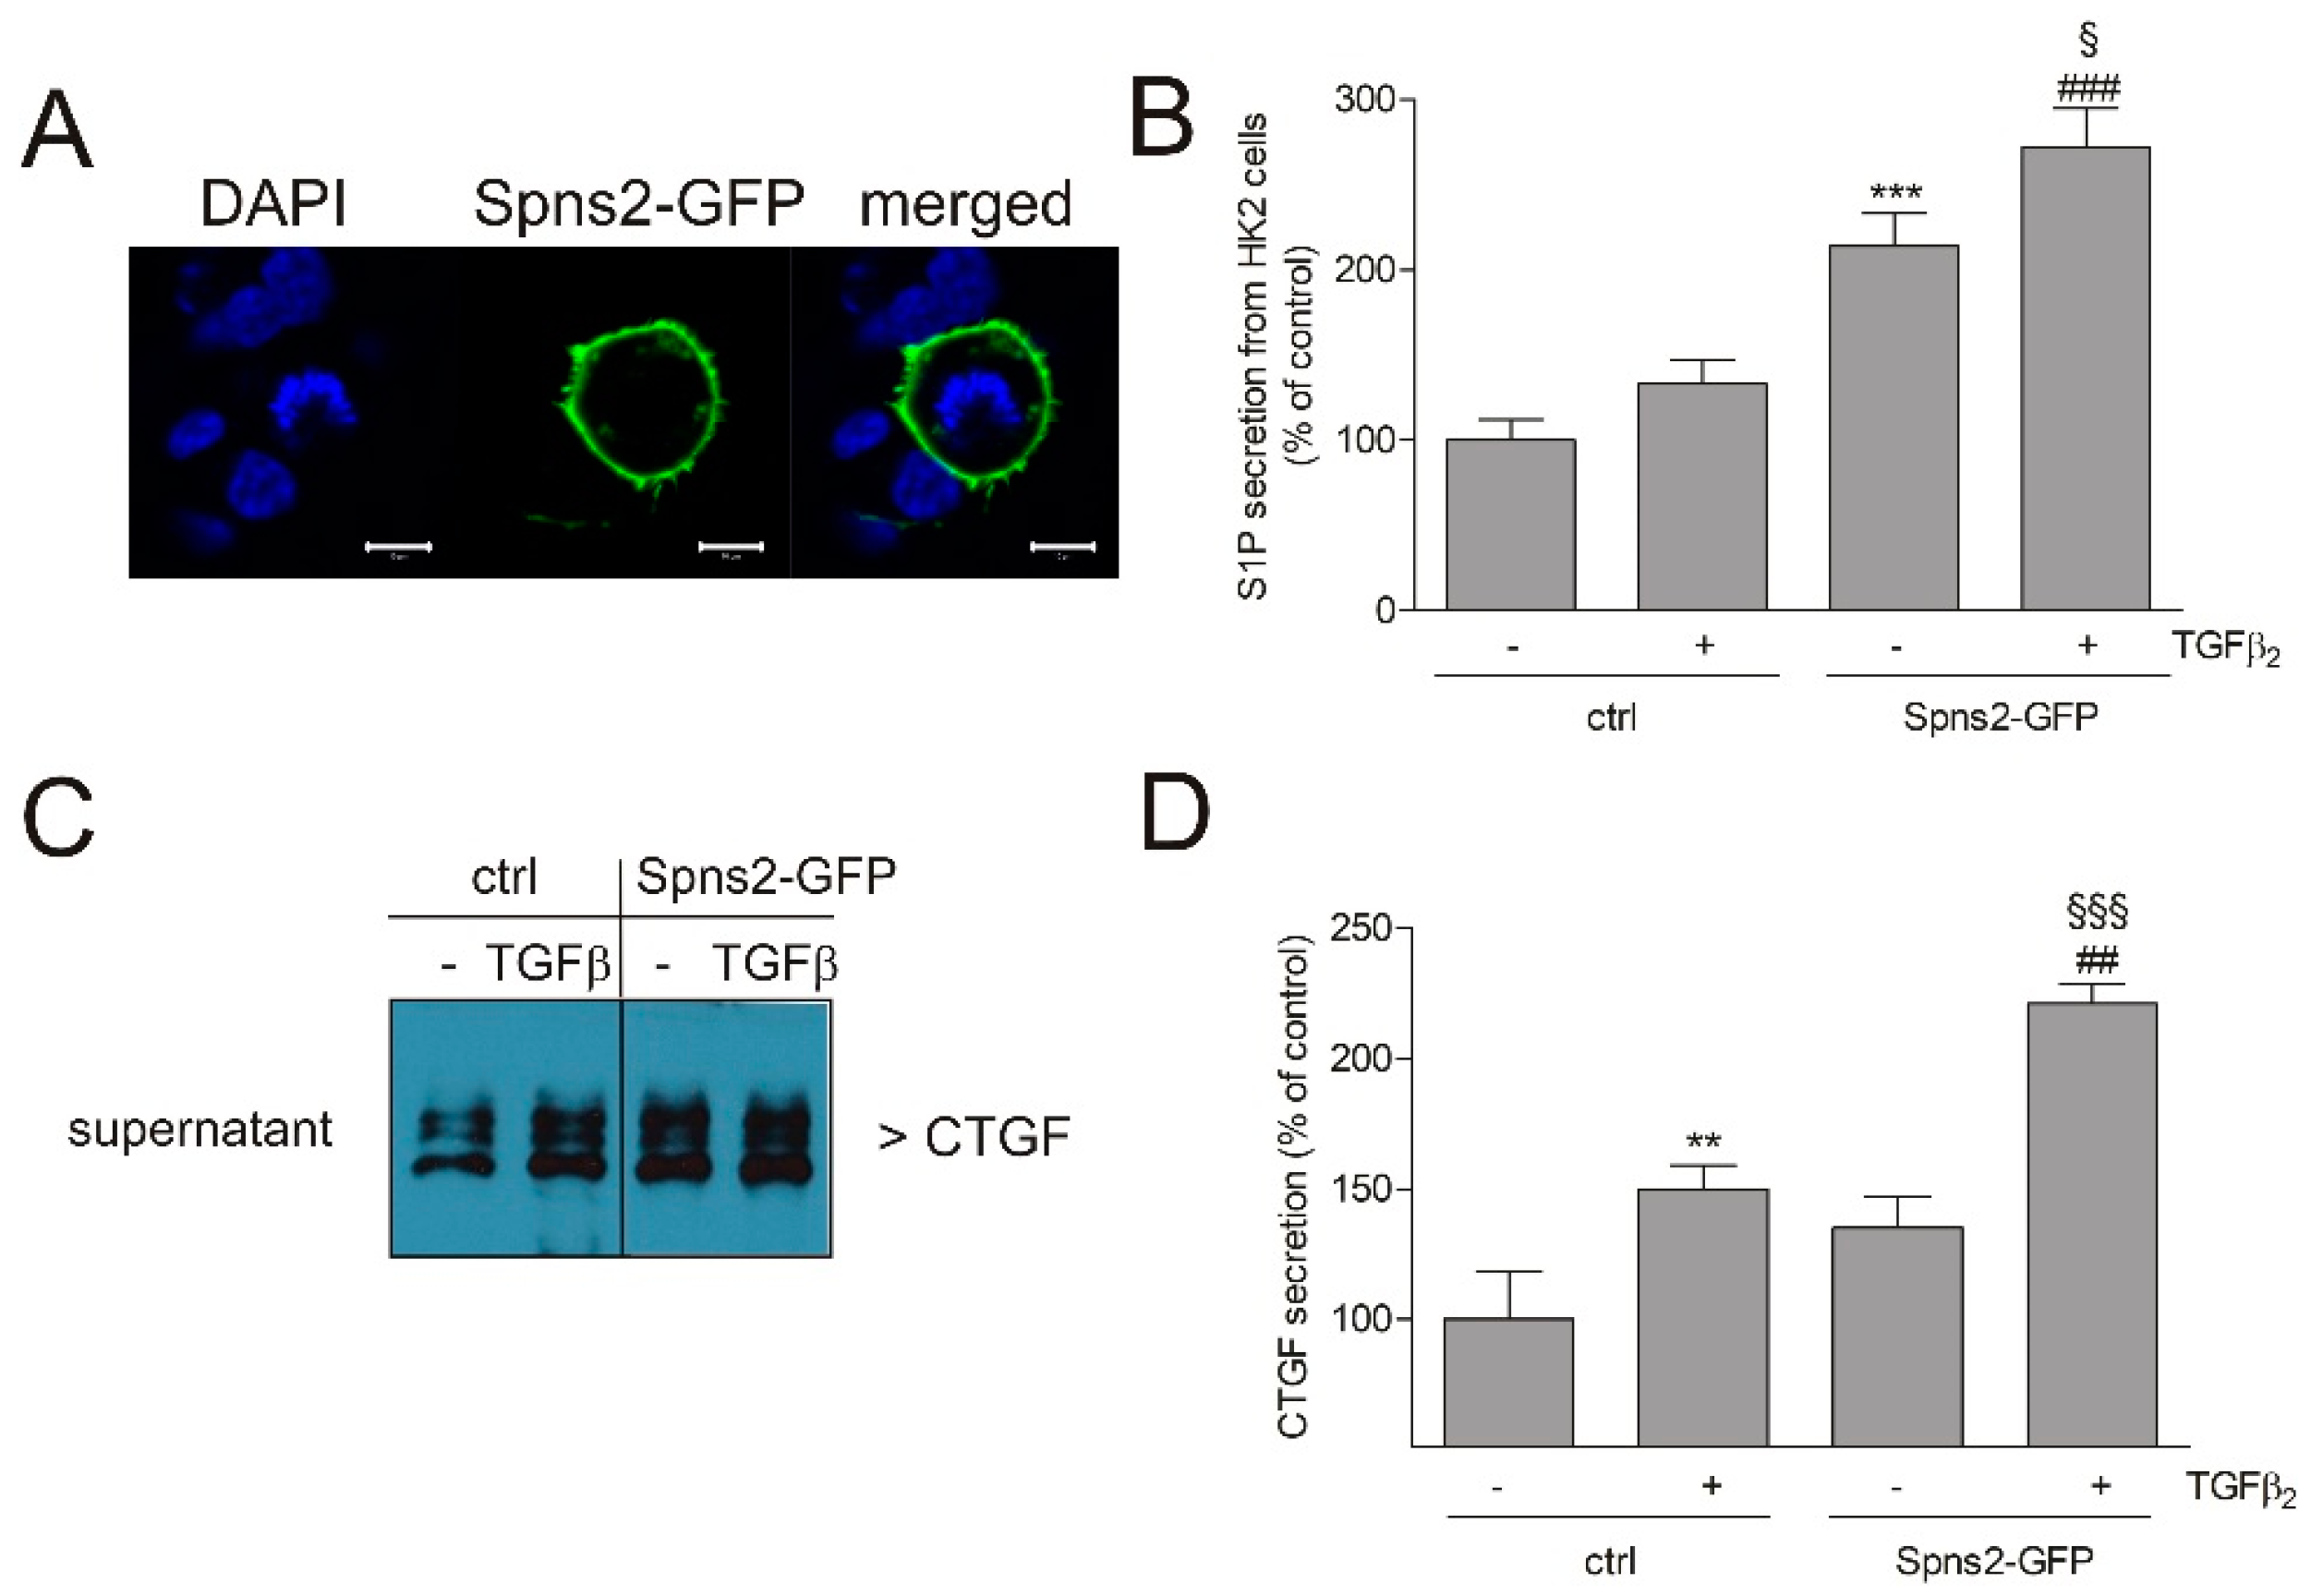
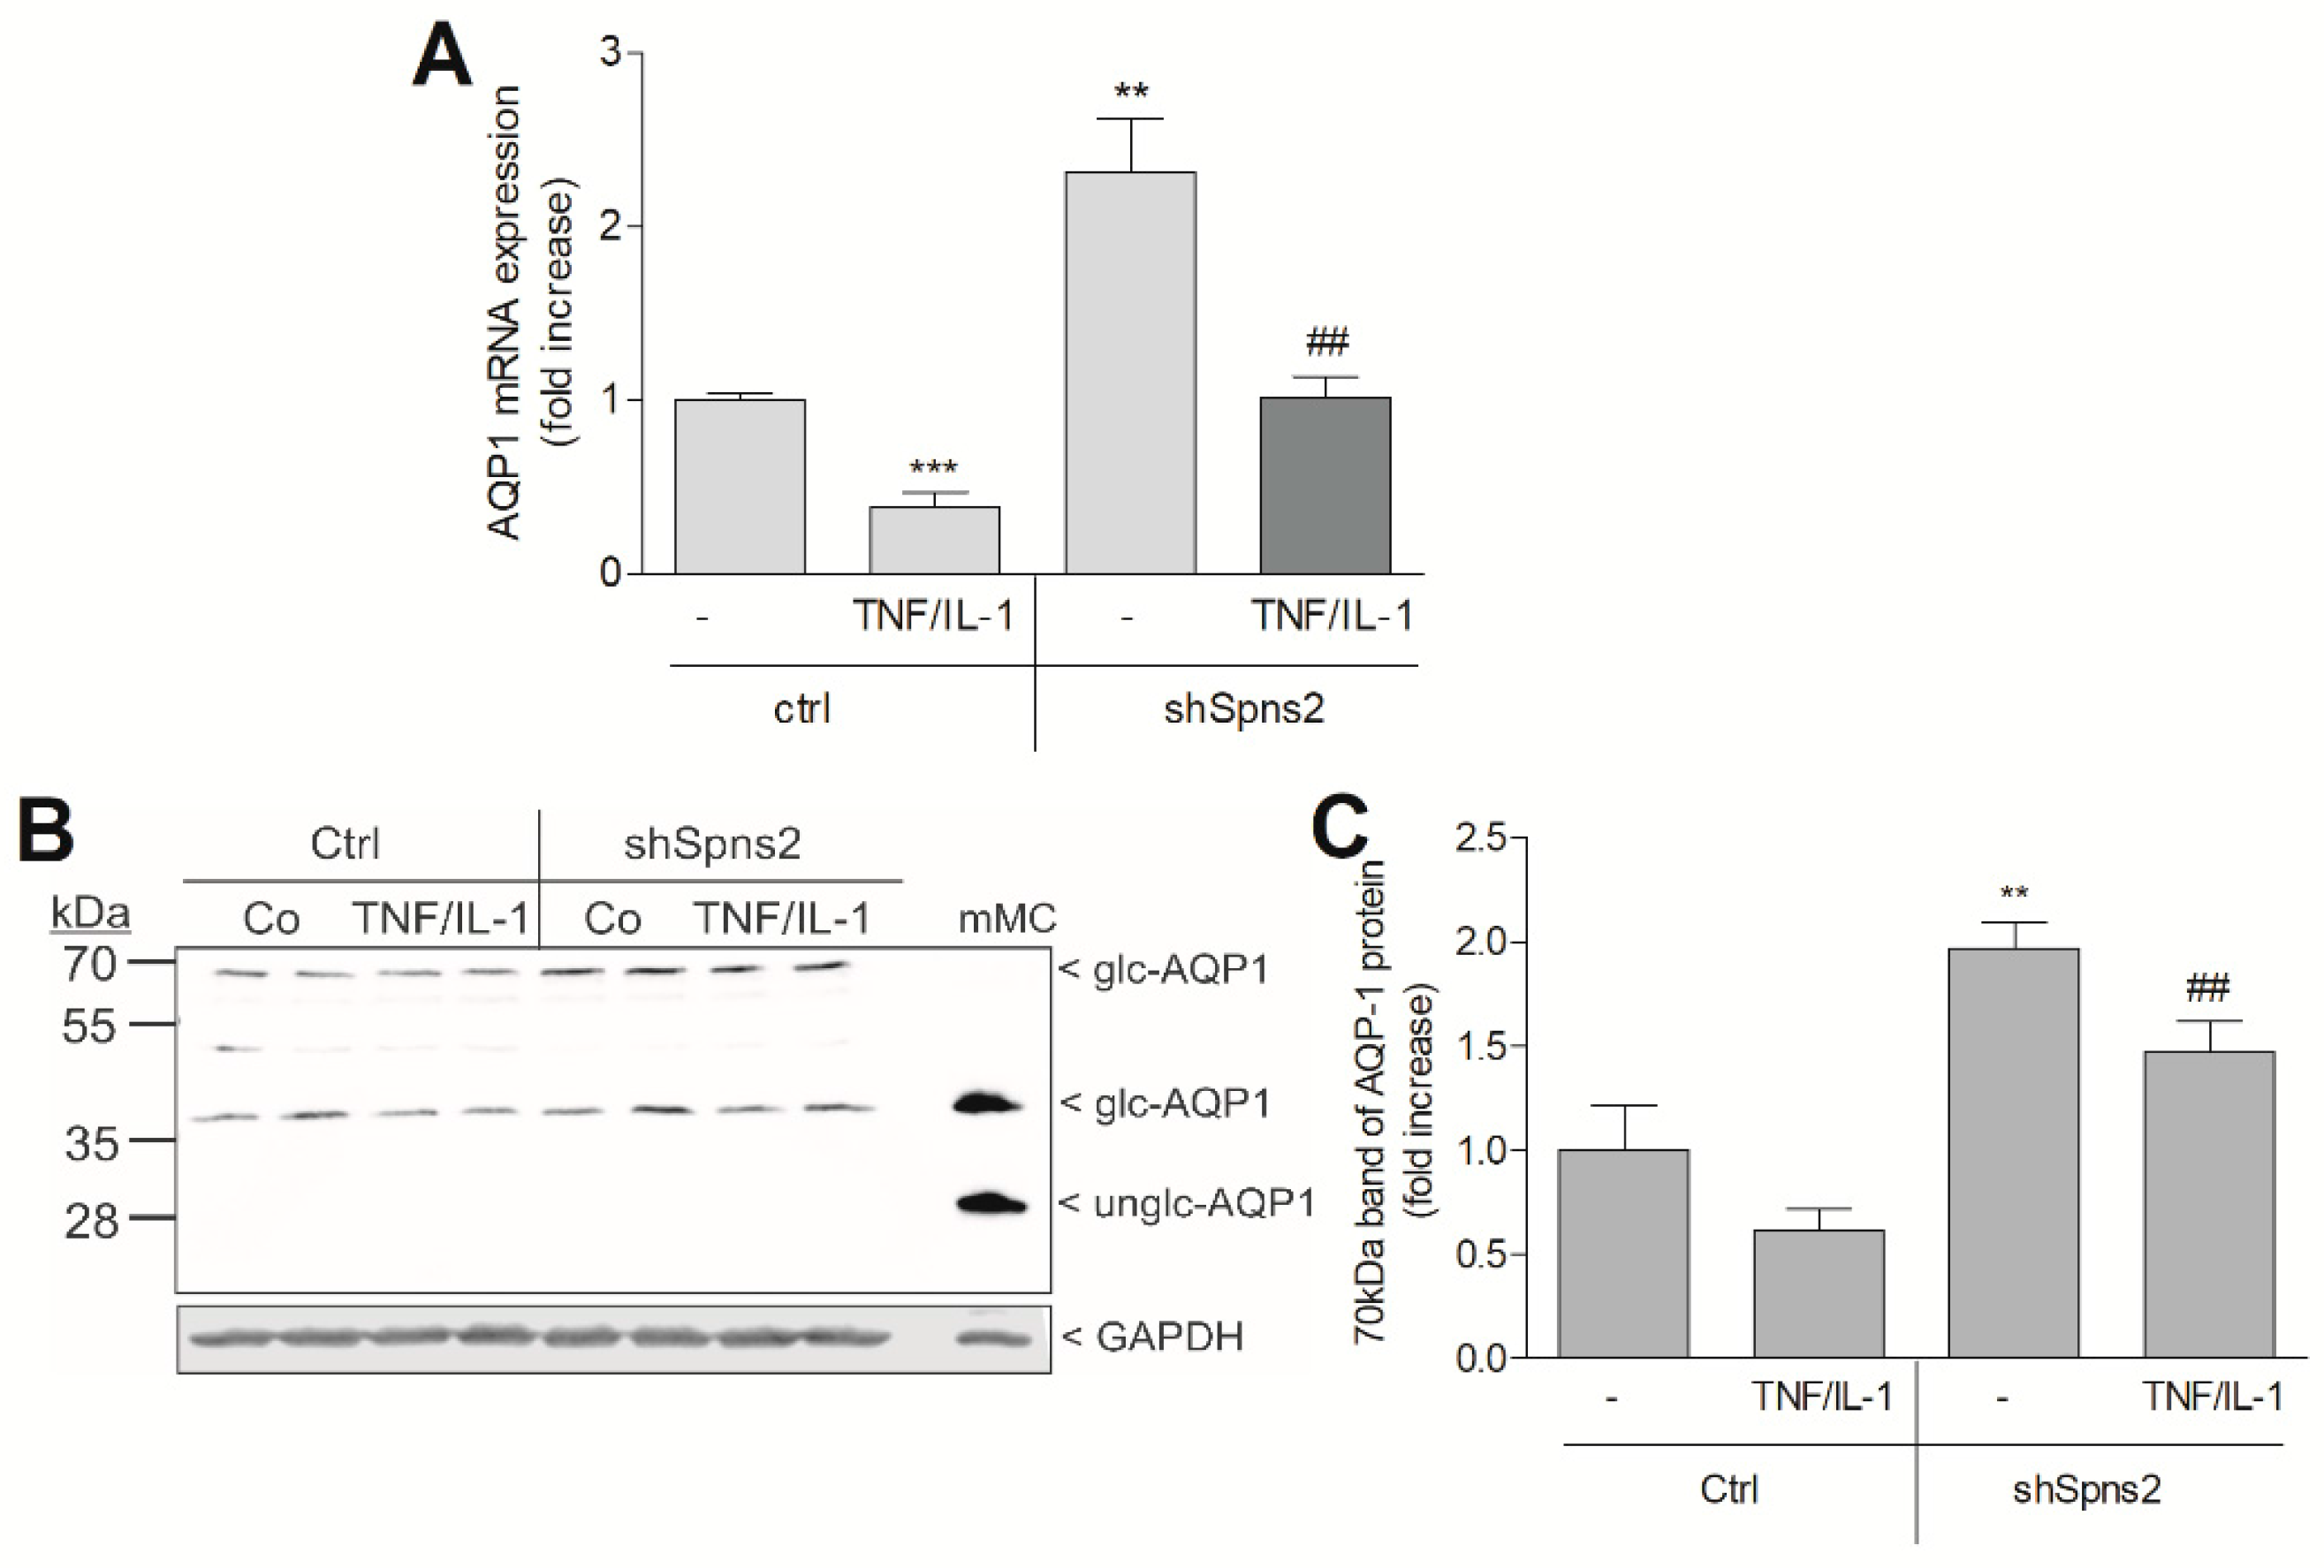
2. Results
3. Discussion
4. Materials and Methods
4.1. Chemicals
4.2. Cell Culture and Transfections
4.3. Western Blot Analysis
4.4. Quantitative Real-Time PCR Analysis (qPCR)
4.5. Determination of S1P Generation and Secretion by a Reporter Assay
4.6. Quantification of S1P by Mass Spectrometry
4.7. Statistical Analysis
Author Contributions
Acknowledgments
Conflicts of Interest
Abbreviations
| AQP | aquaporin |
| BSA | bovine serum albumin |
| CHO cells | Chinese hamster ovary cells |
| CTGF | connective tissue growth factor |
| DMEM | Dulbecco’s modified Eagle medium |
| ECL | enhanced chemiluminescence |
| ERK | extracellular signal regulated kinase |
| eS1P | extracellular sphingosine 1-phosphate |
| FBS | fetal bovine serum |
| GAPDH | glyceraldehyde 3-phosphate dehydrogenase |
| GFP | green fluorescence protein |
| HDAC | histone deacetylase |
| HK2 | human proximal tubular epithelial cells |
| IFN | interferon |
| IL | interleukin |
| iS1P | intracellular S1P |
| kd | knockdown |
| MCP-1/CCL2 | monocyte chemoattractant peptide 1 |
| MFS | major facilitator superfamily |
| NFκB | nuclear factor κB |
| SDS-PAGE | sodium dodecyl sulfate-polyacrylamide gel electrophoresis |
| shRNA | small hairpin RNA |
| SK | sphingosine kinase |
| Spns2 | spinster homology protein 2 |
| TGFβ | transforming growth factor β |
| TNFα | tumor necrosis factor α |
| TRAF2 | TNF receptor-associated factor 2 |
| UUO | unilateral ureter obstruction |
References
- Schwalm, S.; Pfeilschifter, J.; Huwiler, A. Sphingosine-1-phosphate: A Janus-faced mediator of fibrotic diseases. Biochim. Biophys. Acta 2013, 1831, 239–250. [Google Scholar] [CrossRef] [PubMed]
- Schwalm, S.; Pfeilschifter, J.; Huwiler, A. Targeting the sphingosine kinase/sphingosine 1-phosphate pathway to treat chronic inflammatory kidney diseases. Basic Clin. Pharmacol. Toxicol. 2014, 114, 44–49. [Google Scholar] [CrossRef] [PubMed]
- Pyne, N.J.; Dubois, G.; Pyne, S. Role of sphingosine 1-phosphate and lysophosphatidic acid in fibrosis. Biochim. Biophys. Acta 2013, 1831, 228–238. [Google Scholar] [CrossRef] [PubMed]
- Kihara, Y.; Maceyka, M.; Spiegel, S.; Chun, J. Lysophospholipid receptor nomenclature review: IUPHAR Review 8. Br. J. Pharmacol. 2014, 171, 3575–3594. [Google Scholar] [CrossRef] [PubMed]
- Alvarez, S.E.; Harikumar, K.B.; Hait, N.C.; Allegood, J.; Strub, G.M.; Kim, E.Y.; Maceyka, M.; Jiang, H.; Luo, C.; Kordula, T.; et al. Sphingosine-1-phosphate is a missing cofactor for the E3 ubiquitin ligase TRAF2. Nature 2010, 465, 1084–1088. [Google Scholar] [CrossRef] [PubMed]
- Hait, N.C.; Allegood, J.; Maceyka, M.; Strub, G.M.; Harikumar, K.B.; Singh, S.K.; Luo, C.; Marmorstein, R.; Kordula, T.; Milstien, S.; et al. Regulation of histone acetylation in the nucleus by sphingosine-1-phosphate. Science 2009, 325, 1254–1257. [Google Scholar] [CrossRef] [PubMed]
- Strub, G.M.; Paillard, M.; Liang, J.; Gomez, L.; Allegood, J.C.; Hait, N.C.; Maceyka, M.; Price, M.M.; Chen, Q.; Simpson, D.C.; et al. Sphingosine-1-phosphate produced by sphingosine kinase 2 in mitochondria interacts with prohibitin 2 to regulate complex IV assembly and respiration. FASEB J. 2011, 25, 600–612. [Google Scholar] [CrossRef] [PubMed]
- Laviad, E.L.; Albee, L.; Pankova-Kholmyansky, I.; Epstein, S.; Park, H.; Merrill, A.H., Jr.; Futerman, A.H. Characterization of ceramide synthase 2: Tissue distribution, substrate specificity, and inhibition by sphingosine 1-phosphate. J. Biol. Chem. 2008, 283, 5677–5684. [Google Scholar] [CrossRef] [PubMed]
- Alemany, R.; van Koppen, C.J.; Danneberg, K.; Ter Braak, M.; Meyer Zu Heringdorf, D. Regulation and functional roles of sphingosine kinases. Naunyn Schmiedebergs Arch. Pharmacol. 2007, 374, 413–428. [Google Scholar] [CrossRef] [PubMed]
- Liu, H.; Toman, R.E.; Goparaju, S.K.; Maceyka, M.; Nava, V.E.; Sankala, H.; Payne, S.G.; Bektas, M.; Ishii, I.; Chun, J.; et al. Sphingosine kinase type 2 is a putative BH3-only protein that induces apoptosis. J. Biol. Chem. 2003, 278, 40330–40336. [Google Scholar] [CrossRef] [PubMed]
- Igarashi, N.; Okada, T.; Hayashi, S.; Fujita, T.; Jahangeer, S.; Nakamura, S. Sphingosine kinase 2 is a nuclear protein and inhibits DNA synthesis. J. Biol. Chem. 2003, 278, 46832–46839. [Google Scholar] [CrossRef] [PubMed]
- Okada, T.; Ding, G.; Sonoda, H.; Kajimoto, T.; Haga, Y.; Khosrowbeygi, A.; Gao, S.; Miwa, N.; Jahangeer, S.; Nakamura, S. Involvement of N-terminal-extended form of sphingosine kinase 2 in serum-dependent regulation of cell proliferation and apoptosis. J. Biol. Chem. 2005, 280, 36318–36325. [Google Scholar] [CrossRef] [PubMed]
- French, K.J.; Zhuang, Y.; Maines, L.W.; Gao, P.; Wang, W.; Beljanski, V.; Upson, J.J.; Green, C.L.; Keller, S.N.; Smith, C.D. Pharmacology and antitumor activity of ABC294640, a selective inhibitor of sphingosine kinase-2. J. Pharmacol. Exp. Ther. 2010, 333, 129–139. [Google Scholar] [CrossRef] [PubMed]
- Hait, N.C.; Bellamy, A.; Milstien, S.; Kordula, T.; Spiegel, S. Sphingosine kinase type 2 activation by ERK-mediated phosphorylation. J. Biol. Chem. 2007, 282, 12058–12065. [Google Scholar] [CrossRef] [PubMed]
- Fukuhara, S.; Simmons, S.; Kawamura, S.; Inoue, A.; Orba, Y.; Tokudome, T.; Sunden, Y.; Arai, Y.; Moriwaki, K.; Ishida, J.; et al. The sphingosine-1-phosphate transporter Spns2 expressed on endothelial cells regulates lymphocyte trafficking in mice. J. Clin. Investig. 2012, 122, 1416–1426. [Google Scholar] [CrossRef] [PubMed]
- Hisano, Y.; Kobayashi, N.; Yamaguchi, A.; Nishi, T. Mouse SPNS2 functions as a sphingosine-1-phosphate transporter in vascular endothelial cells. PLoS ONE 2012, 7, e38941. [Google Scholar] [CrossRef] [PubMed]
- Kobayashi, N.; Yamaguchi, A.; Nishi, T. Characterization of the ATP-dependent sphingosine 1-phosphate transporter in rat erythrocytes. J. Biol. Chem. 2009, 284, 21192–21200. [Google Scholar] [CrossRef] [PubMed]
- Chen, J.; Ingham, N.; Kelly, J.; Jadeja, S.; Goulding, D.; Pass, J.; Mahajan, V.B.; Tsang, S.H.; Nijnik, A.; Jackson, I.J.; et al. Spinster homolog 2 (spns2) deficiency causes early onset progressive hearing loss. PLoS Genet. 2014, 10, e1004688. [Google Scholar] [CrossRef] [PubMed]
- Donoviel, M.S.; Hait, N.C.; Ramachandran, S.; Maceyka, M.; Takabe, K.; Milstien, S.; Oravecz, T.; Spiegel, S. Spinster 2, a sphingosine-1-phosphate transporter, plays a critical role in inflammatory and autoimmune diseases. FASEB J. 2015, 29, 5018–5028. [Google Scholar] [CrossRef] [PubMed]
- Fu, P.; Ebenezer, D.L.; Berdyshev, E.V.; Bronova, I.A.; Shaaya, M.; Harijith, A.; Natarajan, V. Role of sphingosine kinase 1 and S1P transporter Spns2 in HGF-mediated lamellipodia formation in lung endothelium. J. Biol. Chem. 2016, 291, 27187–27203. [Google Scholar] [CrossRef] [PubMed]
- Grgic, I.; Campanholle, G.; Bijol, V.; Wang, C.; Sabbisetti, V.S.; Ichimura, T.; Humphreys, B.D.; Bonventre, J.V. Targeted proximal tubule injury triggers interstitial fibrosis and glomerulosclerosis. Kidney Int. 2012, 82, 172–183. [Google Scholar] [CrossRef] [PubMed] [Green Version]
- Liu, Y. New insights into epithelial-mesenchymal transition in kidney fibrosis. J. Am. Soc. Nephrol. 2010, 21, 212–222. [Google Scholar] [CrossRef] [PubMed]
- Kriz, W.; Kaissling, B.; Le Hir, M. Epithelial-mesenchymal transition (EMT) in kidney fibrosis: Fact or fantasy? J. Clin. Investig. 2011, 121, 468–474. [Google Scholar] [CrossRef] [PubMed]
- Nielsen, S.; Frokiaer, J.; Marples, D.; Kwon, T.H.; Agre, P.; Knepper, M.A. Aquaporins in the kidney: From molecules to medicine. Physiol. Rev. 2002, 82, 205–244. [Google Scholar] [CrossRef] [PubMed]
- Kwon, T.H.; Frokiaer, J.; Fernandez-Llama, P.; Knepper, M.A.; Nielsen, S. Reduced abundance of aquaporins in rats with bilateral ischemia-induced acute renal failure: Prevention by alpha-MSH. Am. J. Physiol. 1999, 277, F413–F427. [Google Scholar] [CrossRef] [PubMed]
- Ren, S.; Babelova, A.; Moreth, K.; Xin, C.; Eberhardt, W.; Doller, A.; Pavenstadt, H.; Schaefer, L.; Pfeilschifter, J.; Huwiler, A. Transforming growth factor-beta2 upregulates sphingosine kinase-1 activity, which in turn attenuates the fibrotic response to TGF-beta2 by impeding CTGF expression. Kidney Int. 2009, 76, 857–867. [Google Scholar] [CrossRef] [PubMed]
- Meyer zu Heringdorf, D.; Liliom, K.; Schaefer, M.; Danneberg, K.; Jaggar, J.H.; Tigyi, G.; Jakobs, K.H. Photolysis of intracellular caged sphingosine-1-phosphate causes Ca2+ mobilization independently of G-protein-coupled receptors. FEBS Lett. 2003, 554, 443–449. [Google Scholar] [CrossRef]
- Qiao, L.; Kozikowski, A.P.; Olivera, A.; Spiegel, S. Synthesis and evaluation of a photolyzable derivative of sphingosine 1-phosphate—Caged SPP. Bioorg. Med. Chem. Lett. 1998, 8, 711–714. [Google Scholar] [CrossRef]
- Xin, C.; Ren, S.; Kleuser, B.; Shabahang, S.; Eberhardt, W.; Radeke, H.; Schafer-Korting, M.; Pfeilschifter, J.; Huwiler, A. Sphingosine 1-phosphate cross-activates the Smad signaling cascade and mimics transforming growth factor-beta-induced cell responses. J. Biol. Chem. 2004, 279, 35255–35262. [Google Scholar] [CrossRef] [PubMed]
- Callihan, P.; Zitomer, N.C.; Stoeling, M.V.; Kennedy, P.C.; Lynch, K.R.; Riley, R.T.; Hooks, S.B. Distinct generation, pharmacology, and distribution of sphingosine 1-phosphate and dihydrosphingosine 1-phosphate in human neural progenitor cells. Neuropharmacology 2012, 62, 988–996. [Google Scholar] [CrossRef] [PubMed]
- Nagahashi, M.; Kim, E.Y.; Yamada, A.; Ramachandran, S.; Allegood, J.C.; Hait, N.C.; Maceyka, M.; Milstien, S.; Takabe, K.; Spiegel, S. Spns2, a transporter of phosphorylated sphingoid bases, regulates their blood and lymph levels, and the lymphatic network. FASEB J. 2013, 27, 1001–1011. [Google Scholar] [CrossRef] [PubMed]
- Huang, C.; Day, M.L.; Poronnik, P.; Pollock, C.A.; Chen, X.M. Inhibition of KCa3.1 suppresses TGF-beta1 induced MCP-1 expression in human proximal tubular cells through Smad3, p38 and ERK1/2 signaling pathways. Int. J. Biochem. Cell Biol. 2014, 47, 1–10. [Google Scholar] [CrossRef] [PubMed]
- Wang, S.N.; LaPage, J.; Hirschberg, R. Role of glomerular ultrafiltration of growth factors in progressive interstitial fibrosis in diabetic nephropathy. Kidney Int. 2000, 57, 1002–1014. [Google Scholar] [CrossRef] [PubMed]
- Mansour, S.G.; Puthumana, J.; Coca, S.G.; Gentry, M.; Parikh, C.R. Biomarkers for the detection of renal fibrosis and prediction of renal outcomes: A systematic review. BMC Nephrol. 2017, 18, 72. [Google Scholar] [CrossRef] [PubMed]
- Schuoler, C.; Haider, T.J.; Leuenberger, C.; Vogel, J.; Ostergaard, L.; Kwapiszewska, G.; Kohler, M.; Gassmann, M.; Huber, L.C.; Brock, M. Aquaporin 1 controls the functional phenotype of pulmonary smooth muscle cells in hypoxia-induced pulmonary hypertension. Basic Res. Cardiol. 2017, 112, 30. [Google Scholar] [CrossRef] [PubMed]
- Rutkovskiy, A.; Bliksoen, M.; Hillestad, V.; Amin, M.; Czibik, G.; Valen, G.; Vaage, J.; Amiry-Moghaddam, M.; Stenslokken, K.O. Aquaporin-1 in cardiac endothelial cells is downregulated in ischemia, hypoxia and cardioplegia. J. Mol. Cell Cardiol. 2013, 56, 22–33. [Google Scholar] [CrossRef] [PubMed]
- Denker, B.M.; Smith, B.L.; Kuhajda, F.P.; Agre, P. Identification, purification, and partial characterization of a novel Mr 28,000 integral membrane protein from erythrocytes and renal tubules. J. Biol. Chem. 1988, 263, 15634–15642. [Google Scholar] [PubMed]
- Yokoi, H.; Mukoyama, M.; Sugawara, A.; Mori, K.; Nagae, T.; Makino, H.; Suganami, T.; Yahata, K.; Fujinaga, Y.; Tanaka, I.; et al. Role of connective tissue growth factor in fibronectin expression and tubulointerstitial fibrosis. Am. J. Physiol. Renal Physiol. 2002, 282, F933–F942. [Google Scholar] [CrossRef] [PubMed]
- Larsen, C.G.; Zachariae, C.O.; Oppenheim, J.J.; Matsushima, K. Production of monocyte chemotactic and activating factor (MCAF) by human dermal fibroblasts in response to interleukin 1 or tumor necrosis factor. Biochem. Biophys. Res. Commun. 1989, 160, 1403–1408. [Google Scholar] [CrossRef]
- Prodjosudjadi, W.; Gerritsma, J.S.; Klar-Mohamad, N.; Gerritsen, A.F.; Bruijn, J.A.; Daha, M.R.; van Es, L.A. Production and cytokine-mediated regulation of monocyte chemoattractant protein-1 by human proximal tubular epithelial cells. Kidney Int. 1995, 48, 1477–1486. [Google Scholar] [CrossRef] [PubMed]
- Rovin, B.H.; Yoshiumura, T.; Tan, L. Cytokine-induced production of monocyte chemoattractant protein-1 by cultured human mesangial cells. J. Immunol. 1992, 148, 2148–2153. [Google Scholar] [PubMed]
- Tesch, G.H. MCP-1/CCL2: A new diagnostic marker and therapeutic target for progressive renal injury in diabetic nephropathy. Am. J. Physiol. Renal Physiol. 2008, 294, F697–F701. [Google Scholar] [CrossRef] [PubMed]
- Heerspink, H.J.; De Zeeuw, D. Novel anti-inflammatory drugs for the treatment of diabetic kidney disease. Diabetologia 2016, 59, 1621–1623. [Google Scholar] [CrossRef] [PubMed]
- De Zeeuw, D.; Bekker, P.; Henkel, E.; Hasslacher, C.; Gouni-Berthold, I.; Mehling, H.; Potarca, A.; Tesar, V.; Heerspink, H.J.; Schall, T.J. The effect of CCR2 inhibitor CCX140-B on residual albuminuria in patients with type 2 diabetes and nephropathy: A randomised trial. Lancet Diabetes Endocrinol. 2015, 3, 687–696. [Google Scholar] [CrossRef]
- Du, C.; Ren, Y.; Yao, F.; Duan, J.; Zhao, H.; Du, Y.; Xiao, X.; Duan, H.; Shi, Y. Sphingosine kinase 1 protects renal tubular epithelial cells from renal fibrosis via induction of autophagy. Int. J. Biochem. Cell Biol. 2017, 90, 17–28. [Google Scholar] [CrossRef] [PubMed]
- Chen, X.L.; Grey, J.Y.; Thomas, S.; Qiu, F.H.; Medford, R.M.; Wasserman, M.A.; Kunsch, C. Sphingosine kinase-1 mediates TNF-alpha-induced MCP-1 gene expression in endothelial cells: Upregulation by oscillatory flow. Am. J. Physiol. Heart Circ. Physiol. 2004, 287, H1452–H1458. [Google Scholar] [CrossRef] [PubMed]
- Hsieh, L.T.; Nastase, M.V.; Roedig, H.; Zeng-Brouwers, J.; Poluzzi, C.; Schwalm, S.; Fork, C.; Tredup, C.; Brandes, R.P.; Wygrecka, M.; et al. Biglycan- and Sphingosine Kinase-1 Signaling Crosstalk Regulates the Synthesis of Macrophage Chemoattractants. Int. J. Mol. Sci. 2017, 18. [Google Scholar] [CrossRef] [PubMed]
- Billich, A.; Urtz, N.; Reuschel, R.; Baumruker, T. Sphingosine kinase 1 is essential for proteinase-activated receptor-1 signalling in epithelial and endothelial cells. Int. J. Biochem. Cell Biol. 2009, 41, 1547–1555. [Google Scholar] [CrossRef] [PubMed]
- Xu, M.; Liu, D.; Ding, L.H.; Ma, K.L.; Wu, M.; Lv, L.L.; Wen, Y.; Liu, H.; Tang, R.N.; Liu, B.C. FTY720 inhibits tubulointerstitial inflammation in albumin overload-induced nephropathy of rats via the Sphk1 pathway. Acta Pharmacol. Sin. 2014, 35, 1537–1545. [Google Scholar] [CrossRef] [PubMed]
- Ueda, A.; Okuda, K.; Ohno, S.; Shirai, A.; Igarashi, T.; Matsunaga, K.; Fukushima, J.; Kawamoto, S.; Ishigatsubo, Y.; Okubo, T. NF-kappa B and Sp1 regulate transcription of the human monocyte chemoattractant protein-1 gene. J. Immunol. 1994, 153, 2052–2063. [Google Scholar] [PubMed]
- Xiong, Y.; Lee, H.J.; Mariko, B.; Lu, Y.C.; Dannenberg, A.J.; Haka, A.S.; Maxfield, F.R.; Camerer, E.; Proia, R.L.; Hla, T. Sphingosine kinases are not required for inflammatory responses in macrophages. J. Biol. Chem. 2013, 288, 32563–32573. [Google Scholar] [CrossRef] [PubMed]
- Etemadi, N.; Chopin, M.; Anderton, H.; Tanzer, M.C.; Rickard, J.A.; Abeysekera, W.; Hall, C.; Spall, S.K.; Wang, B.; Xiong, Y.; et al. TRAF2 regulates TNF and NF-kappaB signalling to suppress apoptosis and skin inflammation independently of Sphingosine kinase 1. Elife 2015, 4. [Google Scholar] [CrossRef] [PubMed]
- Sato, M.; Ikeda, H.; Uranbileg, B.; Kurano, M.; Saigusa, D.; Aoki, J.; Maki, H.; Kudo, H.; Hasegawa, K.; Kokudo, N.; et al. Sphingosine kinase-1, S1P transporter spinster homolog 2 and S1P2 mRNA expressions are increased in liver with advanced fibrosis in human. Sci. Rep. 2016, 6, 32119. [Google Scholar] [CrossRef] [PubMed]
- Park, S.W.; Kim, M.; Chen, S.W.; D’Agati, V.D.; Lee, H.T. Sphinganine-1-phosphate attenuates both hepatic and renal injury induced by hepatic ischemia and reperfusion in mice. Shock 2010, 33, 31–42. [Google Scholar] [CrossRef] [PubMed]
- Lee, S.Y.; Kim, D.H.; Sung, S.A.; Kim, M.G.; Cho, W.Y.; Kim, H.K.; Jo, S.K. Sphingosine-1-phosphate reduces hepatic ischaemia/reperfusion-induced acute kidney injury through attenuation of endothelial injury in mice. Nephrology 2011, 16, 163–173. [Google Scholar] [CrossRef] [PubMed]
- Bajwa, A.; Rosin, D.L.; Chroscicki, P.; Lee, S.; Dondeti, K.; Ye, H.; Kinsey, G.R.; Stevens, B.K.; Jobin, K.; Kenwood, B.M.; et al. Sphingosine 1-phosphate receptor-1 enhances mitochondrial function and reduces cisplatin-induced tubule injury. J. Am. Soc. Nephrol. 2015, 26, 908–925. [Google Scholar] [CrossRef] [PubMed]
- Bajwa, A.; Huang, L.; Kurmaeva, E.; Ye, H.; Dondeti, K.R.; Chroscicki, P.; Foley, L.S.; Balogun, Z.A.; Alexander, K.J.; Park, H.; et al. Sphingosine kinase 2 deficiency attenuates kidney fibrosis via IFN-gamma. J. Am. Soc. Nephrol. 2017, 28, 1145–1161. [Google Scholar] [CrossRef] [PubMed]
- Schwalm, S.; Beyer, S.; Frey, H.; Haceni, R.; Grammatikos, G.; Thomas, D.; Geisslinger, G.; Schaefer, L.; Huwiler, A.; Pfeilschifter, J. Sphingosine kinase-2 deficiency ameliorates kidney fibrosis by up-regulating Smad7 in a mouse model of unilateral ureteral obstruction. Am. J. Pathol. 2017, 187, 2413–2429. [Google Scholar] [CrossRef] [PubMed]
- Zemann, B.; Kinzel, B.; Muller, M.; Reuschel, R.; Mechtcheriakova, D.; Urtz, N.; Bornancin, F.; Baumruker, T.; Billich, A. Sphingosine kinase type 2 is essential for lymphopenia induced by the immunomodulatory drug FTY720. Blood 2006, 107, 1454–1458. [Google Scholar] [CrossRef] [PubMed]
- Liang, J.; Nagahashi, M.; Kim, E.Y.; Harikumar, K.B.; Yamada, A.; Huang, W.C.; Hait, N.C.; Allegood, J.C.; Price, M.M.; Avni, D.; et al. Sphingosine-1-phosphate links persistent STAT3 activation, chronic intestinal inflammation, and development of colitis-associated cancer. Cancer Cell 2013, 23, 107–120. [Google Scholar] [CrossRef] [PubMed]
- Schwalm, S.; Timcheva, T.M.; Filipenko, I.; Ebadi, M.; Hofmann, L.P.; Zangemeister-Wittke, U.; Pfeilschifter, J.; Huwiler, A. Sphingosine kinase 2 deficiency increases proliferation and migration of renal mouse mesangial cells and fibroblasts. Biol. Chem. 2015, 396, 813–825. [Google Scholar] [CrossRef] [PubMed]
- Noh, H.; Oh, E.Y.; Seo, J.Y.; Yu, M.R.; Kim, Y.O.; Ha, H.; Lee, H.B. Histone deacetylase-2 is a key regulator of diabetes- and transforming growth factor-beta1-induced renal injury. Am. J. Physiol. Renal Physiol. 2009, 297, F729–F739. [Google Scholar] [CrossRef] [PubMed]
- Verkman, A.S.; Yang, B. Aquaporin gene delivery to kidney. Kidney Int. 2002, 61, S120–S124. [Google Scholar] [CrossRef] [PubMed]
- Wang, W.; Li, C.; Summer, S.N.; Falk, S.; Ljubanovic, D.; Schrier, R.W. Role of AQP1 in endotoxemia-induced acute kidney injury. Am. J. Physiol. Renal Physiol. 2008, 294, F1473–F1480. [Google Scholar] [CrossRef] [PubMed]
- Coldewey, S.M.; Benetti, E.; Collino, M.; Pfeilschifter, J.; Sponholz, C.; Bauer, M.; Huwiler, A.; Thiemermann, C. Elevation of serum sphingosine-1-phosphate attenuates impaired cardiac function in experimental sepsis. Sci. Rep. 2016, 6, 27594. [Google Scholar] [CrossRef] [PubMed]
- Winkler, M.S.; Nierhaus, A.; Holzmann, M.; Mudersbach, E.; Bauer, A.; Robbe, L.; Zahrte, C.; Geffken, M.; Peine, S.; Schwedhelm, E.; et al. Decreased serum concentrations of sphingosine-1-phosphate in sepsis. Crit. Care 2015, 19, 372. [Google Scholar] [CrossRef] [PubMed]
- Tang, S.; Leung, J.C.; Lam, C.W.; Lai, F.M.; Chan, T.M.; Lai, K.N. In vitro studies of aquaporins 1 and 3 expression in cultured human proximal tubular cells: Upregulation by transferrin but not albumin. Am. J. Kidney Dis. 2001, 38, 317–330. [Google Scholar] [CrossRef] [PubMed]
- Saad, S.; Zhang, J.; Yong, R.; Yaghobian, D.; Wong, M.G.; Kelly, D.J.; Chen, X.M.; Pollock, C.A. Role of the EGF receptor in PPARgamma-mediated sodium and water transport in human proximal tubule cells. Diabetologia 2013, 56, 1174–1182. [Google Scholar] [CrossRef] [PubMed]
- Lanaspa, M.A.; Andres-Hernando, A.; Li, N.; Rivard, C.J.; Cicerchi, C.; Roncal-Jimenez, C.; Schrier, R.W.; Berl, T. The expression of aquaporin-1 in the medulla of the kidney is dependent on the transcription factor associated with hypertonicity, TonEBP. J. Biol. Chem. 2010, 285, 31694–31703. [Google Scholar] [CrossRef] [PubMed]
- Jiang, Y.; Liu, H.; Liu, W.J.; Tong, H.B.; Chen, C.J.; Lin, F.G.; Zhuo, Y.H.; Qian, X.Z.; Wang, Z.B.; Wang, Y.; et al. Endothelial Aquaporin-1 (AQP1) Expression Is Regulated by Transcription Factor Mef2c. Mol. Cells 2016, 39, 292–298. [Google Scholar] [PubMed]
- Castaldi, A.; Chesini, G.P.; Taylor, A.E.; Sussman, M.A.; Brown, J.H.; Purcell, N.H. Sphingosine 1-phosphate elicits RhoA-dependent proliferation and MRTF-A mediated gene induction in CPCs. Cell Signal. 2016, 28, 871–879. [Google Scholar] [CrossRef] [PubMed]
- Doll, F.; Pfeilschifter, J.; Huwiler, A. The epidermal growth factor stimulates sphingosine kinase-1 expression and activity in the human mammary carcinoma cell line MCF7. Biochim. Biophys. Acta 2005, 1738, 72–81. [Google Scholar] [CrossRef] [PubMed]
- Huwiler, A.; Doll, F.; Ren, S.; Klawitter, S.; Greening, A.; Romer, I.; Bubnova, S.; Reinsberg, L.; Pfeilschifter, J. Histamine increases sphingosine kinase-1 expression and activity in the human arterial endothelial cell line EA.hy 926 by a PKC-alpha-dependent mechanism. Biochim. Biophys. Acta 2006, 1761, 367–376. [Google Scholar] [CrossRef] [PubMed]
- Huwiler, A.; Kotelevets, N.; Xin, C.; Pastukhov, O.; Pfeilschifter, J.; Zangemeister-Wittke, U. Loss of sphingosine kinase-1 in carcinoma cells increases formation of reactive oxygen species and sensitivity to doxorubicin-induced DNA damage. Br. J. Pharmacol. 2011, 162, 532–543. [Google Scholar] [CrossRef] [PubMed]
- Kawahara, A.; Nishi, T.; Hisano, Y.; Fukui, H.; Yamaguchi, A.; Mochizuki, N. The sphingolipid transporter spns2 functions in migration of zebrafish myocardial precursors. Science 2009, 323, 524–527. [Google Scholar] [CrossRef] [PubMed]
- Schmidt, H.; Schmidt, R.; Geisslinger, G. LC-MS/MS-analysis of sphingosine-1-phosphate and related compounds in plasma samples. Prostag. Other Lipid Mediat. 2006, 81, 162–170. [Google Scholar] [CrossRef] [PubMed]


© 2018 by the authors. Licensee MDPI, Basel, Switzerland. This article is an open access article distributed under the terms and conditions of the Creative Commons Attribution (CC BY) license (http://creativecommons.org/licenses/by/4.0/).
Share and Cite
Blanchard, O.; Stepanovska, B.; Starck, M.; Erhardt, M.; Römer, I.; Meyer zu Heringdorf, D.; Pfeilschifter, J.; Zangemeister-Wittke, U.; Huwiler, A. Downregulation of the S1P Transporter Spinster Homology Protein 2 (Spns2) Exerts an Anti-Fibrotic and Anti-Inflammatory Effect in Human Renal Proximal Tubular Epithelial Cells. Int. J. Mol. Sci. 2018, 19, 1498. https://doi.org/10.3390/ijms19051498
Blanchard O, Stepanovska B, Starck M, Erhardt M, Römer I, Meyer zu Heringdorf D, Pfeilschifter J, Zangemeister-Wittke U, Huwiler A. Downregulation of the S1P Transporter Spinster Homology Protein 2 (Spns2) Exerts an Anti-Fibrotic and Anti-Inflammatory Effect in Human Renal Proximal Tubular Epithelial Cells. International Journal of Molecular Sciences. 2018; 19(5):1498. https://doi.org/10.3390/ijms19051498
Chicago/Turabian StyleBlanchard, Olivier, Bisera Stepanovska, Manuel Starck, Martin Erhardt, Isolde Römer, Dagmar Meyer zu Heringdorf, Josef Pfeilschifter, Uwe Zangemeister-Wittke, and Andrea Huwiler. 2018. "Downregulation of the S1P Transporter Spinster Homology Protein 2 (Spns2) Exerts an Anti-Fibrotic and Anti-Inflammatory Effect in Human Renal Proximal Tubular Epithelial Cells" International Journal of Molecular Sciences 19, no. 5: 1498. https://doi.org/10.3390/ijms19051498