
A Systematic Evaluation of Blood Serum and Plasma Pre-Analytics for Metabolomics Cohort Studies

 and
and
Abstract
:1. Introduction
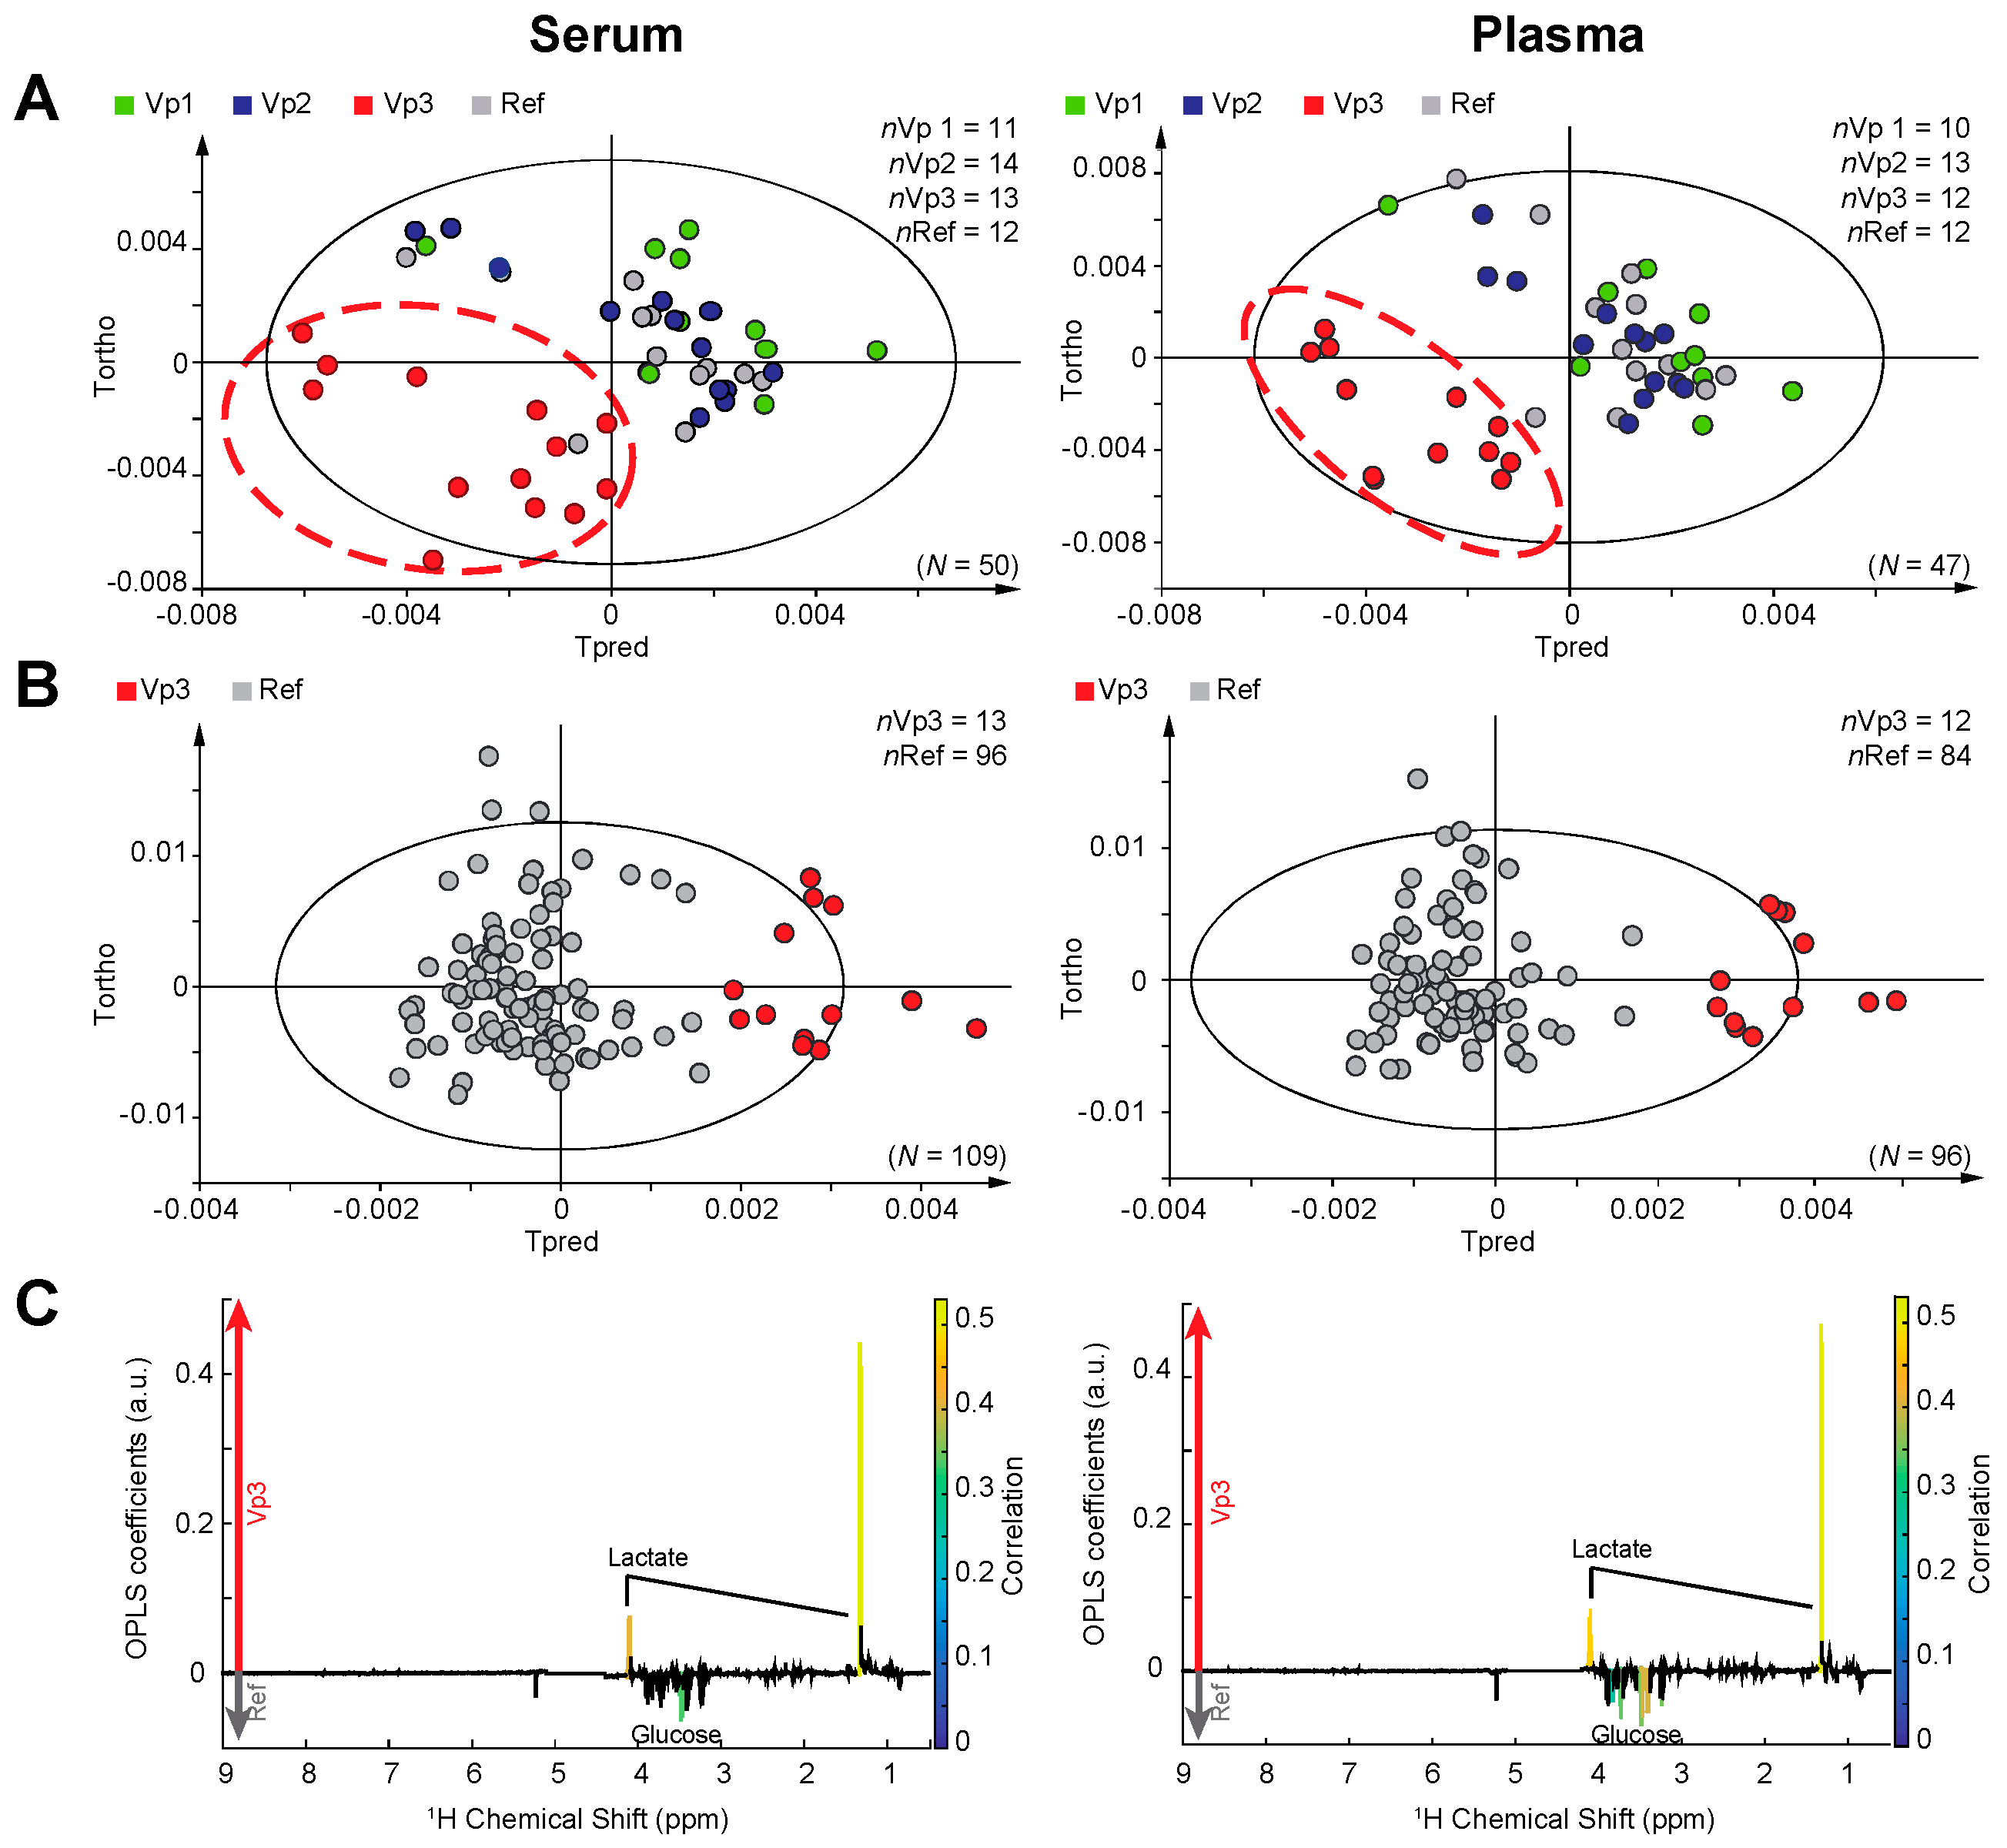
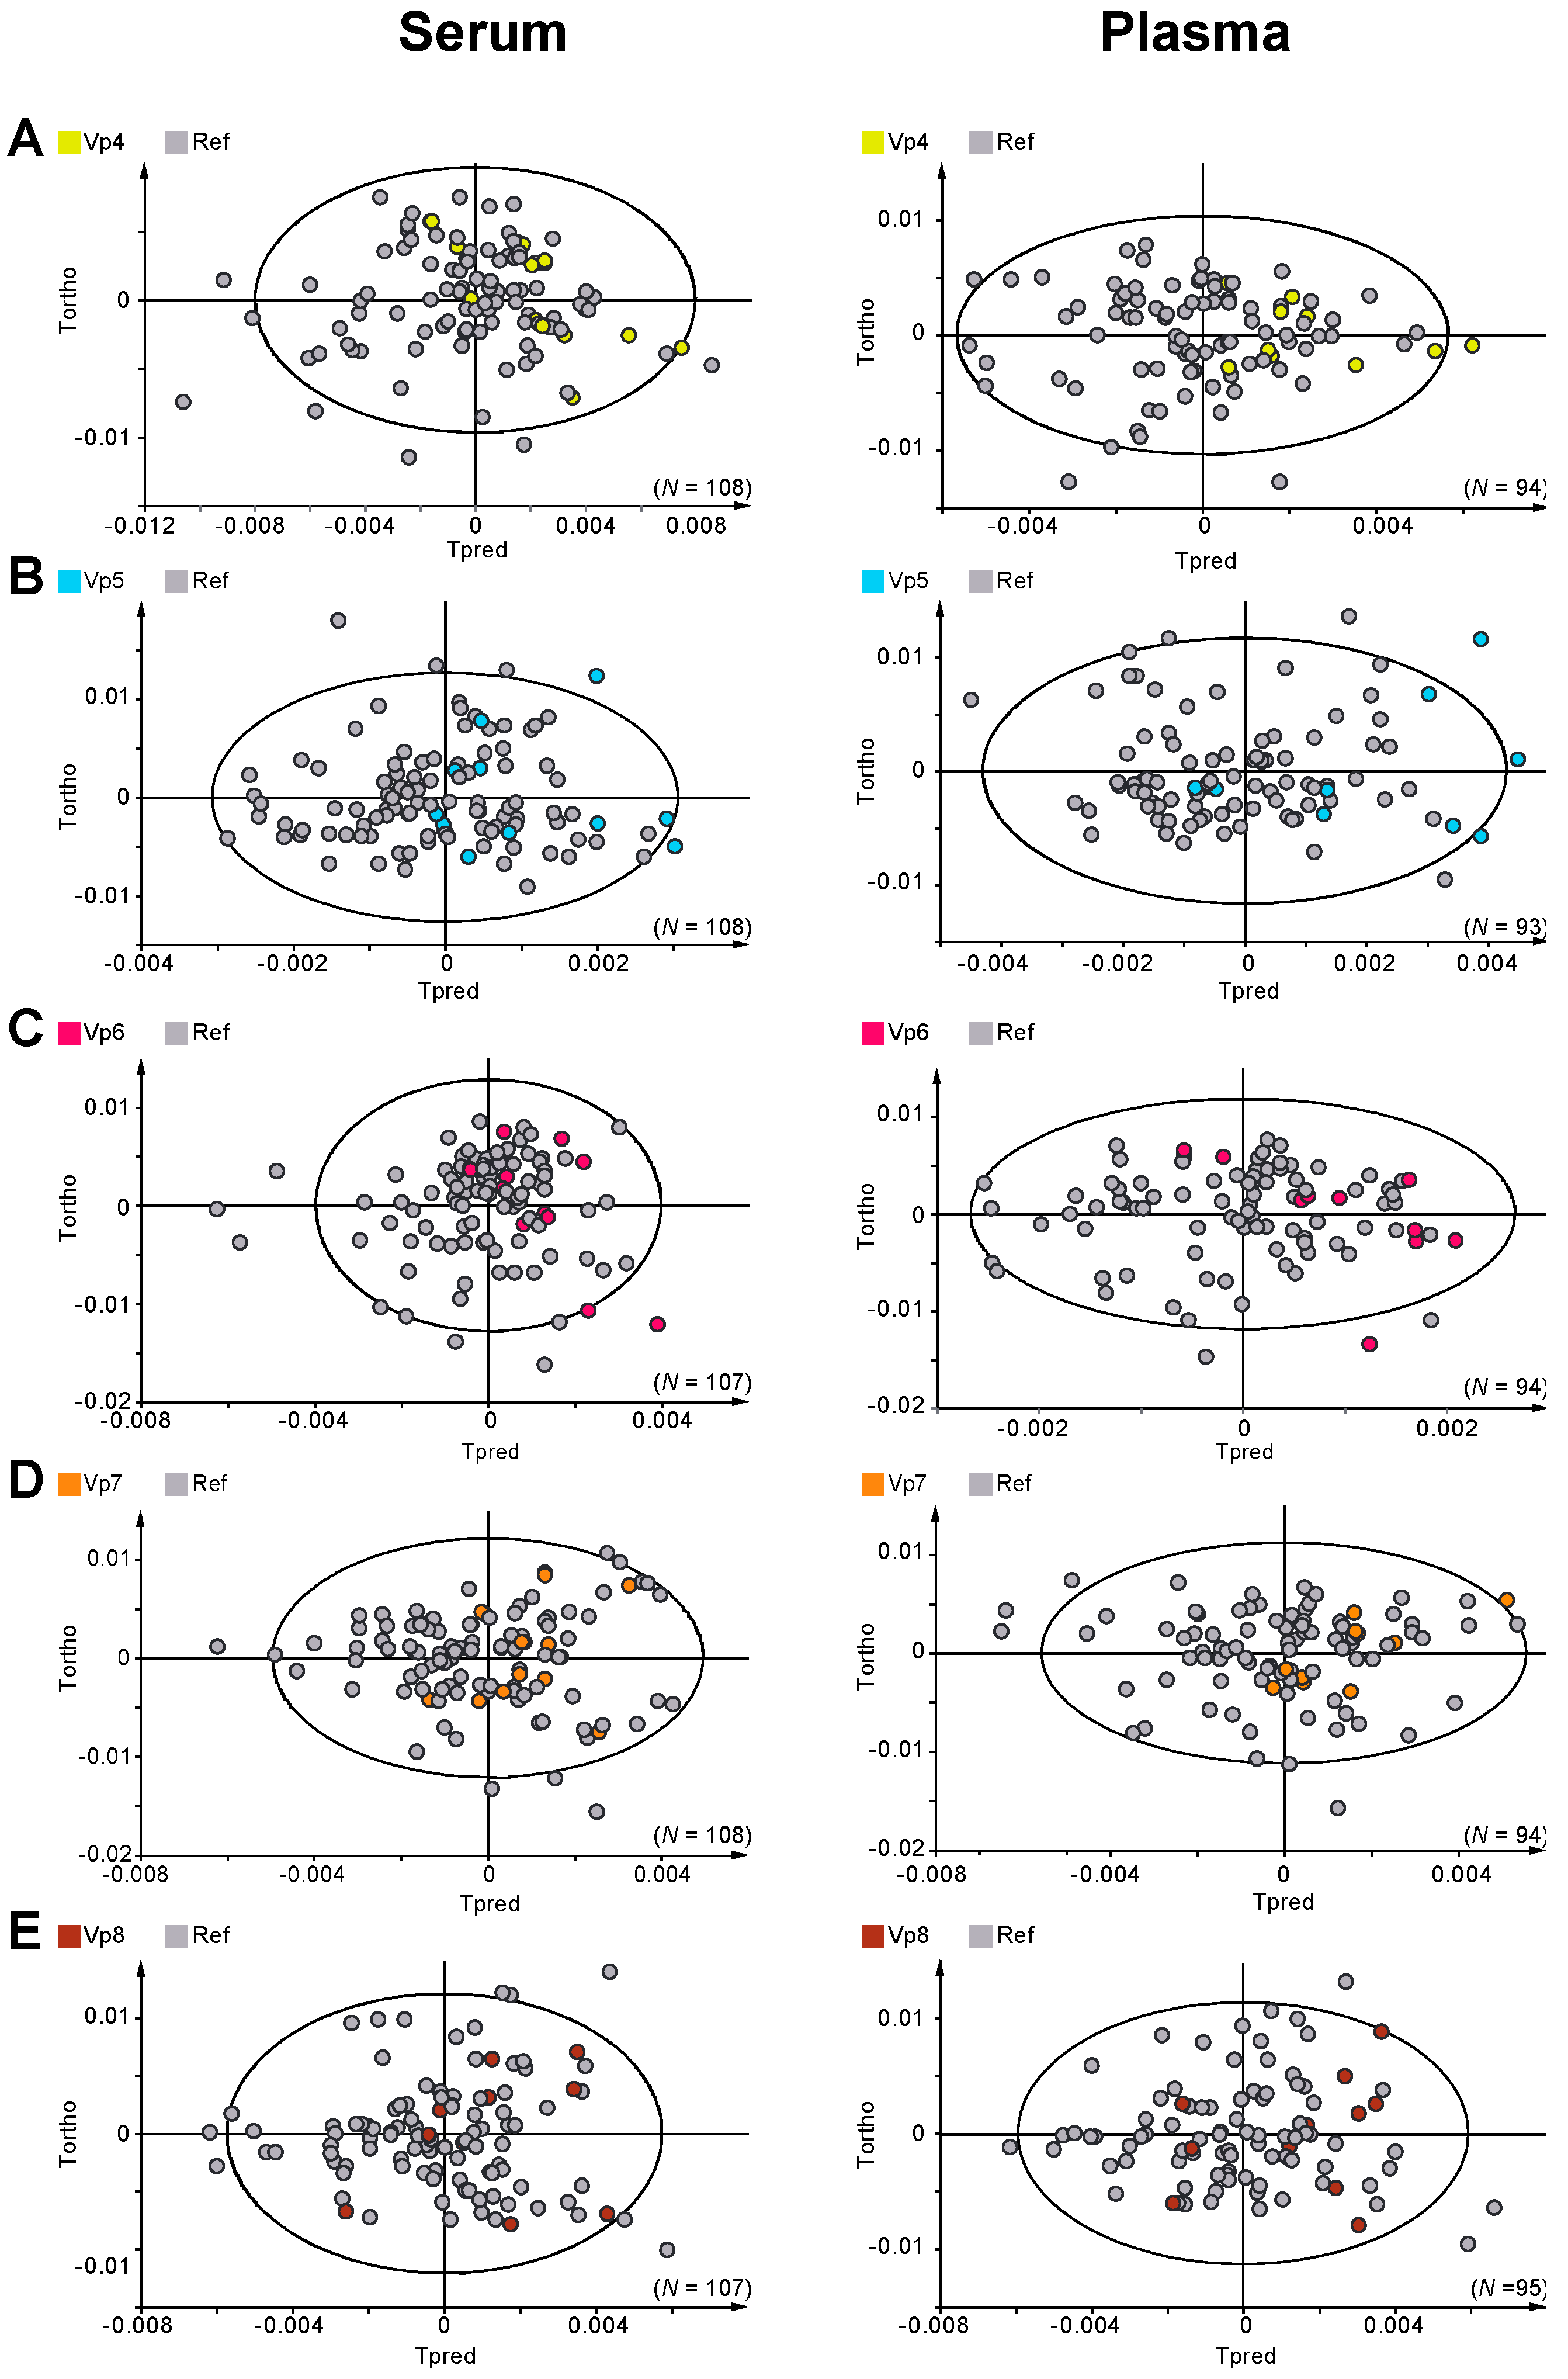
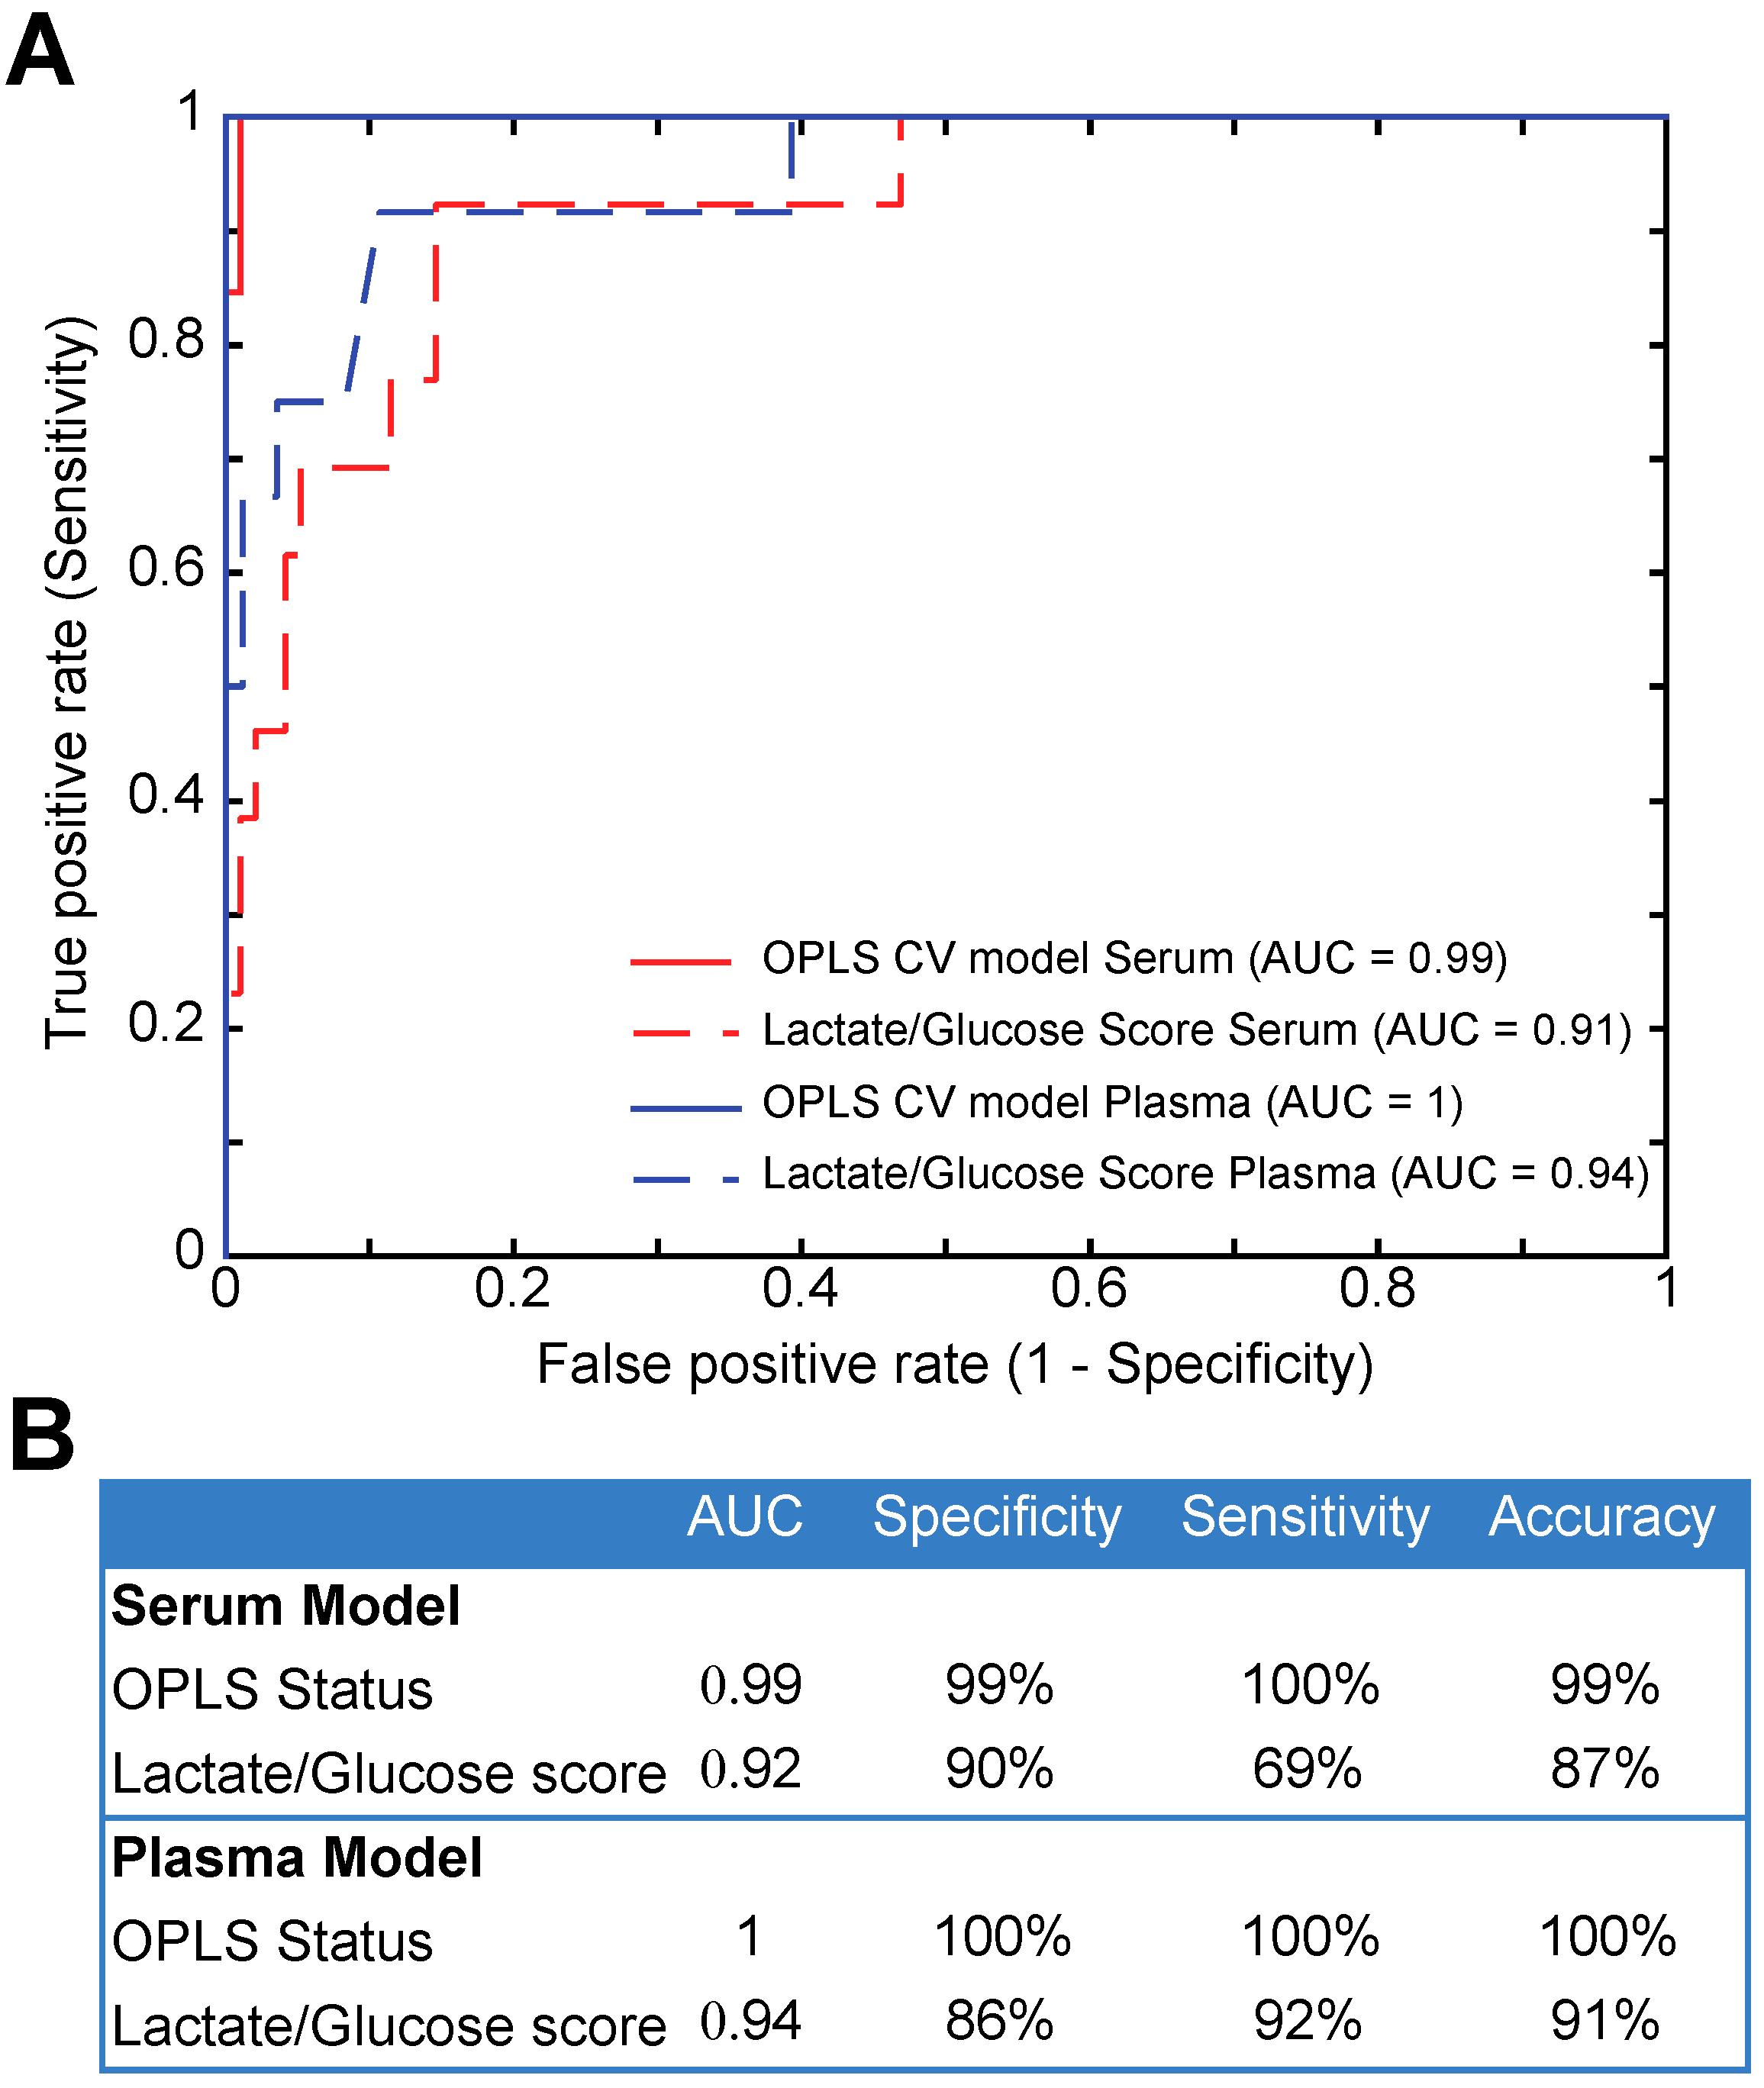
2. Results
3. Discussion
4. Materials and Methods
4.1. Design and Sample Collection
4.2. Sample Preparation
4.3. 1H NMR Spectroscopy
4.4. Multivariate and Univariate Analysis
4.5. Glucose/Lactate Ratio
4.6. Receiver Operating Characteristics
5. Conclusions
Supplementary Materials
Acknowledgments
Author Contributions
Conflicts of Interest
References
- Illig, T.; Gieger, C.; Zhai, G.; Römisch-Margl, W.; Wang-Sattler, R.; Prehn, C.; Altmaier, E.; Kastenmüller, G.; Kato, B.S.; Mewes, H.-W.; et al. A genome-wide perspective of genetic variation in human metabolism. Nat. Genet. 2009, 42, 137–141. [Google Scholar] [CrossRef] [PubMed]
- Fages, A.; Duarte-Salles, T.; Stepien, M.; Ferrari, P.; Fedirko, V.; Pontoizeau, C.; Trichopoulou, A.; Aleksandrova, K.; Tjønneland, A.; Olsen, A.; et al. Metabolomic profiles of hepatocellular carcinoma in a European prospective cohort. BMC Med. 2015, 13, 242. [Google Scholar] [CrossRef] [PubMed]
- Holmes, E.; Loo, R.L.; Stamler, J.; Bictash, M.; Yap, I.K.S.; Chan, Q.; Ebbels, T.M.; de Iorio, M.; Brown, I.J.; Veselkov, K.A.; et al. Human metabolic phenotype diversity and its association with diet and blood pressure. Nature 2008, 453, 396–400. [Google Scholar] [CrossRef] [PubMed]
- Dumas, M.E.; Wilder, S.P.; Bihoreau, M.T.; Barton, R.H.; Fearnside, J.F.; Argoud, K.; D’Amato, L.; Wallis, R.H.; Blancher, C.; Keun, H.C.; et al. Direct quantitative trait locus mapping of mammalian metabolic phenotypes in diabetic and normoglycemic rat models. Nat. Genet. 2007, 39, 666–672. [Google Scholar] [CrossRef] [PubMed]
- Suhre, K.; Shin, S.Y.; Petersen, A.K.; Mohney, R.P.; Meredith, D.; Wägele, B.; Altmaier, E.; Deloukas, P.; Erdmann, J.; Grundberg, E.; et al. Human metabolic individuality in biomedical and pharmaceutical research. Nature 2011, 477, 54–60. [Google Scholar] [CrossRef] [PubMed]
- Robinette, S.L.; Holmes, E.; Nicholson, J.K.; Dumas, M.E. Genetic determinants of metabolism in health and disease: From biochemical genetics to genome-wide associations. Genome Med. 2012, 4, 30. [Google Scholar] [CrossRef] [PubMed]
- Nicholson, J.K. J.; Connelly, J.J.; Lindon, J.C.J.; Holmes, E.E. Metabonomics: A platform for studying drug toxicity and gene function. Nat. Rev. Drug Discov. 2002, 1, 153–161. [Google Scholar] [CrossRef] [PubMed]
- Lu, Y.; Huang, C.; Gao, L.; Xu, Y.-J.; Chia, S.E.; Chen, S.; Li, N.; Yu, K.; Ling, Q.; Cheng, Q.; et al. Identification of serum biomarkers associated with hepatitis B virus-related hepatocellular carcinoma and liver cirrhosis using mass-spectrometry-based metabolomics. Metabolomics 2015, 11, 1526–1538. [Google Scholar] [CrossRef]
- Jobard, E.; Pontoizeau, C.; Blaise, B.J.; Bachelot, T.; Elena-Herrmann, B.; Tredan, O. A serum nuclear magnetic resonance-based metabolomic signature of advanced metastatic human breast cancer. Cancer Lett. 2014, 343, 33–41. [Google Scholar] [CrossRef] [PubMed]
- Ravipati, S.; Baldwin, D.R.; Barr, H.L.; Fogarty, A.W.; Barrett, D.A. Plasma lipid biomarker signatures in squamous carcinoma and adenocarcinoma lung cancer patients. Metabolomics 2015, 11, 1600–1611. [Google Scholar] [CrossRef]
- Brindle, J.; Antti, H.; Holmes, E.; Tranter, G.; Nicholson, J.; Bethell, H.; Clarke, S.; Schofield, P.; McKilligin, E.; Mosedale, D.; et al. Rapid and noninvasive diagnosis of the presence and severity of coronary heart disease using 1H NMR-based metabonomics (vol 8, pg 1439, 2002). Nat. Med. 2003, 9, 477. [Google Scholar]
- Wang, Z.; Klipfell, E.; Bennett, B.J.; Koeth, R.; Levison, B.S.; DuGar, B.; Feldstein, A.E.; Britt, E.B.; Fu, X.; Chung, Y.-M.; et al. Gut flora metabolism of phosphatidylcholine promotes cardiovascular disease. Nature 2012, 472, 57–63. [Google Scholar] [CrossRef] [PubMed]
- Jobard, E.; Blanc, E.; Negrier, S.; Gravis, G.; Chevreau, C.; Elena-Herrmann, B.; Trédan, O. A serum metabolomic fingerprint of bevacizumab and temsirolimus combination as first-line treatment of metastatic renal cell carcinoma. Br. J. Cancer 2015, 113, 1148–1157. [Google Scholar] [CrossRef] [PubMed]
- Tenori, L.; Oakman, C.; Claudino, W.M.; Bernini, P.; Cappadona, S.; Nepi, S.; Biganzoli, L.; Arbushites, M.C.; Luchinat, C.; Bertini, I.; et al. Exploration of serum metabolomic profiles and outcomes in women with metastatic breast cancer: A pilot study. Mol. Oncol. 2012, 6, 437–444. [Google Scholar] [CrossRef] [PubMed]
- Wei, S.; Liu, L.; Zhang, J.; Bowers, J.; Gowda, G.A.N.; Seeger, H.; Fehm, T.; Neubauer, H.J.; Vogel, U.; Clare, S.E.; et al. Metabolomics approach for predicting response to neoadjuvant chemotherapy for breast cancer. Mol. Oncol. 2013, 7, 297–307. [Google Scholar] [CrossRef] [PubMed]
- Clayton, T.; Lindon, J.; Cloarec, O.; Antti, H.; Charuel, C.; Hanton, G.; Provost, J.; Le Net, J.; Baker, D.; Walley, R.; et al. Pharmaco-metabonomic phenotyping and personalized drug treatment. Nature 2006, 440, 1073–1077. [Google Scholar] [CrossRef] [PubMed]
- Clayton, T.A.; Baker, D.; Lindon, J.C.; Everett, J.R.; Nicholson, J.K. Pharmacometabonomic identification of a significant host-microbiome metabolic interaction affecting human drug metabolism. Proc. Natl. Acad. Sci. USA 2009, 106, 14728–14733. [Google Scholar] [CrossRef] [PubMed]
- Kinross, J.M.; Holmes, E.; Darzi, A.W.; Nicholson, J.K. Metabolic phenotyping for monitoring surgical patients. Lancet 2011, 377, 1817–1819. [Google Scholar] [CrossRef]
- Mirnezami, R.; Nicholson, J.; Darzi, A. Preparing for precision medicine. N. Engl. J. Med. 2012, 366, 489–491. [Google Scholar] [CrossRef] [PubMed]
- Beckonert, O.; Keun, H.C.; Ebbels, T.M.D.; Bundy, J.G.; Holmes, E.; Lindon, J.C.; Nicholson, J.K. Metabolic profiling, metabolomic and metabonomic procedures for NMR spectroscopy of urine, plasma, serum and tissue extracts. Nat. Protoc. 2007, 2, 2692–2703. [Google Scholar] [CrossRef] [PubMed]
- Want, E.J.; Wilson, I.D.; Gika, H.; Theodoridis, G.; Plumb, R.S.; Shockcor, J.; Holmes, E.; Nicholson, J.K. Global metabolic profiling procedures for urine using UPLC-MS. Nat. Protoc. 2010, 5, 1005–1018. [Google Scholar] [CrossRef] [PubMed]
- Dona, A.C.; Jimenez, B.; Schaefer, H.; Humpfer, E.; Spraul, M.; Lewis, M.R.; Pearce, J.T.M.; Holmes, E.; Lindon, J.C.; Nicholson, J.K. Precision high throughput proton NMR spectroscopy of human urine, serum and plasma for large-scale metabolic phenotyping. Anal. Chem. 2014, 86, 9887–9894. [Google Scholar] [CrossRef] [PubMed]
- Yin, P.; Lehmann, R.; Xu, G. Effects of pre-analytical processes on blood samples used in metabolomics studies. Anal. Bioanal. Chem. 2015, 407, 4879–4892. [Google Scholar] [CrossRef] [PubMed]
- Kohler, I.; Verhoeven, A.; Derks, R.J.; Giera, M. Analytical pitfalls and challenges in clinical metabolomics. Bioanalysis 2016, 8, 1509–1532. [Google Scholar] [CrossRef] [PubMed]
- Barton, R.H.; Nicholson, J.K.; Elliott, P.; Holmes, E. High-throughput 1H NMR-based metabolic analysis of human serum and urine for large-scale epidemiological studies: Validation study. Int. J. Epidemiol. 2008, 37 (Suppl. 1), i31–i40. [Google Scholar] [CrossRef] [PubMed]
- Teahan, O.; Gamble, S.; Holmes, E.; Waxman, J. Impact of Analytical Bias in Metabonomic Studies of Human Blood Serum and Plasma. Anal. Chem. 2006, 78, 4307–4318. [Google Scholar] [CrossRef] [PubMed]
- Hebels, D.G.A.J.; Georgiadis, P.; Keun, H.C.; Athersuch, T.J.; Vineis, P.; Vermeulen, R.; Portengen, L.; Bergdahl, I.A.; Hallmans, G.; Palli, D.; et al. Performance in Omics Analyses of Blood Samples in Long-Term Storage: Opportunities for the Exploitation of Existing Biobanks in Environmental Health Research. Environ. Health Perspect. 2013, 121, 480–487. [Google Scholar] [CrossRef] [PubMed]
- Pinto, J.; Domingues, M.R.M.; Galhano, E.; Pita, C.; Almeida, M.D.C.; Carreira, I.M.; Gil, A.M. Human plasma stability during handling and storage: Impact on NMR metabolomics. Analyst 2014, 139, 1168–1177. [Google Scholar] [CrossRef] [PubMed]
- Barton, R.H.; Waterman, D.; Bonner, F.W.; Holmes, E.; Clarke, R.; Consortium, T.P.; Nicholson, J.K.; Lindon, J.C. The influence of EDTA and citrate anticoagulant addition to human plasma on information recovery from NMR-based metabolic profiling studies. Mol. BioSyst. 2009, 6, 215–224. [Google Scholar] [CrossRef] [PubMed]
- Bervoets, L.; Louis, E.; Reekmans, G.; Mesotten, L.; Thomeer, M.; Adriaensens, P.; Linsen, L. Influence of preanalytical sampling conditions on the 1H NMR metabolic profile of human blood plasma and introduction of the Standard PREanalytical Code used in biobanking. Metabolomics 2015, 11, 1197–1207. [Google Scholar] [CrossRef]
- Fliniaux, O.; Gaillard, G.; Lion, A.; Cailleu, D.; Mesnard, F.; Betsou, F. Influence of common preanalytical variations on the metabolic profile of serum samples in biobanks. J. Biomol. NMR 2011, 51, 457–465. [Google Scholar] [CrossRef] [PubMed]
- Bernini, P.; Bertini, I.; Luchinat, C.; Nincheri, P.; Staderini, S.; Turano, P. Standard operating procedures for pre-analytical handling of blood and urine for metabolomic studies and biobanks. J. Biomol. NMR 2011, 49, 231–243. [Google Scholar] [CrossRef] [PubMed]
- Deprez, S.; Sweatman, B.C.; Connor, S.C.; Haselden, J.N.; Waterfield, C.J. Optimisation of collection, storage and preparation of rat plasma for 1H NMR spectroscopic analysis in toxicology studies to determine inherent variation in biochemical profiles. J. Pharm. Biomed. Anal. 2002, 30, 1297–1310. [Google Scholar] [CrossRef]
- Lesche, D.; Geyer, R.; Lienhard, D.; Nakas, C.T.; Diserens, G.; Vermathen, P.; Leichtle, A.B. Does centrifugation matter? Centrifugal force and spinning time alter the plasma metabolome. Metabolomics 2016, 12, 1–6. [Google Scholar] [CrossRef] [PubMed]
- Trezzi, J.-P.; Bulla, A.; Bellora, C.; Rose, M.; Lescuyer, P.; Kiehntopf, M.; Hiller, K.; Betsou, F. LacaScore: A novel plasma sample quality control tool based on ascorbic acid and lactic acid levels. Metabolomics 2016, 12, 1–11. [Google Scholar] [CrossRef] [PubMed]
- Wishart, D.S.; Knox, C.; Guo, A.C.; Eisner, R.; Young, N.; Gautam, B.; Hau, D.D.; Psychogios, N.; Dong, E.; Bouatra, S.; et al. HMDB: A knowledgebase for the human metabolome. Nucleic Acids Res. 2009, 37, D603–D610. [Google Scholar] [CrossRef] [PubMed]
- Trygg, J.; Wold, S. Orthogonal projections to latent structures (O-PLS). J. Chemom. 2002, 16, 119–128. [Google Scholar] [CrossRef]
- Eriksson, L.; Trygg, J.; Wold, S. CV-ANOVA for significance testing of PLS and OPLS (R) models. J. Chemom. 2008, 22, 594–600. [Google Scholar] [CrossRef]
- Blaise, B.J.; Shintu, L.; Elena, B.; Emsley, L.; Dumas, M.E.; Toulhoat, P. Statistical Recoupling Prior to Significance Testing in Nuclear Magnetic Resonance Based Metabonomics. Anal. Chem. 2009, 81, 6242–6251. [Google Scholar] [CrossRef] [PubMed]


| Protocol | Processing | Freezing & Storage | |||||
|---|---|---|---|---|---|---|---|
| Delay of Incubation | Temperature of Incubation | Centrifugation Parameters | Delay between Sample Preparation & Freezing at −80 °C | Time at −80 °C | |||
| Speed | Temperature | Time | |||||
| Reference (Ref) | 1 h | 22 °C | 2000 g | 20 °C | 10′ | 15′ | 3 months |
| Variant 1 (Vp1) | 1 h | 4 °C | 2000 g | 20 °C | 10′ | 15′ | 3 months |
| Variant 2 (Vp2) | 6 h | 4 °C | 2000 g | 20 °C | 10′ | 15′ | 3 months |
| Variant 3 (Vp3) | 6 h | 22 °C | 2000 g | 20 °C | 10′ | 15′ | 3 months |
| Variant 4 (Vp4) | 1 h | 22 °C | 2000 g | 20 °C | 20′ | 15′ | 3 months |
| Variant 5 (Vp5) | 1 h | 22 °C | 2000 g | 4 °C | 10′ | 15′ | 3 months |
| Variant 6 (Vp6) | 1 h | 22 °C | 3000 g | 20 °C | 10′ | 15′ | 3 months |
| Variant 7 (Vp7) | 1 h | 22 °C | 2000 g | 20 °C | 10′ | 1 h | 3 months |
| Variant 8 (Vp8) | 1 h | 22 °C | 2000 g | 20 °C | 10′ | 15′ | 48 h |
© 2016 by the authors; licensee MDPI, Basel, Switzerland. This article is an open access article distributed under the terms and conditions of the Creative Commons Attribution (CC-BY) license (http://creativecommons.org/licenses/by/4.0/).
Share and Cite
Jobard, E.; Trédan, O.; Postoly, D.; André, F.; Martin, A.-L.; Elena-Herrmann, B.; Boyault, S. A Systematic Evaluation of Blood Serum and Plasma Pre-Analytics for Metabolomics Cohort Studies. Int. J. Mol. Sci. 2016, 17, 2035. https://doi.org/10.3390/ijms17122035
Jobard E, Trédan O, Postoly D, André F, Martin A-L, Elena-Herrmann B, Boyault S. A Systematic Evaluation of Blood Serum and Plasma Pre-Analytics for Metabolomics Cohort Studies. International Journal of Molecular Sciences. 2016; 17(12):2035. https://doi.org/10.3390/ijms17122035
Chicago/Turabian StyleJobard, Elodie, Olivier Trédan, Déborah Postoly, Fabrice André, Anne-Laure Martin, Bénédicte Elena-Herrmann, and Sandrine Boyault. 2016. "A Systematic Evaluation of Blood Serum and Plasma Pre-Analytics for Metabolomics Cohort Studies" International Journal of Molecular Sciences 17, no. 12: 2035. https://doi.org/10.3390/ijms17122035