
Proteomic Identification of Target Proteins of Thiodigalactoside in White Adipose Tissue from Diet-Induced Obese Rats

Abstract
:
1. Introduction
2. Results
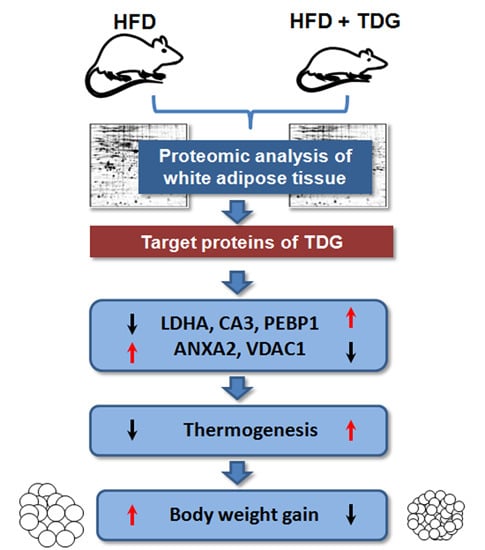
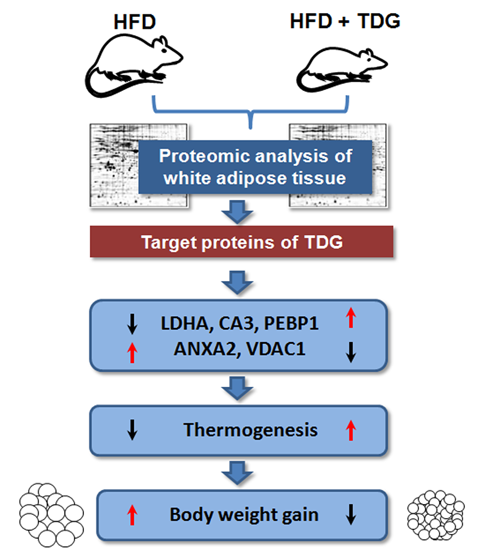
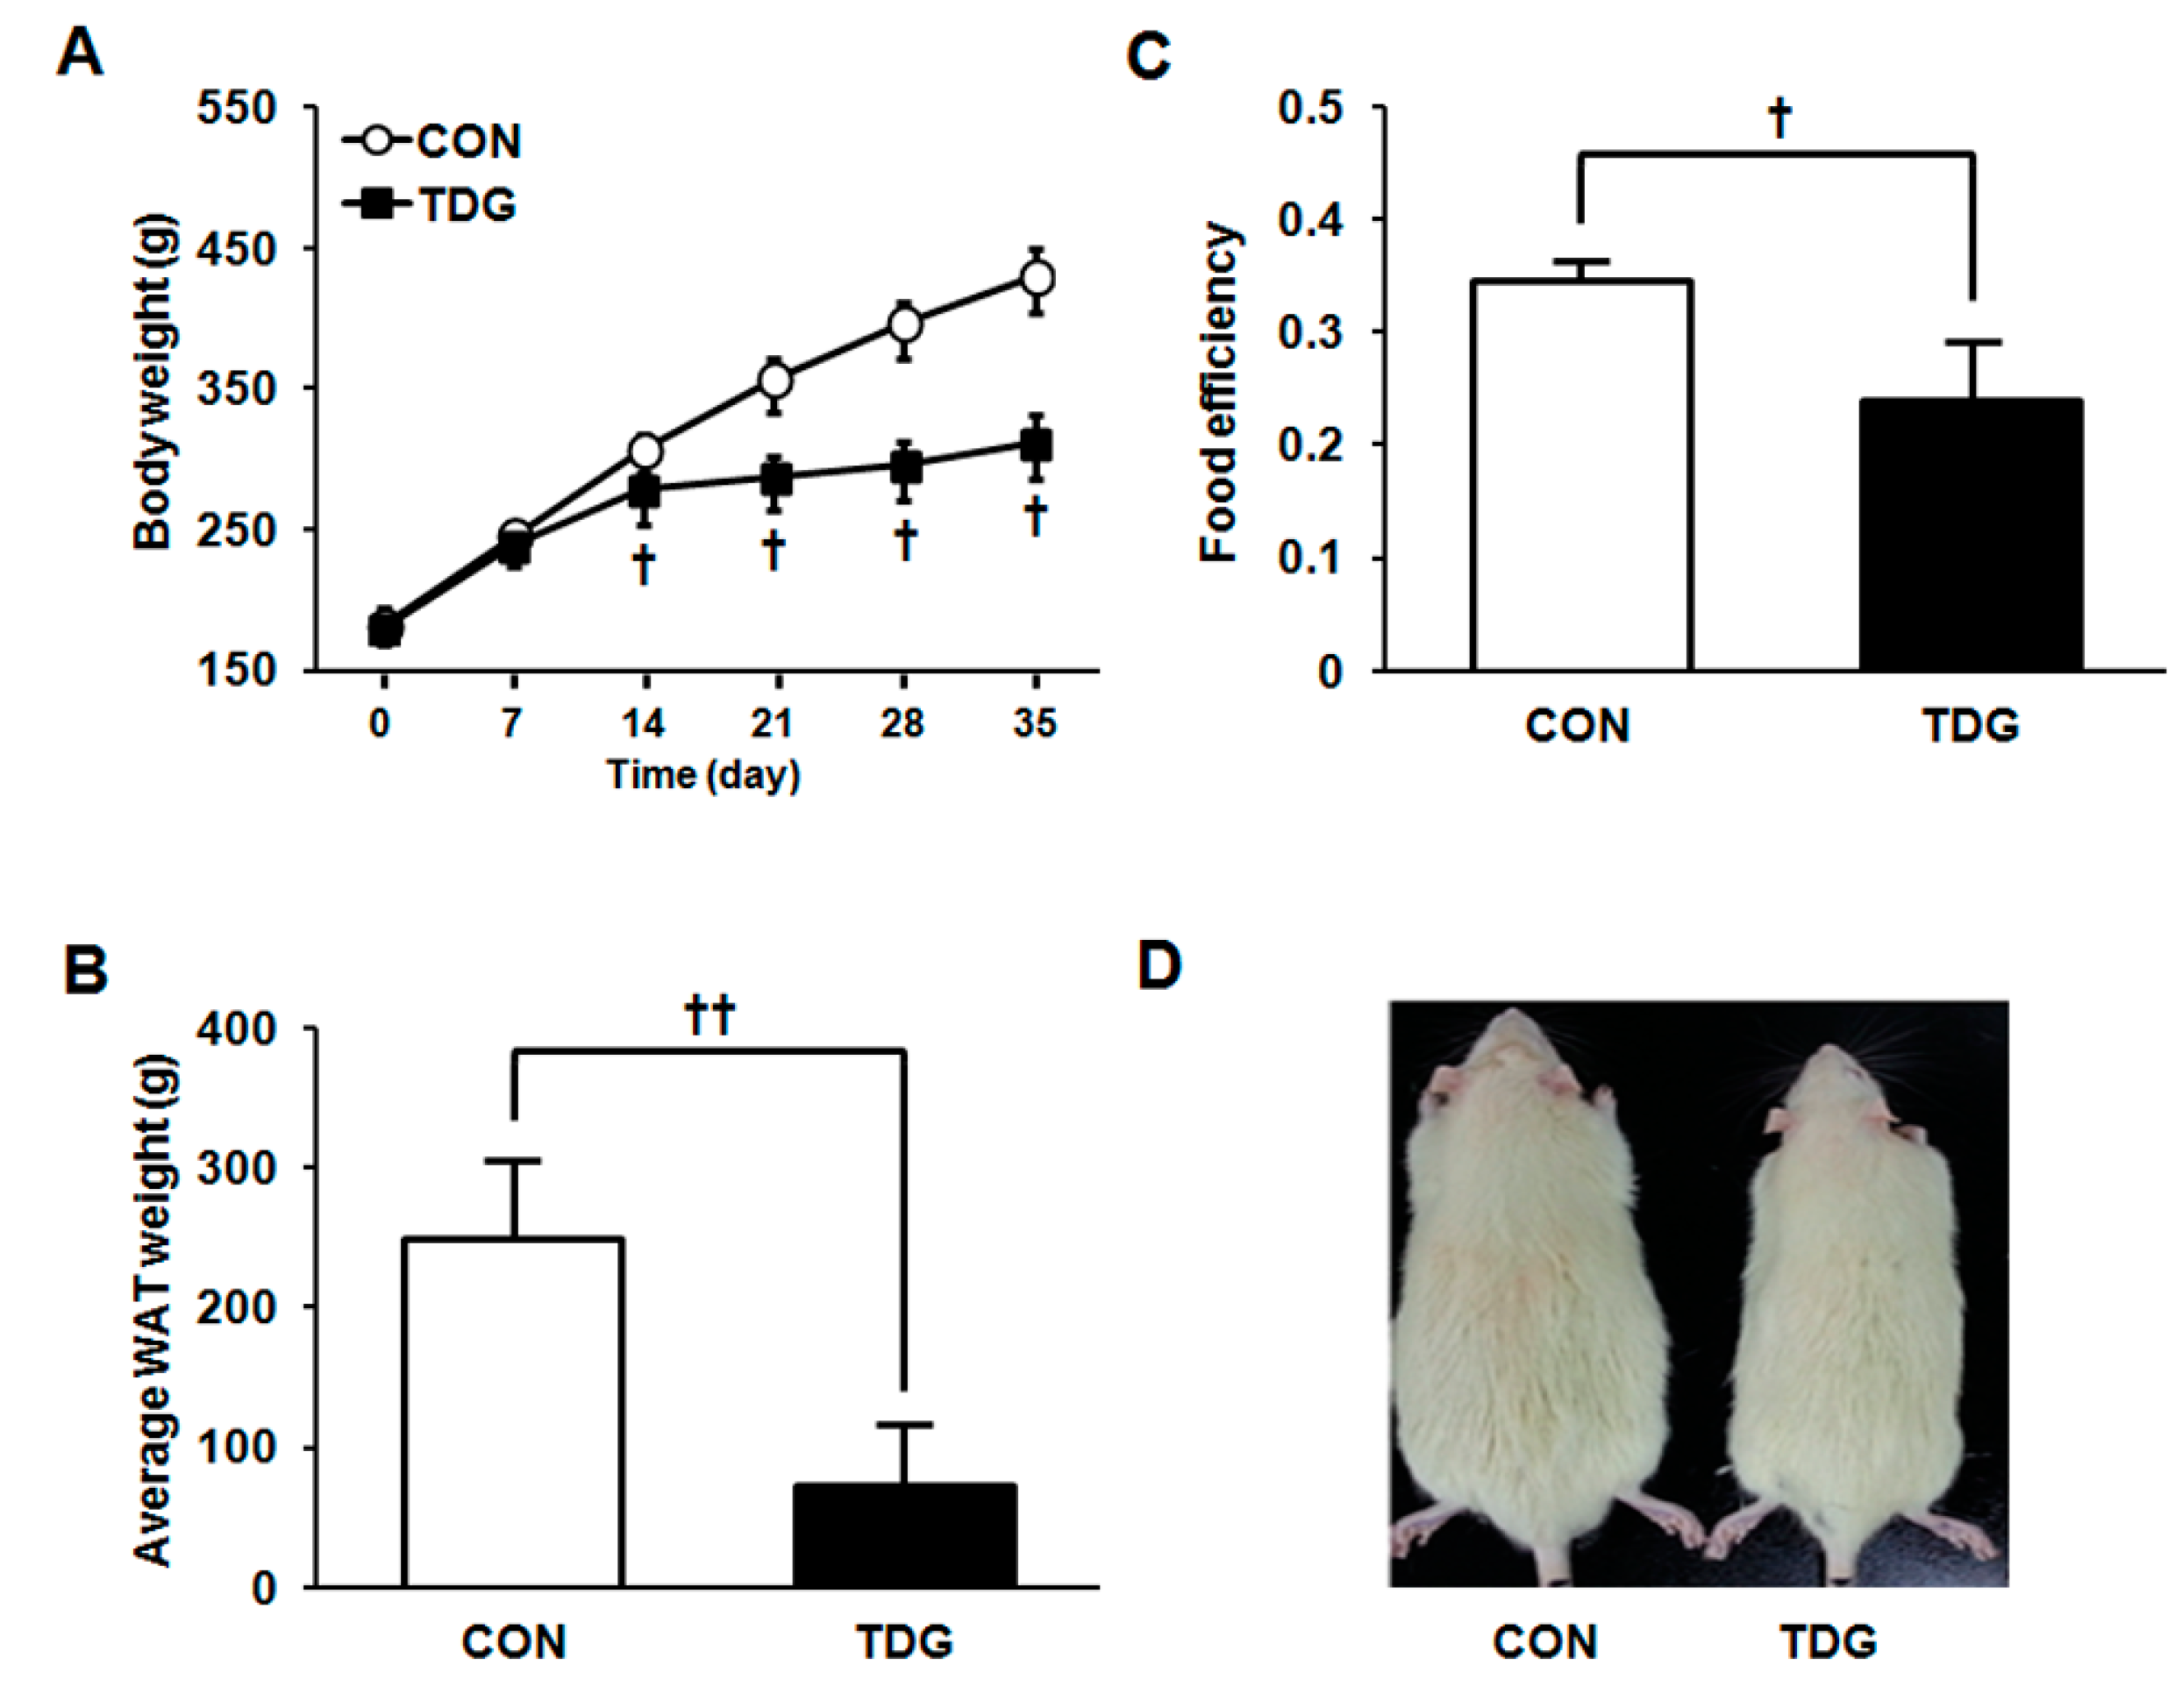
2.1. Thiodigalactoside (TDG) Significantly Reduces Body Weight Gain in High Fat Diet (HFD) Fed Rats

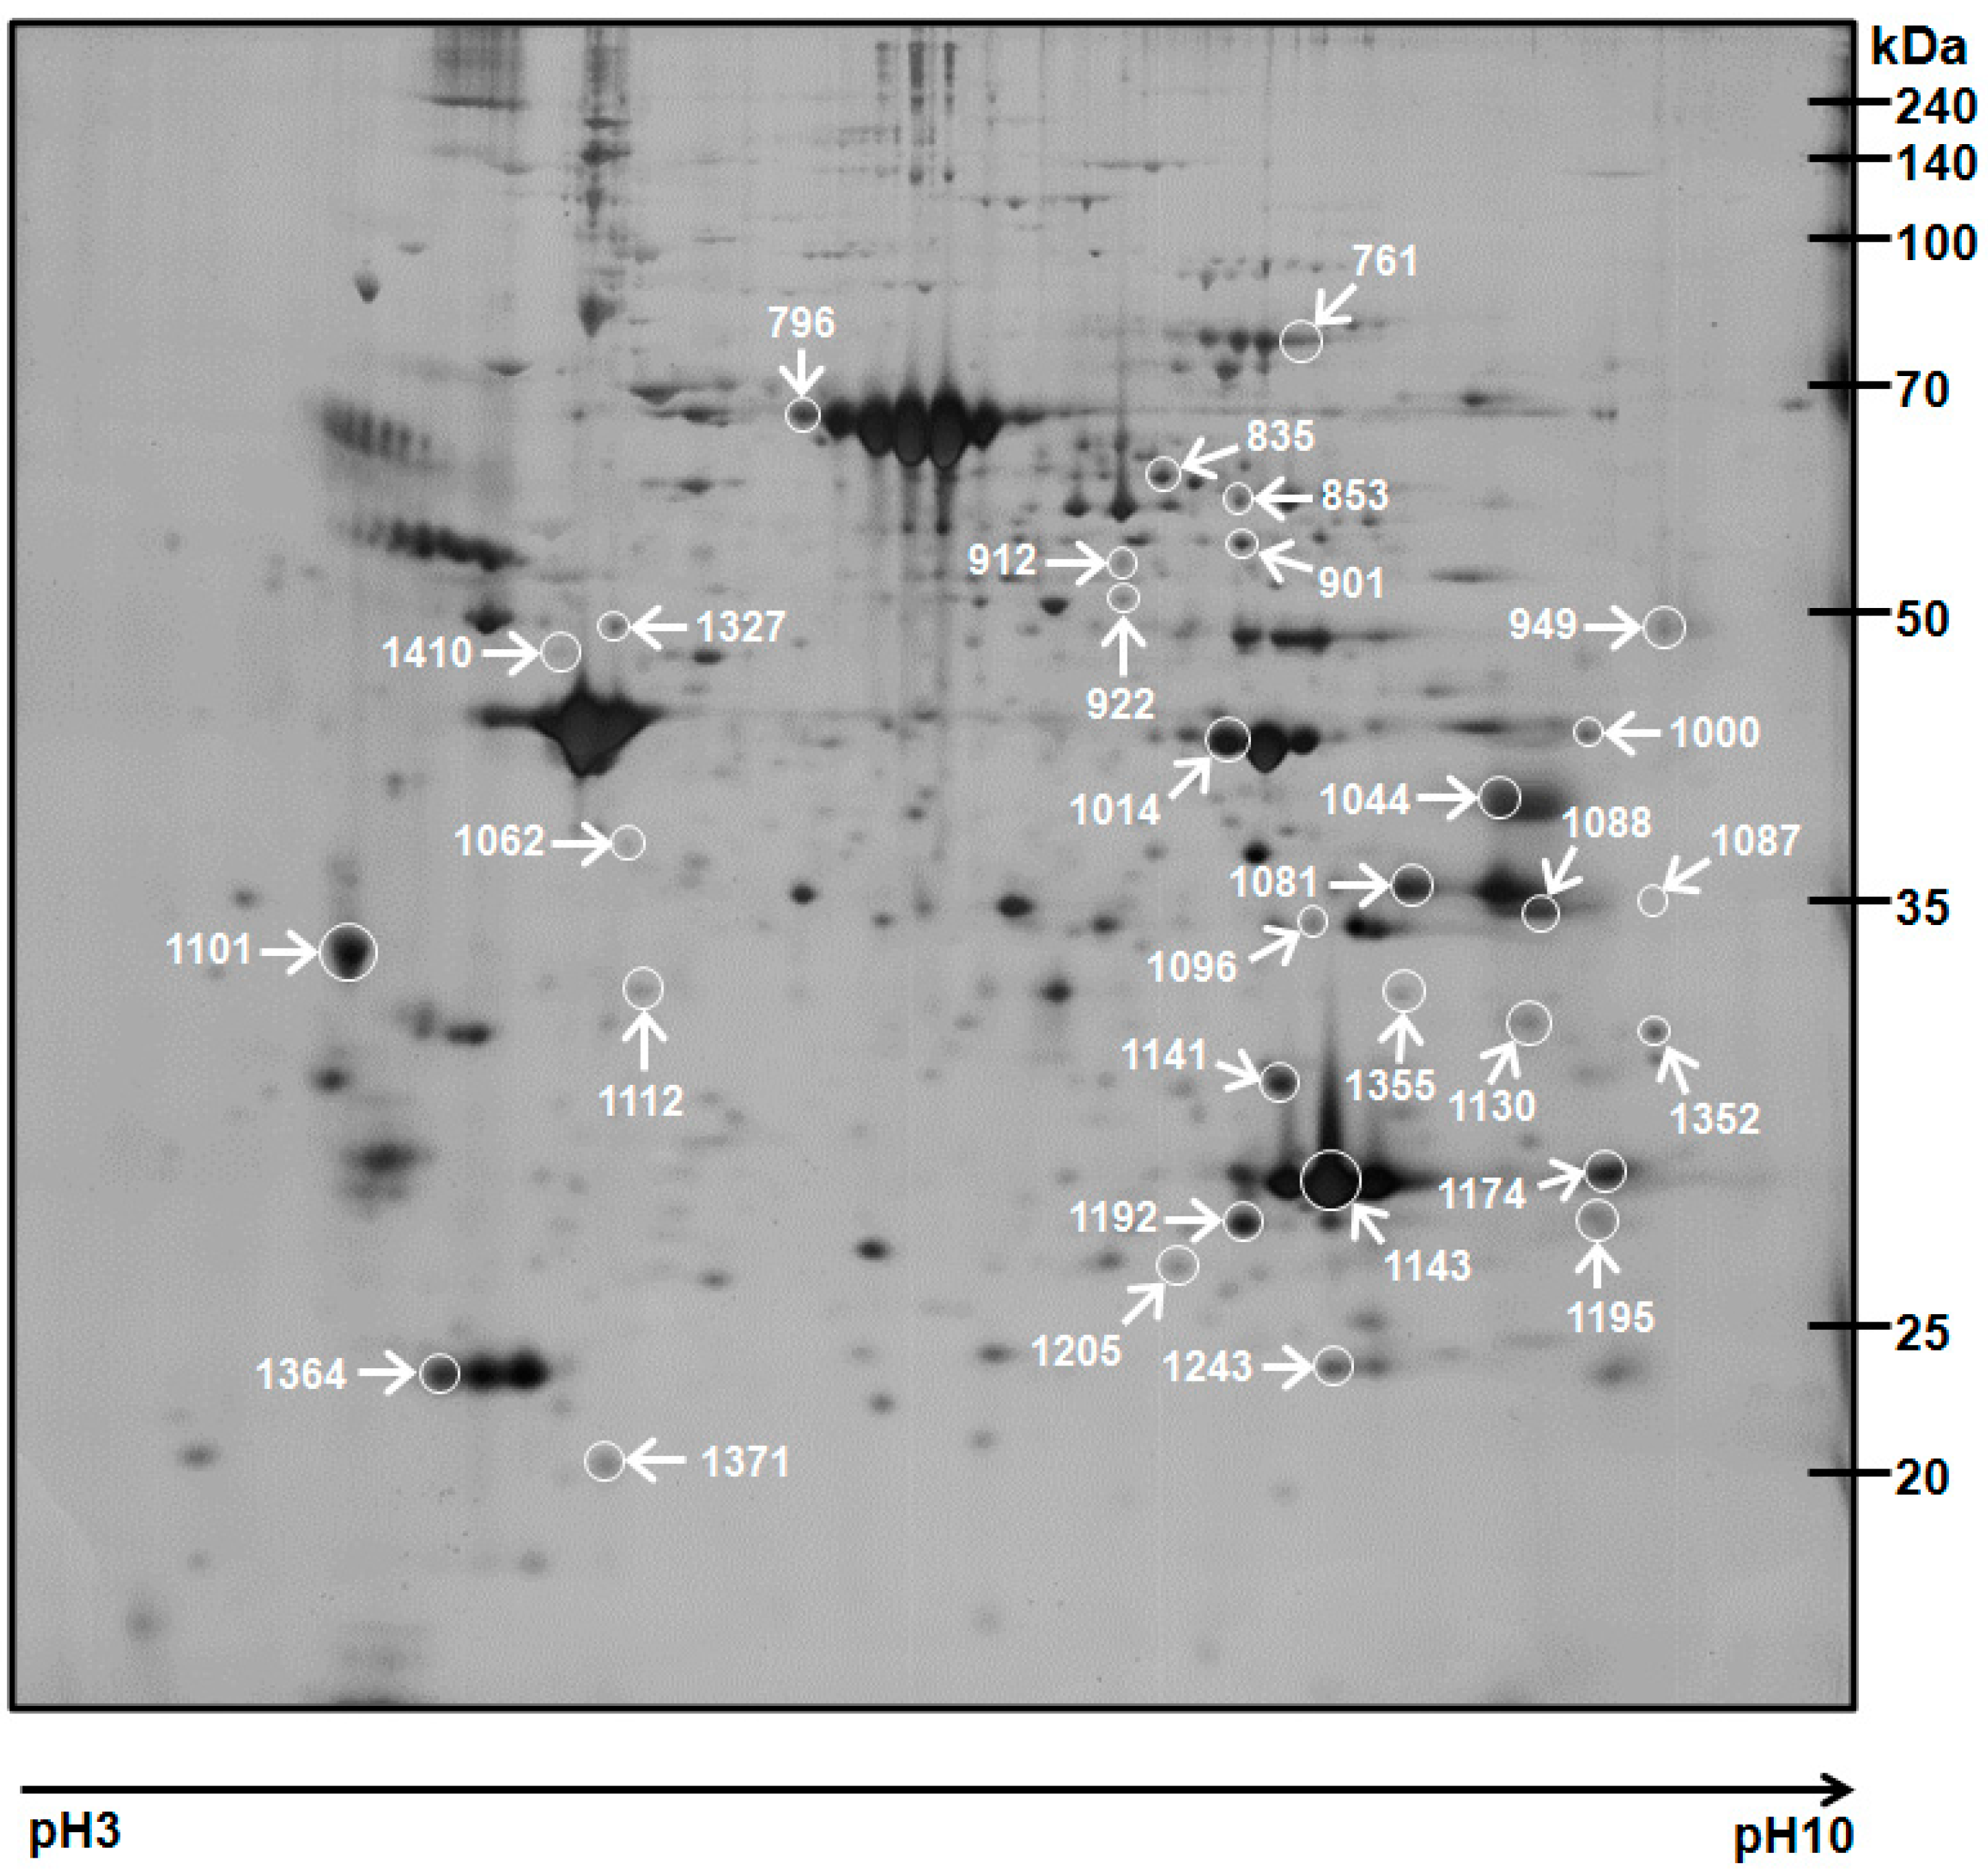
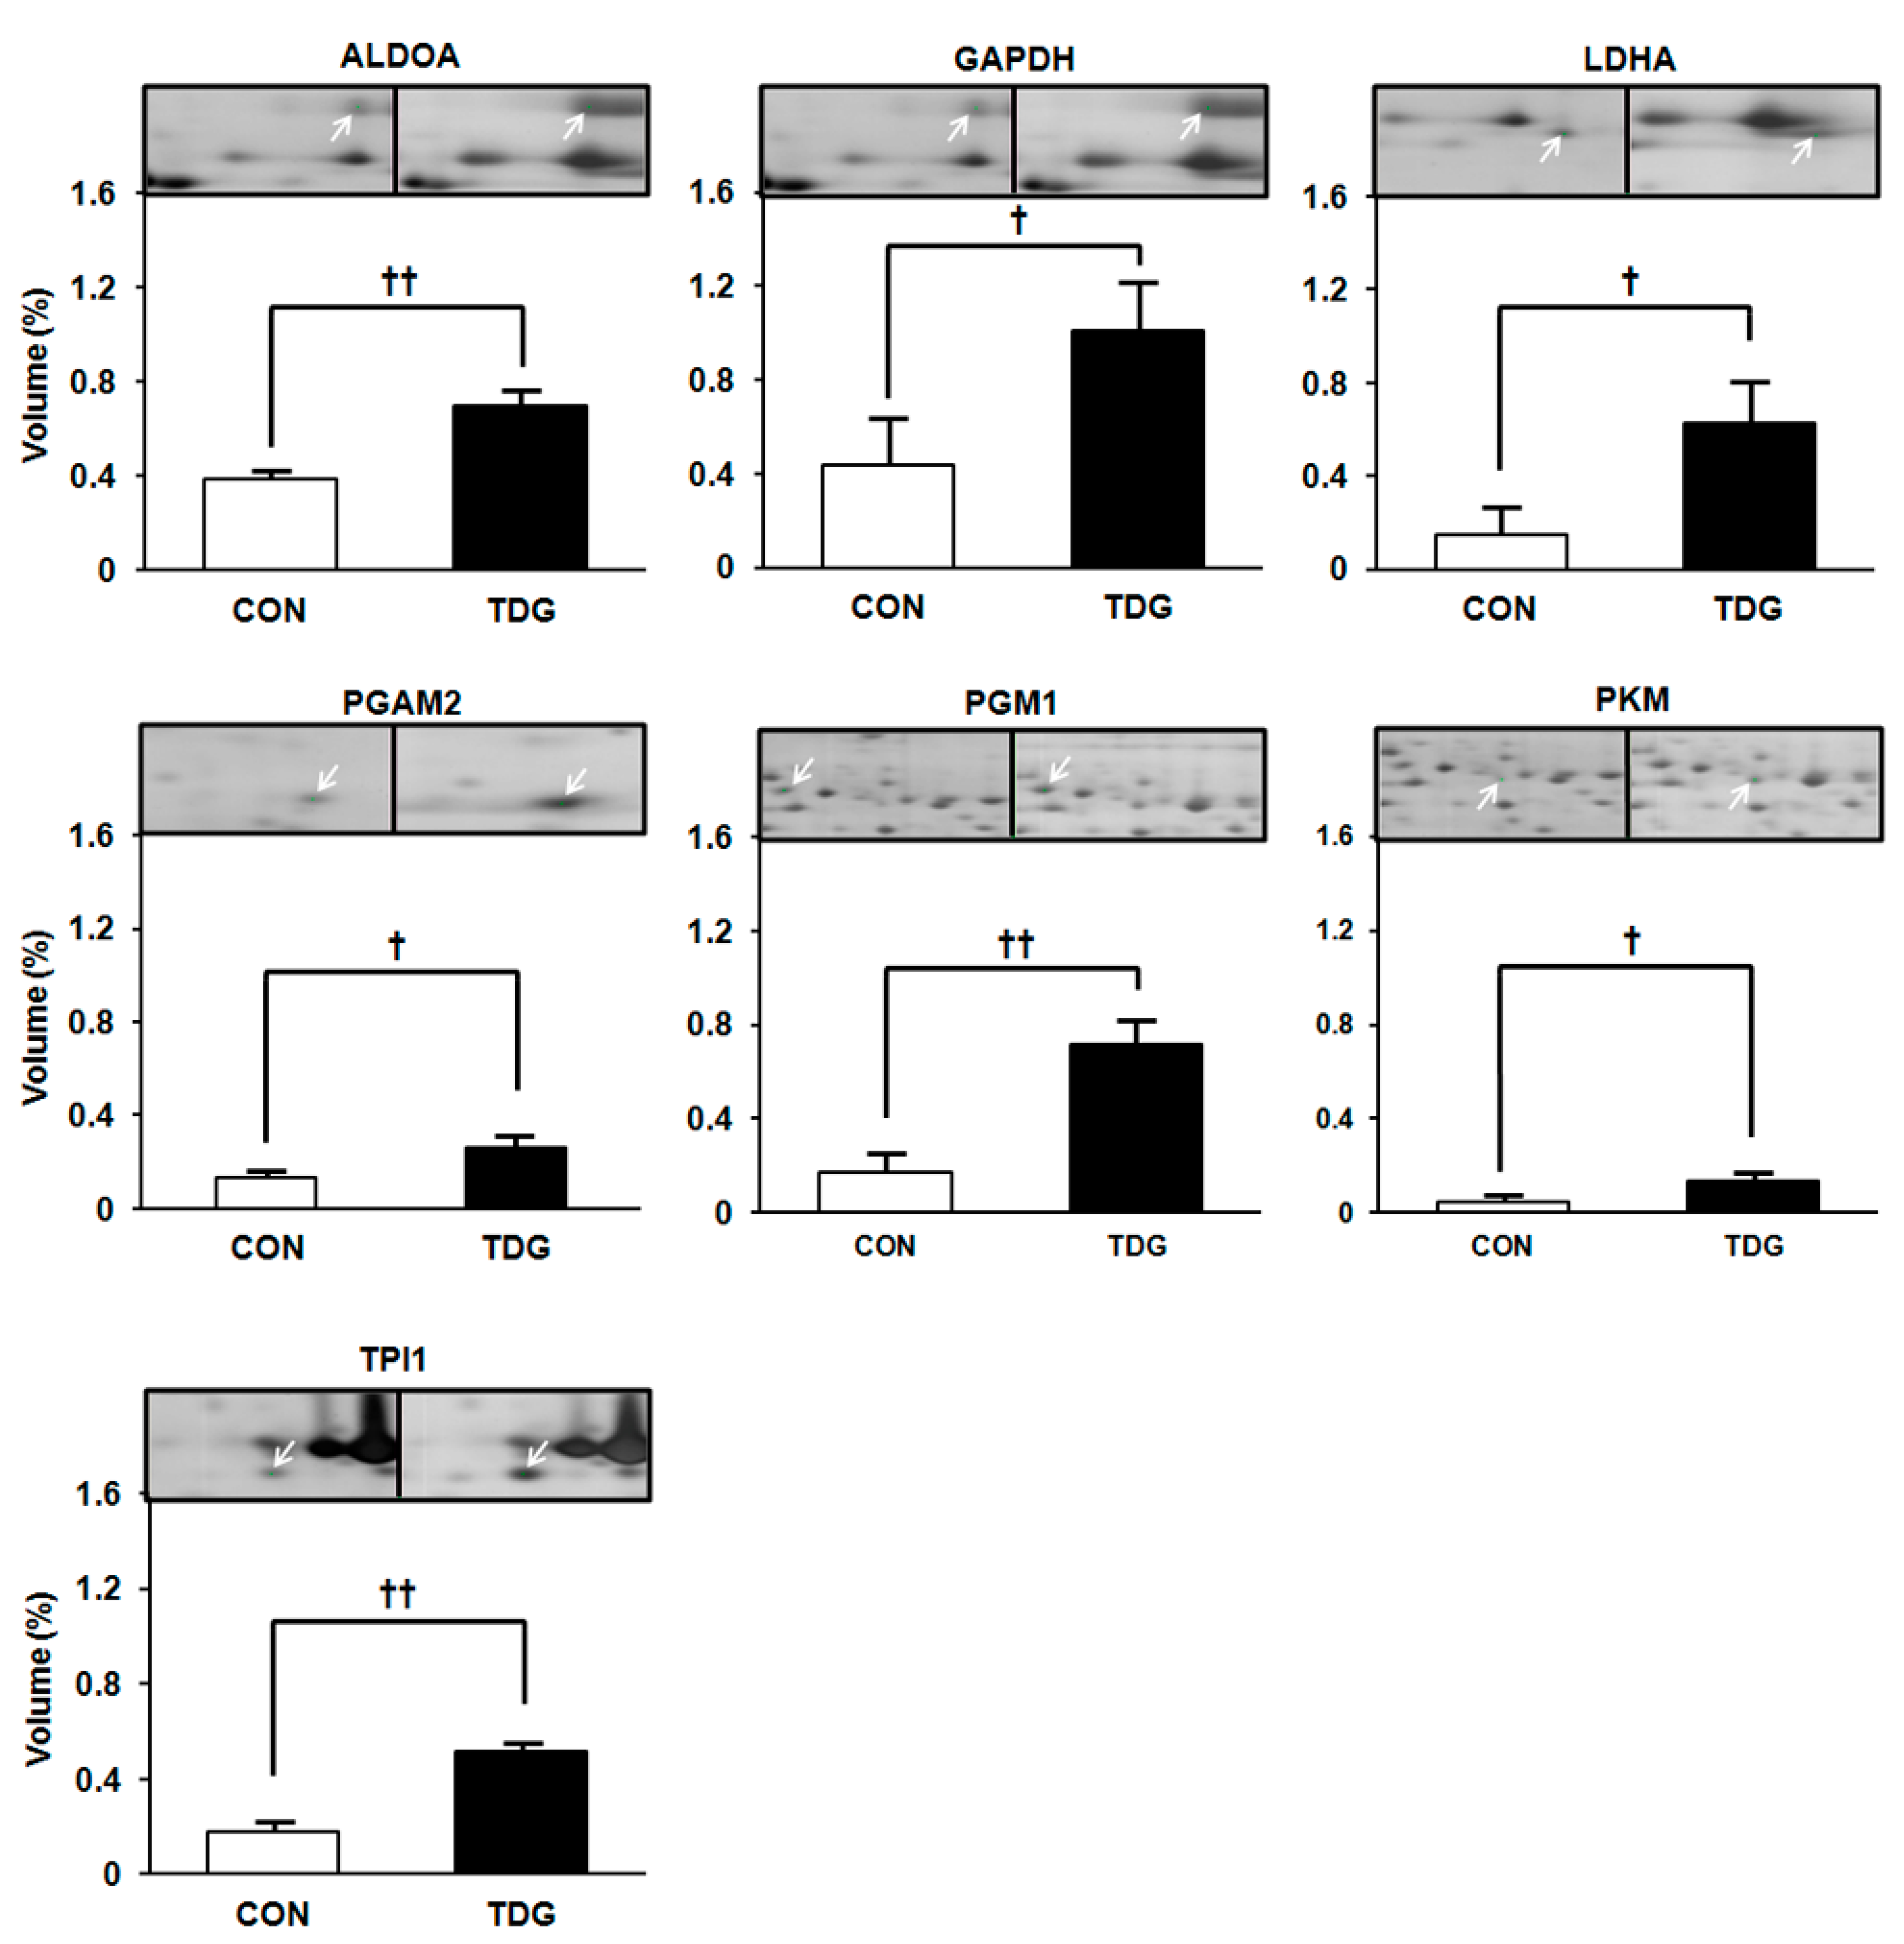
2.2. Proteomic Analysis of White Adipose Tissue (WAT)

| Spot ID | Description | Accession No. a | Nominal Mass (Mr) b | Calculated pI | Fold Change | Score c | Number of Peptides Matched | Sequence Coverage (%) |
|---|---|---|---|---|---|---|---|---|
| Carbohydrate metabolism | ||||||||
| 835 | Phosphoglucomutase-1 (PGM1) | gi|77627971 | 61,637 | 6.14 | 1.97 | 229 | 24 | 48 |
| 853 | Pyruvate kinase (PKM) | gi|16757994 | 58,294 | 6.63 | 2.77 | 159 | 20 | 43 |
| 1081 | Glyceraldehyde-3-phosphate dehydrogenase (GAPDH) | gi|8393418 | 36,090 | 8.14 | 2.31 | 191 | 23 | 59 |
| 1044 | Aldolase A (ALDOA) | gi|202837 | 39,691 | 8.31 | 1.80 | 222 | 17 | 64 |
| 1088 | l-lactate dehydrogenase A chain (LDHA) | gi|8393706 | 36,712 | 8.45 | 4.22 | 167 | 15 | 50 |
| 1192 | Triosephosphate isomerase (TPI1) | gi|117935064 | 27,345 | 6.89 | 2.89 | 237 | 17 | 72 |
| 1174 | Phosphoglycerate mutase 2 (PGAM2) | gi|8393948 | 28,908 | 8.85 | 4.07 | 104 | 12 | 44 |
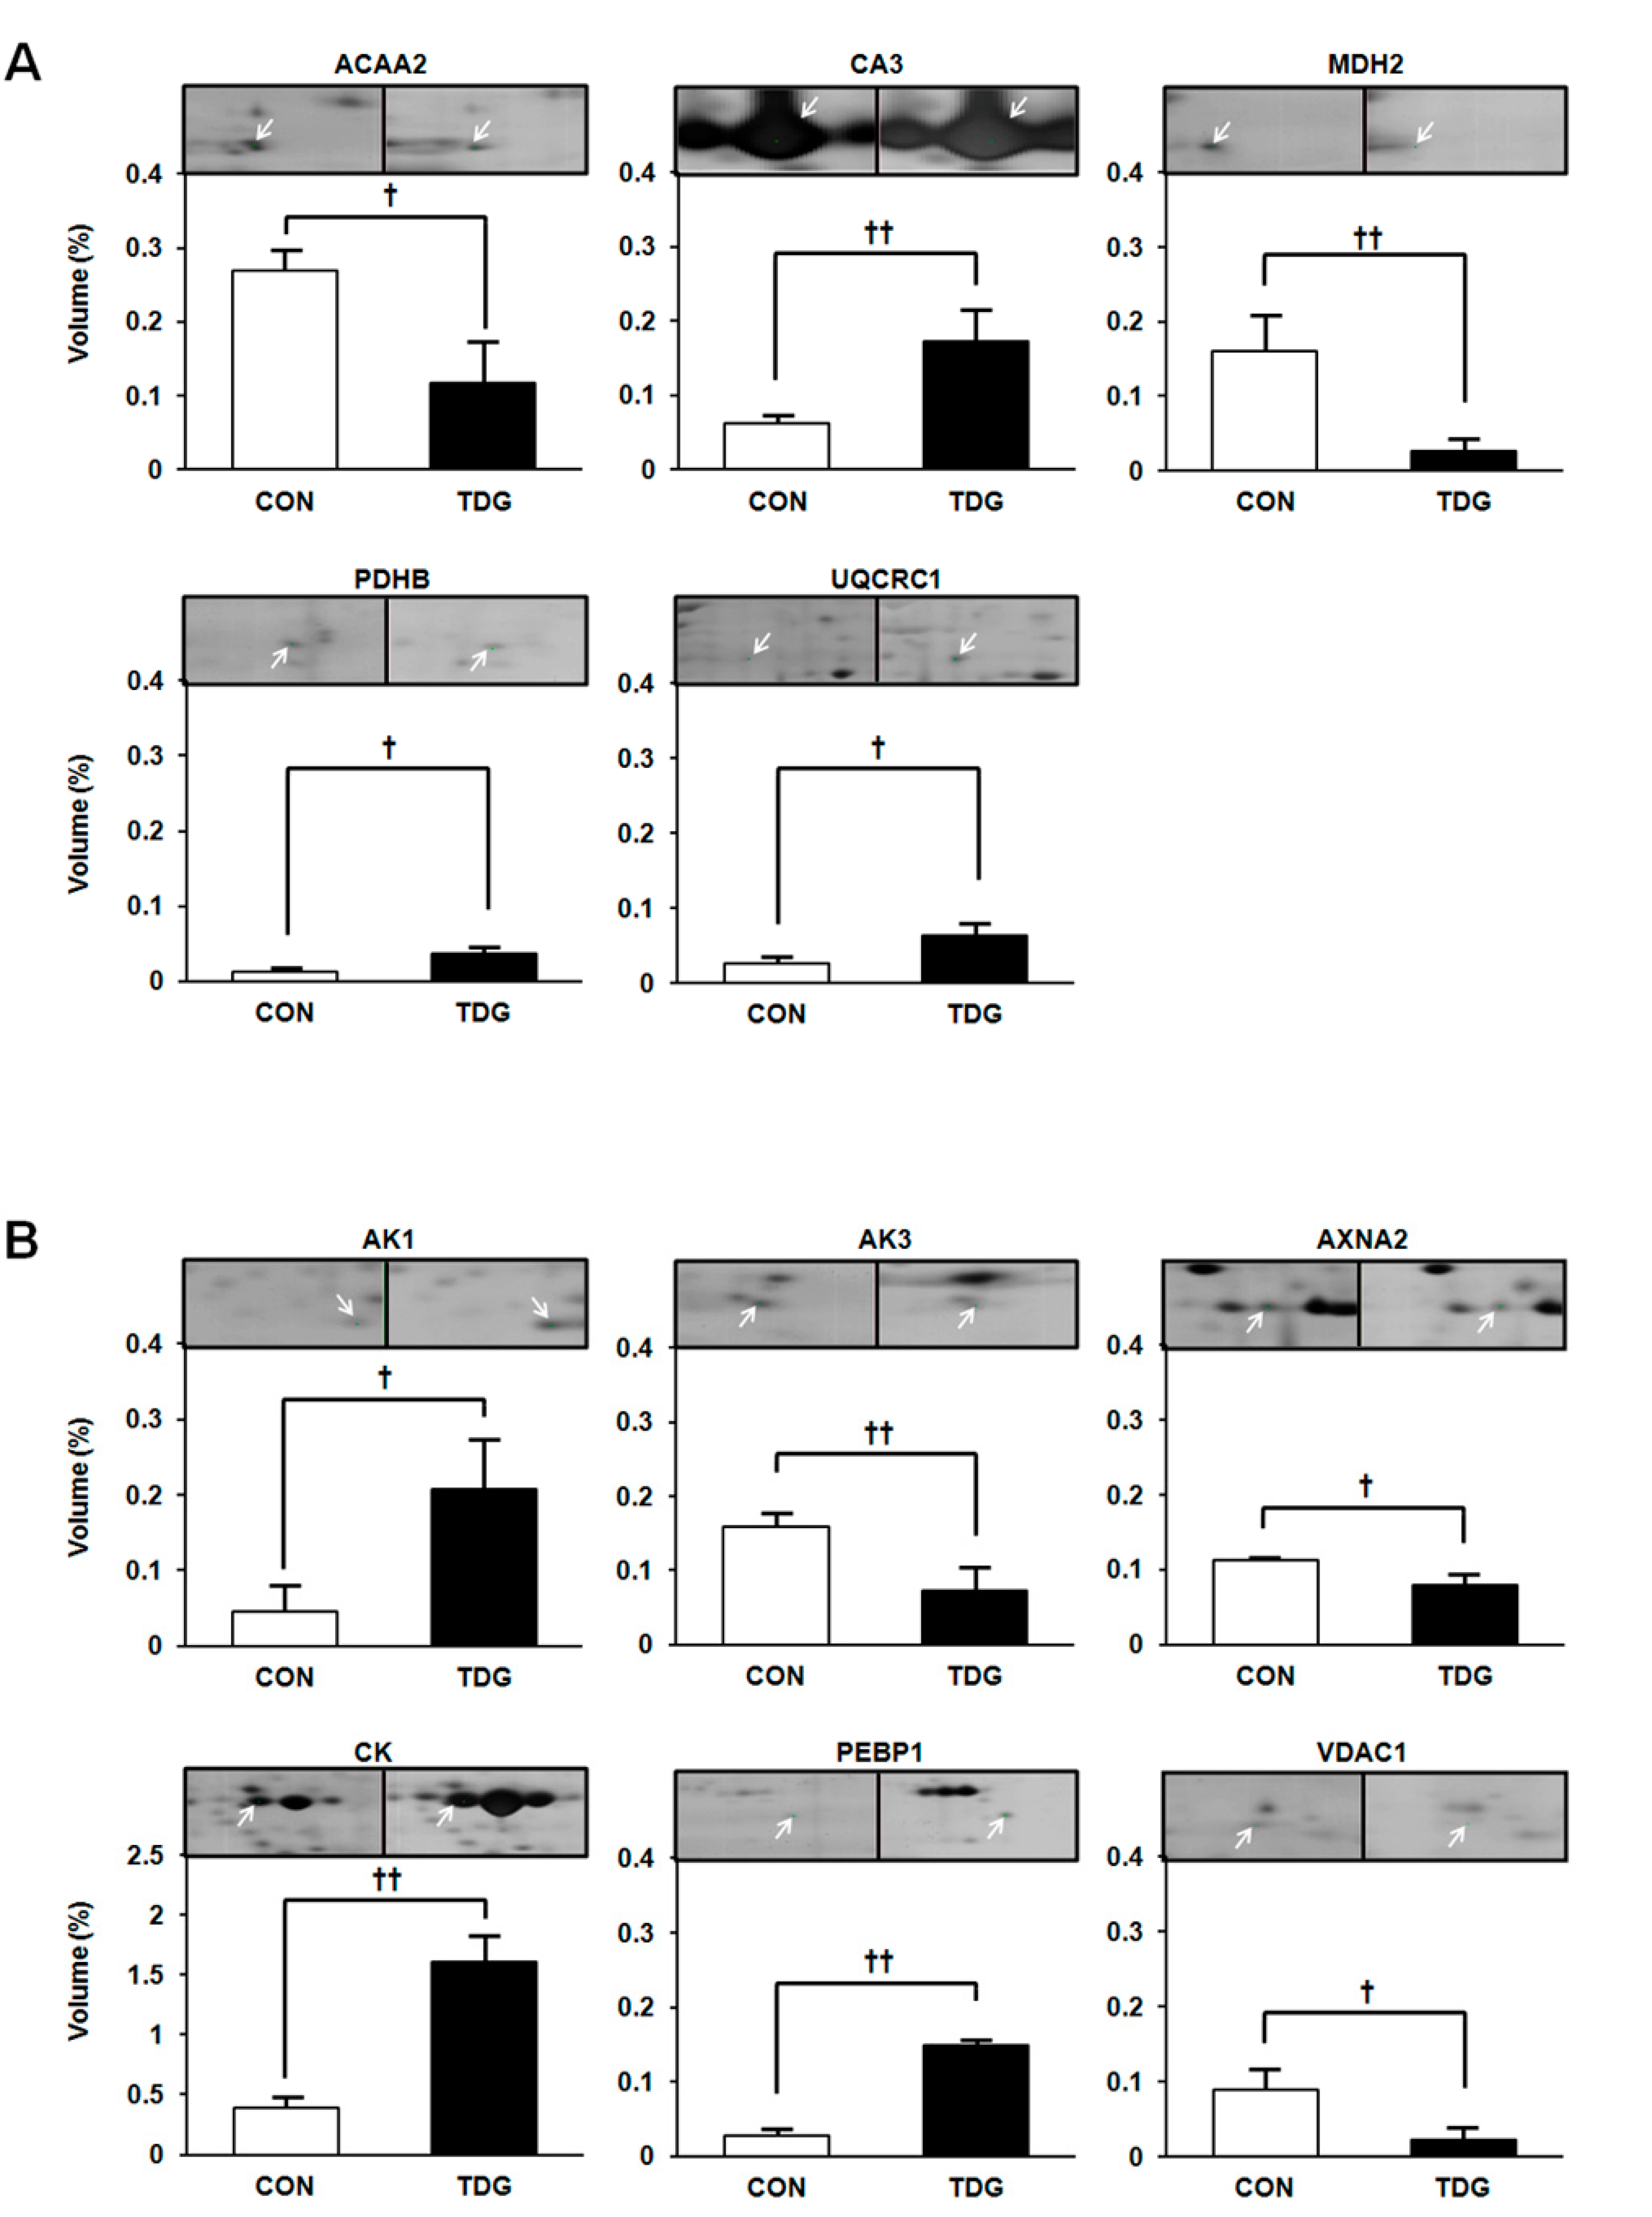
| TCA cycle | ||||||||
| 1087 | Malate dehydrogenase, mitochondrial precursor (MDH2) | gi|42476181 | 36,117 | 8.93 | 6.06 | 238 | 20 | 57 |
| 1112 | Pyruvate dehydrogenase E1 component subunit beta (PDHB) | gi|56090293 | 39,299 | 6.20 | 2.81 | 92 | 13 | 31 |
| 1327 | Cytochrome b-c1 complex subunit 1 (UQCRC1) | gi|51948476 | 53,500 | 5.57 | 2.36 | 151 | 12 | 47 |
| 1000 | Acetyl-Coenzyme A acyltransferase 2 (ACAA2) | gi|149027152 | 25,270 | 8.22 | 2.29 | 164 | 15 | 37 |
| 1143 | Carbonic anhydrase 3 (CA3) | gi|31377484 | 29,698 | 6.89 | 2.79 | 234 | 17 | 61 |
| Signal Transduction | ||||||||
| 1195 | GTP:AMP phosphotransferase AK3, mitochondrial (AK3) | gi|6978479 | 25,479 | 8.89 | 2.18 | 78 | 9 | 36 |
| 1243 | Adenylate kinase isoenzyme 1 (AK1) | gi|61889092 | 21,684 | 7.66 | 4.63 | 177 | 18 | 39 |
| 1371 | Phosphatidylethanolamine-binding protein 1 (PEBP 1) | gi|8393910 | 20,902 | 5.48 | 4.08 | 65 | 4 | 40 |
| 1014 | Creatine kinase M-type (CK) | gi|6978661 | 43,220 | 6.58 | 5.55 | 257 | 20 | 58 |
| Cytoskeletal proteins/Mitochondrial | ||||||||
| 1096 | Annexin A2 (ANXA2) | gi|9845234 | 38,939 | 7.55 | 2.14 | 64 | 5 | 15 |
| 1130 | Vdac1 protein, partial (VDAC1) | gi|38051979 | 32,060 | 8.35 | 3.83 | 309 | 21 | 72 |
| 1101 | Tropomyosin alpha-1 chain (TPM1) | TPM1_RAT | 32,718 | 4.69 | 6.70 | 95 | 9 | 42 |
| 912 | Myosin-6 (MYH6) | MYH6_RAT | 224,168 | 5.59 | 3.12 | 61 | 8 | 30 |
| 922 | Inner membrane protein, mitochondrial, isoform CRA_a (IMMT) | gi|149036390 | 86,204 | 5.67 | 1.80 | 64 | 13 | 28 |
| 1355 | Myozenin-1 (MYOZ 1) | gi|157819165 | 31,379 | 8.57 | 6.29 | 134 | 15 | 48 |
| 1352 | LIM domain-binding protein 3 isoform 4 (LDB3) | gi|160333156 | 30,969 | 9.17 | 9.32 | 106 | 11 | 46 |
| 1364 | Myosin light chain (MLC1-F) | gi|205485 | 20,793 | 4.99 | 7.77 | 94 | 8 | 49 |
| 796 | Others Serum albumin precursor (ALB) | gi|158138568 | 70,710 | 6.09 | 1.72 | 239 | 22 | 39 |
| 1141 | Carbonyl reductase 1 (CBR1) | gi|9506467 | 30,844 | 8.22 | 2.97 | 199 | 19 | 43 |
| 1205 | Flavin reductase (BLVRB) | gi|157819619 | 22,194 | 6.29 | 4.57 | 63 | 4 | 21 |
| 761 | Serotransferrin precursor (TF) | gi|61556986 | 78,512 | 7.14 | 3.92 | 194 | 19 | 27 |
| 1062 | Alpha-1-macroglobulin precursor (PZP) | gi|307746876 | 168,388 | 6.46 | 2.81 | 65 | 11 | 36 |
| 949 | Elongation factor 1-alpha 1 (EEF1A1) | gi|28460696 | 50,424 | 9.10 | 1.57 | 79 | 10 | 27 |
| 1410 | rCG36867 | gi|149050147 | 8002 | 8.65 | 2.83 | 73 | 4 | 20 |
| 901 | Cysteine-sulfinate decarboxylase (CSAD) | gi|193072901 | 55,807 | 6.84 | 2.18 | 105 | 13 | 30 |

2.3. Differential Regulation of WAT Proteins


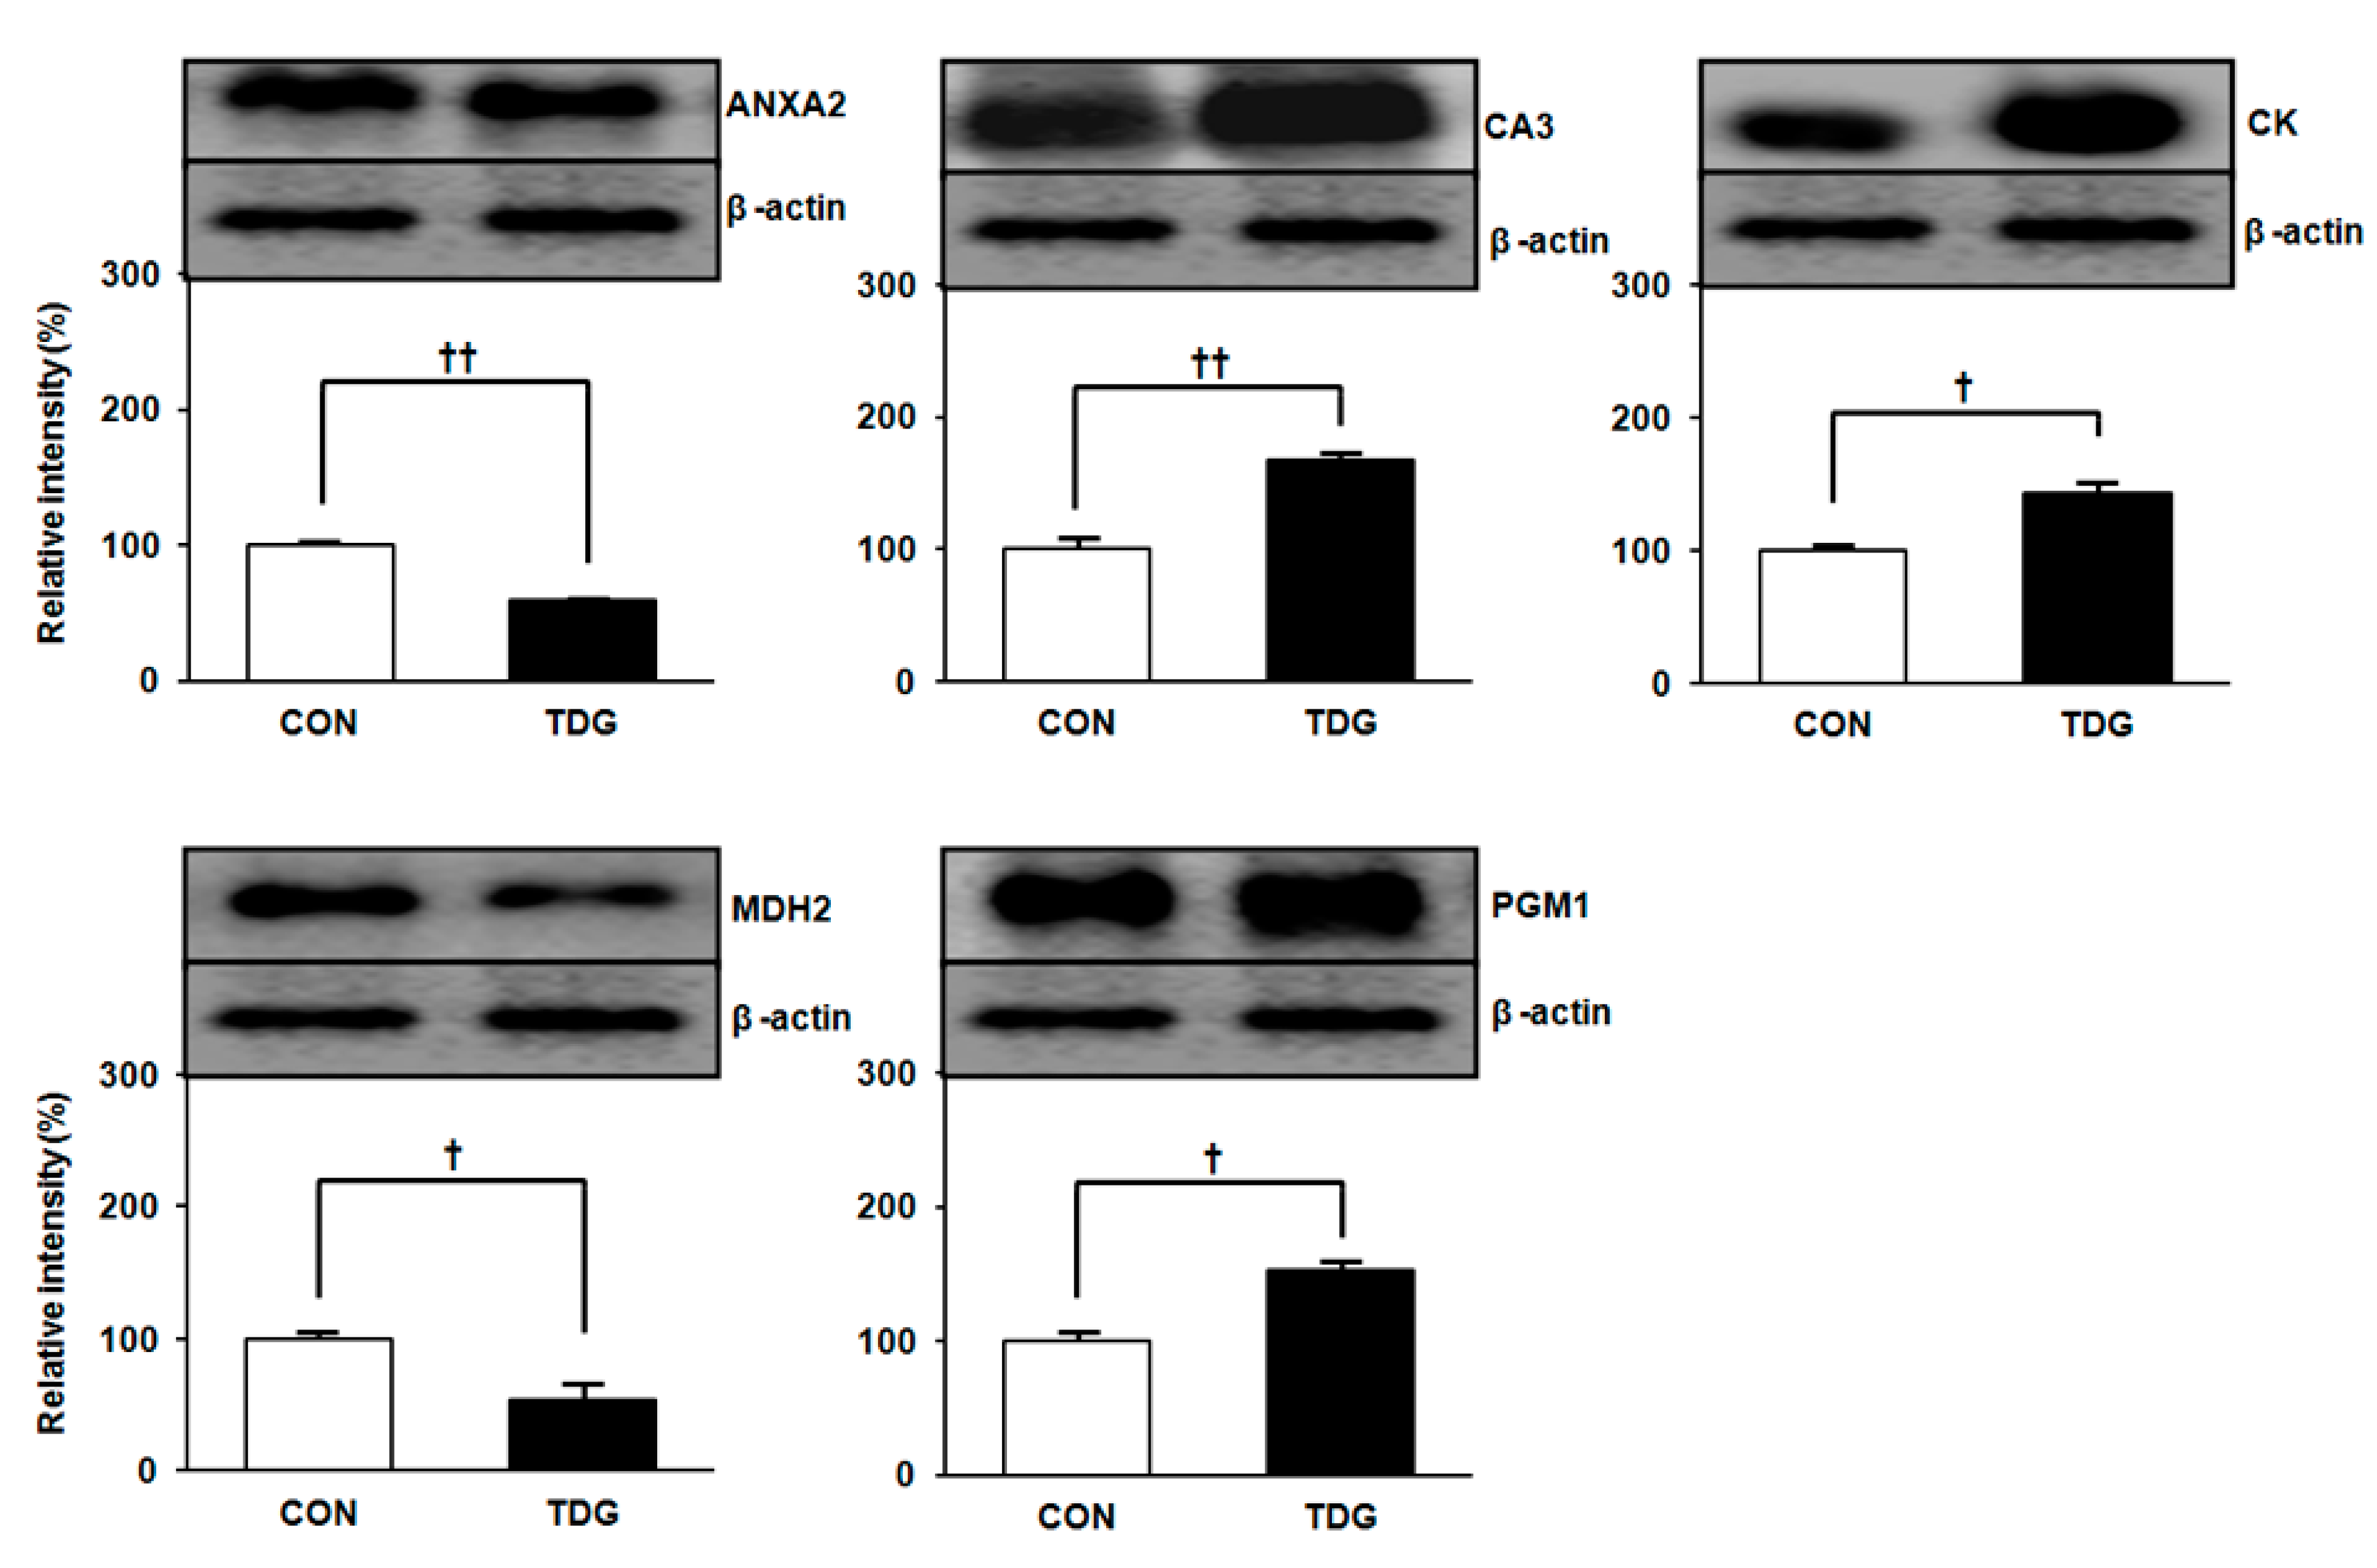
2.4. Validation of Proteomic Data by Immunoblot Analysis

2.5. Differential Expression of Thermogenic Marker Proteins between Control (CON) and TDG-Treated (TDG) Groups

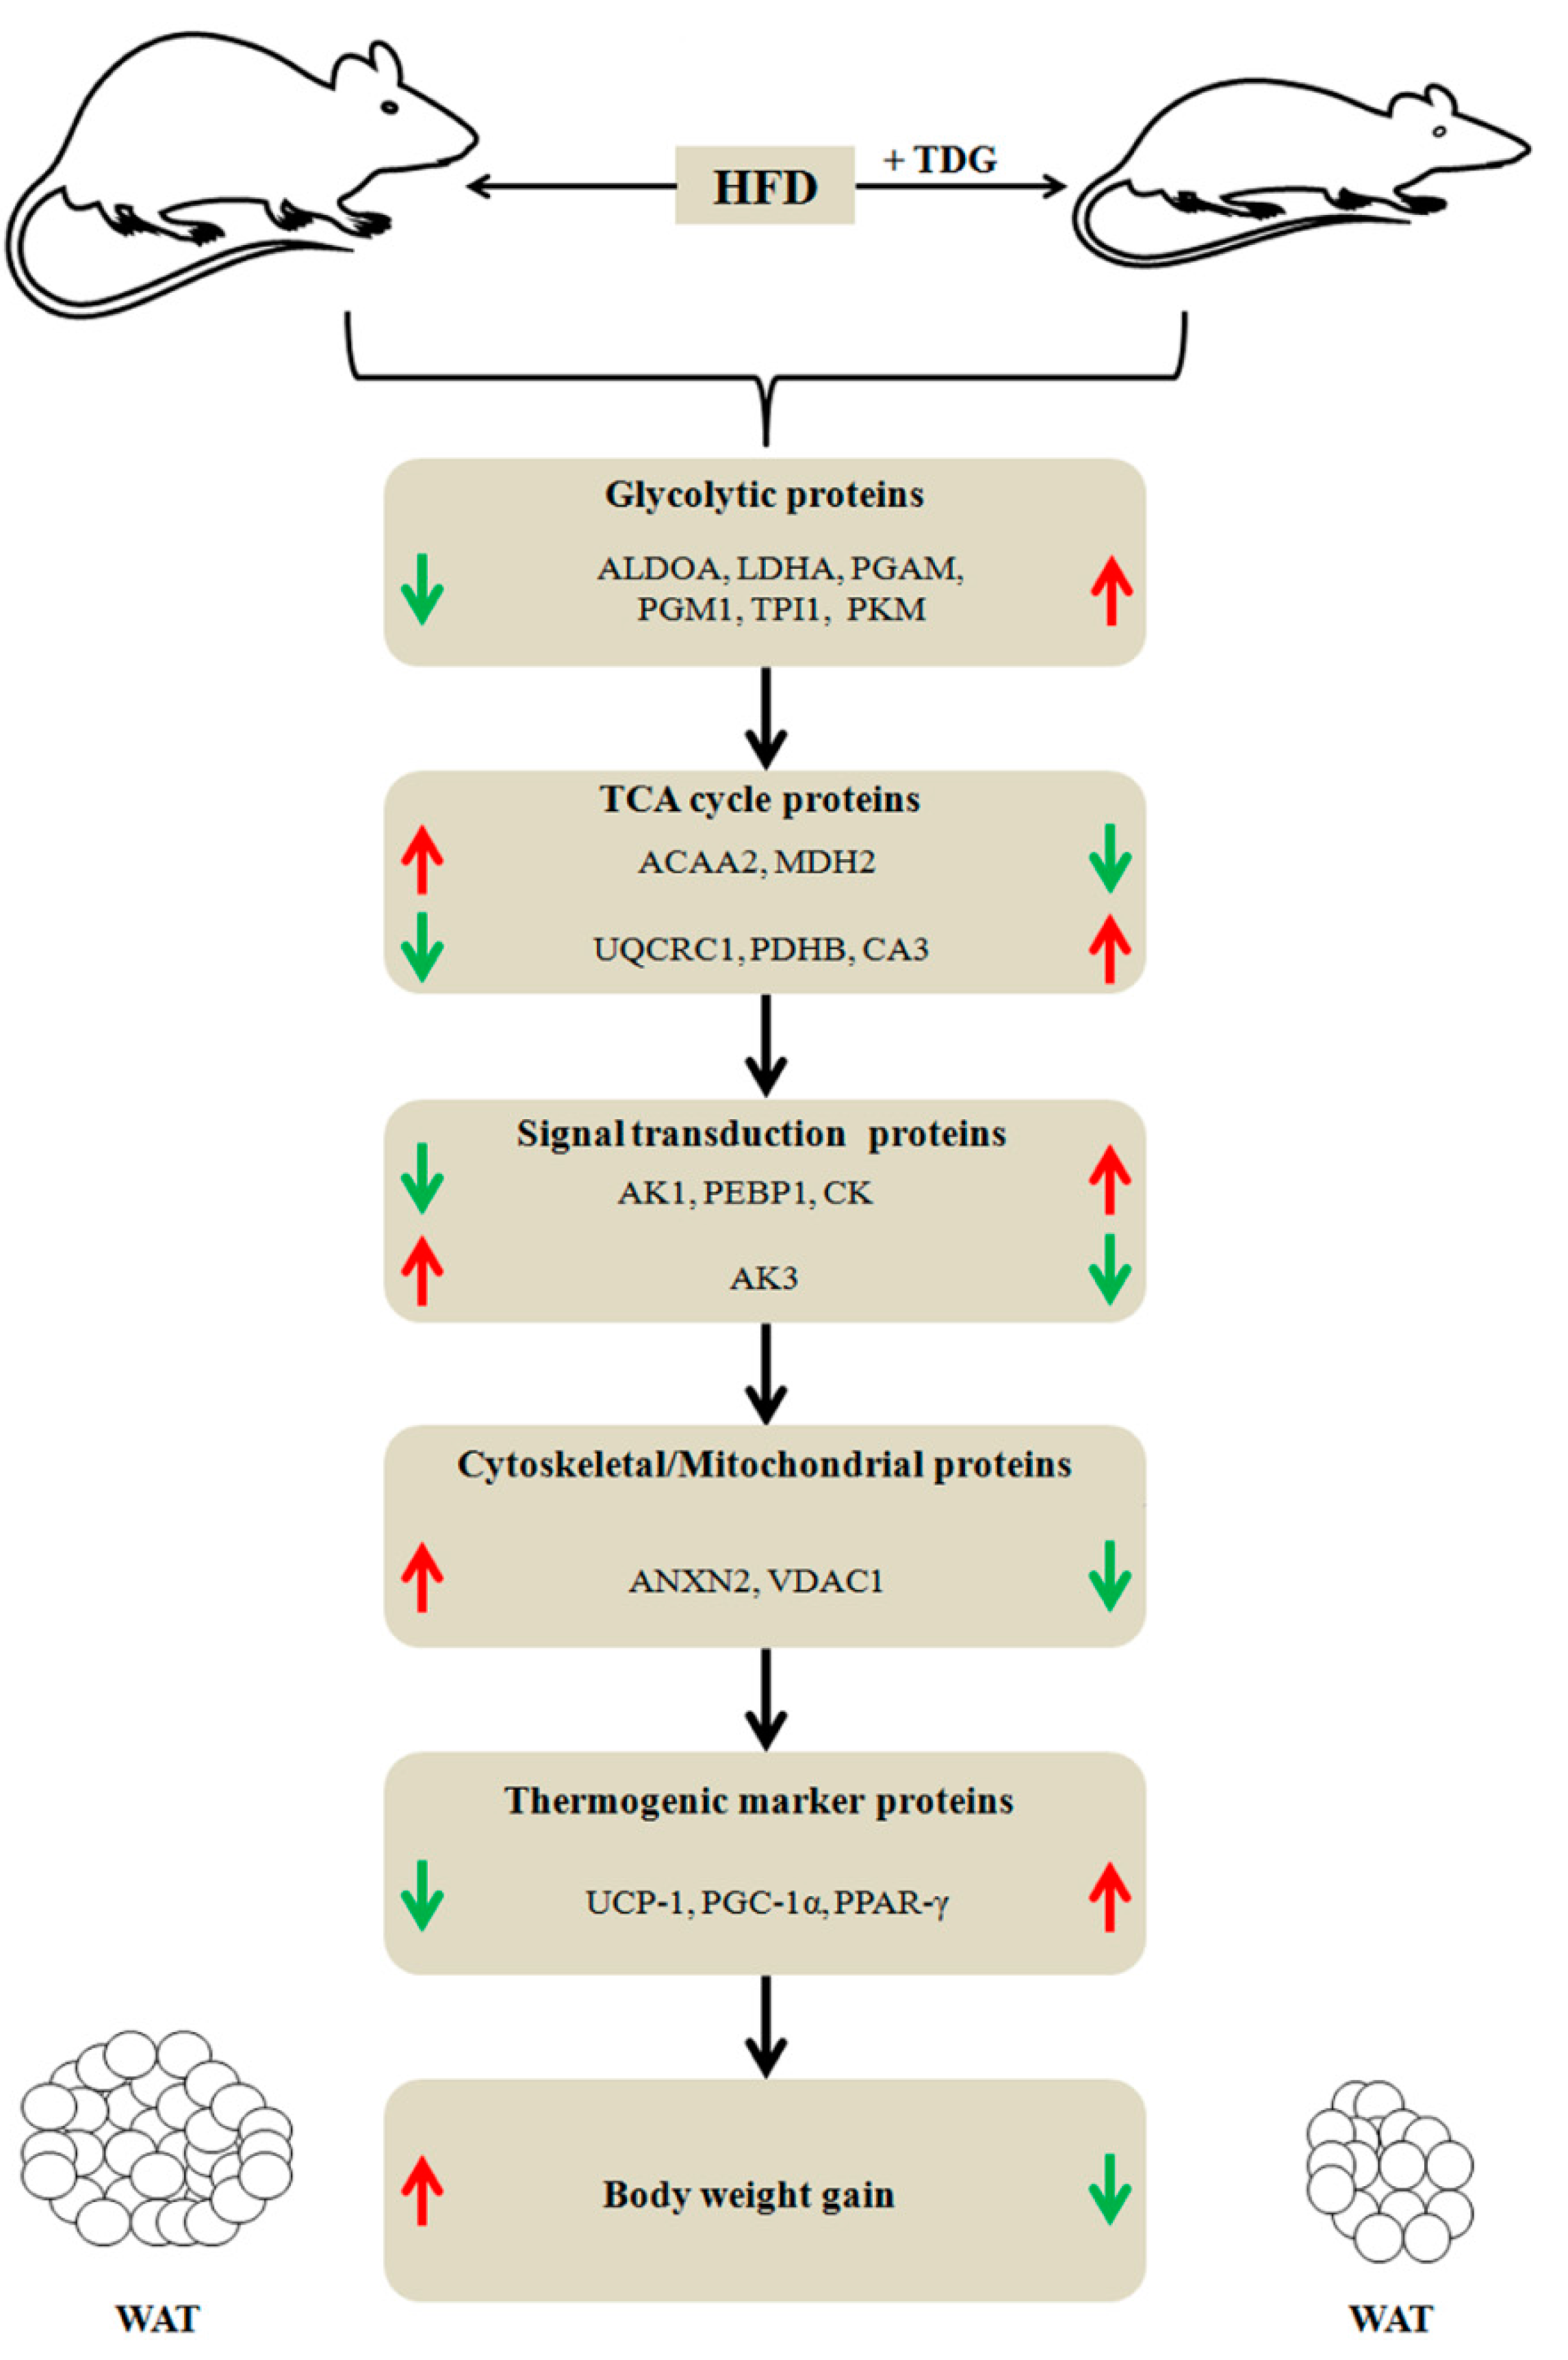
2.6. Network Analysis

3. Discussion

4. Experimental Section
4.1. Animal Experiments
4.2. Preparation of WAT Samples for 2-DE
| Ingredient | ND Composition by Weight, g/kg | HFD |
|---|---|---|
| Casein | 200 | 265 |
| Sucrose | 100 | 90 |
| Corn starch | 397.4 | 0 |
| Maltodextrin | 132 | 160 |
| Cellulose | 50 | 65.5 |
| Soybean oil | 70 | 30 |
| Lard | 0 | 310 |
| Mineral mix | 35 | 48 |
| Calcium phosphate, dibasic | 0 | 3.4 |
| Vitamin mix | 10 | 21 |
| l-cystine | 3 | 4 |
| Choline bitartrate | 2.5 | 3 |
| Total (kcal/kg) | 3800 | 5100 |
4.3. 2-DE
4.4. Image Acquisition and Data Analysis
4.5. Protein Identification
4.6. Immunoblot Analysis
4.7. Network Analysis
4.8. Statistical Analysis
Acknowledgments
Author Contributions
Conflicts of Interest
Abbreviations
| 2-DE | two-dimensional gel electrophoresis |
| AK1 | adenylate kinase isoenzyme 1 |
| AK3 | adenylate kinase isoenzyme 3 |
| GAPDH | glyceryldehyde-3-phosphate dehydrogenase |
| PGM1 | phosphoglucomutase-1 |
| PGAM2 | phosphoglycerate mutase 2 |
| ALDOA | aldolase A |
| TPI1 | triosephosphate isomerase |
| ANXA2 | annexin A2 |
| UCP-1 | uncoupling protein 1 |
| PPARγ | peroxisome proliferator-activated receptor protein γ |
| PGC-1α | peroxisome proliferator-activated receptor gamma coactivator 1-alpha |
| LDHA | l-lactate dehydrogenase A chain |
| UQCRC1 | Cytochrome b-c1 complex subunit 1 |
| RKIP | Raf kinase inhibitory protein |
| CA3 | carbonic anhydrase 3 |
| VDAC1 | voltage-dependent anion channel |
| PEBP1 | phosphatidylethanolamine-binding protein 1 |
| LDAC | lactate dehydrogenase A chain |
| TCA | tricarboxylic acid |
| PMF | peptide mass fingerprinting |
| CHCA | α-cyano-4-hydroxycinnamic acid |
| TFA | trifluoroacetic acid |
References
- Lehr, S.; Hartwig, S.; Sell, H. Adipokines a treasure trove for the discovery of biomarkers for metabolic disorders. Proteomics Clin. Appl. 2012, 6, 91–101. [Google Scholar] [CrossRef] [PubMed]
- Friedman, J.M.; Halaas, J.L. Leptin and the regulation of body weight in mammals. Nature 1998, 395, 763–770. [Google Scholar] [CrossRef] [PubMed]
- Chandran, M.; Phillips, S.A.; Ciaraldi, T.; Henry, R.R. Adiponectin, more than just another fat cell hormone. Diabetes Care 2003, 26, 2442–2450. [Google Scholar] [CrossRef] [PubMed]
- Rhodes, D.H.; Pini, M.; Castellanos, K.J.; Montero-Melendez, T.; Cooper, D.; Perretti, M.; Fantuzzi, G. Adipose tissue-specific modulation of galectin expression in lean and obese mice: Evidence for regulatory function. Obesity 2013, 21, 310–319. [Google Scholar] [CrossRef] [PubMed]
- Wang, J.L.; Gray, R.M.; Haudek, K.C.; Patterson, R.J. Nucleocytoplasmic lectins. Biochim. Biophys. Acta 2004, 1673, 75–93. [Google Scholar] [CrossRef] [PubMed]
- Liu, F.T.; Rabinovich, G.A. Galectins as modulators of tumour progression. Nat. Rev. Cancer 2005, 5, 29–41. [Google Scholar] [CrossRef] [PubMed]
- Nakahara, S.; Oka, N.; Raz, A. On the role of galectin-3 in cancer apoptosis. Apoptosis 2005, 10, 267–275. [Google Scholar] [CrossRef] [PubMed]
- Yang, R.Y.; Rabinovich, G.A.; Liu, F.T. Galectins: Structure, function and therapeutic potential. Expert Rev. Mol. Med. 2008, 10, e17. [Google Scholar] [CrossRef] [PubMed]
- Norling, L.V.; Perretti, M.; Cooper, D. Endogenous galectins and the control of the host inflammatory response. J. Endocrinol. 2009, 201, 169–184. [Google Scholar] [CrossRef] [PubMed]
- Pejnovic, N.N.; Pantic, J.M.; Jovanovic, I.P.; Radosavljevic, G.D.; Milovanovic, M.Z.; Nikolic, I.G.; Zdravkovic, N.S.; Djukic, A.L.; Arsenijevic, N.N.; Lukic, M.L. Galectin-3 deficiency accelerates high-fat diet-induced obesity and amplifies inflammation in adipose tissue and pancreatic islets. Diabetes 2013, 62, 1932–1944. [Google Scholar] [CrossRef] [PubMed]
- Pan, H.F.; Zhang, N.; Li, W.X.; Tao, J.H.; Ye, D.Q. TIM-3 as a new therapeutic target in systemic lupus erythematosus. Mol. Biol. Rep. 2010, 37, 395–398. [Google Scholar] [CrossRef] [PubMed]
- Barondes, S.H.; Cooper, D.N.; Gitt, M.A.; Leffler, H. Galectins Structure and function of a large family of animal lectins. J. Biol. Chem. 1994, 269, 20807–20810. [Google Scholar] [PubMed]
- Perillo, N.L.; Pace, K.E.; Seilhamer, J.J.; Baum, L.G. Apoptosis of T cells mediated by galectin-1. Nature 1995, 378, 736–739. [Google Scholar] [CrossRef] [PubMed]
- Chung, C.D.; Patel, V.P.; Moran, M.; Lewis, L.A.; Miceli, M.C. Galectin-1 induces partial TCR ζ-chain phosphorylation and antagonizes processive TCR signal transduction. J. Immunol. 2000, 165, 3722–3729. [Google Scholar] [CrossRef] [PubMed]
- Stannard, K.A.; Collins, P.M.; Ito, K.; Sullivan, E.M.; Scott, S.A.; Gabutero, E.; Darren Grice, I.; Low, P.; Nilsson, U.J.; Leffler, H.; et al. Galectin inhibitory disaccharides promote tumour immunity in a breast cancer model. Cancer Lett. 2010, 299, 95–110. [Google Scholar] [CrossRef] [PubMed]
- Astorgues-Xerri, L.; Riveiro, M.E.; Tijeras-Raballand, A.; Serova, M.; Neuzillet, C.; Albert, S.; Raymond, E.; Faivre, S. Unraveling galectin-1 as a novel therapeutic target for cancer. Cancer Treat Rev. 2014, 40, 307–319. [Google Scholar] [CrossRef] [PubMed]
- Ito, K.; Scott, S.A.; Cutler, S.; Dong, L.F.; Neuzil, J.; Blanchard, H.; Ralph, S.J. Thiodigalactoside inhibits murine cancers by concurrently blocking effects of galectin-1 on immune dysregulation, angiogenesis and protection against oxidative stress. Angiogenesis 2011, 14, 293–307. [Google Scholar] [CrossRef] [PubMed]
- Zolg, J.W.; Langen, H. How industry is approaching the search for new diagnostic markers and biomarkers. Mol. Cell. Proteomics 2004, 3, 345–354. [Google Scholar] [CrossRef] [PubMed]
- Issaq, H.J.; Conrads, T.P.; Janini, G.M.; Veenstra, T.D. Methods for fractionation, separation and profiling of proteins and peptides. Electrophoresis 2002, 23, 3048–3061. [Google Scholar] [CrossRef]
- Choi, D.K.; Oh, T.S.; Choi, J.W.; Mukherjee, R.; Wang, X.; Liu, H.; Yun, J.W. Gender difference in proteome of brown adipose tissues between male and female rats exposed to a high fat diet. Cell. Physiol. Biochem. 2011, 28, 933–948. [Google Scholar] [CrossRef] [PubMed]
- Mukherjee, R.; Choi, J.W.; Choi, D.K.; Oh, T.S.; Liu, H.; Yun, J.W. Gender-dependent protein expression in white adipose tissues of lean and obese rats fed a high fat diet. Cell. Physiol. Biochem. 2012, 29, 617–634. [Google Scholar] [CrossRef] [PubMed]
- Kim, S.W.; Park, T.J.; Choi, J.H.; Aseer, K.R.; Choi, J.Y.; Kim, Y.J.; Choi, M.S.; Yun, J.W. Differential protein expression in white adipose tissue from obesity-prone and obesity-resistant mice in response to high fat diet and anti-obesity herbal medicines. Cell. Physiol. Biochem. 2015, 35, 1482–1489. [Google Scholar] [CrossRef] [PubMed]
- Mukherjee, R.; Kim, S.W.; Park, T.; Choi, M.S.; Yun, J.W. Targeted inhibition of galectin 1 by thiosigalactoside dramatically reduces body weight gain in diet-induced obese rats. Int. J. Obes. (Lond.) 2015. [Google Scholar] [CrossRef] [PubMed]
- Wu, C.; Kang, J.E.; Peng, L.J.; Li, H.; Khan, S.A.; Hillard, C.J.; Okar, D.A.; Lange, A.J. Enhancing hepatic glycolysis reduces obesity differential effects on lipogenesis depend on site of glycolytic modulation. Cell Metab. 2005, 2, 131–140. [Google Scholar] [CrossRef] [PubMed]
- Parra-Bonilla, G.; Alvarez, D.F.; Al-Mehdi, A.B.; Alexeyev, M.; Stevens, T. Critical role for lactate dehydrogenase A in aerobic glycolysis that sustains pulmonary microvascular endothelial cell proliferation. Am. J. Physiol. Lung Cell. Mol. Physiol. 2010, 299, L513–L522. [Google Scholar] [CrossRef] [PubMed]
- Carrière, A.; Jeanson, Y.; Berger-Müller, S.; André, M.; Chenouard, V.; Arnaud, E.; Barreau, C.; Walther, R.; Galinier, A.; Wdziekonski, B.; et al. Browning of white adipose cells by intermediate metabolites: An adaptive mechanism to alleviate redox pressure. Diabetes 2014, 63, 3253–3265. [Google Scholar] [CrossRef] [PubMed]
- Hashimoto, T.; Hussien, R.; Oommen, S.; Gohil, K.; Brooks, G.A. Lactate sensitive transcription factor network in L6 cells activation of MCT1 and mitochondrial biogenesis. FASEB J. 2007, 21, 2602–2612. [Google Scholar] [CrossRef] [PubMed]
- Soto, G.; Stritzler, M.; Lisi, C.; Alleva, K.; Pagano, M.E.; Ardila, F.; Mozzicafreddo, M.; Cuccioloni, M.; Angeletti, M.; Ayub, N.D. Acetoacetyl-CoA thiolase regulates the mevalonate pathway during abiotic stress adaptation. J. Exp. Bot. 2011, 62, 5699–5711. [Google Scholar] [CrossRef] [PubMed]
- Taggart, A.K.; Kero, J.; Gan, X.; Cai, T.Q.; Cheng, K.; Ippolito, M.; Ren, N.; Kaplan, R.; Wu, K.; Wu, T.J.; et al. (d)-β-Hydroxybutyrate inhibits adipocyte lipolysis via the nicotinic acid receptor PUMA-G. J. Biol. Chem. 2005, 280, 26649–26652. [Google Scholar] [CrossRef] [PubMed]
- Stobbe, M.D.; Houten, S.M.; van Kampen, A.H.; Wanders, R.J.; Moerland, P.D. Improving the description of metabolic networks the TCA cycle as example. FASEB J. 2012, 26, 3625–3636. [Google Scholar] [CrossRef] [PubMed]
- Sullivan, J.E.; Brocklehurst, K.J.; Marley, A.E.; Carey, F.; Carling, D.; Beri, R.K. Inhibition of lipolysis and lipogenesis in isolated rat adipocytes with AICAR, a cell-permeable activator of AMP-activated protein kinase. FEBS Lett. 1994, 353, 33–36. [Google Scholar] [CrossRef]
- Daval, M.; Diot-Dupuy, F.; Bazin, R.; Hainault, I.; Viollet, B.; Vaulont, S.; Hajduch, E.; Ferré, P.; Foufelle, F. Anti-lipolytic action of AMP-activated protein kinase in rodent adipocytes. J. Biol. Chem. 2005, 280, 25250–25257. [Google Scholar] [CrossRef] [PubMed]
- Zhang, H.; Osyczka, A.; Dutton, P.L.; Moser, C.C. Exposing the complex III Qo semiquinone radical. Biochim. Biophys. Acta 2007, 1767, 883–887. [Google Scholar] [CrossRef] [PubMed]
- Bartoschek, S.; Johansson, M.; Geierstanger, B.H.; Okun, J.G.; Lancaster, C.R.; Humpfer, E.; Yu, L.; Yu, C.A.; Griesinger, C.; Brandt, U. Three molecules of ubiquinone bind specifically to mitochondrial cytochrome bc1 complex. J. Biol. Chem. 2001, 276, 35231–35234. [Google Scholar] [CrossRef] [PubMed]
- Hastie, R.; Lappas, M. The effect of pre-existing maternal obesity and diabetes on placental mitochondrial content and electron transport chain activity. Placenta 2014, 35, 673–683. [Google Scholar] [CrossRef] [PubMed]
- Xie, W.D.; Wang, H.; Zhang, J.F.; Kung, H.F.; Zhao, Y.N.; Zhang, Y. Proteomic profile of visceral adipose tissues between low-fat diet-fed obesity-resistant and obesity-prone C57BL/6 mice. Mol. Med. Rep. 2010, 3, 1047–1052. [Google Scholar] [CrossRef] [PubMed]
- Choi, C.S.; Ghoshal, P.; Srinivasan, M.; Kim, S.; Cline, G.; Patel, M.S. Liver-specific pyruvate dehydrogenase complex deficiency upregulates lipogenesis in adipose tissue and improves peripheral insulin sensitivity. Lipids 2010, 45, 987–995. [Google Scholar] [CrossRef] [PubMed]
- Kim, G.; Lee, T.H.; Wetzel, P.; Geers, C.; Robinson, M.A.; Myers, T.G.; Owens, J.W.; Wehr, N.B.; Eckhaus, M.W.; Gros, G.; et al. Carbonic anhydrase III is not required in the mouse for normal growth, development, and life span. Mol. Cell. Biol. 2004, 24, 9942–9947. [Google Scholar] [CrossRef] [PubMed]
- Stanton, L.W.; Ponte, P.A.; Coleman, R.T.; Snyder, M.A. Expression of CA III in rodent models of obesity. Mol. Endocrinol. 1991, 5, 860–866. [Google Scholar] [CrossRef] [PubMed]
- Walker, E.J.; Dow, J.W. Location and properties of two isoenzymes of cardiac adenylate kinase. Biochem. J. 1982, 203, 361–369. [Google Scholar] [PubMed]
- Dzeja, P.P.; Zeleznikar, R.J.; Goldberg, N.D. Adenylate kinase kinetic behavior in intact cells indicates it is integral to multiple cellular processes. Mol. Cell. Biochem. 1998, 184, 169–182. [Google Scholar] [CrossRef] [PubMed]
- Nobumoto, M.; Yamada, M.; Song, S.; Inouye, S.; Nakazawa, A. Mechanism of mitochondrial import of adenylate kinase isozymes. J. Biochem. 1998, 123, 128–135. [Google Scholar] [CrossRef] [PubMed]
- Dzeja, P.P.; Bast, P.; Pucar, D.; Wieringa, B.; Terzic, A. Defective metabolic signaling in adenylate kinase AK1 gene knock-out hearts compromises post-ischemic coronary reflow. J. Biol. Chem. 2007, 282, 31366–31372. [Google Scholar] [CrossRef] [PubMed]
- Hittel, D.S.; Hathout, Y.; Hoffman, E.P.; Houmard, J.A. Proteome analysis of skeletal muscle from obese and morbidly obese women. Diabetes 2005, 54, 1283–1288. [Google Scholar] [CrossRef] [PubMed]
- Keller, E.T.; Fu, Z.; Yeung, K.; Brennan, M. Raf kinase inhibitor protein: A prostate cancer metastasis suppressor gene. Cancer Lett. 2004, 207, 131–137. [Google Scholar] [CrossRef] [PubMed]
- Hagan, S.; Garcia, R.; Dhillon, A.; Kolch, W. Raf kinase inhibitor protein regulation of raf and MAPK signaling. Methods Enzymol. 2006, 407, 248–259. [Google Scholar] [PubMed]
- Aguirre, V.; Werner, E.D.; Giraud, J.; Lee, Y.H.; Shoelson, S.E.; White, M.F. Phosphorylation of Ser307 in insulin receptor substrate-1 blocks interactions with the insulin receptor and inhibits insulin action. J. Biol. Chem. 2002, 277, 1531–1537. [Google Scholar] [CrossRef] [PubMed]
- Lee, Y.H.; Giraud, J.; Davis, R.J.; White, M.F. c-Jun N-terminal kinase (JNK) mediates feedback inhibition of the insulin signaling cascade. J. Biol. Chem. 2003, 278, 2896–2902. [Google Scholar] [CrossRef] [PubMed]
- Hirosumi, J.; Tuncman, G.; Chang, L.; Görgün, C.Z.; Uysal, K.T.; Maeda, K.; Karin, M.; Hotamisligil, G.S. A central role for JNK in obesity and insulin resistance. Nature 2002, 420, 333–336. [Google Scholar] [CrossRef] [PubMed]
- Valdur, S. The phosphocreatine-creatine kinase system helps to shape muscle cells and keep them healthy and alive. J. Physiol. 2008, 586, 2817–2818. [Google Scholar]
- Gupta, A.; Akki, A.; Wang, Y.; Leppo, M.K.; Chacko, V.P.; Foster, D.B.; Caceres, V.; Shi, S.; Kirk, J.A.; Su, J.; et al. Creatine kinase-mediated improvement of function in failing mouse hearts provides causal evidence the failing heart is energy starved. J. Clin. Investig. 2012, 122, 291–302. [Google Scholar] [CrossRef] [PubMed]
- Chiang, Y.; Rizzino, A.; Sibenaller, Z.A.; Wold, M.S.; Vishwanatha, J.K. Specific down-regulation of annexin II expression in human cells interferes with cell proliferation. Mol. Cell. Biochem. 1999, 199, 139–147. [Google Scholar] [CrossRef] [PubMed]
- Babiychuk, E.B.; Draeger, A. Annexins in cell membrane dynamics Ca2+ regulated association of lipid microdomains. J. Cell Biol. 2000, 150, 1113–1124. [Google Scholar] [CrossRef] [PubMed]
- Kolonin, M.G.; Saha, P.K.; Chan, L.; Pasqualini, R.; Arap, W. Reversal of obesity by targeted ablation of adipose tissue. Nat. Med. 2004, 10, 625–632. [Google Scholar] [CrossRef] [PubMed]
- Benz, R. Permeation of hydrophilic solutes through mitochondrial outer membranes: Review on mitochondrial porins. Biochim. Biophys. Acta 1994, 1197, 167–196. [Google Scholar] [CrossRef]
- Shoshan-Barmatz, V.; Keinan, N.; Zaid, H. Uncovering the role of VDAC in the regulation of cell life and death. J. Bioenerg. Biomembr. 2008, 40, 183–191. [Google Scholar] [CrossRef] [PubMed]
- Galinier, A.; Carrière, A.; Fernandez, Y.; Carpéné, C.; André, M.; Caspar-Bauguil, S.; Thouvenot, J.P.; Périquet, B.; Pénicaud, L.; Casteilla, L. Adipose tissue proadipogenic redox changes in obesity. J. Biol. Chem. 2006, 281, 12682–12687. [Google Scholar] [CrossRef] [PubMed]
- Wang, X.; Choi, J.W.; Oh, T.S.; Choi, D.K.; Mukherjee, R.; Liu, H.; Yun, J.W. Comparative hepatic proteome analysis between lean and obese rats fed a high-fat diet reveals the existence of gender differences. Proteomics 2012, 12, 284–299. [Google Scholar] [CrossRef] [PubMed]
- Choi, M.; Choi, J.W.; Chaudhari, H.N.; Aseer, K.R.; Mukherjee, R.; Yun, J.W. Gender-dimorphic regulation of skeletal muscle proteins in streptozotocin-induced diabetic rats. Cell. Physiol. Biochem. 2013, 31, 408–420. [Google Scholar] [CrossRef] [PubMed]
© 2015 by the authors; licensee MDPI, Basel, Switzerland. This article is an open access article distributed under the terms and conditions of the Creative Commons Attribution license (http://creativecommons.org/licenses/by/4.0/).
Share and Cite
Parray, H.A.; Yun, J.W. Proteomic Identification of Target Proteins of Thiodigalactoside in White Adipose Tissue from Diet-Induced Obese Rats. Int. J. Mol. Sci. 2015, 16, 14441-14463. https://doi.org/10.3390/ijms160714441
Parray HA, Yun JW. Proteomic Identification of Target Proteins of Thiodigalactoside in White Adipose Tissue from Diet-Induced Obese Rats. International Journal of Molecular Sciences. 2015; 16(7):14441-14463. https://doi.org/10.3390/ijms160714441
Chicago/Turabian StyleParray, Hilal Ahmad, and Jong Won Yun. 2015. "Proteomic Identification of Target Proteins of Thiodigalactoside in White Adipose Tissue from Diet-Induced Obese Rats" International Journal of Molecular Sciences 16, no. 7: 14441-14463. https://doi.org/10.3390/ijms160714441