Article

The Stable Level of Glutamine synthetase 2 Plays an Important Role in Rice Growth and in Carbon-Nitrogen Metabolic Balance

1
Microelement Research Center, Key Laboratory of Arable Land Conservation (Middle and Lower Reaches of Yangtze River), Ministry of Agriculture, Huazhong Agricultural University, Wuhan 430070, China
2
National Key Laboratory of Crop Genetic Improvement, Huazhong Agricultural University, Wuhan 430070, China
*
Author to whom correspondence should be addressed.
Int. J. Mol. Sci. 2015, 16(6), 12713-12736; https://doi.org/10.3390/ijms160612713
Submission received: 29 April 2015 / Revised: 24 May 2015 / Accepted: 26 May 2015 / Published: 4 June 2015

Abstract

:
Glutamine synthetase 2 (GS2) is a key enzyme involved in the ammonium metabolism in plant leaves. In our previous study, we obtained GS2-cosuppressed plants, which displayed a normal growth phenotype at the seedling stage, while at the tillering stage they showed a chlorosis phenotype. In this study, to investigate the chlorosis mechanism, we systematically analyzed the plant growth, carbon-nitrogen metabolism and gene expressions between the GS2-cosuppressed rice and wild-type plants. The results revealed that the GS2-cosuppressed plants exhibited a poor plant growth phenotype and a poor nitrogen transport ability, which led to nitrogen accumulation and a decline in the carbon/nitrogen ratio in the stems. Interestingly, there was a higher concentration of soluble proteins and a lower concentration of carbohydrates in the GS2-cosuppressed plants at the seedling stage, while a contrasting result was displayed at the tillering stage. The analysis of the metabolic profile showed a significant increase of sugars and organic acids. Additionally, gene expression patterns were different in root and leaf of GS2-cosuppressed plants between the seedling and tillering stage. These results indicated the important role of a stable level of GS2 transcription during normal rice development and the importance of the carbon-nitrogen metabolic balance in rice growth.

1. Introduction

Nitrogen (N) is one of the essential macronutrients required for plant growth. It is also a major limiting factor, which determines plant biomass and crop yield [1,2]. N is not only a constituent of key molecules, such as amino acids, nucleic acids, chlorophyll, ATP and several plant hormones, it is also the regulator in many biological processes, such as amino acid metabolism, carbon metabolism and protein synthesis [3,4]. Additionally, carbon (C) plays a crucial role in plants’ routine growth and development. Various C compounds, including glucose, sucrose, organic acids and other carbohydrates, provide both the C skeletons and the energy for ammonium (NH4+) assimilation. N compounds are synthesized by incorporating NH4+ into the C skeletons. Amino acids and proteins, in particular enzymes, are essential for almost all cellular activities, including the C and N metabolic reactions [5]. Therefore, both C and N nutrients are essential for cellular functions. Recently, it has been recognized that cellular C and N metabolism must be tightly coordinated. Maintaining a coordination of carbon-nitrogen metabolism and an appropriate balance of carbohydrates to nitrogen metabolites, which also is referred to as the “C/N balance”, is important for plant growth, development and yield production [5,6,7,8,9,10].
Glutamine synthetase (GS; EC 6.3.1.2) is a key enzyme for the assimilation of NH4+, which is derived from nitrate (NO3), nitrogen fixation or generated by other reactions that release ammonium within the plant, into glutamine (Gln) [11,12,13]. The GS/GOGAT (glutamate synthase) cycle can generate two molecules of glutamate (Glu). One, as the substrate, is cycled back to the NH4+ assimilation by the GS enzyme; the other one is exported out of the GS/GOGAT cycle to synthesize other types of amino acids [14]. In higher plants, there are two GS isoforms, cytosolic GS1 and chloroplastic GS2 [15,16]. Generally, there is a multigene family that encodes the cytosolic GS1, while only a single gene encodes the chloroplastic GS2 [17,18,19,20,21,22,23]. There is one exception that Medicago truncatula has two GS2 genes [24]. To date, only the OsGS2 gene is identified in rice that encodes chloroplastic GS2, which is mainly expressed in leaf [25].
Several studies have justified the importance of the GS2 enzyme in the assimilation of ammonium, especially the major function in photorespiratory ammonium re-assimilation, because mutants lacking the GS2 gene were able to grow normally under non-photorespiratory conditions. For example, high light intensity tolerance and photorespiration capacity were observed in GS2-overexpressed transgenic tobacco plants [26]. Similarly, increased salt tolerance and photorespiration capacity were also found in transgenic rice [27]. The amount of GS2 protein decreased by 35% in GS2-silencing oil seed rape plants, while no changes in plant growth were observed when compared to the wild-type plants [28]. GS2 deficiency in Lotus japonicas has an important effect on the nodulation process in legumes [29]. Moreover, barley GS2 mutants died when grown in normal air, because they were unable to re-assimilate photorespiratory ammonium [30,31,32]. A recent study indicated that GS2 genes may be related to the grain protein content of durum wheat [23].
Plant growth and crop production requires abundant nitrogen, which is generally the most common limiting nutrient for the growth and yield of crops worldwide. Large amounts of nitrogen fertilizers are applied to meet the high nitrogen requirements of crop plants. However, the application of large quantities of fertilizers to increase crop yield is not economically sustainable and also leads to environmental pollution. Reports pointed out that less than half of the applied nitrogen fertilizers were absorbed and used by crop plants, and the left nitrogen was inevitably lost to the atmosphere and leached into the underground water system, leading to severe environmental pollution [33]. A recent analysis showed that high N fertilizer input was the main reason for soil acidification in China [34]. Rice (Oryza sativa) is the main staple food in the world. As rice has the smallest genome among the major cereals and amount of genetic resources, it becomes a model cereal for science research [35]. Because of the important function of the GS enzyme in plant N metabolism, particular attention has been devoted to studies on GS transformation in higher plants, which is expected to be a good molecular method to analyze gene functions and a good strategy to improve nitrogen use efficiency.
Based on these aspects, we constructed the GS2-overexpressed transformants using CaMV35S promoter and obtained the transgenic rice plants by the Agrobacterium-mediated transformation method to improve the nitrogen use efficiency [36]. Interesting results were observed in these transgenic plants. In the T0 generation, transcripts of the GS2 gene were shown to accumulate at higher levels, and no differences in the visible growth phenotype were observed; whereas, in the T1 generation, the transgenic plants exhibited a chlorosis phenotype (yellow leaves) accompanied by a significant decline in the level of GS2 messenger RNA (mRNA) and total GS activity, decreased plant height, few tillers and decreased dry weight. In addition, the transgenic plants displayed better performance when grown in a normal nutrient solution complemented with exogenous glutamine (Gln) [36]. Based on these results, we renamed the transgenic plants GS2-cosuppressed rice. In the present study, to determine the possible reason for the chlorosis phenotype of the transgenic plants, we systematically analyzed the differences in the plant growth, carbon-nitrogen metabolism and gene expression profile between the GS2-cosuppressed rice (homozygous T2 generation of transgenic Line 87 with a decrease of 28% in GS activity in leaves) and wild-type Zhonghua 11 at the seedling stage and tillering stage. Additionally, in order to test the different response of the transgenic plants to the inorganic and organic nitrogen supplied in the environment, we planted these plants hydroponically under different nitrogen forms (supplied with ammonium nitrate, glutamine and both nitrogen forms). The results indicated the important role of a stable level of transcription of GS2 mRNA for the normal development of rice and the carbon-nitrogen metabolic balance. The unbalanced carbon-nitrogen metabolic status and the excessively high expression level of GS2 mRNA in the root may be the reasons for the chlorosis phenotype in the GS2-cosuppressed plants.

2. Results

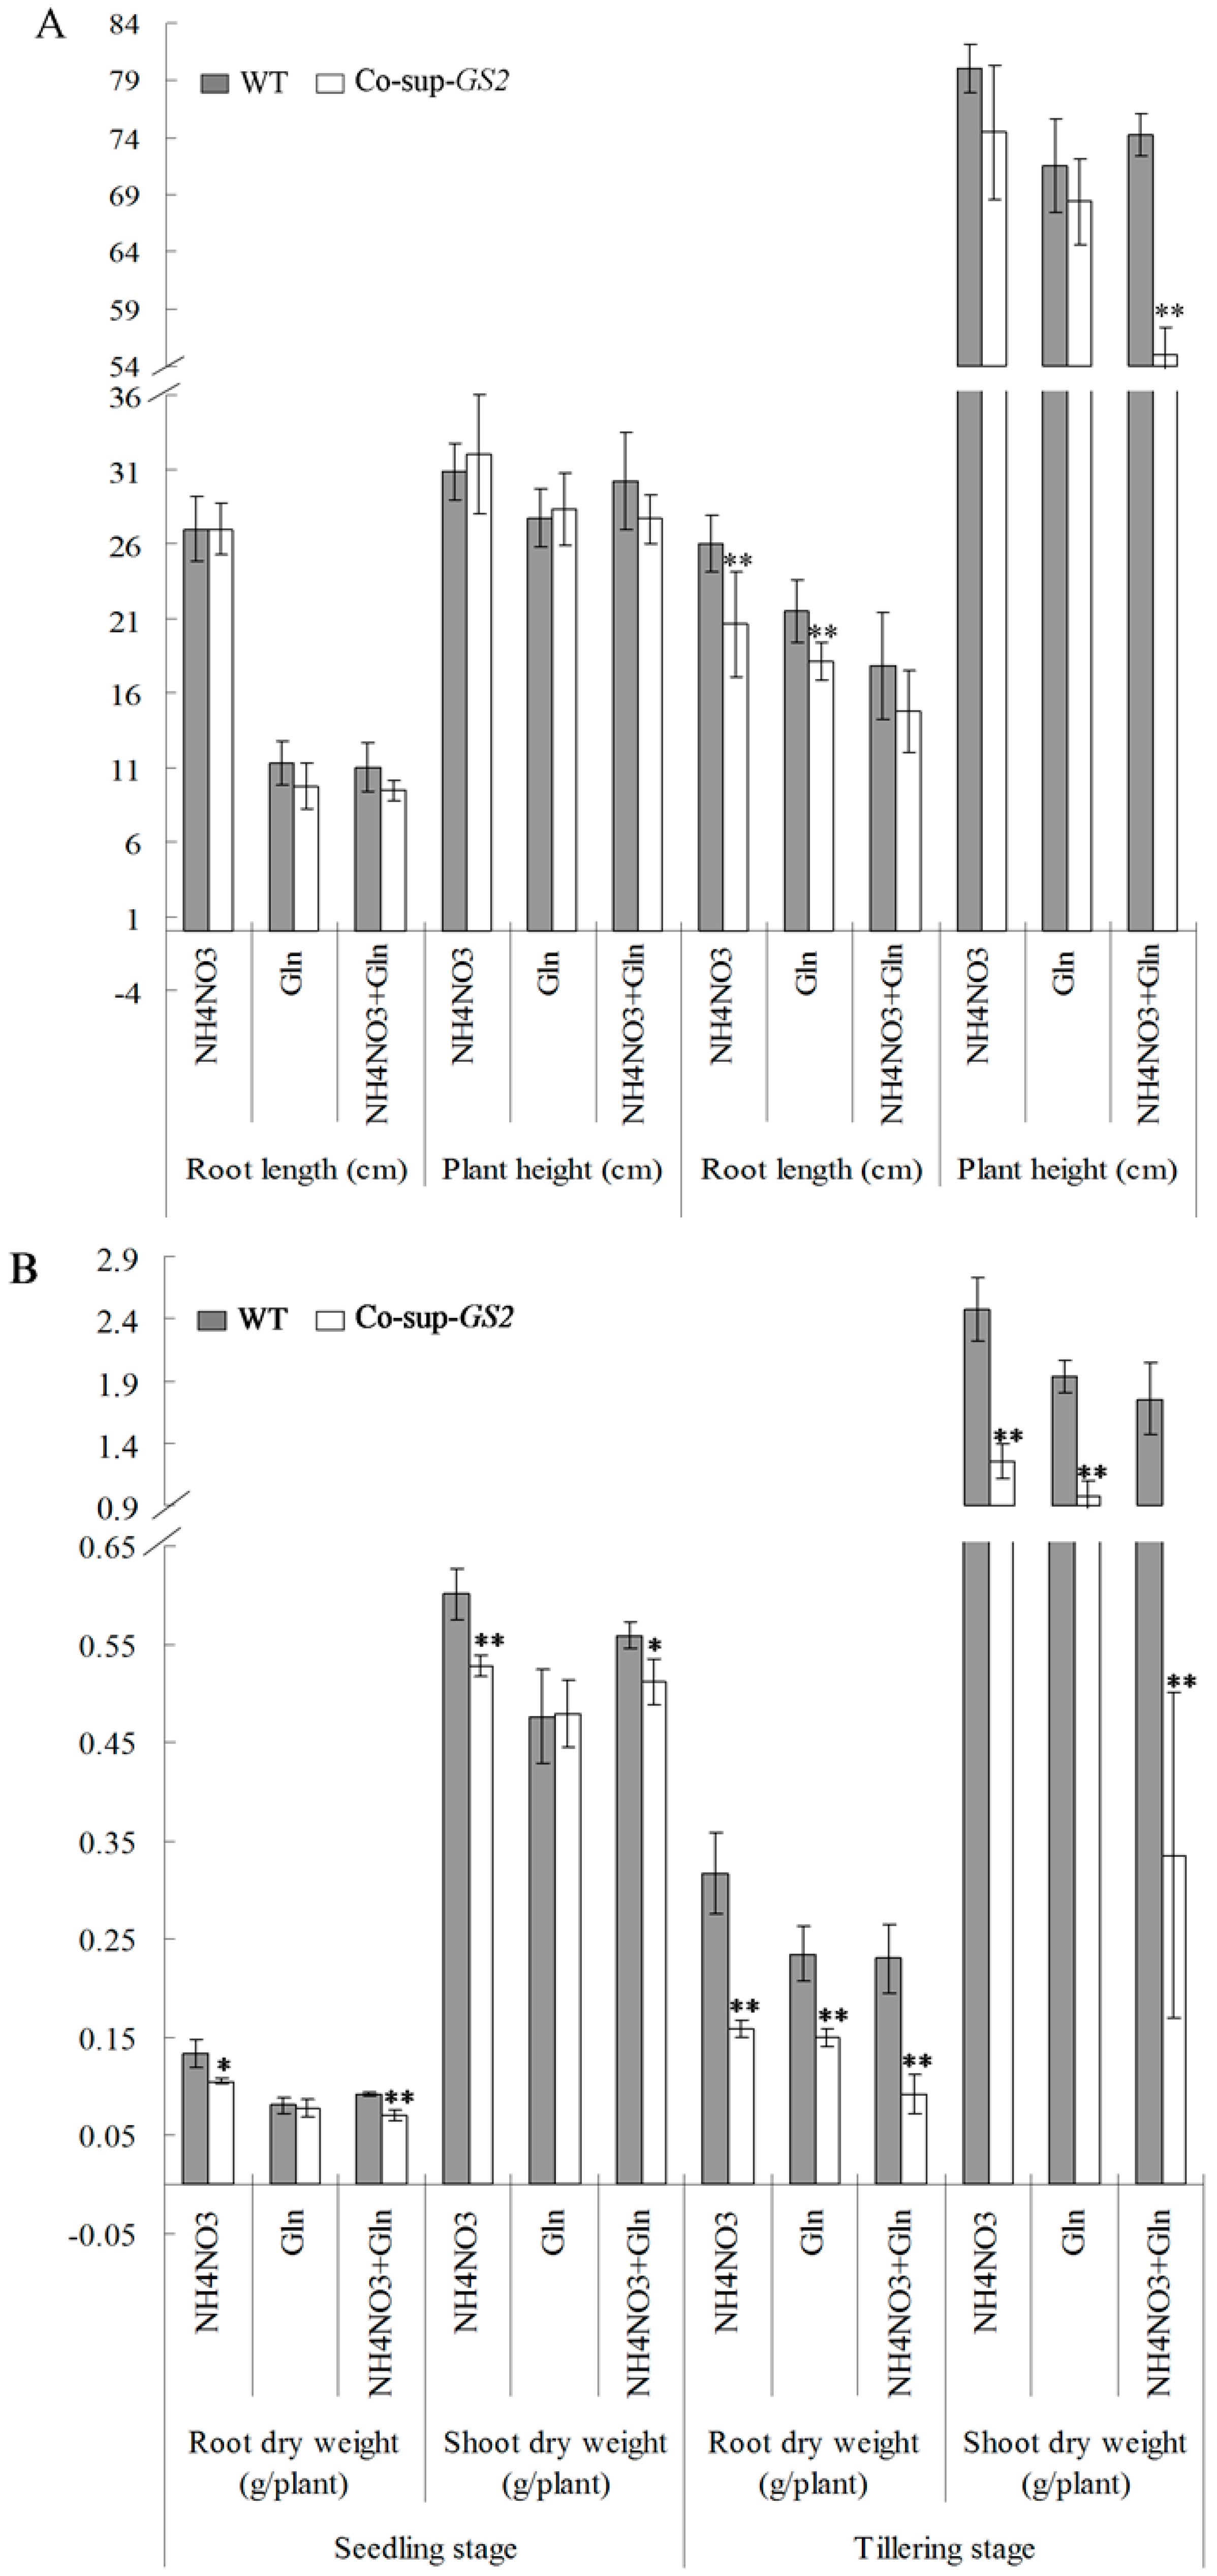
2.1. Growth Phenotype of GS2-Cosuppressed Plants at the Seedling and Tillering Stages

In our previous study, the GS2-cosuppressed plants exhibited a normal growth phenotype with a higher GS2 mRNA transcriptional level at the seedling stage, while the chlorosis phenotype and a lower GS2 mRNA transcriptional level was observed at the tillering stage [36]. Additionally, the GS2-cosuppressed plants displayed better performance when grown in a normal nutrient solution complemented with exogenous Gln [36]. To describe these phenotypes in detail, we measured the root length, plant height and the root and shoot dry weight of GS2-cosuppressed plants (homozygous T2 generation of transgenic Line 87 with a decrease of 28% in GS activity in leaves) and wild-type plants at the seedling stage and the tillering stage under N, G (Gln) and N + G conditions. Additionally, the leaf SPAD (Soil and Plant Analyzer Development) value and photosynthesis parameters were also examined in GS2-cosuppressed plants and wild-type plants at the tillering stage under N, G and N + G conditions.
At the seedling stage, there was no obvious difference in the root length and plant height between the GS2-cosuppressed plants and wild-type plants (Figure 1A). At the tillering stage, there were significant (p < 0.01) decreases in the root length and plant height in GS2-cosuppressed plants compared to the wild-type plants (20.8% and 15.4% decreases in root length in the GS2-cosuppressed plants grown under N and G conditions, respectively; 25.9% decreases in plant height in GS2-cosuppressed plants grown under N + G conditions; Figure 1A). In addition, the root length of both GS2-cosuppressed plants and the wild-type plants decreased significantly after Gln was supplied to the nutrient solution, especially at the seedling stage. There were 58.3%–65% decreases in root length growth under G and N + G conditions when compared to the N condition (Figure 1A). For the root and shoot dry weight analysis, there were significant (p < 0.05) reductions in GS2-cosuppressed plants at both the seedling and tillering stages when compared to the wild-type plants under these three different growth conditions, except the root and shoot dry weight under the G condition at the seedling stage (Figure 1B). Compared to the wild-type plants, there were 20.8%–23.2% reductions in the root dry weight, and 8.6%–12.2% reductions in the shoot dry weight of GS2-cosuppressed plants were observed at the seedling stage; meanwhile, 36.2%–59.8% reductions in the root dry weight and 49.1%–80.9% reductions in the shoot dry weight of GS2-cosuppressed plants were observed at the tillering stage (Figure 1B). These results showed the different growth phenotypes between the GS2-cosuppressed plants and the wild-type plants at the tillering stage, especially with regard to the root and shoot dry weight.
The leaf SPAD value of the wild-type plants was stable under three different growth conditions, while the leaf SPAD value of the GS2-cosuppressed plants increased after the addition of Gln to the nutrient solution (Table 1). Additionally, the leaf SPAD value of the GS2-cosuppressed plants decreased significantly (p < 0.05) when compared to the wild-type plants, with 16.9%, 10.7% and 4.9% decreases for the N, G and N + G conditions, respectively (Table 1). However, there were no changes in the photosynthetic parameters (including photosynthetic rate, stomatal conductance, intercellular CO2 concentration and transpiration rate) between the GS2-cosuppressed plants and the wild-type plants, except there were significant (p < 0.01) decreases in the photosynthetic rate (14.6% decrease) and transpiration rate (20.6% decrease) in the GS2-cosuppressed plants grown under the G condition when compared to the wild-type plants (Table 1).
Figure 1. The root length and plant height (A), root dry weight and shoot dry weight (B) in the GS2-cosuppressed plants (Co-sup-GS2) and wild-type plants (WT) at the seedling stage and the tillering stage under N (NH4NO3), G (Gln) and N + G (NH4NO3 + Gln) conditions. Values are the mean ± SD of ten randomly-selected plants. *, ** Significant differences at the level of p = 0.05 and p = 0.01, respectively.
Ijms 16 12713 g001
Table 1. The leaf SPAD value and photosynthetic parameters in the GS2-cosuppressed plants (Co-sup-GS2) and wild-type plants (WT) at the tillering stage under N (NH4NO3), G (Gln) and N + G (NH4NO3 + Gln) conditions.
TreatmentSPAD at Tillering StagePhotosynthesis Parameters at Tillering Stage
Photosynthetic Rate (μmol CO2 m−2·s−2)Stomatal Conductance (mmol m−2·s−1)Intercellular CO2 Concentration (μL·L−1)Transpiration Rate (mmol H2O m−2·S−1)
NH4NO3
WT46.1 ± 2.928.24 ± 3.320.82 ± 0.06287.75 ± 9.6215.06 ± 1.10
Co-sup-GS238.3 ± 6.3 **29.76 ± 3.241.01 ± 0.26292.91 ± 8.3615.99 ± 1.36
Gln
WT46.0 ± 2.233.24 ± 2.100.90 ± 0.12278.39 ± 7.7916.36 ± 1.56
Co-sup-GS241.1 ± 3.2 **28.39 ± 1.54 **0.71 ± 0.05277.77 ± 1.3212.99 ± 0.61 **
NH4NO3 + Gln
WT44.5 ± 2.430.83 ± 2.030.76 ± 0.10274.75 ± 9.9814.70 ± 1.61
Co-sup-GS242.3 ± 2.0 *29.53 ± 2.360.64 ± 0.02268.03 ± 5.9313.32 ± 0.74
Values are mean ± SD from ten randomly-selected plants. *, ** Significant differences at the level of p = 0.05 and p = 0.01, respectively.

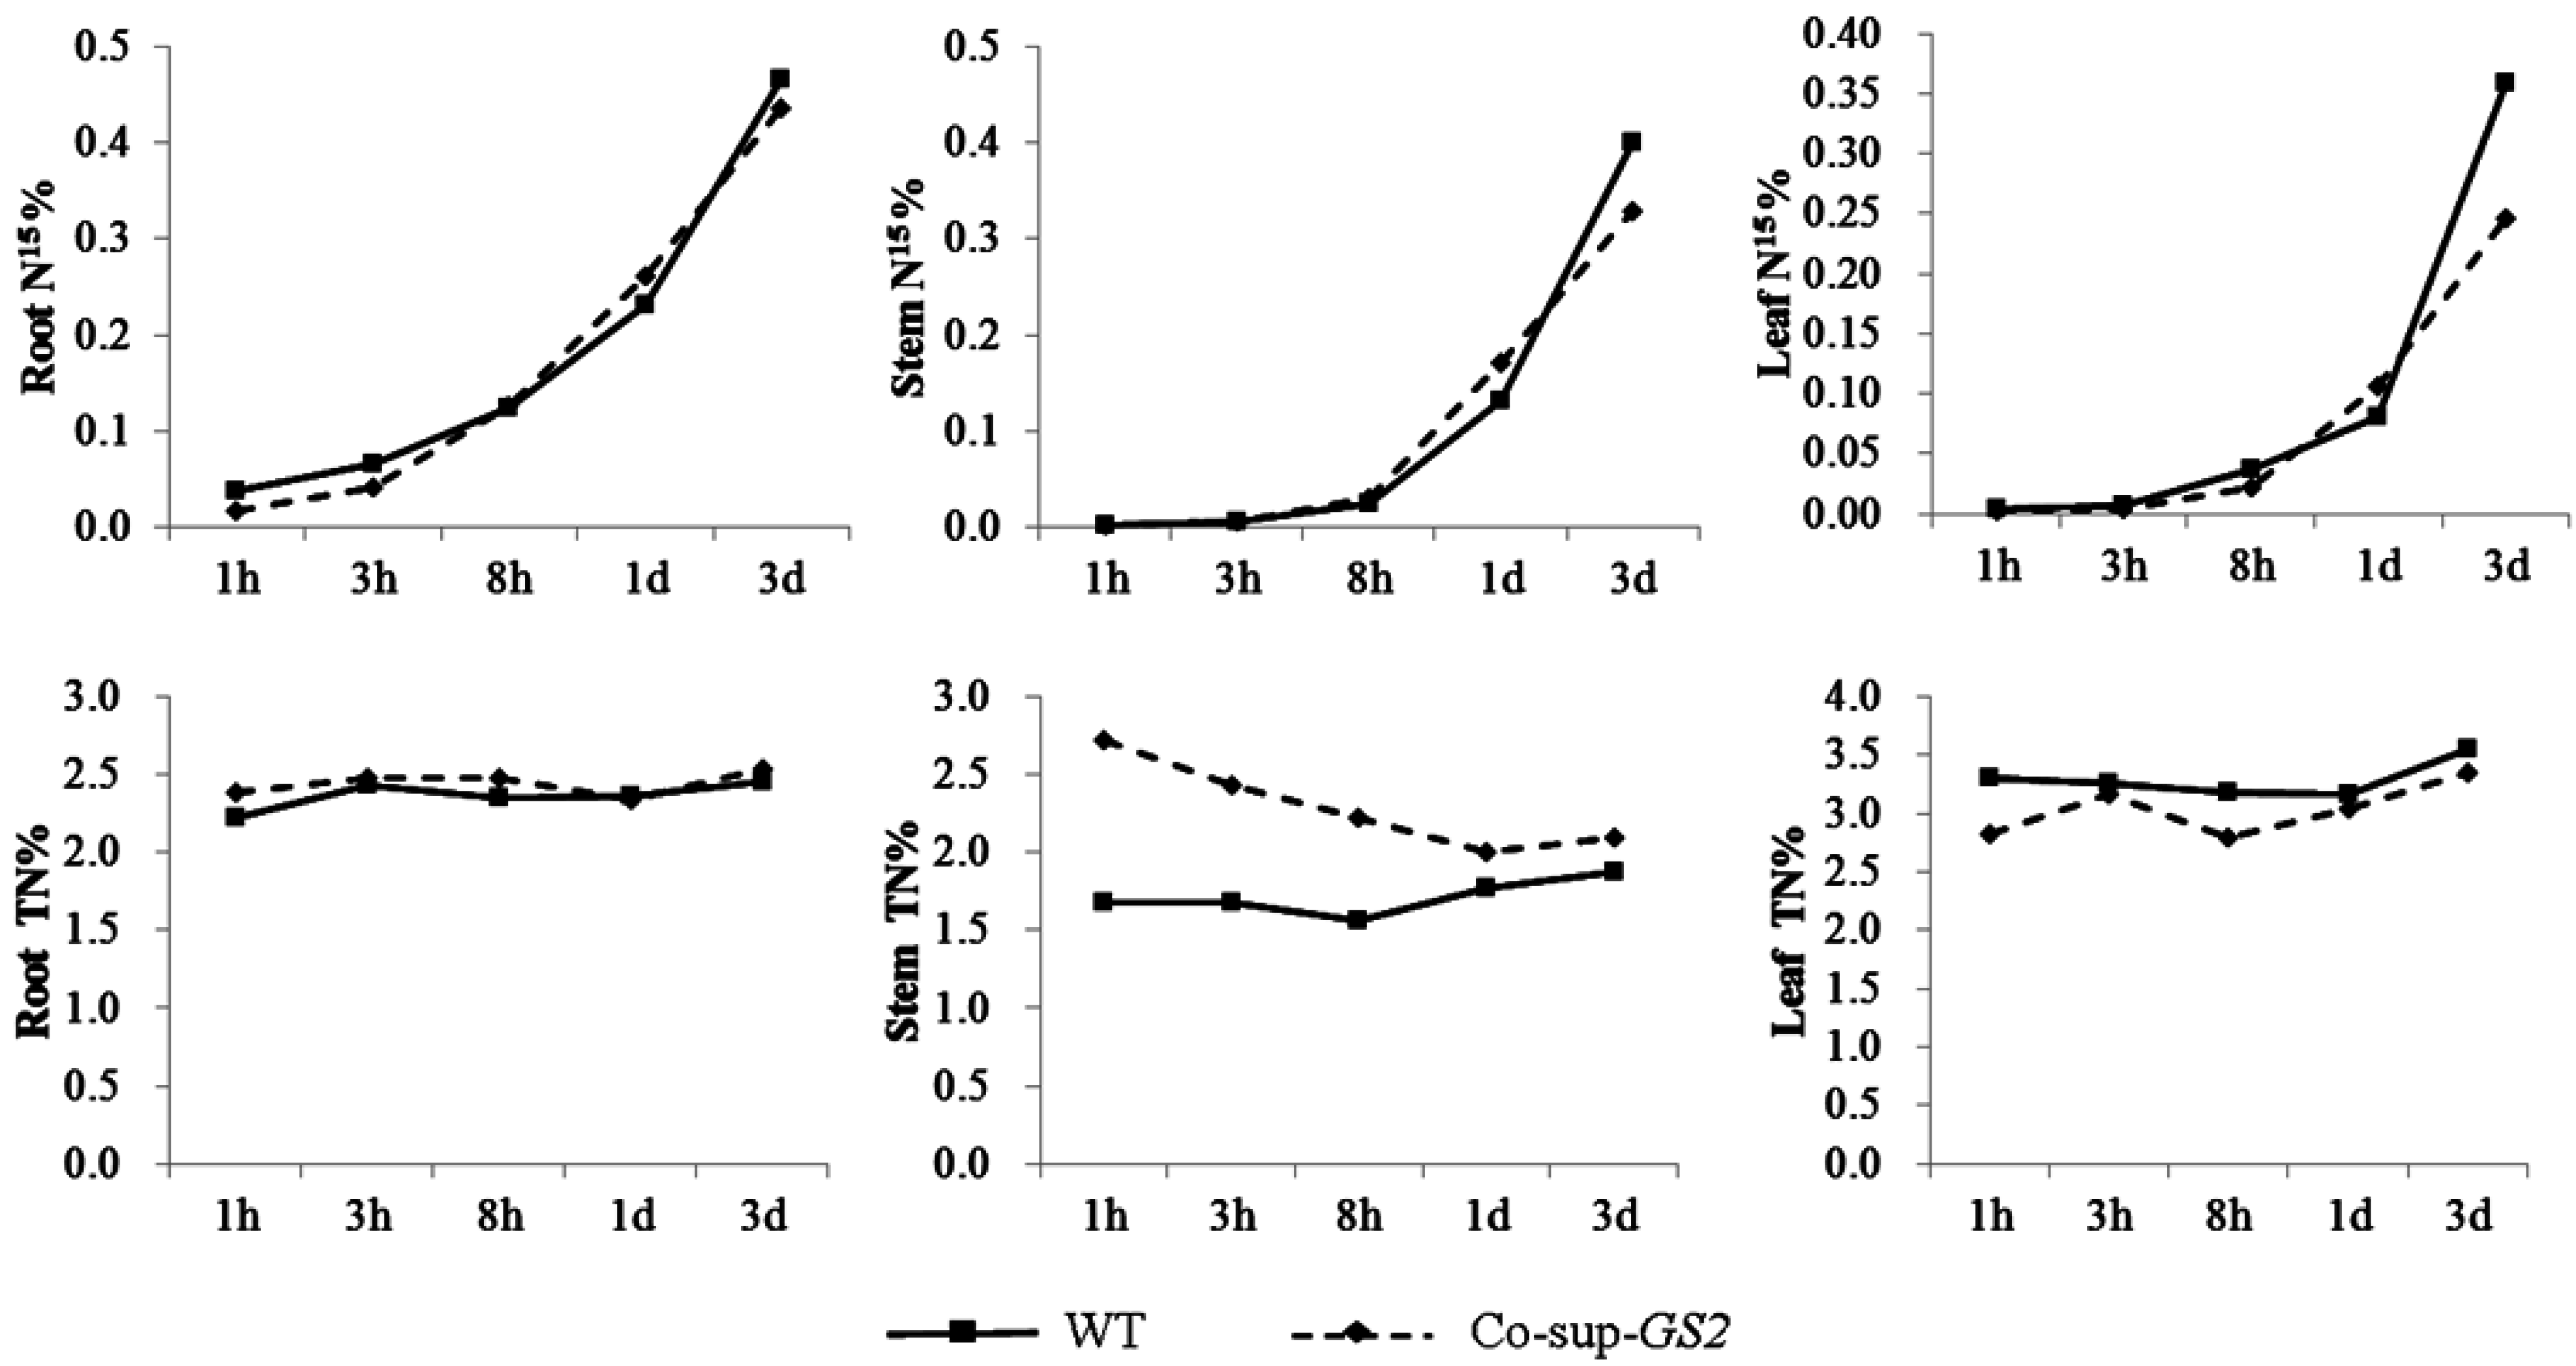
2.2. Nitrogen Uptake by GS2-Cosuppressed Plants

As GS is the main enzyme that assimilates NH4+ into Gln, we analyzed the nitrogen uptake and transport ability of the GS2-cosuppressed plants at the tillering stage using 15N. The total carbon and nitrogen concentration and the carbon/nitrogen ratio were also determined in the roots, stems and leaves of GS2-cosuppressed plants and wild-type plants under N, G and N + G growth conditions at the tillering stage. For the nitrogen uptake assay, the NH4NO3 in the nutrient solution was replaced by 15NH415NO3. After 1 h, 3 h, 8 h, 1 day and 3 days, the concentrations of total nitrogen and 15N in the roots, stems and leaves were analyzed in the GS2-cosuppressed plants and wild-type plants. The results showed that there was no difference in the total nitrogen concentration in the root between the GS2-cosuppressed plants and the wild-type plants. The stem total nitrogen concentration of the GS2-cosuppressed plants was 16.5%–61.9% higher than that of the wild-type plants; while the leaf total nitrogen concentration was 5.5%–16.6% lower than that of the wild-type plants (Figure 2). Similarly, there was no difference in the 15N concentration in the roots between the GS2-cosuppressed plants and the wild-type plants. The 15N concentration in the stems of the GS2-cosuppressed plants was 11.4%–66.7% higher than that of the wild-type plants; while 3 d after the NH4NO3 in the nutrient solution was replaced with 15NH415NO3, the 15N concentration in the leaves of the GS2-cosuppressed plants was 25.0% lower than in the wild-type plants (Figure 2). For the total carbon and nitrogen concentration analysis, significant (p < 0.01) increases in the total nitrogen concentration (26.0%, 32.7% and 18.1%) and significant (p < 0.05) decreases in the carbon/nitrogen ratio (20.2%, 24.0% and 17.9%) in the stem were observed in the GS2-cosuppressed plants grown under N, G and N + G conditions, respectively (Table 2). In addition, 3.8%, 5.3% and 9.9% decreases in the total nitrogen concentration were also observed in the GS2-cosuppressed plant leaves grown under the N, G and N + G conditions, respectively (Table 2). These results indicated a similar nitrogen uptake ability in roots between the GS2-cosuppressed plants and the wild-type plants, while a poor nitrogen transport ability from stems to leaves was observed, which led to nitrogen accumulation (especially the NO3; data not shown here) and a decrease in the carbon/nitrogen ratio in the stems of the GS2-cosuppressed plants.
Figure 2. The 15N (15N%) and total nitrogen content (TN%) in the roots, stems and uppermost leaves of the GS2-cosuppressed plants (Co-sup-GS2) and wild-type plants (WT) at 1 h, 3 h, 8 h, 1 day and 3 days after NH4NO3 in the nutrient solution was replaced with 15NH415NO3 during the tillering stage. The values are the means from three biological replicated plant materials.
Ijms 16 12713 g002
Table 2. The carbon content (C%), nitrogen content (N%) and carbon/nitrogen ratio (C/N) in the roots, stems and uppermost leaves of the GS2-cosuppressed plants (Co-sup-GS2) and wild-type plants (WT) at the tillering stage under N (NH4NO3), G (Gln) and N + G (NH4NO3 + Gln) conditions.
TreatmentC%N%C/N
RootStemLeafRootStemLeafRootStemLeaf
NH4NO3
WT38.64 ± 0.2335.02 ± 0.5238.81 ± 0.392.81 ± 0.132.50 ± 0.093.19 ± 0.0513.75 ± 0.5914.00 ± 0.4112.16 ± 0.10
Co-sup-GS238.49 ± 0.4935.11 ± 0.4738.97 ± 0.803.16 ± 0.103.15 ± 0.15 **3.07 ± 0.1712.18 ± 0.5311.17 ± 0.69 **12.69 ± 0.41
Gln
WT41.18 ± 0.1636.59 ± 0.3039.78 ± 0.353.29 ± 0.202.84 ± 0.223.41 ± 0.1012.53 ± 0.7912.92 ± 0.8611.68 ± 0.24
Co-sup-GS242.41 ± 0.3037.00 ± 0.6640.31 ± 0.733.21 ± 0.073.77 ± 0.07 **3.23 ± 0.1013.20 ± 0.409.82 ± 0.10 *12.48 ± 0.23
NH4NO3 + Gln
WT41.92 ± ND38.67 ± 0.3642.64 ± 0.263.86 ± ND3.70 ± 0.074.16 ± 0.0610.86 ± ND10.45 ± 0.1710.25 ± 0.08
Co-sup-GS2ND37.54 ± 0.5740.67 ± 1.14ND4.37 ± 0.13 **3.75 ± 0.17ND8.58 ± 0.13 **10.84 ± 0.19
Values are the mean ± SD from three biological replicated plant materials. *, ** Significant differences at the level of p = 0.05 and p = 0.01, respectively. ND: no data.

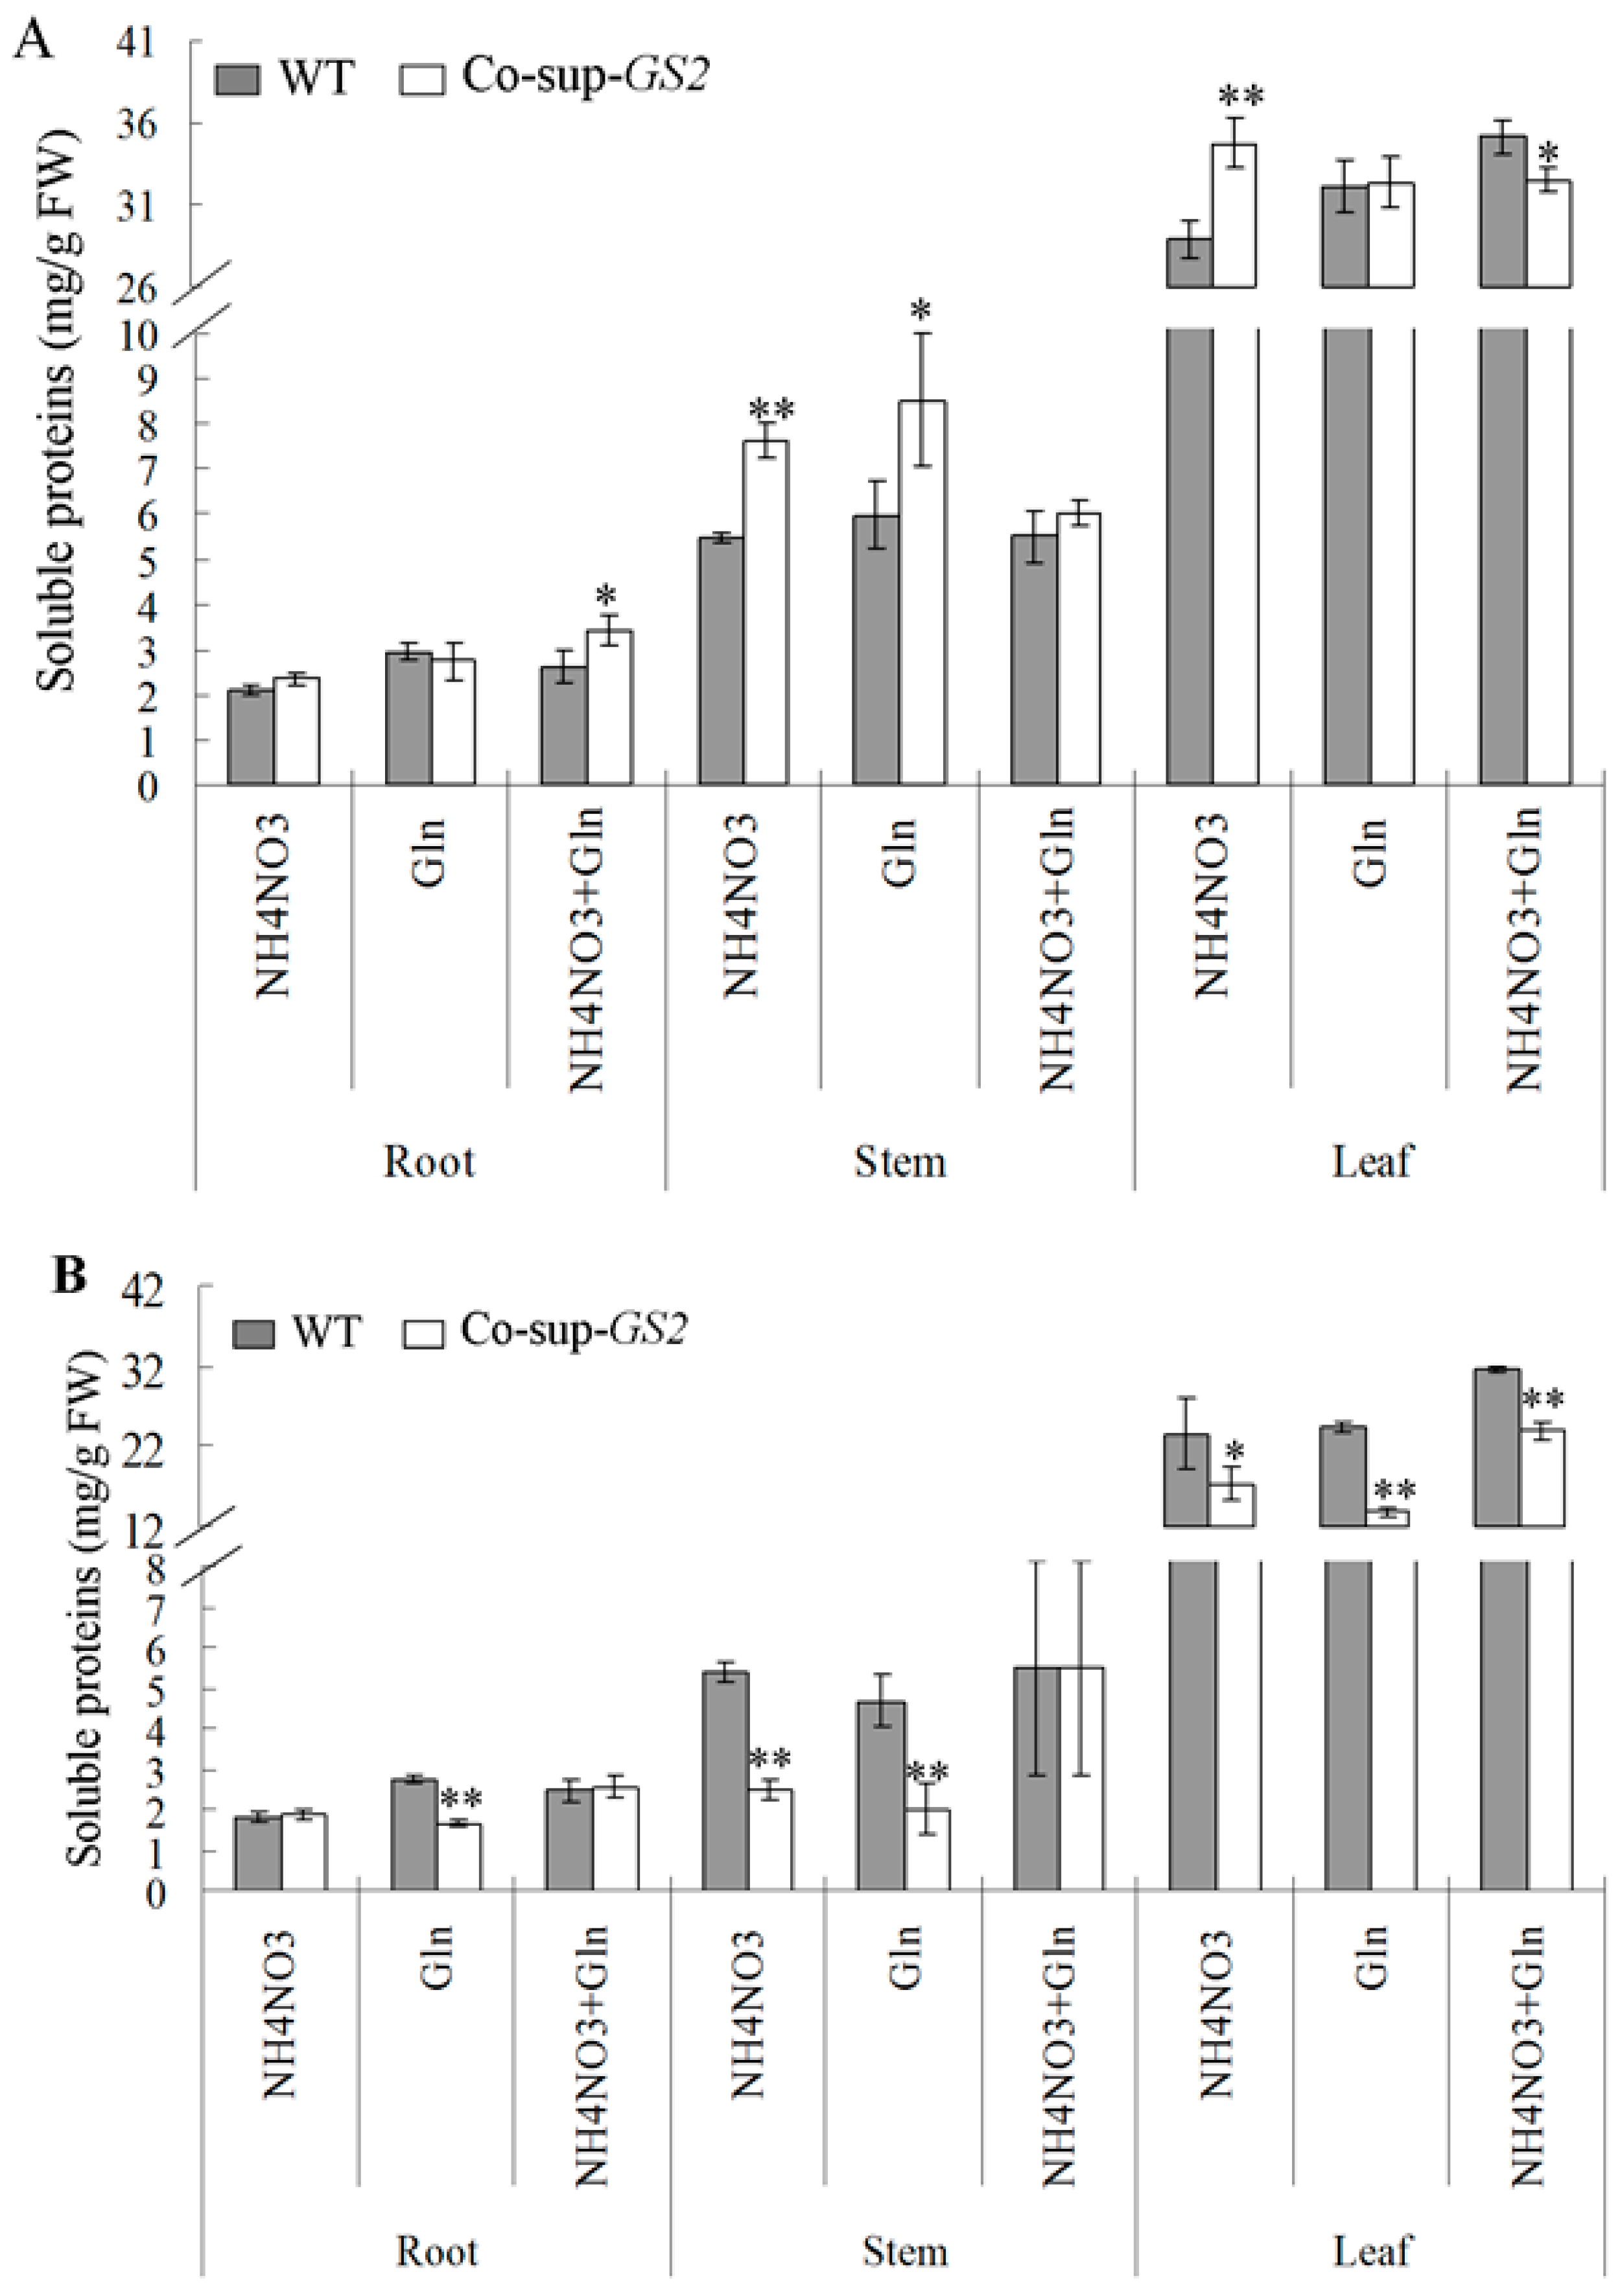
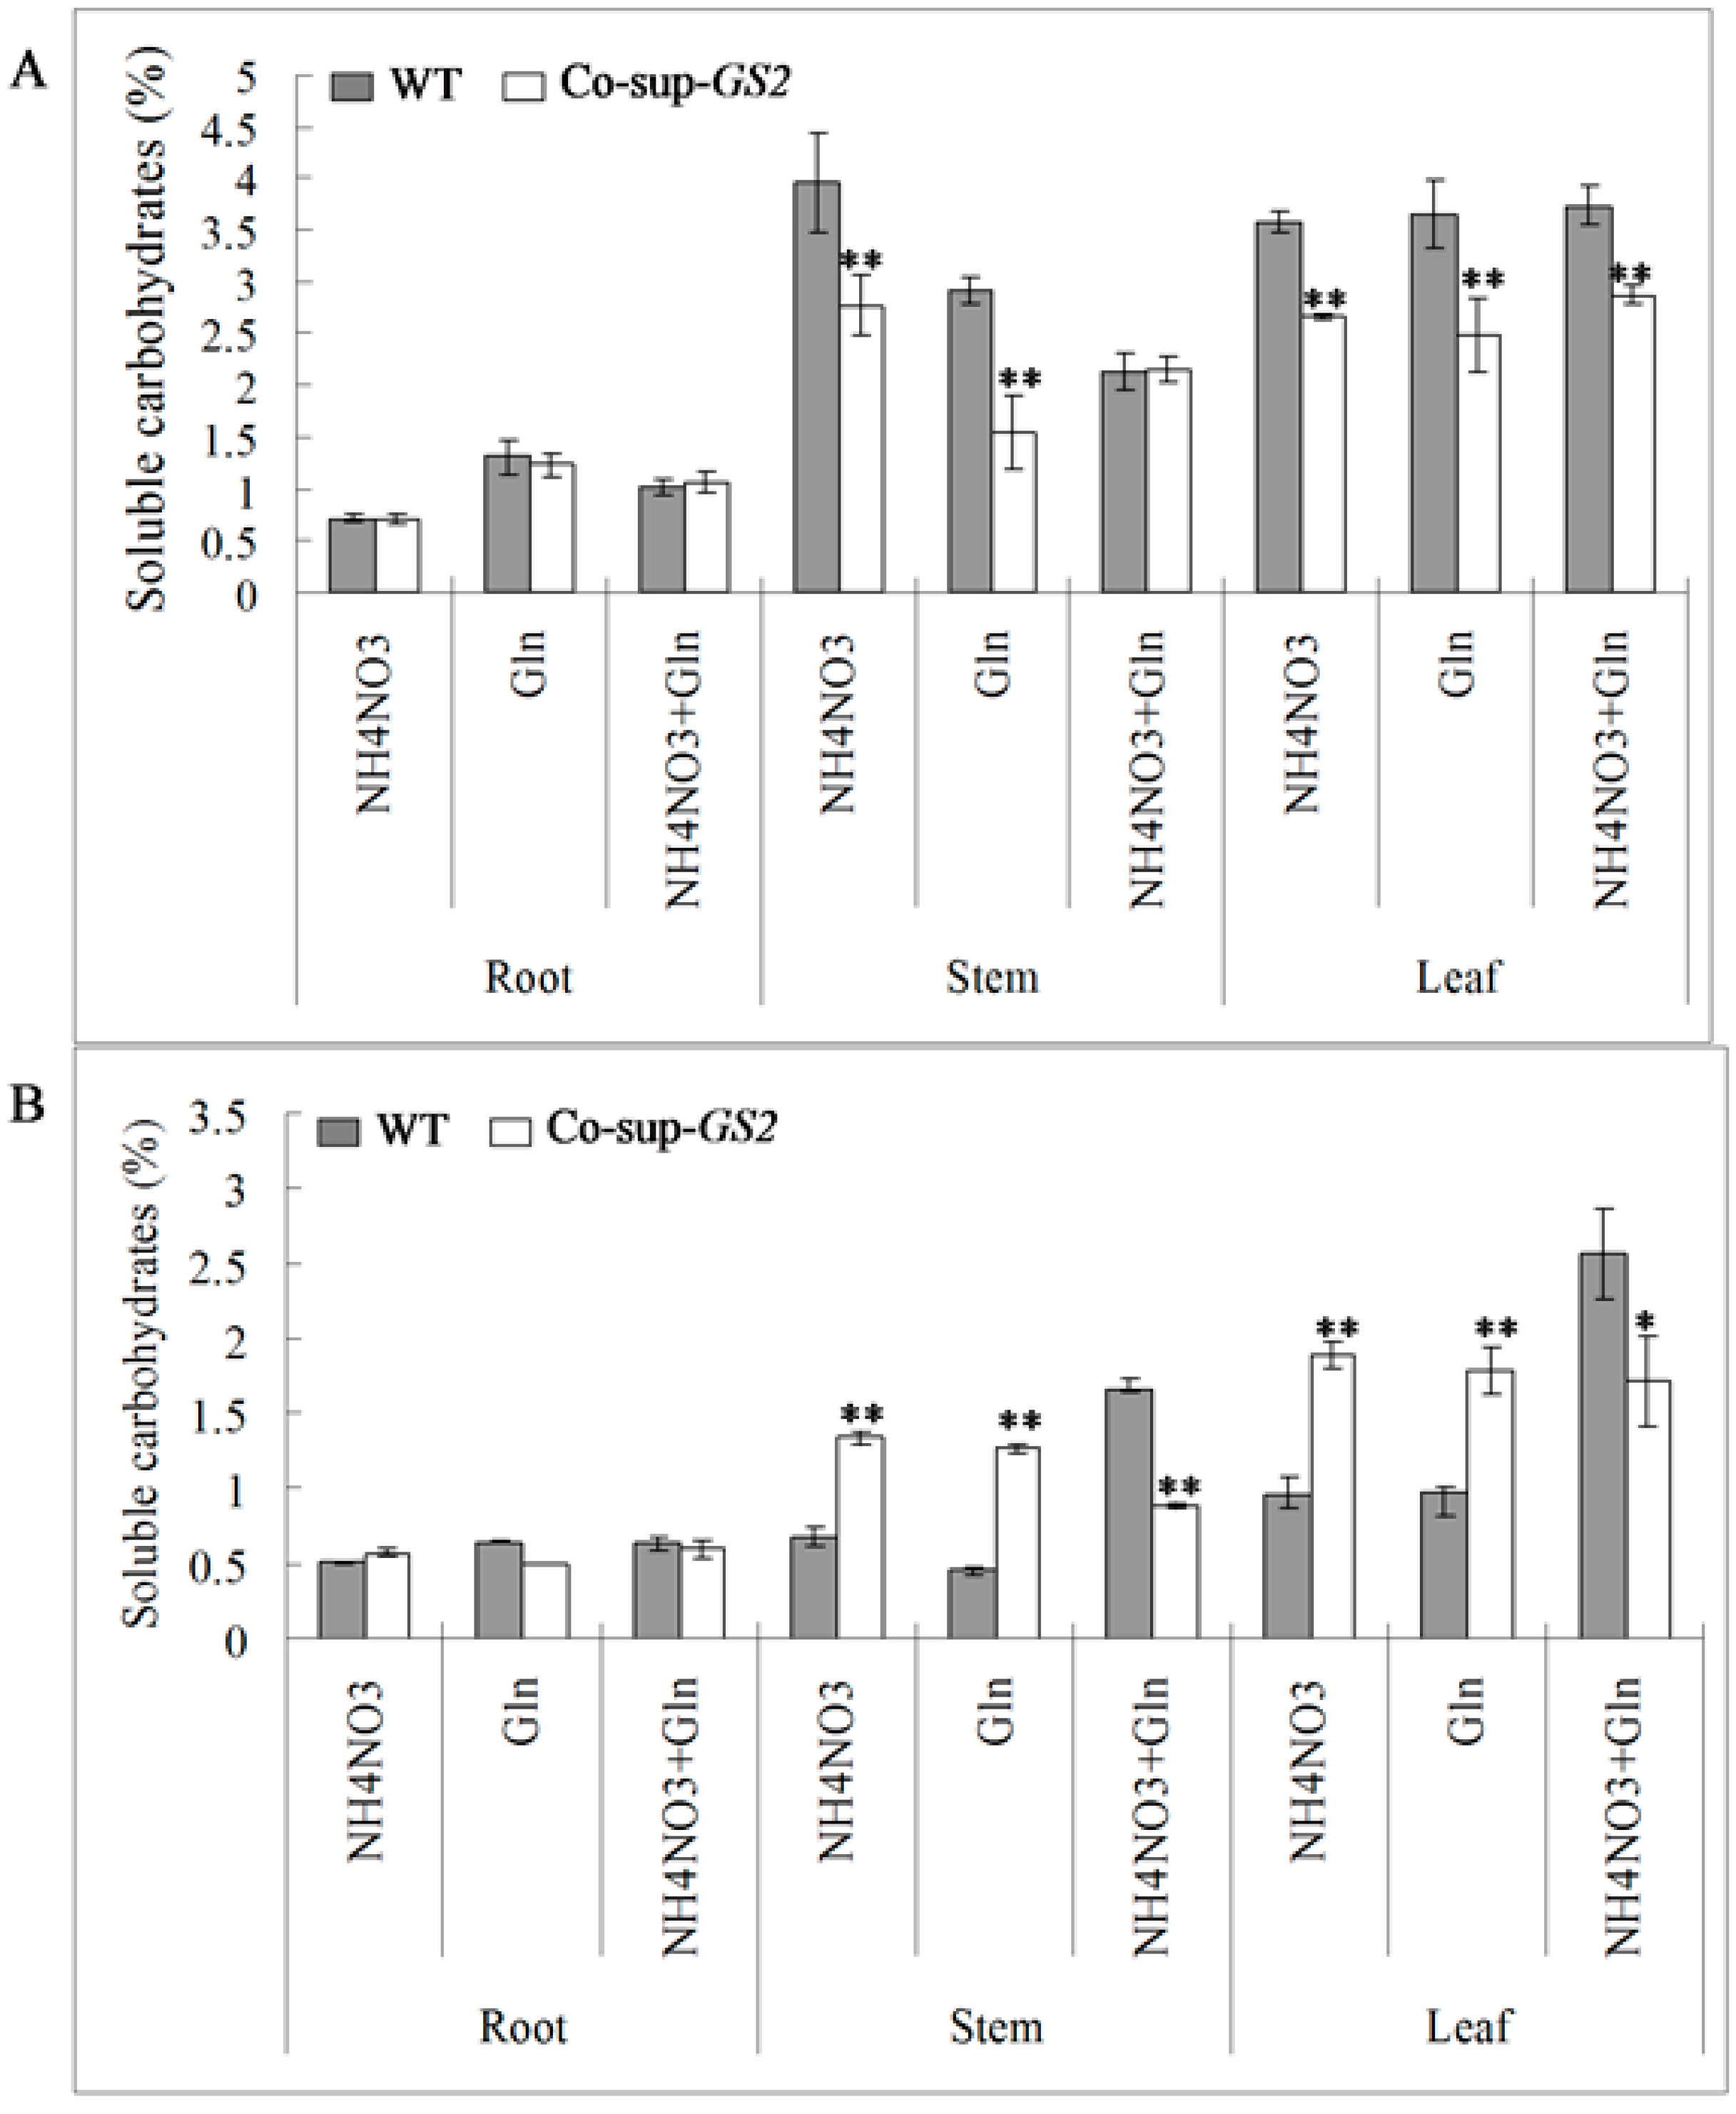
2.3. Soluble Proteins and Carbohydrates Determination in the GS2-Cosuppressed Plants

To evaluate the differences in the carbon and nitrogen metabolic status between the GS2-cosuppressed plants and the wild-type plants, we determined the concentrations of total soluble proteins and soluble carbohydrates in the roots, stems and leaves of GS2-cosuppressed plants and wild-type plants under N, G and N + G growth conditions at the seedling and tillering stages. The results showed that there was a higher concentration of soluble proteins in the GS2-cosuppressed plants at the seedling stage, while there was a lower concentration of soluble proteins in the GS2-cosuppressed plants at the tillering stage compared to the wild-type plants (Figure 3). For example, at the seedling stage, compared to the wild-type plants, there was a 30.5% increase in the root soluble proteins in the GS2-cosuppressed plants under N + G conditions; there were 39.0% and 42.4% increases in soluble proteins in the stems under N and G conditions, respectively; and there was a 20.2% increase in the soluble proteins in the leaves under the N condition (Figure 3A). At the tillering stage, compared to the wild-type plants, there was a 39.8% decrease in the root soluble proteins of the GS2-cosuppressed plants under the G condition; there were 53.6% and 56.9% decreases in the soluble proteins in the stems under the N and G conditions, respectively; and there were 26.4%, 43.0% and 24.1% decreases in the soluble proteins in the leaves under the N, G and N + G conditions, respectively (Figure 3B).
In contrast, there was a lower concentration of soluble carbohydrates in the GS2-cosuppressed plants at the seedling stage, while there was a higher concentration of soluble carbohydrates in the GS2-cosuppressed plants at the tillering stage when compared to the wild-type plants (Figure 4). For example, at the seedling stage, compared to the wild-type plants, there were 30.0% and 46.7% decreases in the stem soluble carbohydrates of GS2-cosuppressed plants under the N and G conditions, respectively; and there were 25.7%, 31.8% and 23.2% decreases in soluble carbohydrates in the leaves under the N, G and N + G conditions, respectively; (Figure 4A). At the tillering stage, compared to the wild-type plants, there were 99.9% and 178.0% increases in the soluble carbohydrates in the stem, and there were 98.3% and 84.6% increases in the soluble carbohydrates in the leaves of GS2-cosuppressed plants under the N and G conditions, respectively (Figure 4B). These results suggested that the altered GS2 expression level (higher GS2 expression level at the seedling stage and lower GS2 expression level at the tillering stage) affected the carbon and nitrogen metabolic status. There was an imbalance between the soluble protein and carbohydrate concentrations in the GS2-cosuppressed plants, especially in the stems and leaves.
Figure 3. The concentration of soluble proteins in the roots, stems and uppermost leaves of GS2-cosuppressed plants (Co-sup-GS2) and wild-type plants (WT) at the seedling stage (A) and the tillering stage (B) under N (NH4NO3), G (Gln) and N + G (NH4NO3 + Gln) conditions. Values are the mean ± SD from three biological replicated plant materials. *, ** Significant differences at the level of p = 0.05 and p = 0.01, respectively.
Ijms 16 12713 g003
Figure 4. The concentration of soluble carbohydrates in the roots, stems and uppermost leaves of GS2-cosuppressed plants (Co-sup-GS2) and wild-type plants (WT) at the seedling stage (A) and the tillering stage (B) under N (NH4NO3), G (Gln) and N + G (NH4NO3 + Gln) conditions. Values are the mean ± SD from three biological replicated plant materials. *, ** Significant differences at the level of p = 0.05 and p = 0.01, respectively.
Ijms 16 12713 g004

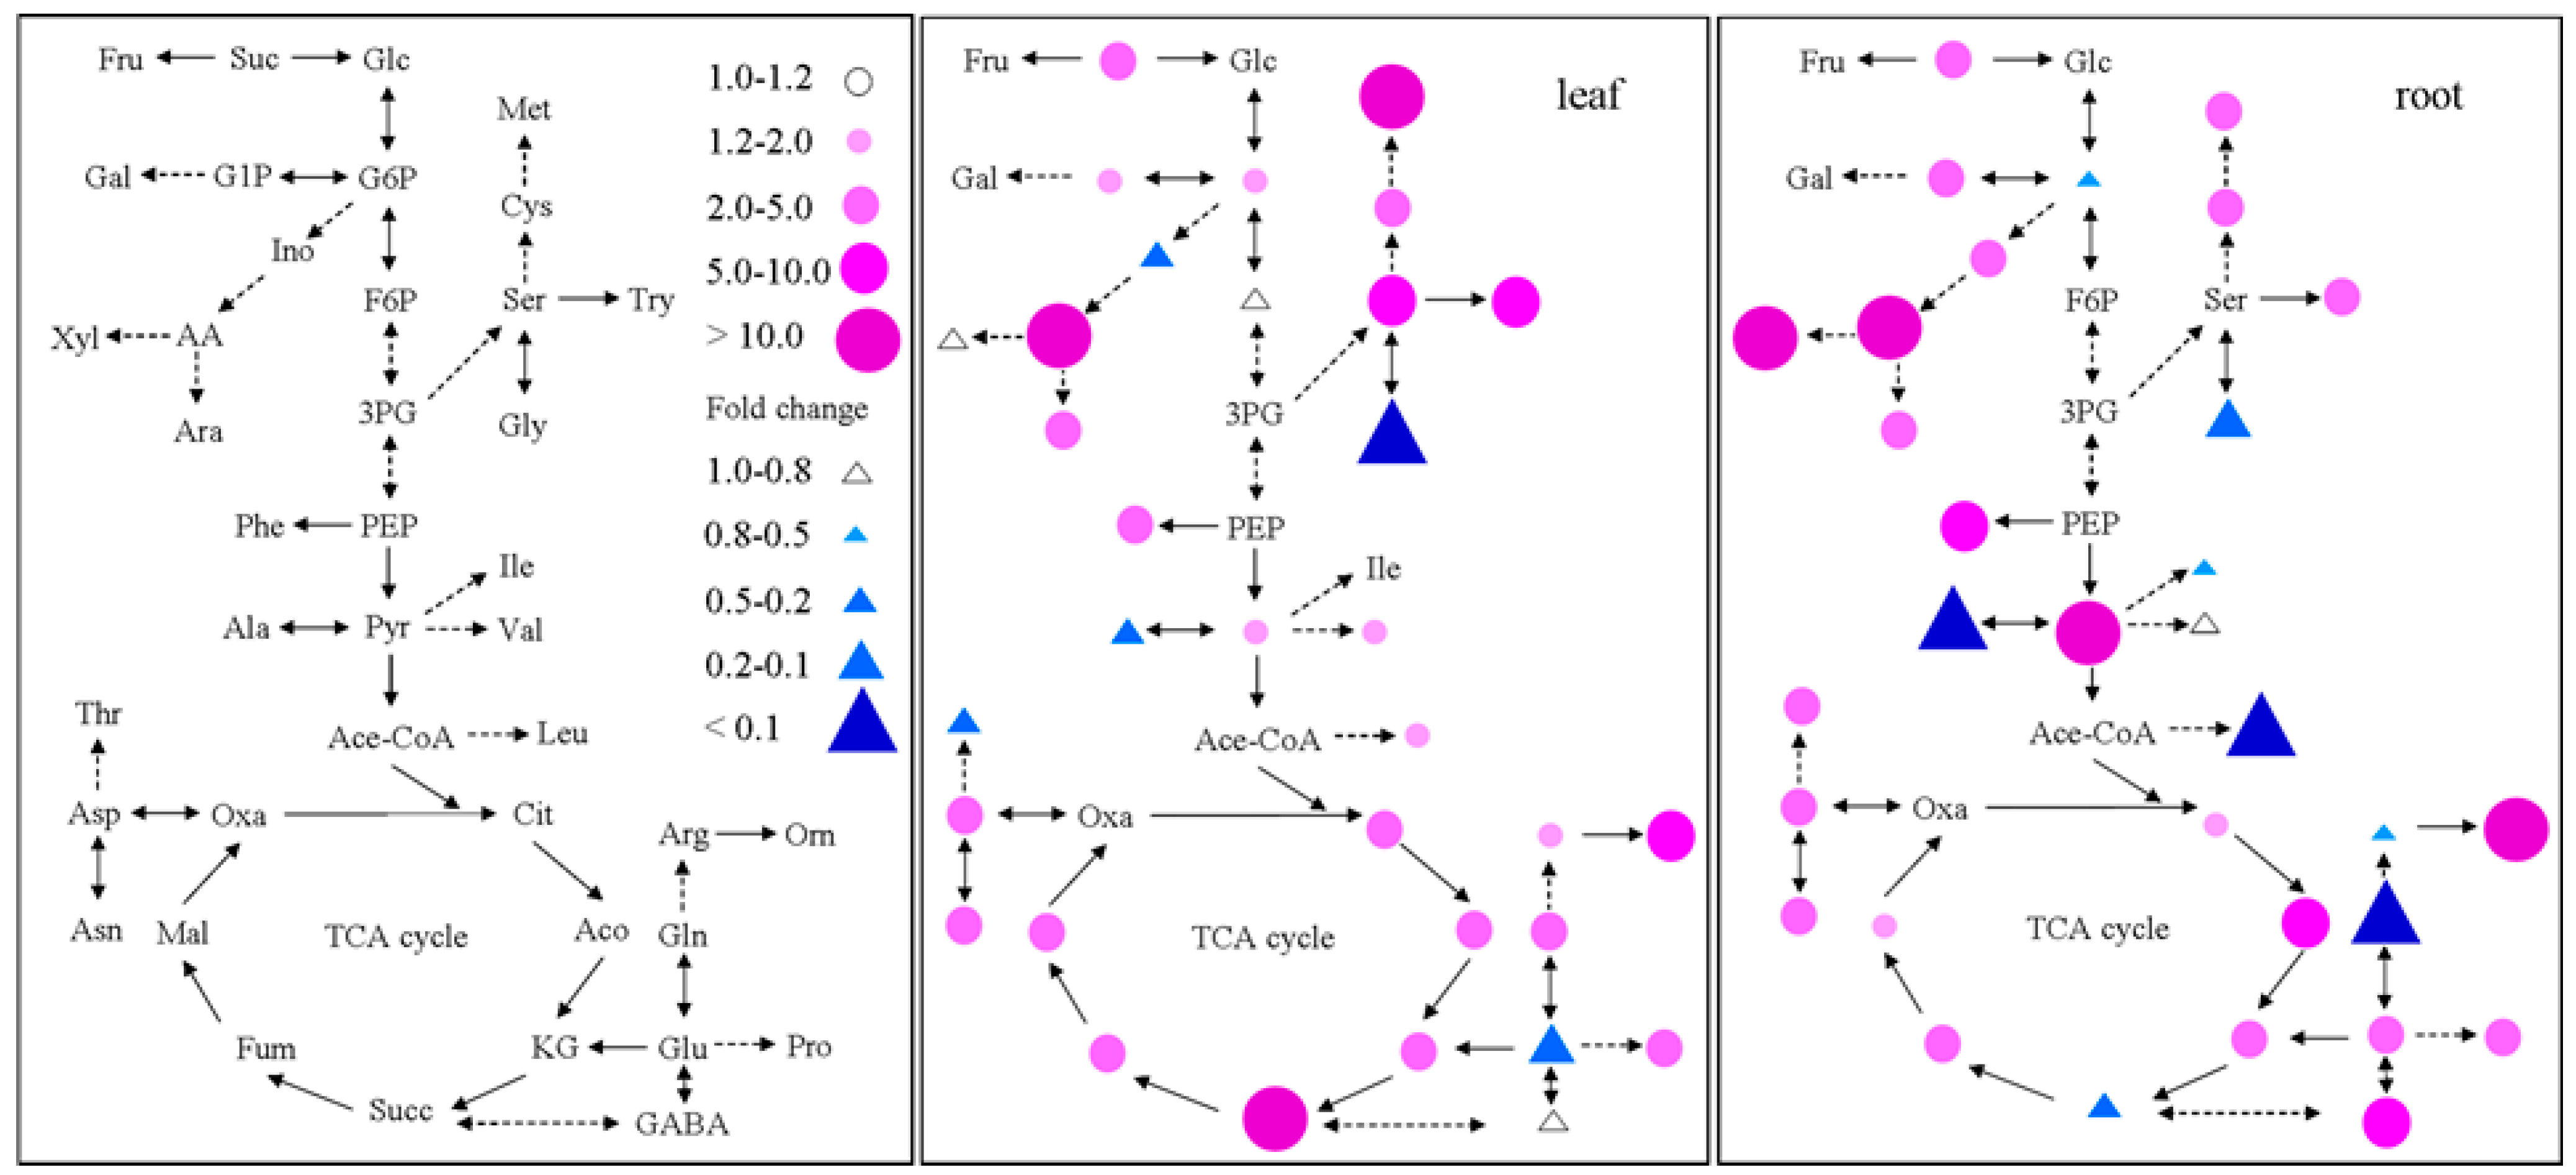
2.4. Metabolite Profiling Analysis in GS2-Cosuppressed Plants

To study the individual metabolites involved in the carbon and nitrogen metabolic pathway in detail, we analyzed the sugars, organic acids and free amino acids in the root and leaf tissues of GS2-cosuppressed plants and wild-type plants at the tillering stage under different N conditions. Figure 5 and Supplementary Figure S1 display the fold change corresponding to the ratio of GS2-cosuppressed plants/wild-type plants, calculated using the concentrations of these individual metabolites. Dramatic increases in the sugars, organic acids and free amino acids were observed in both the leaf and root tissues of the GS2-cosuppressed plants compared to the wild-type plants, especially for ascorbic acid (>37.7-fold), succinate (>312.4-fold) and methionine (>410.3-fold) in the leaf and xylitol (>46.3-fold), ascorbic acid (>14.2-fold), pyruvate (>808.1-fold) and ornithine (>19.9-fold) in the root (Figure 5; Supplementary Figure S1). Meanwhile, several metabolites had dramatically decreased concentrations, including glutaric acid (<0.10-fold) and glycine (<0.07-fold) in the leaf and glutamine (<0.04-fold), alanine (<0.004-fold) and leucine (<0.0006-fold) in the root (Figure 5; Supplementary Figure S1). However, the concentrations of total sugars, total organic acids and total free amino acids increased only slightly, a fold change ranging from 2.0–3.7 (data not shown here).
Figure 5. The fold change corresponds to the ratio of the concentration of individual metabolites involved in carbon and nitrogen metabolism in the GS2-cosuppressed plants relative to the wild-type plants for the uppermost leaves and roots at the tillering stage under N condition. Red dots indicate increased metabolites, and blue triangles indicate decreased metabolites. Glc, glucose; Suc, sucrose; Fru, fructose; F6P, frutose-6-P; G6P, glucose-6-P; G1P, glucose-1-P; Gal, galactose; Ino, inositol; AA, ascorbic acid; Ara, arabinose; Xyl, xylitol; 3PG, 3-P-glycerate; PEP, phosphoenolpyruvate; Pyr, pyruvate; Ace-CoA, acetyl-CoA; Cit, citrate; Aco, aconitase; KG, ketoglutarate; Succ, succinate; Fum, fumarate; Mal, malate; Oxa, oxaloacetate; Glu, glutamate; Gln, glutamine; Arg, arginine; Pro, proline; Orn, ornithine; GABA, aminobutyric; Asp, aspartate; Asn, asparagine; Ile, isoleucine; Met, methionine; Thr, threonine; Ala, alanine; Val, valine; Leu, leucine; Phe, phenylalanine; Try, tryptophan; Ser, serine; Gly, glycine; Cys, cysteine.
Ijms 16 12713 g005

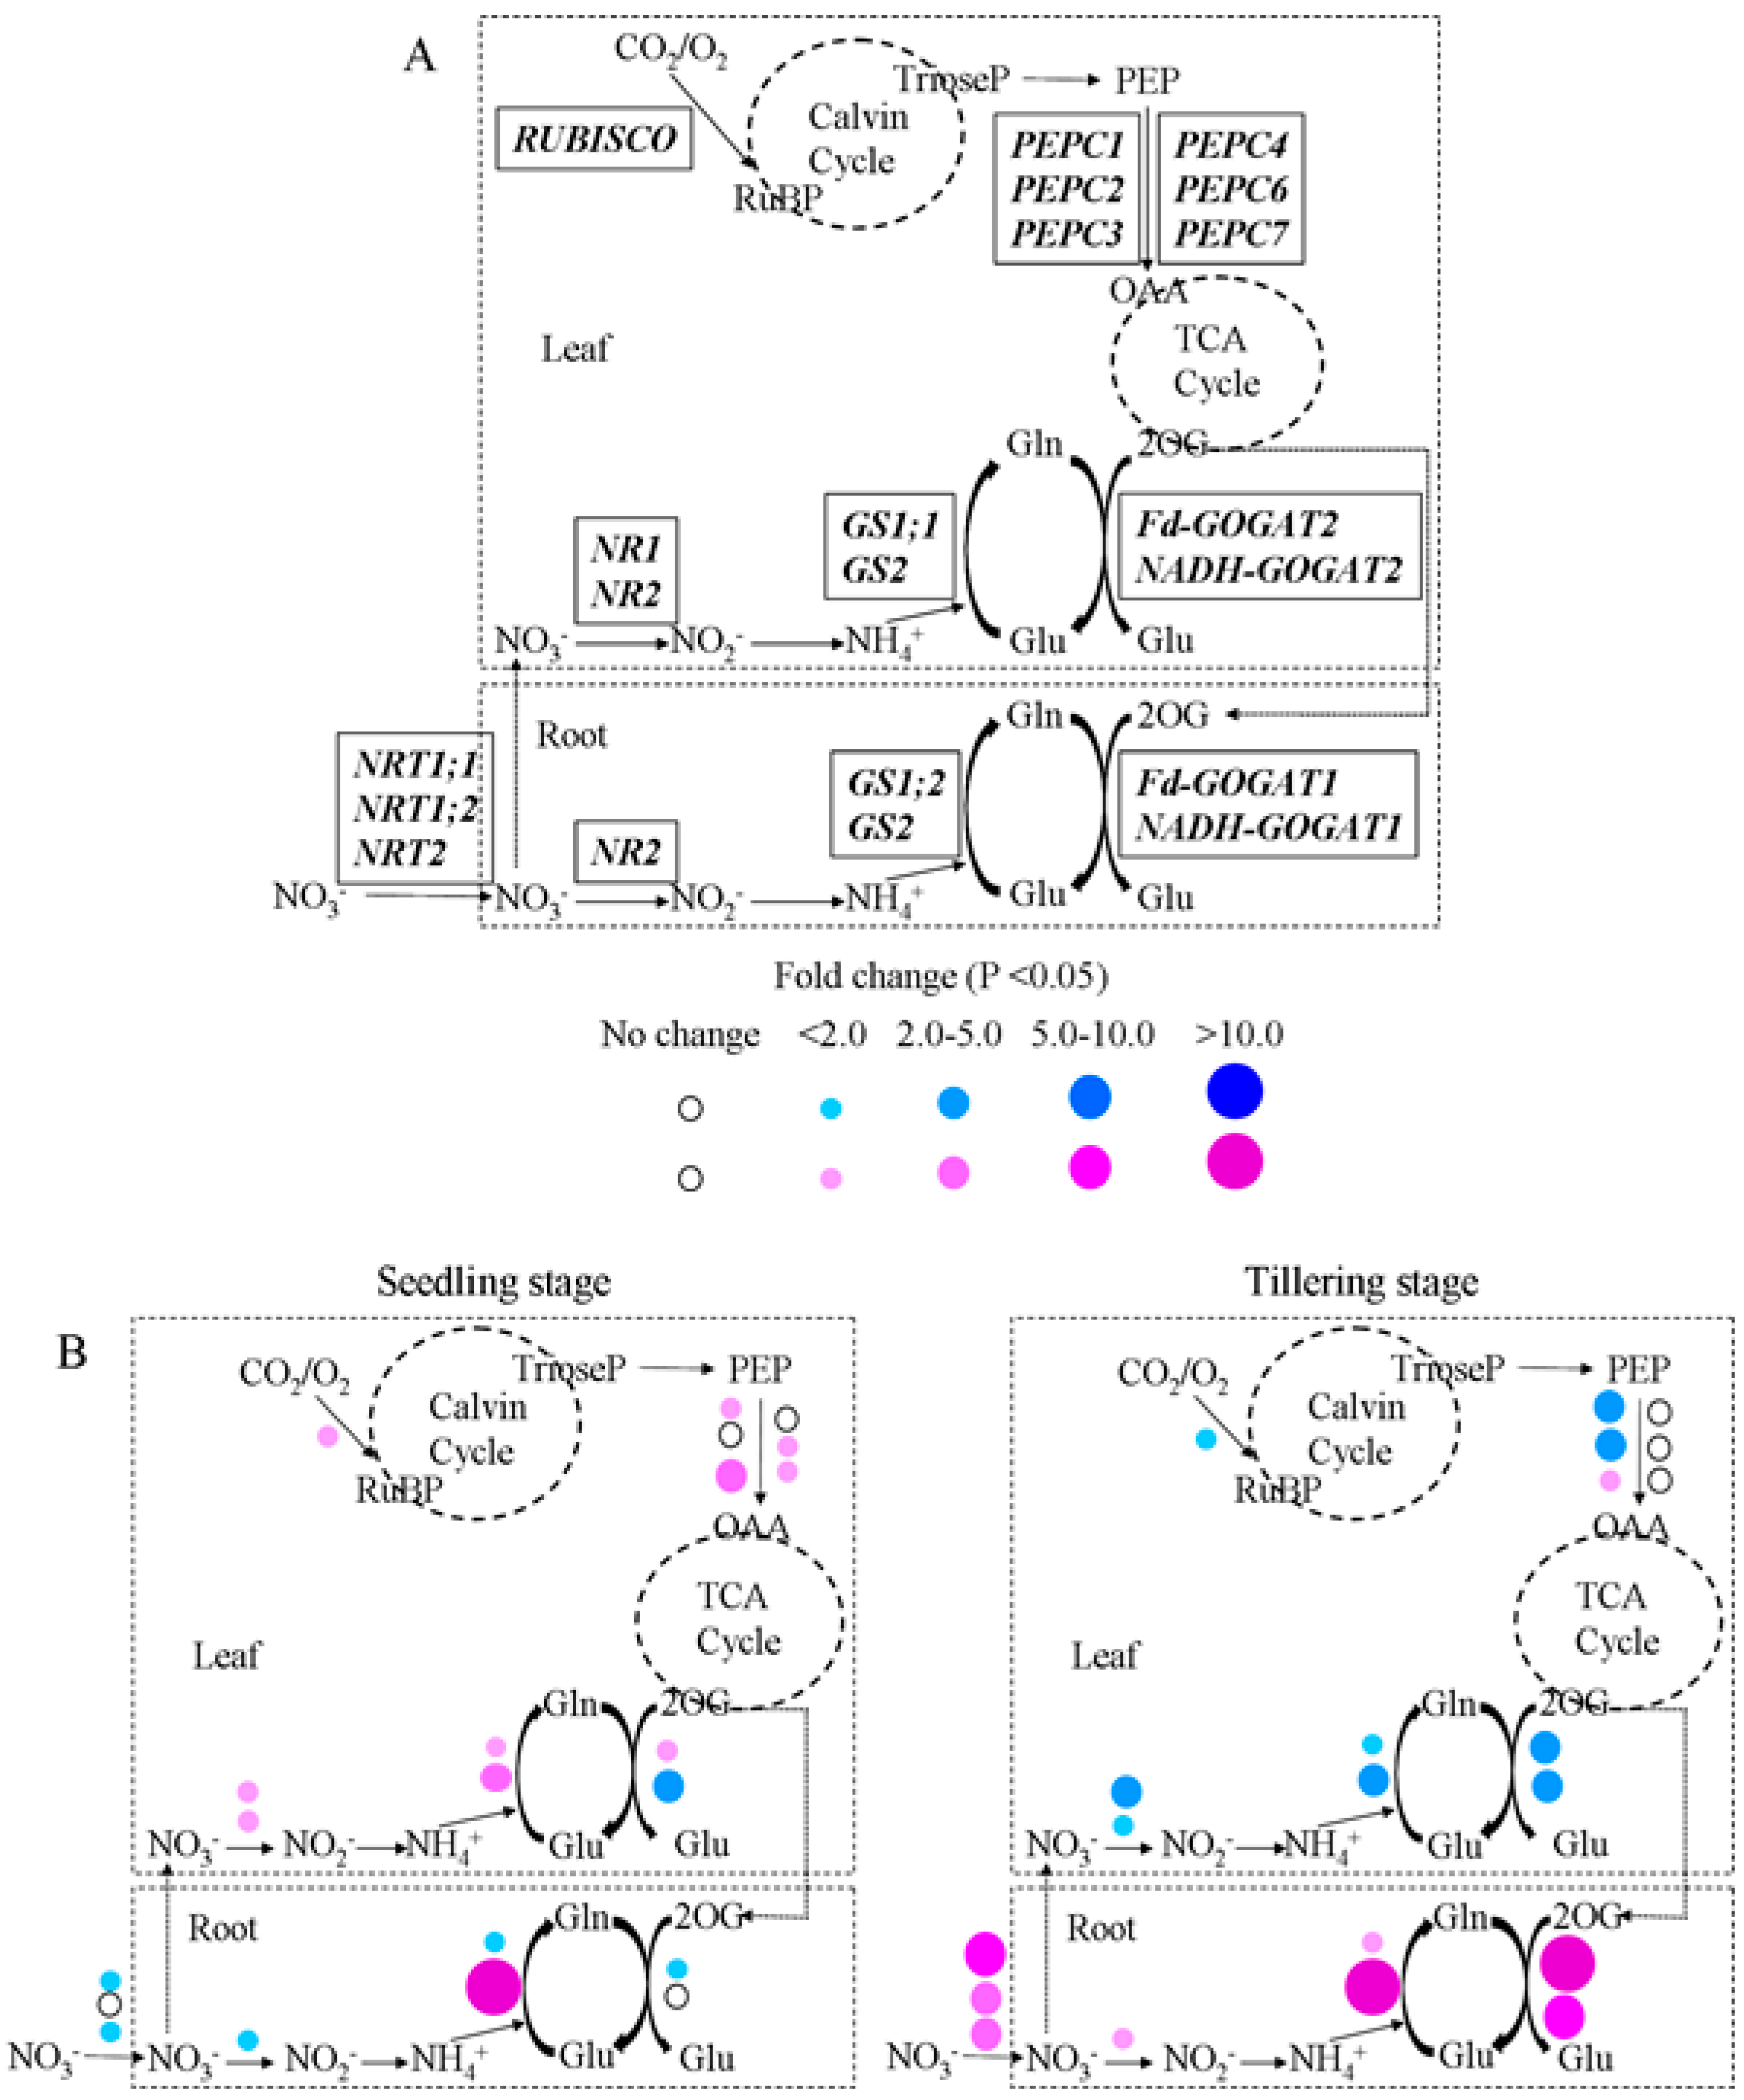
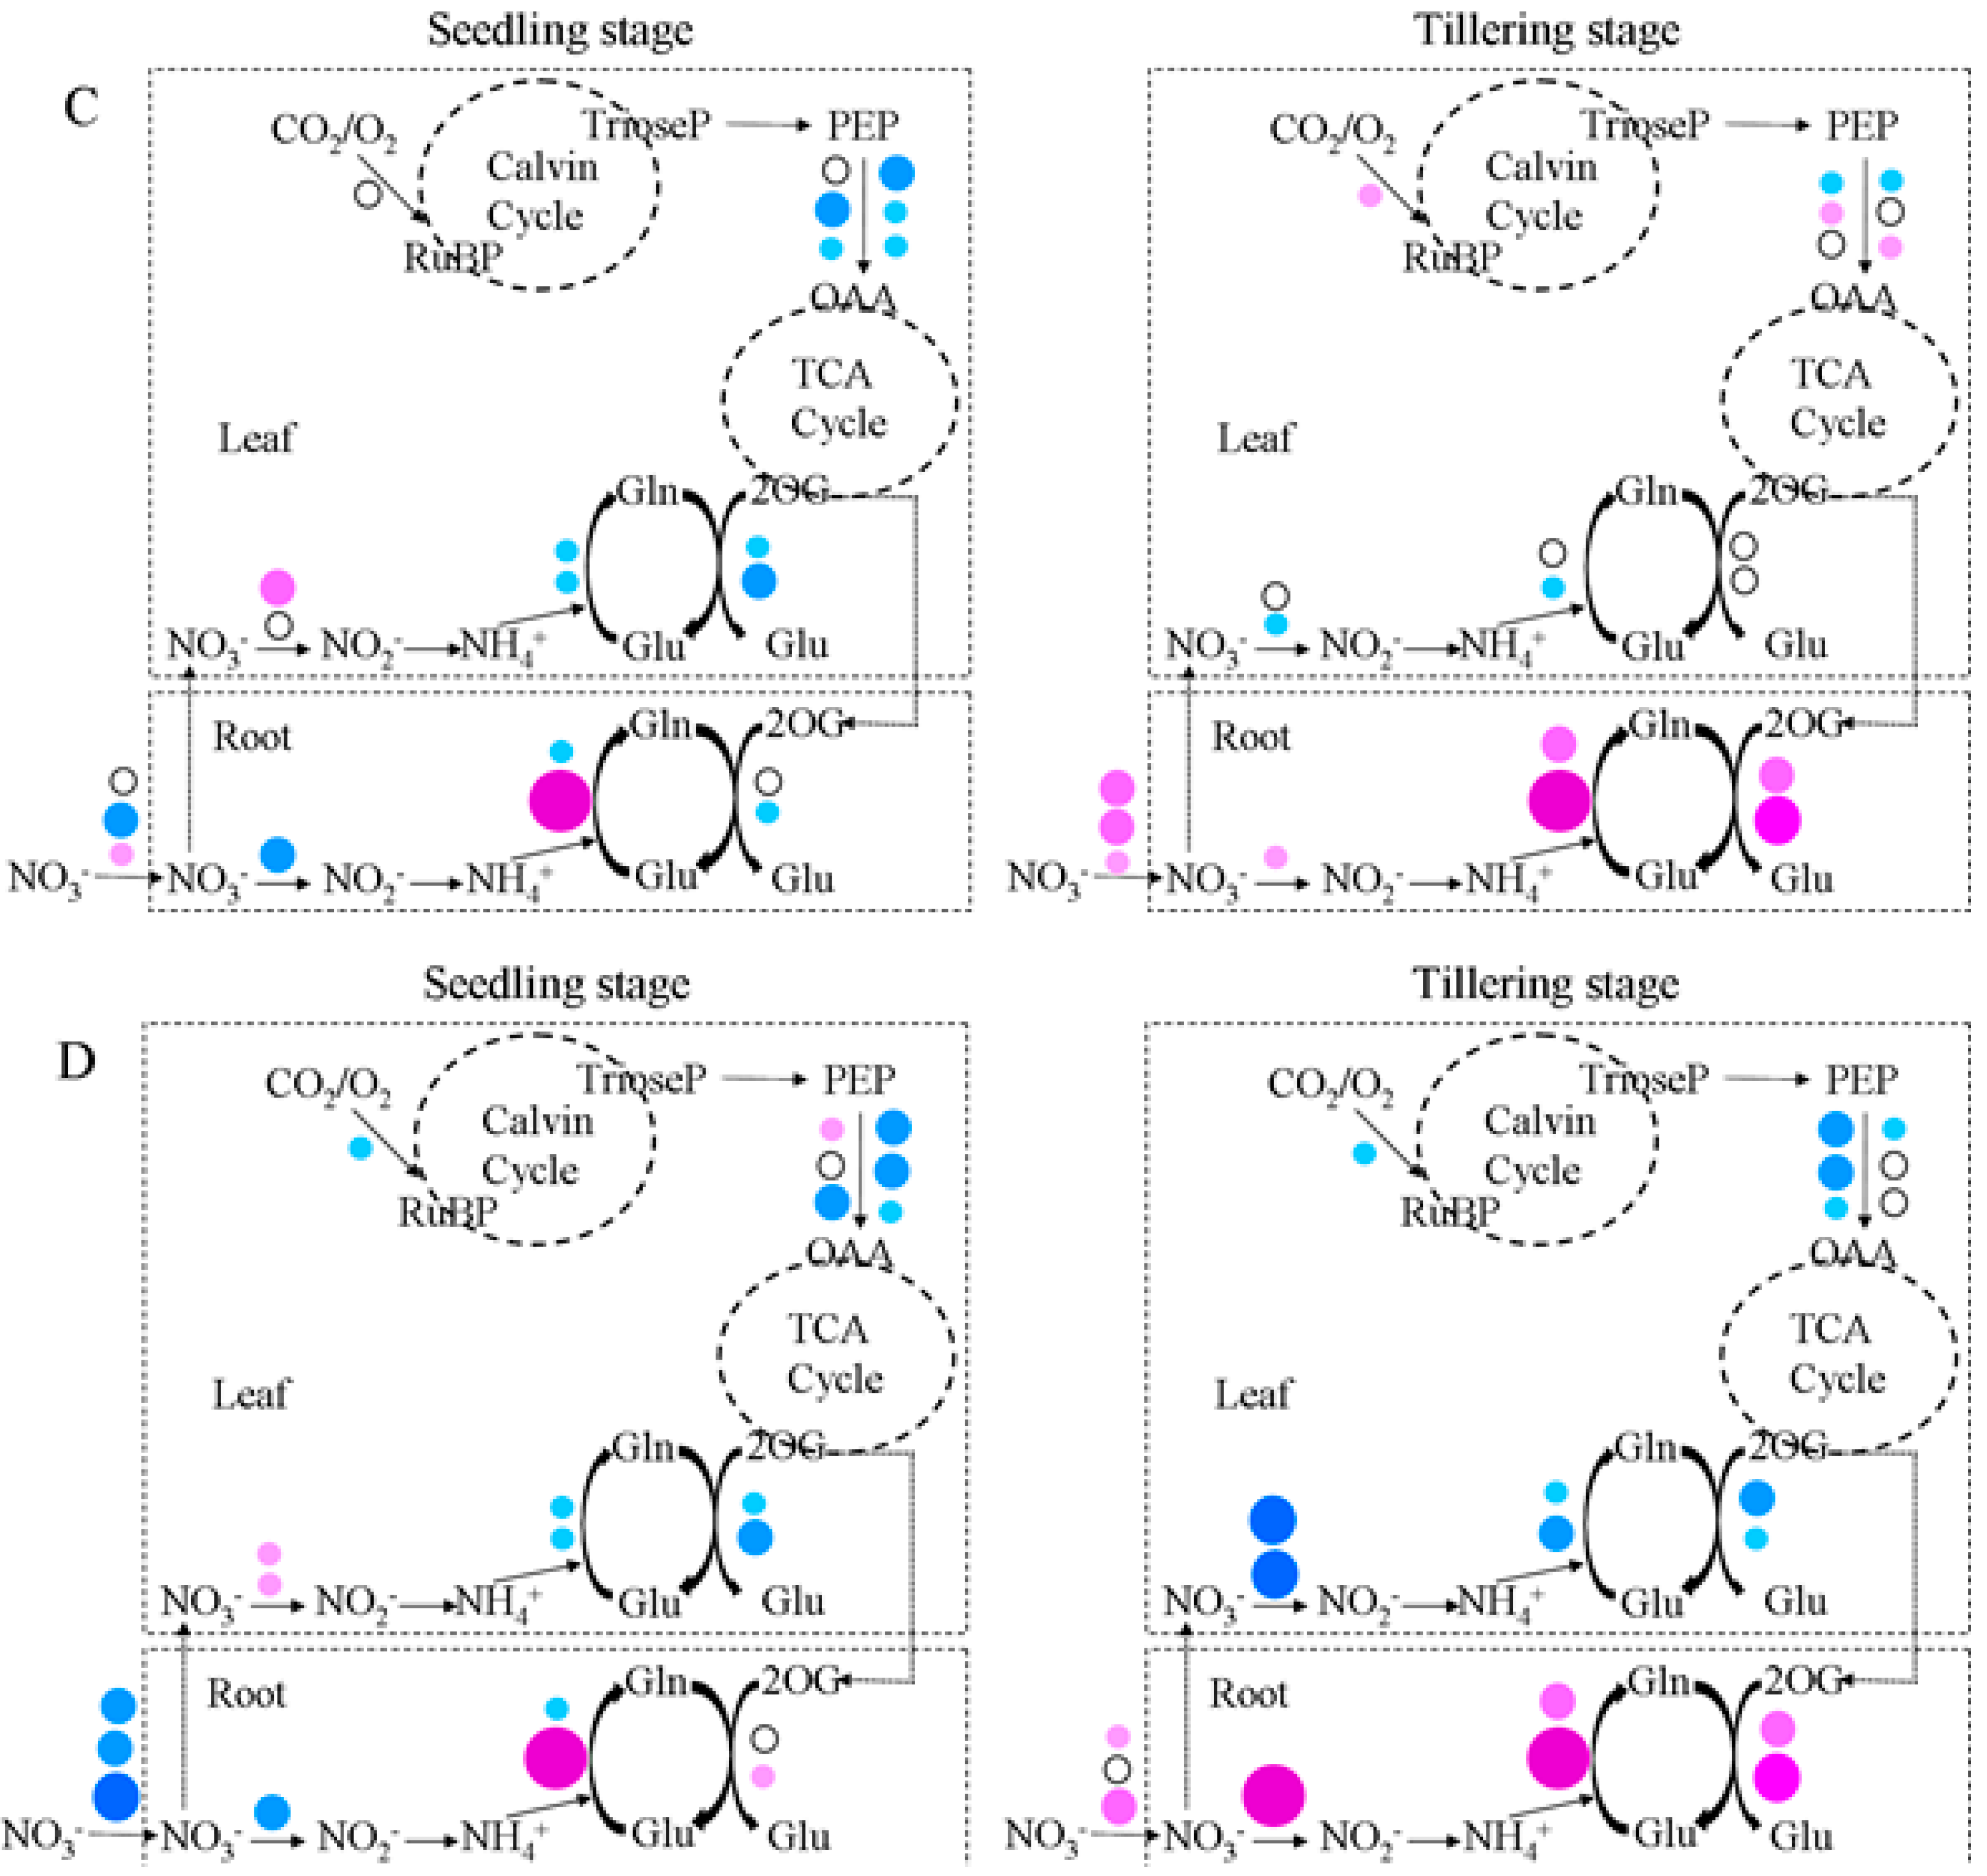
2.5. Gene Expression Analysis in GS2-Cosuppressed Plants

To determine the impact of the reduced GS2 mRNA transcriptional level on the carbon-nitrogen metabolic genes’ expression patterns, we analyzed the expression level of genes encoding NRT (nitrate transporter), NR (nitrate reductase), GS (glutamine synthetase), GOGAT (glutamate synthase), RUBISCO (ribulose-1,5-bisphosphate carboxylase/oxygenase) and PEPC (phosphoenolpyruvate carboxylase) by q-RT PCR. Figure 6A displays these genes in the carbon and nitrogen metabolic pathway in rice plants. Supplementary Table S1 lists the fold change corresponding to the ratio of the gene expression level in GS2-cosuppressed plants relative to wild-type plants in the roots and leaves at both the seedling and tillering stage under N, G and N + G conditions. The results showed that the expression levels of most genes were changed in the GS2-cosuppressed plants. Compared to the wild-type plants, the significantly (p < 0.01) higher GS2 expression levels (35.06–537.49-fold) were observed in the roots of GS2-cosuppressed plants at both the seedling stage and the tillering stage under N, G and N + G conditions (Supplementary Table S1). However, significantly (p < 0.05) lower GS2 expression levels (0.43–0.79-fold) were observed in the leaves of GS2-cosuppressed plants at both the seedling stage and the tillering stage under the N, G and N + G conditions, except a higher GS2 expression level (2.35-fold) was observed in the leaves at the seedling stage under the N condition (Supplementary Table S1). Furthermore, different gene expression patterns were exhibited in the GS2-cosuppressed plants between the seedling stage and tillering stage. Additionally, opposite gene expression patterns were shown between the root and leaf tissues, particularly at the tillering stage. For example, the expression levels of the NRT1;1, NRT1;2, NRT2, NR2, GS1;2, Fd-GOGAT1 and NADH-GOGAT1 genes were significantly (p < 0.05) increased in the roots, while the expression levels of the NR1, NR2, GS1;1, GS2, Fd-GOGAT2, NADH-GOGAT2, RUBISCO, PEPC1 and PEPC2 genes were significantly (p < 0.05) decreased in the leaves under the N condition (Figure 6).
Figure 6. The fold change corresponds to the ratio of the gene expression level in the GS2-cosuppressed plants relative to the wild-type plants. (A) Diagrammatic representation of the key genes involved in the carbon and nitrogen metabolic pathway in rice plants. NRT, nitrate transporter; NR, nitrate reductase; GS, glutamine synthetase; GOGAT, glutamate synthase; RUBISCO, ribulose-1,5-bisphosphate carboxylase/oxygenase; PEPC, phosphoenolpyruvate carboxylase. Prominent changes in the gene expression level in the GS2-cosuppressed plants compared to wild-type plants at the seedling stage and tillering stage under N (B), G (C) and N + G (D) conditions. Red and blue dots indicate up- and down-regulated genes, respectively.
Ijms 16 12713 g006aIjms 16 12713 g006b

3. Discussion

3.1. The Carbon-Nitrogen Metabolic Imbalance Is One of the Possible Reasons for the Chlorosis Phenotype in the GS2-Cosuppressed Plants

C and N are the essential elements for plant routine and fundamental growth and development. The optimal functioning and coordination of the C and N metabolism plays a very important role in plant growth and production [5,7,8,10]. Maintaining an appropriate balance or ratio of C and N nutrients is critical to sustain the optimal plant growth and development [5,8,10]. Because C and N resources change along with the environment, plants have developed a highly complex and sophisticated regulation system to adjust C and N uptake, transport and assimilation [10,37,38,39,40]. Schlüter et al. reported that the C, N and phosphorus balance played an important role in the stress adaptation of maize source leaf [41]. In the present study, our results showed an altered carbon and nitrogen metabolism in GS2 transgenic plants. There were significant (p < 0.05) decreases of the carbon/nitrogen ratio in the stem tissue of GS2-cosuppressed plants. Furthermore, the opposite results between soluble protein and carbohydrate concentrations in the GS2-cosuppressed plants at both the seedling and the tillering stage indicated that the altered GS2 expression level affected the carbon and nitrogen metabolic status. This type of carbon-nitrogen metabolic imbalance may be one of the reasons for the chlorosis phenotype of the GS2-cosuppressed plants. Early studies reported similar results that the C/N ratio, rather than the carbohydrate status alone, played the major role in the fresh weight, cotyledon size, chlorophyll and anthocyanin content in Arabidopsis [9]. Bao et al. reported that an imbalance of C-N metabolic status may cause the poor growth and yield in the GS1;1- and GS1;2-overexprssing transgenic rice [42]. Kusano et al. also reported that the rice OsGS1;1 mutant showed an imbalance in tricarboxylic acid cycle metabolites, amino acids and sugars [43]. Additionally, variations in the leaf SPAD value, photosynthetic parameters, individual sugars, amino acids, organic acids and gene expression levels were observed in GS2-cosuppressed plants when compared to the wild-type plants in this study. Pérez-Delgado et al. also reported that the mutant plants lacking the plastidic isoform of Gln synthetase in Lotus japonicas accumulated high levels of several amino acids and organic acids, including intermediates of the Krebs cycle under photorespiratory active conditions [44].

3.2. The Incoordination between the Root and Leaf Tissues Is Another Possible Reason for the Chlorosis Phenotype in GS2-Cosuppressed Plants

In higher plants, a complex picture is emerging in which C/N signaling networks are subject to a “matrix effect” in which certain functions or interactions only occur under situations that are specific to a species, cell-type, developmental stage, metabolic status or environmental condition [8]. In addition to maintaining the carbon-nitrogen balance in the same organ and/or tissue, the tight coordination involves the sensing and signaling of the carbon/nitrogen balance between the source and sink tissues [5,8]. The NO3 and/or NH4+ are usually taken up by the root system and transported to the leaves for the inorganic nitrogen assimilation, while carbon metabolism primarily occurs in the leaves to provide both the carbon skeletons and energies for nitrogen assimilation [5,8]. Therefore, plants must develop a mechanism to sense the status of the nitrogen in the root system and the surrounding soil environment and coordinate with the sensory machinery in the leaves, where the photosynthetic output will be determined [5,8]. In this study, compared to the wild-type plants, the total nitrogen content of GS2-cosuppressed plants showed no significant difference in the root, while significantly increased in the stem and decreased in the leaf. This suggested that GS2-cosuppressed plants had similar capacities for nitrogen uptake from the environment and nitrogen export from the root to the stem, and they had poor nitrogen transport ability from the stem to the leaf, which led to dramatic nitrogen accumulation in the stem. Furthermore, the expression pattern of the GS2 gene and other key genes involved in carbon and nitrogen metabolism was inconsistent between the root and leaf in the GS2-cosuppressed plants. These results showed an incoordination between the root and leaf tissues in GS2-cosuppressed plants. We hypothesized that this may be another reason for the chlorosis phenotype of the GS2-cosuppressed plants.

3.3. The Impact of Gln on Plant Growth and Carbon-Nitrogen Metabolism

Plants can capture nitrogen in a variety of different chemical forms, ranging from inorganic forms, such as NO3 and NH4+, to as many as 20 different amino acids [45,46,47,48,49,50,51]. The uptake rates for amino acids are considerably lower compared to inorganic forms of nitrogen [45,47,48,51]. In general, it appears that plants can use most of the amino acids as a source of nitrogen, which depress plant growth relative to mineral sources of nitrogen [45,52]. Only a minority of amino acids can occasionally increase plant growth [50,52] or at least match plant growth on mineral forms of nitrogen [53]. In our study, we analyzed the growth phenotype, carbon-nitrogen metabolic status and gene expression profile of GS2-cosuppressed rice and wild-type plants under three different nitrogen conditions (N, G and N + G). Results showed that both the GS2-cosuppressed rice and wild-type plants could grow under Gln as the nitrogen source. However, Gln depressed the plant growth, particularly the root length and root dry weight. When compared to the N condition, the leaf SPAD value, total carbon or nitrogen content increased, while the leaf stomatal conductance, intercellular CO2 concentration, transpiration rate and carbon/nitrogen ratio decreased under the G or N + G conditions. Additionally, Gln affected the gene expression patterns, particularly at the seedling stage. Similar results have been reported showing that, while plants generally have the capacity to take up many amino acids, these often negatively interfere with biomass production and even inhibit growth [54]. The model plant Arabidopsis has the capacity to acquire and utilize a number of amino acids for growth, including the amide glutamine (Gln) [48]. When grown with amino acids as the sole nitrogen source, Arabidopsis thaliana was only capable of achieving between 1% and 50% of its potential vegetative growth on an identical concentration of nitrate [48]. Results indicated that plants would be capable of growing when fed Gln, but Gln would contribute relatively little to plant growth compared to inorganic nitrogen sources of NO3 and NH4+.

4. Experimental Section

4.1. Plant Materials and Growth Conditions

Seeds of the GS2-cosuppressed rice (the homozygous of T2 generation of transgenic Line 87 with 28% decreased GS activity in leaves was used in this study) and wild-type Zhonghua 11 (Oryza sativa ssp. japonica) were germinated and sowed in sand. Seedlings with two leaves were then transplanted hydroponically in a normal nutrient solution using 1.44 mM·NH4NO3 as a nitrogen source (N), a nutrient solution without NH4NO3, but using 2.0 mM glutamine (Gln) as a nitrogen source (G), and a nutrient solution using both 1.44 mM·NH4NO3 and 2.0 mM·Gln as nitrogen sources (N + G). The composition of normal nutrient solution was described in detail by Yoshida et al. [55]. At the seedling stage (one week after transplanting) and the tillering stage (five weeks after transplanting), the roots, stems and leaves were harvested for the phenotype evaluation, the leaf SPAD value and photosynthesis capacity determination, the carbon-nitrogen metabolism and gene expression analysis. All of the plants were grown in the pot farm at Huazhong Agricultural University, Wuhan, China. The nutrient solution was refreshed every 3 days, and the pH value was kept at 5.5.

4.2. Nitrogen Uptake Assay

Seeds of the GS2-cosuppressed rice (transgenic Line 88 was used in this study) and wild-type Zhonghua 11 (Oryza sativa ssp. japonica) germinated and were sowed in sand in the pot farm at Huazhong Agricultural University. Seedlings with two leaves were transplanted into the normal nutrient solution described by Yoshida et al. [55]. Plants were transferred into a new nutrient solution, in which the NH4NO3 was replaced by 15NH415NO3, at the tillering stage (five weeks after transplanting). After 1 h, 3 h, 8 h, 1 day and 3 days, three biological replicated samples of roots, stems and uppermost leaves were harvested for the total N and 15N concentration determination. A C/N analyzer (Elementar, Vario MAX CN, Germany) and an isotope mass spectrometer (ANCA-MS, Europa Scientific, Crewe, UK) were used to measure the concentrations of total C/N and 15N, respectively, as described in detail previously [42].

4.3. Determination of the Leaf SPAD Value and Photosynthetic Parameters

As described in detail previously [42], every ten randomly-selected plants of the GS2-cosuppressed rice and wild-type Zhonghua 11 grown under the N, G and N + G conditions at the tillering stage (five weeks after transplanting) were used for the leaf SPAD value and photosynthetic capacity determination. The SPAD value and the photosynthetic rate, transpiration rate, intercellular CO2 concentration and stomatal conductance of upper, middle and bottom portion of the flag leaf in each plant were tested by a chlorophyll meter (SPAD-502) and a Li-6400XT portable photosynthesis system (Li-COR, Lincoln, NE, USA), respectively. The average mean was used in the further data analysis.

4.4. Determination of the Physiological Parameters

At the seedling stage (one week after transplanting) and the tillering stage (five weeks after transplanting), three biological replicated roots, stems and uppermost leaves of the GS2-cosuppressed rice and wild-type Zhonghua 11 grown under the N, G and N + G conditions were harvested for the concentrations of soluble proteins and carbohydrates analysis. All fresh samples were homogenized by grinding on ice with extraction buffer, which was described in detail previously [36,42]. After centrifuging (12,000× g, 20 min, 4 °C), the supernatant was used to analyze the concentration of soluble proteins by the Bradford method [56]. The pre-dried samples were boiled with boiling water to extract the soluble carbohydrates. Additionally, the concentration of soluble carbohydrates was measured colorimetrically by the anthrone method [57,58]. At the tillering stage (five weeks after transplanting), three biological replicated roots and uppermost leaves of GS2-cosuppressed rice and wild-type Zhonghua 11 grown under the N condition were harvested for the carbon-nitrogen metabolic profile analysis. Fifty milligrams of fresh sample were extracted with 1 mL extraction buffer (methanol/chloroform/water (3:1:1 v/v/v)) containing ten stable isotope compounds by a mixer mill at a frequency of 30 Hz for 3 min at 4 °C. The homogenates were then centrifuged at 15,000× g for 5 min at 4 °C. Four hundred microliters of supernatant were evaporated for further derivatization in a vacuum filled with 99.999% dry nitrogen. After evaporation, 20 μL methoxyamine hydrochloride were added to the sample for 30 h of derivatization at room temperature. Later, the sample was trimethylsilylated using 20 μL of MSTFA [N-Methyl-N-(trimethylsilyl)trifluoroacetamide] with 1% TMCS (Trimethylchlorosilane) at 37 °C with shaking for 1 h, and 20 μL n-heptane were added after silylation. The analysis of carbon and nitrogen metabolites by GC-TOF-MS and data analysis were performed as described by Kusano et al. [59,60] and Redestig et al. [61].

4.5. Gene Expression Analysis

At the seedling stage (one week after transplanting) and the tillering stage (five weeks after transplanting), three biological replicated roots and uppermost leaves of the GS2-cosuppressed rice and wild-type Zhonghua 11 grown under the N, G and N + G conditions were harvested for total RNA extraction (TRIzol reagent, Invitrogen, Darmstadt, Germany) and q-RT PCR analysis. The total RNA was treated by DNase I to remove the genomic DNA. The Superscript II reverse transcriptase (Invitrogen) was used to synthesize the first-strand cDNAs for q-RT PCR. The Primer Express Software (Foster City, CA, USA) and BLAST program in the database of the Institute for Genomic Research (TIGR, Available online: http://rice.plantbiology.msu.edu/) were used to design primers and check their specificity. Supplementary Table S2 lists the specific primers, both for tested genes and the rice actin gene (NM_197297). All of the experimental procedures were described in detail previously [36,42].

4.6. Statistical Analysis

The data were assessed with one-way ANOVA at p < 0.05 or p < 0.01 using SPSS 17.0 (SPSS Inc., Chicago, IL, USA).

5. Conclusions

In this study, we systematically analyzed the differences in the growth phenotype, carbon-nitrogen metabolic status and gene expression profile between GS2-cosuppressed rice and wild-type Zhonghua 11 at both the seedling stage and the tillering stage under three different nitrogen conditions (N, G and N + G). Results demonstrated the close relationships between the GS2 mRNA levels and carbon-nitrogen metabolic status, as well as the plant growth phenotype. Figure 7 summarizes the differences between the seedling stage and the tillering stage in the GS2 transgenic plants.
At the seedling stage, GS2 was overexpressed under the control of the 35S promoter in the leaf tissue, which stimulated the expression levels of the NR, GS and GOGAT genes, resulting in an improvement in nitrogen reduction and assimilation for the increased production of amino acids and proteins. The content of carbohydrates decreased because of the large amount of carbon skeletons that were used to synthesize amino acids, and the expression levels of the RUBISCO and PEPC genes increased to produce more carbon skeletons. As fewer carbon skeletons could be transported into the root to participate in amino acid synthesis, the decreased NRT, NR, GS and GOGAT expression levels were displayed, which resulted in a decline in the nitrogen uptake, reduction and assimilation in the root. Additionally, GS2 was excessively overexpressed (>35-fold) under the 35S promoter in the root, which could require a large amount of energy. This may be another factor causing the decreased nitrogen metabolic status in the roots of the GS2 transgenic plants.
Figure 7. Summary of the differences between the seedling stage and the tillering stage in the GS2 transgenic plant. The symbols ↑ and indicate induction and repression, respectively.
Ijms 16 12713 g007
Although the GS2 transgenic plants maintained a normal growth phenotype with green leaves at the seedling stage, the metabolic status was altered dramatically in both the root and leaf tissues because of the GS2 overexpression. In this situation, plants must do something to maintain the metabolic status and complete the life cycle. From this point of view, the transgenic plants adjusted the GS2 expression level in the leaves at the tillering stage. In the leaves, the GS2 expression level decreased, which suppressed the NR, GS and GOGAT gene expression, resulted a decline in nitrogen reduction and assimilation, as well as decreased amino acid and protein production. However, the increased levels of free amino acids were observed in the metabolite profile analysis, which may have been caused by the protein degradation in the chlorotic leaves. In another case, the contents of the carbohydrates increased because few carbon skeletons were used to synthesize amino acids, and the expression levels of the RUBISCO and PEPC genes decreased to reduce the production of carbon skeletons. As more carbon skeletons were transported into the roots to participate in amino acids synthesis, increases in the NRT, NR, GS and GOGAT expression levels were observed, which resulted in an improvement in the uptake, reduction and assimilation of nitrogen in the roots. We concluded that the stable transcription level of GS2 mRNA plays an important role in the normal development of rice and in the carbon-nitrogen metabolic balance. We hypothesized that the disrupted coordination of the carbon and nitrogen metabolic status and the excessively high expression level of GS2 mRNA in the root were the possible reasons for the chlorosis phenotype in the GS2-cosuppressed plants.

Supplementary Materials

Supplementary materials can be found at https://www.mdpi.com/1422-0067/16/06/12713/s1.

Acknowledgments

This research was supported in part by grants from the National Natural Science Foundation of China (31000932), the Specialized Research Fund for the Doctoral Program of Higher Education, the Ministry of Education of China (20100146120017) and the Fundamental Research Funds for the Central Universities (2662013PY041). We thank Qifa Zhang and Xingming Lian for providing the plant materials.

Author Contributions

Fangsen Xu, Lei Shi and Hongmei Cai conceived of and designed the experiments; Aili Bao and Guangda Ding performed the experiments; Zhuqing Zhao and Hongmei Cai analyzed the data; Aili Bao and Guangda Ding contributed reagents; and Hongmei Cai wrote the manuscript. All authors read and approved the manuscript.

Conflicts of Interest

The authors declare no conflict of interest.

References

  1. Lam, H.M.; Coschigano, K.T.; Oliveira, I.C.; Melo-Oliveira, R.; Coruzzi, G.M. The molecular-genetics of nitrogen assimilation into amino acids in higher plants. Annu. Rev. Plant Physiol. Plant Mol. Biol. 1996, 47, 569–593. [Google Scholar] [CrossRef] [PubMed]
  2. Tabuchi, M.; Abiko, T.; Yamaya, T. Assimilation of ammonium ions and reutilization of nitrogen in rice (Oryza sativa L.). J. Exp. Bot. 2007, 58, 2319–2327. [Google Scholar] [CrossRef] [PubMed]
  3. Frink, C.R.; Waggoner, P.E.; Ausubel, J.H. Nitrogen fertilizer: Retrospect and prospect. Proc. Natl. Acad. Sci. USA 1999, 96, 1175–1180. [Google Scholar] [CrossRef] [PubMed]
  4. Crawford, N.M.; Forde, B.G. Molecular and developmental biology of inorganic nitrogen nutrition. In The Arabidopsis Book; Meyerowitz, E., Somerville, C., Eds.; American Society of Plant Biologists: Rockville, MD, USA, 2002. [Google Scholar]
  5. Zheng, Z. Carbon and nitrogen nutrient balance signaling in plants. Plant Signal. Behav. 2009, 4, 584–591. [Google Scholar] [CrossRef] [PubMed]
  6. Krapp, A.; Ferrario-Méry, S.; Touraine, B. Nitrogen and signalling. In Advances in Photosynthesis; Foyer, C., Noctor, G., Eds.; Springer Netherlands: Dordrecht, The Netherlands, 2002; Volume 12, pp. 205–225. [Google Scholar]
  7. Krapp, A.; Truong, H.N. Regulation of C/N interaction in model plant species. In The Efficiency of Nitrogen Utilization in Plants; Goyal, S., Tischner, R., Basra, A., Eds.; Enhancing Haworth Press: New York, NY, USA, 2005; pp. 127–173. [Google Scholar]
  8. Coruzzi, G.M.; Zhou, L. Carbon and nitrogen sensing and signaling in plants: Emerging “matrix effects”. Curr. Opin. Plant Biol. 2001, 4, 247–253. [Google Scholar] [CrossRef]
  9. Martin, T.; Oswald, O.; Graham, I.A. Arabidopsis seedling growth, storage lipid mobilization and photosynthetic gene expression are regulated by carbon: nitrogen availability. Plant Physiol. 2002, 128, 472–481. [Google Scholar] [CrossRef] [PubMed]
  10. Nunes-Nesi, A.; Fernie, A.R.; Stitt, M. Metabolic and signaling aspects underpinning the regulation of plant carbon nitrogen interactions. Mol. Plant 2010, 3, 973–996. [Google Scholar] [CrossRef] [PubMed]
  11. Miflin, B.J.; Lea, P.J. Ammonia assimilation. In The Biochemistry of Plants; Miflin, B.J., Ed.; Academic Press: New York, NY, USA, 1980; Volume 5, pp. 169–202. [Google Scholar]
  12. Hirel, B.; Lea, P.J. Ammonium assimilation. In Plant Nitrogen; Lea, P.J., Morof Gaudry, J.F., Eds.; Springer-Verlag: Berlin, Germany, 2001; pp. 79–99. [Google Scholar]
  13. Tobin, A.K.; Yamaya, T. Cellular compartmentation of ammonium assimilation in rice and barley. J. Exp. Bot. 2001, 53, 591–604. [Google Scholar] [CrossRef]
  14. Ireland, R.J.; Lea, P.J. The enzymes of glutamine, glutamate, asparagines and aspirate metabolism. In Plant Amino Acids: Biochemistry and Biotechnology; Singh, B.K., Ed.; Marcel Dekker: New York, NY, USA, 1999; pp. 49–109. [Google Scholar]
  15. Mann, A.F.; Fenten, P.A.; Stewart, G.R. Identification of two forms of glutamine synthetase in barley (Hordeum vulgare L.). Biochem. Biophys. Res. Commun. 1979, 88, 515–521. [Google Scholar] [CrossRef]
  16. Hirel, B.; Gadal, P. Glutamine synthetase in rice: A comparative study of the enzymes from roots and leaves. Plant Physiol. 1980, 66, 619–623. [Google Scholar] [CrossRef] [PubMed]
  17. Hayakawa, T.; Kamachi, K.; Oikawa, M.; Ojima, K.; Yamaya, T. Response of glutamine synthetase and glutamate synthase isoforms to nitrogen sources in rice cell cultures. Plant Cell Physiol. 1990, 31, 1071–1077. [Google Scholar]
  18. Kamachi, K.; Yamaya, T.; Maie, T.; Ojima, K. A role for glutamine synthetase in the remobilization of leaf nitrogen during natural senescence in rice leaves. Plant Physiol. 1991, 96, 411–417. [Google Scholar] [CrossRef] [PubMed]
  19. Zozaya-Garza, M.; Sengupta-Gopalan, C. Glutamine synthetase gene isolation from an alfalfa leaf cDNA library. Plant Physiol. 1999, 119, 1568. [Google Scholar]
  20. Ishiyama, K.; Inoue, E.; Tabuchi, M.; Yamaya, T.; Takahashi, H. Biochemical background and compartmentalized functions of cytosolic glutamine synthetase for active ammonium assimilation in rice roots. Plant Cell Physiol. 2004, 45, 1640–1647. [Google Scholar] [CrossRef] [PubMed]
  21. Bernard, S.M.; Moller, A.L.; Dionisio, G.; Kichey, T.; Jahn, T.P.; Dubois, F.; Baudo, M.; Lopes, M.S.; Tercé-Laforgue, T.; Foyer, C.H.; et al. Gene expression, cellular localisation and function of glutamine synthetase isozymes in wheat (Triticum aestivum L.). Plant Mol. Biol. 2008, 67, 89–105. [Google Scholar] [CrossRef] [PubMed]
  22. Deng, Y.-W.; Zhang, Y.-D.; Chen, Y.; Wang, S.; Tang, D.-M.; Huang, D.-F. Isolation and characterization of a GS2 gene in melon (Cucumis melo L.) and its expression patterns under the fertilization of different forms of N. Mol. Biotechnol. 2010, 44, 51–60. [Google Scholar] [CrossRef] [PubMed]
  23. Gadaleta, A.; Nigro, D.; Giancaspro, A.; Blanco, A. The glutamine synthetase (GS2) gene is in relation to grain protein content of durum wheat. Funct. Integr. Genomics 2011, 11, 665–670. [Google Scholar] [CrossRef] [PubMed]
  24. Seabra, A.; Vieira, C.P.; Cullimore, J.V.; Garvalho, H.G. Medicago truncatula contains a second gene encoding a plastid located glutamine synthetase exclusively expressed in developing seeds. BMC Plant Biol. 2010, 10, 183. [Google Scholar] [PubMed]
  25. Tabuchi, M.; Sugiyama, K.; Ishiyama, K.; Inoue, E.; Sato, T.; Takahashi, H.; Yamaya, T. Severe reduction in growth rate and grain filling of rice mutants lacking OsGS1;1, a cytosolic glutamine synthetase1;1. Plant J. 2005, 42, 641–651. [Google Scholar] [CrossRef] [PubMed]
  26. Oliveira, I.C.; Brears, T.; Knight, T.J.; Clark, A.; Coruzzi, G.M. Overexpression of cytosolic glutamine synthetase: Relation to nitrogen, light and photorespiration. Plant Physiol. 2002, 129, 1170–1180. [Google Scholar] [CrossRef] [PubMed]
  27. Hoshida, H.; Tanaka, Y.; Hibino, T.; Hayashi, Y.; Tanaka, A.; Takabe, T.; Takabe, T. Enhanced tolerance to salt stress in transgenic rice that overexpresses chloroplast glutamine synthetase. Plant Mol. Biol. 2000, 43, 103–111. [Google Scholar] [CrossRef] [PubMed]
  28. Husted, S.; Mattsson, M.; Möllers, C.; Wallbraun, M.; Schjoerring, J.K. Photorespiratory NH4+ production in leaves of wild-type and glutamine synthetase 2 antisense oilseed rape. Plant Physiol. 2002, 130, 989–998. [Google Scholar] [CrossRef] [PubMed]
  29. García-Calderón, M.; Chiurazzi, M.; Espuny, M.R.; Márquez, A.J. Photorespiratory metabolism and nodule function: Behavior of Lotus japonicas mutants deficient in plastid glutamine synthetase. Mol. Plant. Microbe Interact. 2012, 25, 211–219. [Google Scholar] [CrossRef] [PubMed]
  30. Blackwell, R.D.; Murray, A.J.S.; Lea, P.J. Inhibition of photosynthesis in barley with decreased levels of chloroplastic glutamine synthetase activity. J. Exp. Bot. 1987, 38, 1799–1809. [Google Scholar] [CrossRef]
  31. Blackwell, R.D.; Murray, A.J.S.; Lea, P.J.; Joy, K.W. Photorespiratory amino donors, sucrose synthesis and the induction of CO2 fixation in barley deficient in glutamine synthetase and/or glutamate synthase. J. Exp. Bot. 1988, 39, 845–858. [Google Scholar] [CrossRef]
  32. Wallsgrove, R.M.; Turner, J.C.; Hall, N.P.; Kendall, A.C.; Bright, S.W.J. Barley mutants lacking chloroplast glutamine synthetase: Biochemical and genetic analysis. Plant Physiol. 1987, 83, 155–158. [Google Scholar] [CrossRef] [PubMed]
  33. Socolow, R. Nitrogen management and the future of food: Lessons from the management of energy and carbon. Proc. Natl. Acad. Sci. USA 1999, 96, 6001–6008. [Google Scholar] [CrossRef] [PubMed]
  34. Guo, J.H.; Liu, X.J.; Zhang, Y.; Shen, J.L.; Han, W.X.; Zhang, W.F.; Christie, P.; Goulding, K.W.T.; Vitousek, P.M.; Zhang, F.S. Significant acidification in major Chinese croplands. Science 2010, 327, 1008–1010. [Google Scholar] [CrossRef] [PubMed] [Green Version]
  35. Zhang, Q.F. Strategies for developing green super rice. Proc. Natl. Acad. Sci. USA 2007, 104, 16402–16409. [Google Scholar] [CrossRef] [PubMed]
  36. Cai, H.; Xiao, J.; Zhang, Q.; Lian, X. Co-suppressed glutamine synthetase 2 gene modifies nitrogen metabolism and plant growth in rice. Chin. Sci. Bull. 2010, 55, 823–833. [Google Scholar] [CrossRef]
  37. Gutiérrez, R.A.; Lejay, L.; Dean, A.; Chiaromonte, F.; Shasha, D.E.; Coruzzi, G.M. Qualitative network models and genome wide expression data define carbon/nitrogen-responsive molecular machines in Arabidopsis. Genome Biol. 2007, 8. [Google Scholar] [CrossRef] [PubMed]
  38. Vidal, E.A.; Gutiérrez, R.A. A systems view of nitrogen nutrient and metabolite responses in Arabidopsis. Curr. Opin. Plant Biol. 2008, 11, 521–529. [Google Scholar] [CrossRef] [PubMed]
  39. Pant, B.D.; Musialak-Lange, M.; Nuc, P.; May, P.; Buhtz, A.; Kehr, J.; Walther, D.; Scheible, W.R. Identification of nutrient responsive Arabidopsis and rapeseed microRNAs by comprehensive real-time PCR profiling and small RNA sequencing. Plant Physiol. 2009, 150, 1541–1555. [Google Scholar] [CrossRef] [PubMed]
  40. Vidal, E.A.; Araus, V.; Lu, C.; Parry, G.; Green, P.J.; Coruzzi, G.M.; Gutiérrez, R.A. Nitrate-responsive miR393/AFB3 regulatory module controls root system architecture in Arabidopsis thaliana. Proc. Natl. Acad. Sci. USA 2010, 107, 4477–4482. [Google Scholar] [CrossRef] [PubMed]
  41. Schlüter, U.; Colmsee, C.; Scholz, U.; Bräutigam, A.; Weber, A.P.; Zellerhoff, N.; Bucher, M.; Fahnenstich, H.; Sonnewald, U. Adaptation of maize source leaf metabolism to stress related disturbances in carbon, nitrogen and phosphorus balance. BMC Genomics 2013, 14. [Google Scholar] [CrossRef] [PubMed]
  42. Bao, A.; Zhao, Z.; Ding, G.; Shi, L.; Xu, F.; Cai, H. Accumulated expression level of cytosolic glutamine synthetase 1 gene (OsGS1;1 or OsGS1;2) alter plant development and the carbon-nitrogen metabolic status in rice. PLoS ONE 2014, 9, e95581. [Google Scholar] [CrossRef] [PubMed]
  43. Kusano, M.; Tabuchi, M.; Fukushima, A.; Funayama, K.; Diaz, C.; Kobayashi, M.; Hayashi, N.; Tsuchiya, Y.N.; Takahashi, H.; Kamata, A.; et al. Metabolomics data reveal a crucial role of cytosolic glutamine synthetase 1;1 in coordinating metabolic balance in rice. Plant J. 2011, 66, 456–466. [Google Scholar] [CrossRef] [PubMed]
  44. Pérez-Delgado, C.M.; García-Calderón, M.; Sánchez, D.H.; Udvardi, M.K.; Kopka, J.; Márquez, A.J.; Betti, M. Transcriptomic and metabolic changes associated with photorespiratory ammonium accumulation in the model legume Lotus japonicas. Plant Physiol. 2013, 162, 1834–1848. [Google Scholar] [CrossRef] [PubMed]
  45. Näsholm, T.; Kielland, K.; Ganeteg, U. Uptake of organic nitrogen by plants. New Phytol. 2009, 182, 31–48. [Google Scholar] [CrossRef] [PubMed]
  46. Kielland, K. Amino-acid-absorption by arctic plants-implications for plant nutrition and nitrogen cycling. Ecology 1994, 75, 2373–2383. [Google Scholar] [CrossRef]
  47. Lipson, D.; Näsholm, T. The unexpected versatility of plants: Organic nitrogen use and availability in terrestrial ecosystems. Oecologia 2001, 128, 305–316. [Google Scholar] [CrossRef] [PubMed]
  48. Forsum, O.; Svennerstam, H.; Ganeteg, U.; Nasholm, T. Capacities and constraints of amino acid utilization in Arabidopsis. New Phytol. 2008, 179, 1058–1069. [Google Scholar] [PubMed]
  49. Marschner, H. Mineral Nutrition of Higher Plants, 2nd Ed. ed; Academic Press Limited: San Diego, CA, USA, 1997. [Google Scholar]
  50. Cambui, C.A.; Svennerstam, H.; Gruffman, L.; Nordin, A.; Ganeteg, U.; Nasholm, T. Patterns of plant biomass partitioning depend on nitrogen source. PLoS ONE 2011, 6, e19211. [Google Scholar] [CrossRef] [PubMed]
  51. Thornton, B.; Robinson, D. Uptake and assimilation of nitrogen from solutions containing multiple sources. Plant Cell Environ. 2005, 28, 813–821. [Google Scholar] [CrossRef]
  52. Wang, H.-J.; Wu, L.-H.; Wang, M.-Y.; Zhu, Y.-H.; Tao, Q.-N.; Zhang, F.-S. Effects of amino acids replacing nitrate on growth, nitrate accumulation, and macroelement concentrations in pak-choi (Brassica chinensis L.). Pedosphere 2007, 17, 595–600. [Google Scholar] [CrossRef]
  53. Henry, H.A.L.; Jefferies, R.L. Free amino acid, ammonium and nitrate concentrations in soil solutions of a grazed coastal marsh in relation to plant growth. Plant Cell Environ. 2002, 25, 665–675. [Google Scholar] [CrossRef]
  54. Bollard, E.G. A comparative study of the ability of organic nitrogenous compounds to serve as sole nitrogen sources of nitrogen for the growth of plants. Plant Soil 1966, 25, 153–166. [Google Scholar] [CrossRef]
  55. Yoshida, S.; Forno, D.A.; Cook, J.H.; Gomez, K.A. Laboratory Manual for Physiological Studies of Rice, 3rd ed.; International Rice Research Institute: Manila, Philippine, 1976. [Google Scholar]
  56. Bradford, M.M. A rapid and sensitive method for the quantitation of microgram quantities of protein utilizing the principle of protein binding. Anal. Biochem. 1976, 72, 248–254. [Google Scholar] [CrossRef]
  57. Morris, D.L. Quantitative determination of carbohydrates with Dreywood’s anthrone reagent. Science 1948, 107, 254–255. [Google Scholar] [CrossRef] [PubMed]
  58. Maness, N. Extraction and analysis of soluble carbohydrates. Methods Mol. Biol. 2010, 639, 341–370. [Google Scholar] [PubMed]
  59. Kusano, M.; Fukushima, A.; Arita, M.; Jonsson, P.; Moritz, T.; Kobayashi, M.; Hayashi, N.; Tohge, T.; Saito, K. Unbiased characterization of genotype-dependent metabolic regulations by metabolomic approach in Arabidopsis thaliana. BMC Syst. Biol. 2007, 1. [Google Scholar] [CrossRef] [PubMed]
  60. Kusano, M.; Fukushima, A.; Kobayashi, M.; Hayashi, N.; Jonsson, P.; Moritz, T.; Ebana, K.; Saito, K. Application of a metabolomic method combining one-dimensional and two-dimensional gas chromatographytime-of-flight/mass spectrometry to metabolic phenotyping of natural variants in rice. J. Chromatogr. B Anal. Technol. Biomed. Life Sci. 2007, 855, 71–79. [Google Scholar] [CrossRef] [PubMed]
  61. Redestig, H.; Fukushima, A.; Stenlund, H.; Moritz, T.; Arita, M.; Saito, K.; Kusano, M. Compensation for systematic cross-contribution improves normalization of mass spectrometry based metabolomics data. Anal. Chem. 2009, 81, 7974–7980. [Google Scholar] [CrossRef] [PubMed]

