
Expression of RCAS1 Correlates with Urothelial Bladder Cancer Malignancy

Abstract
:1. Introduction
2. Results
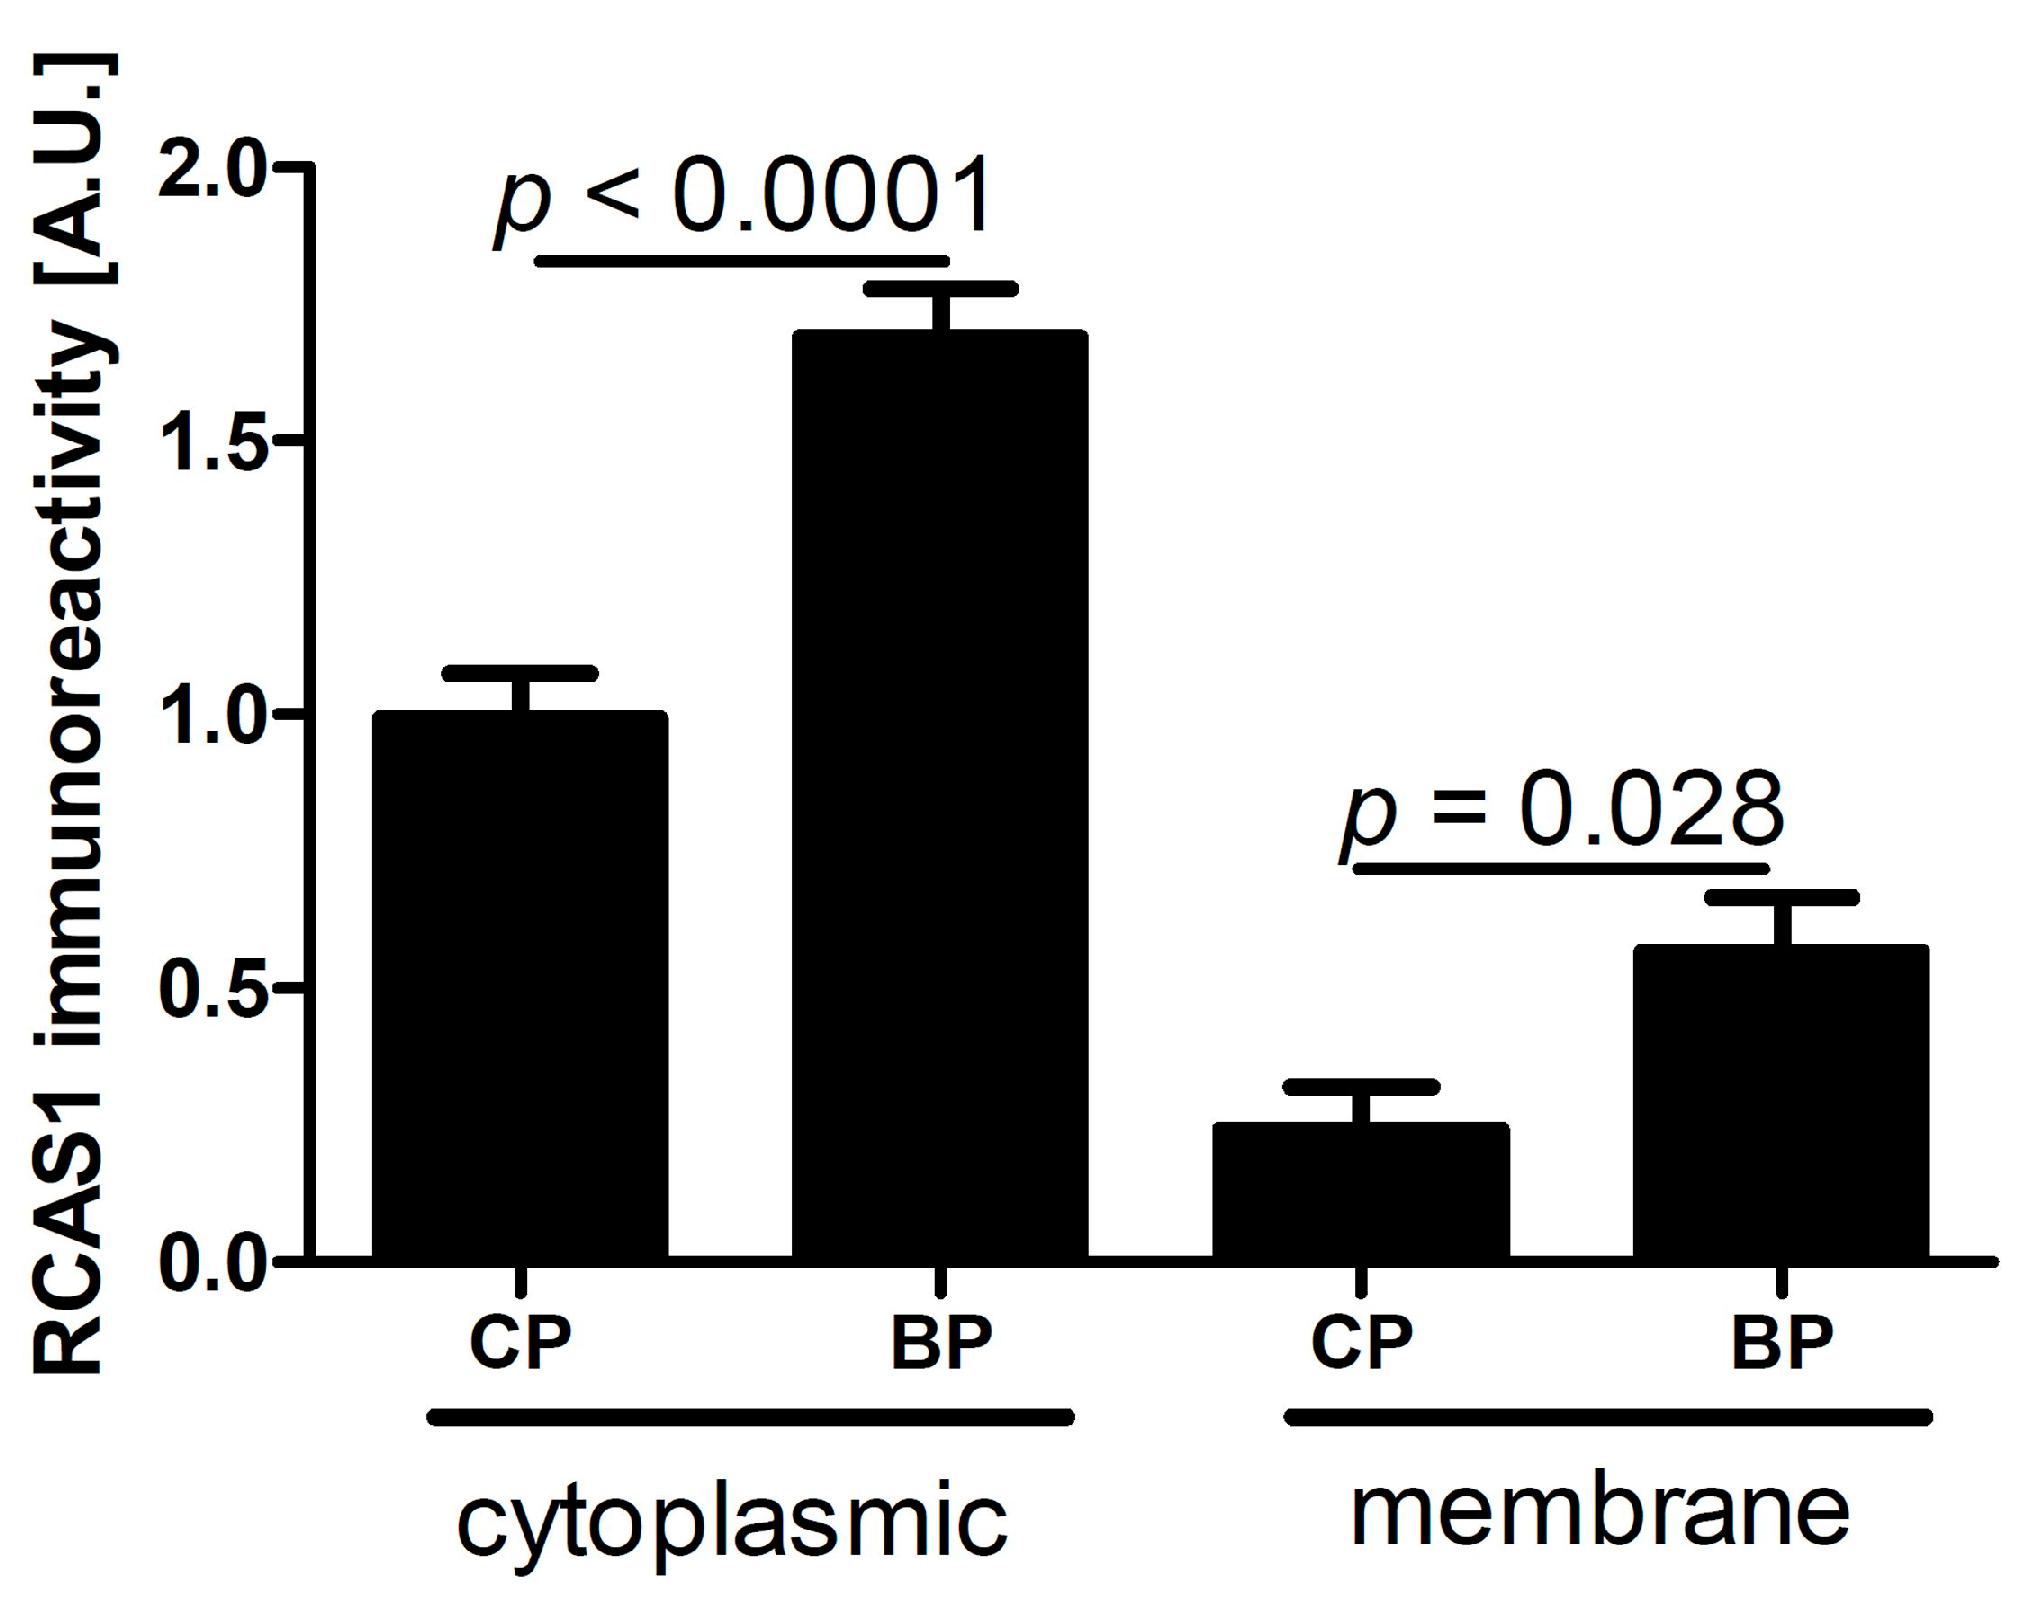
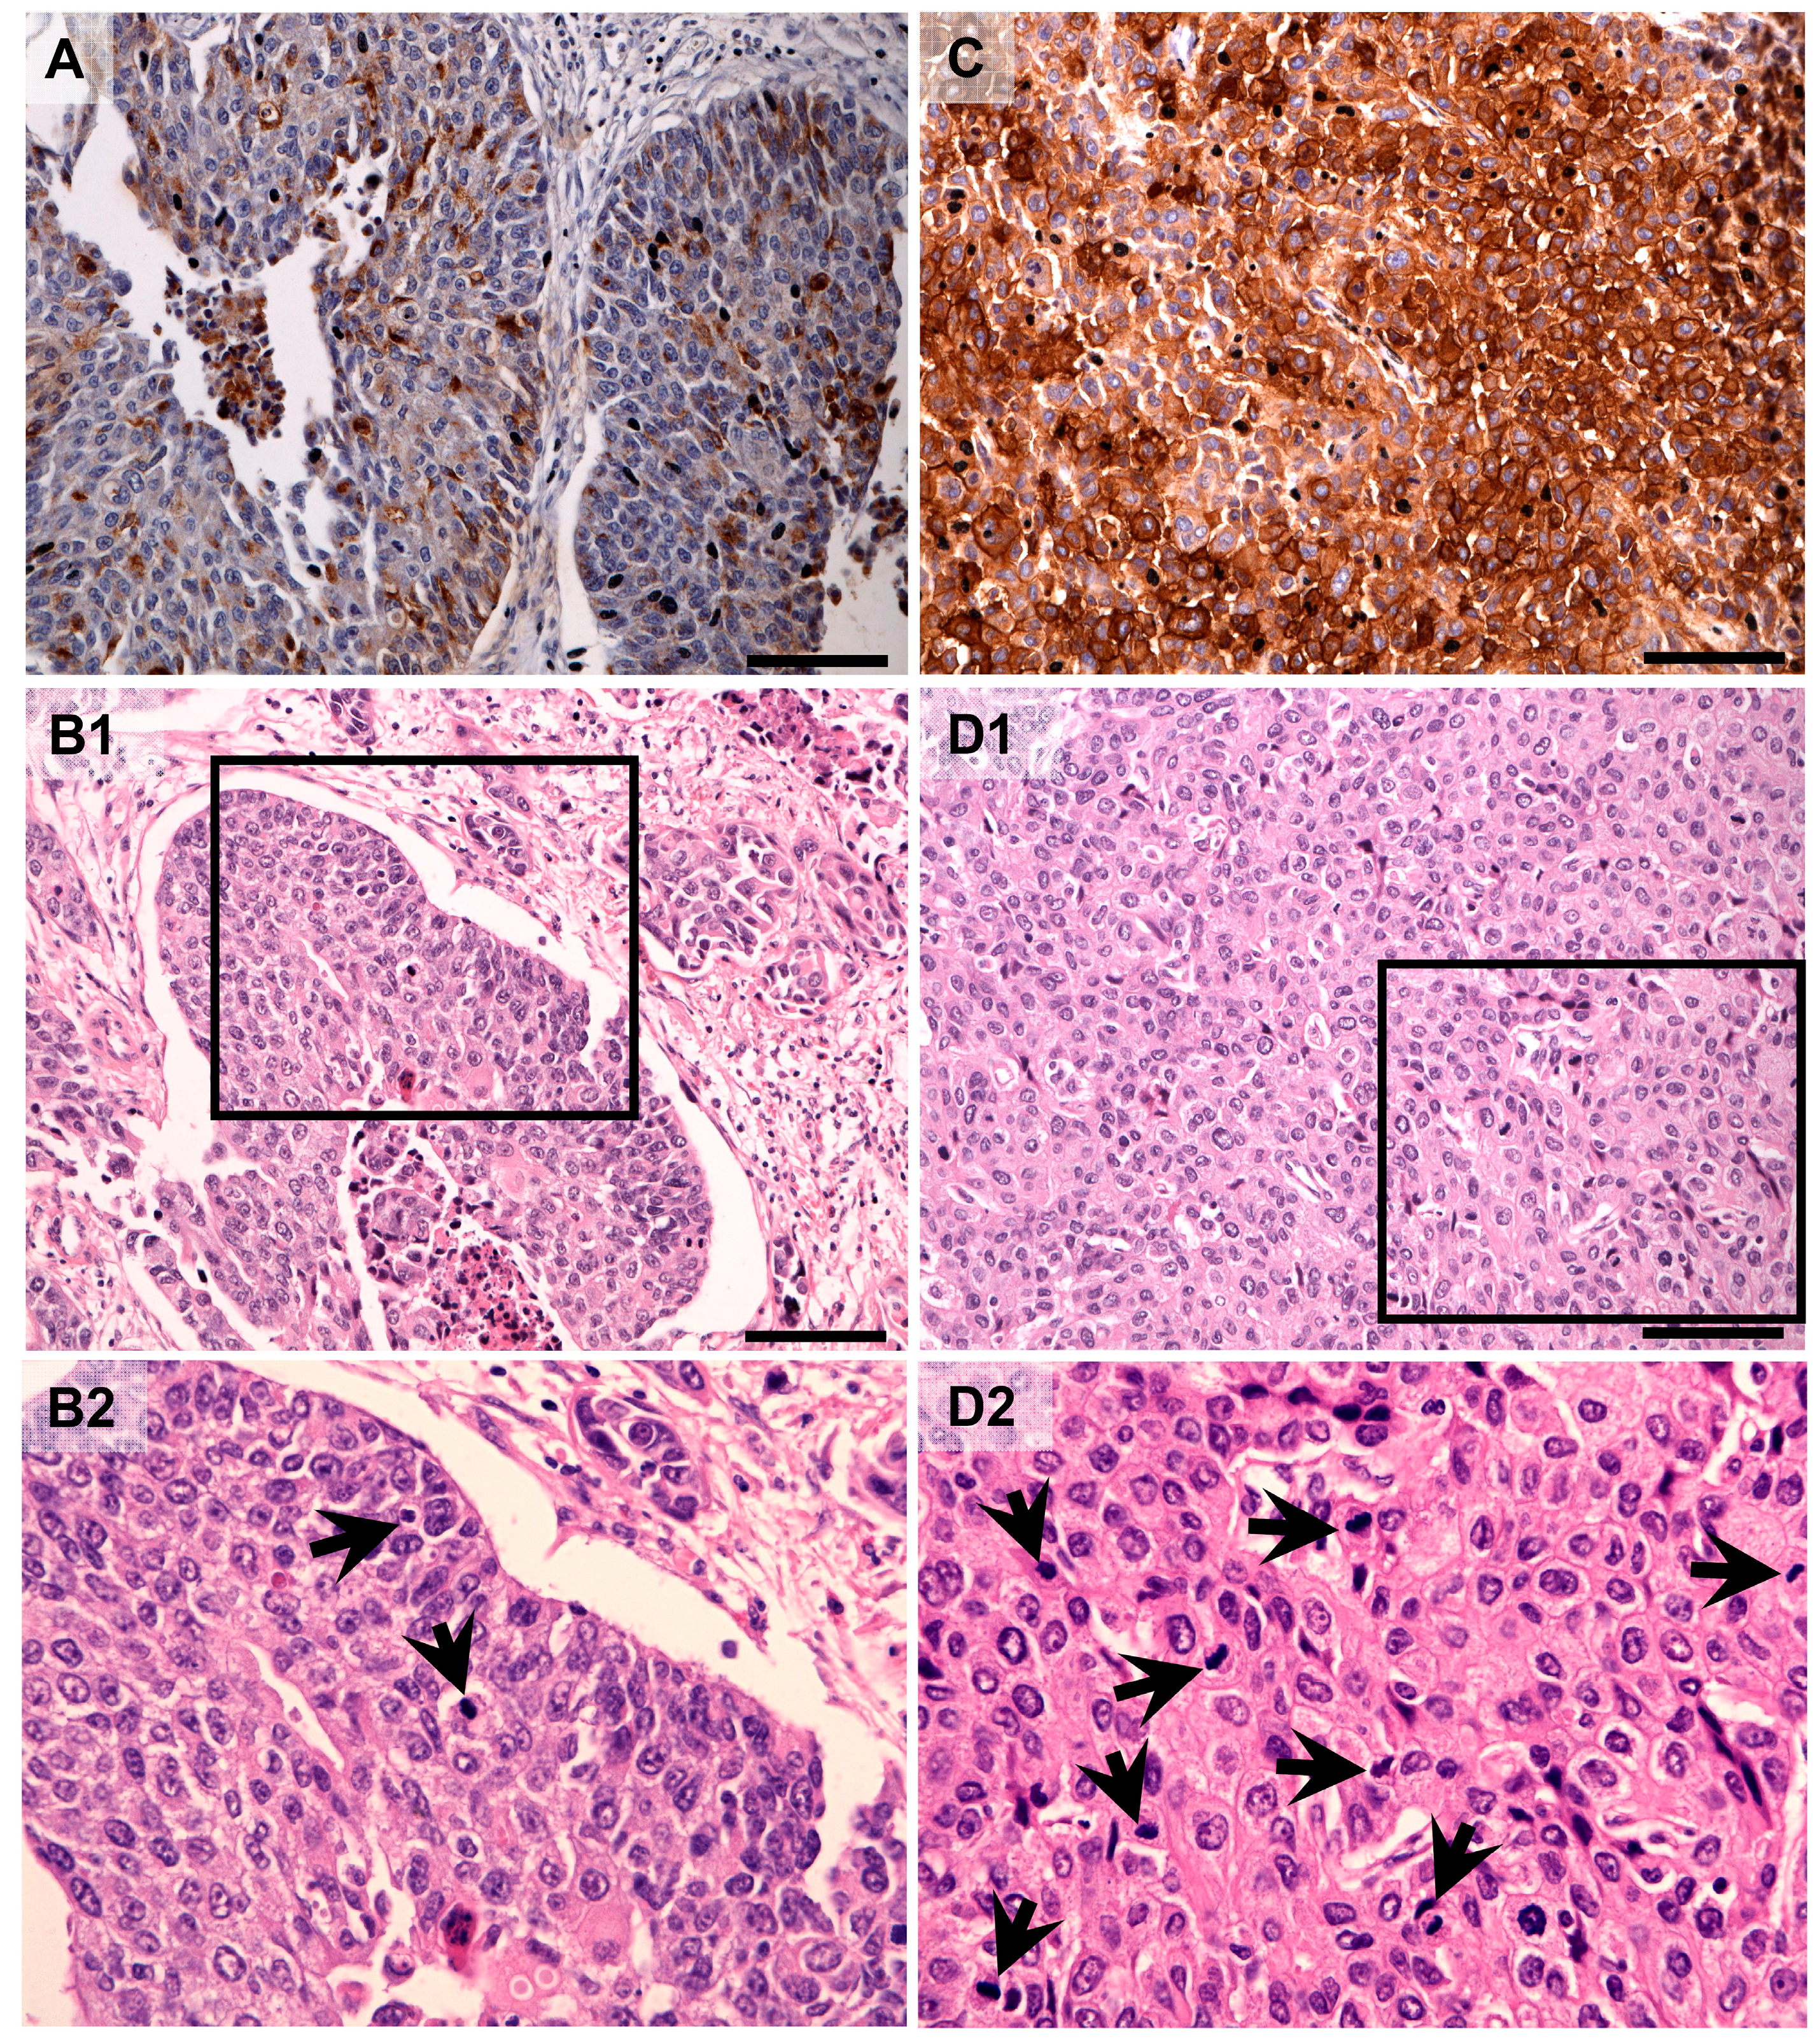
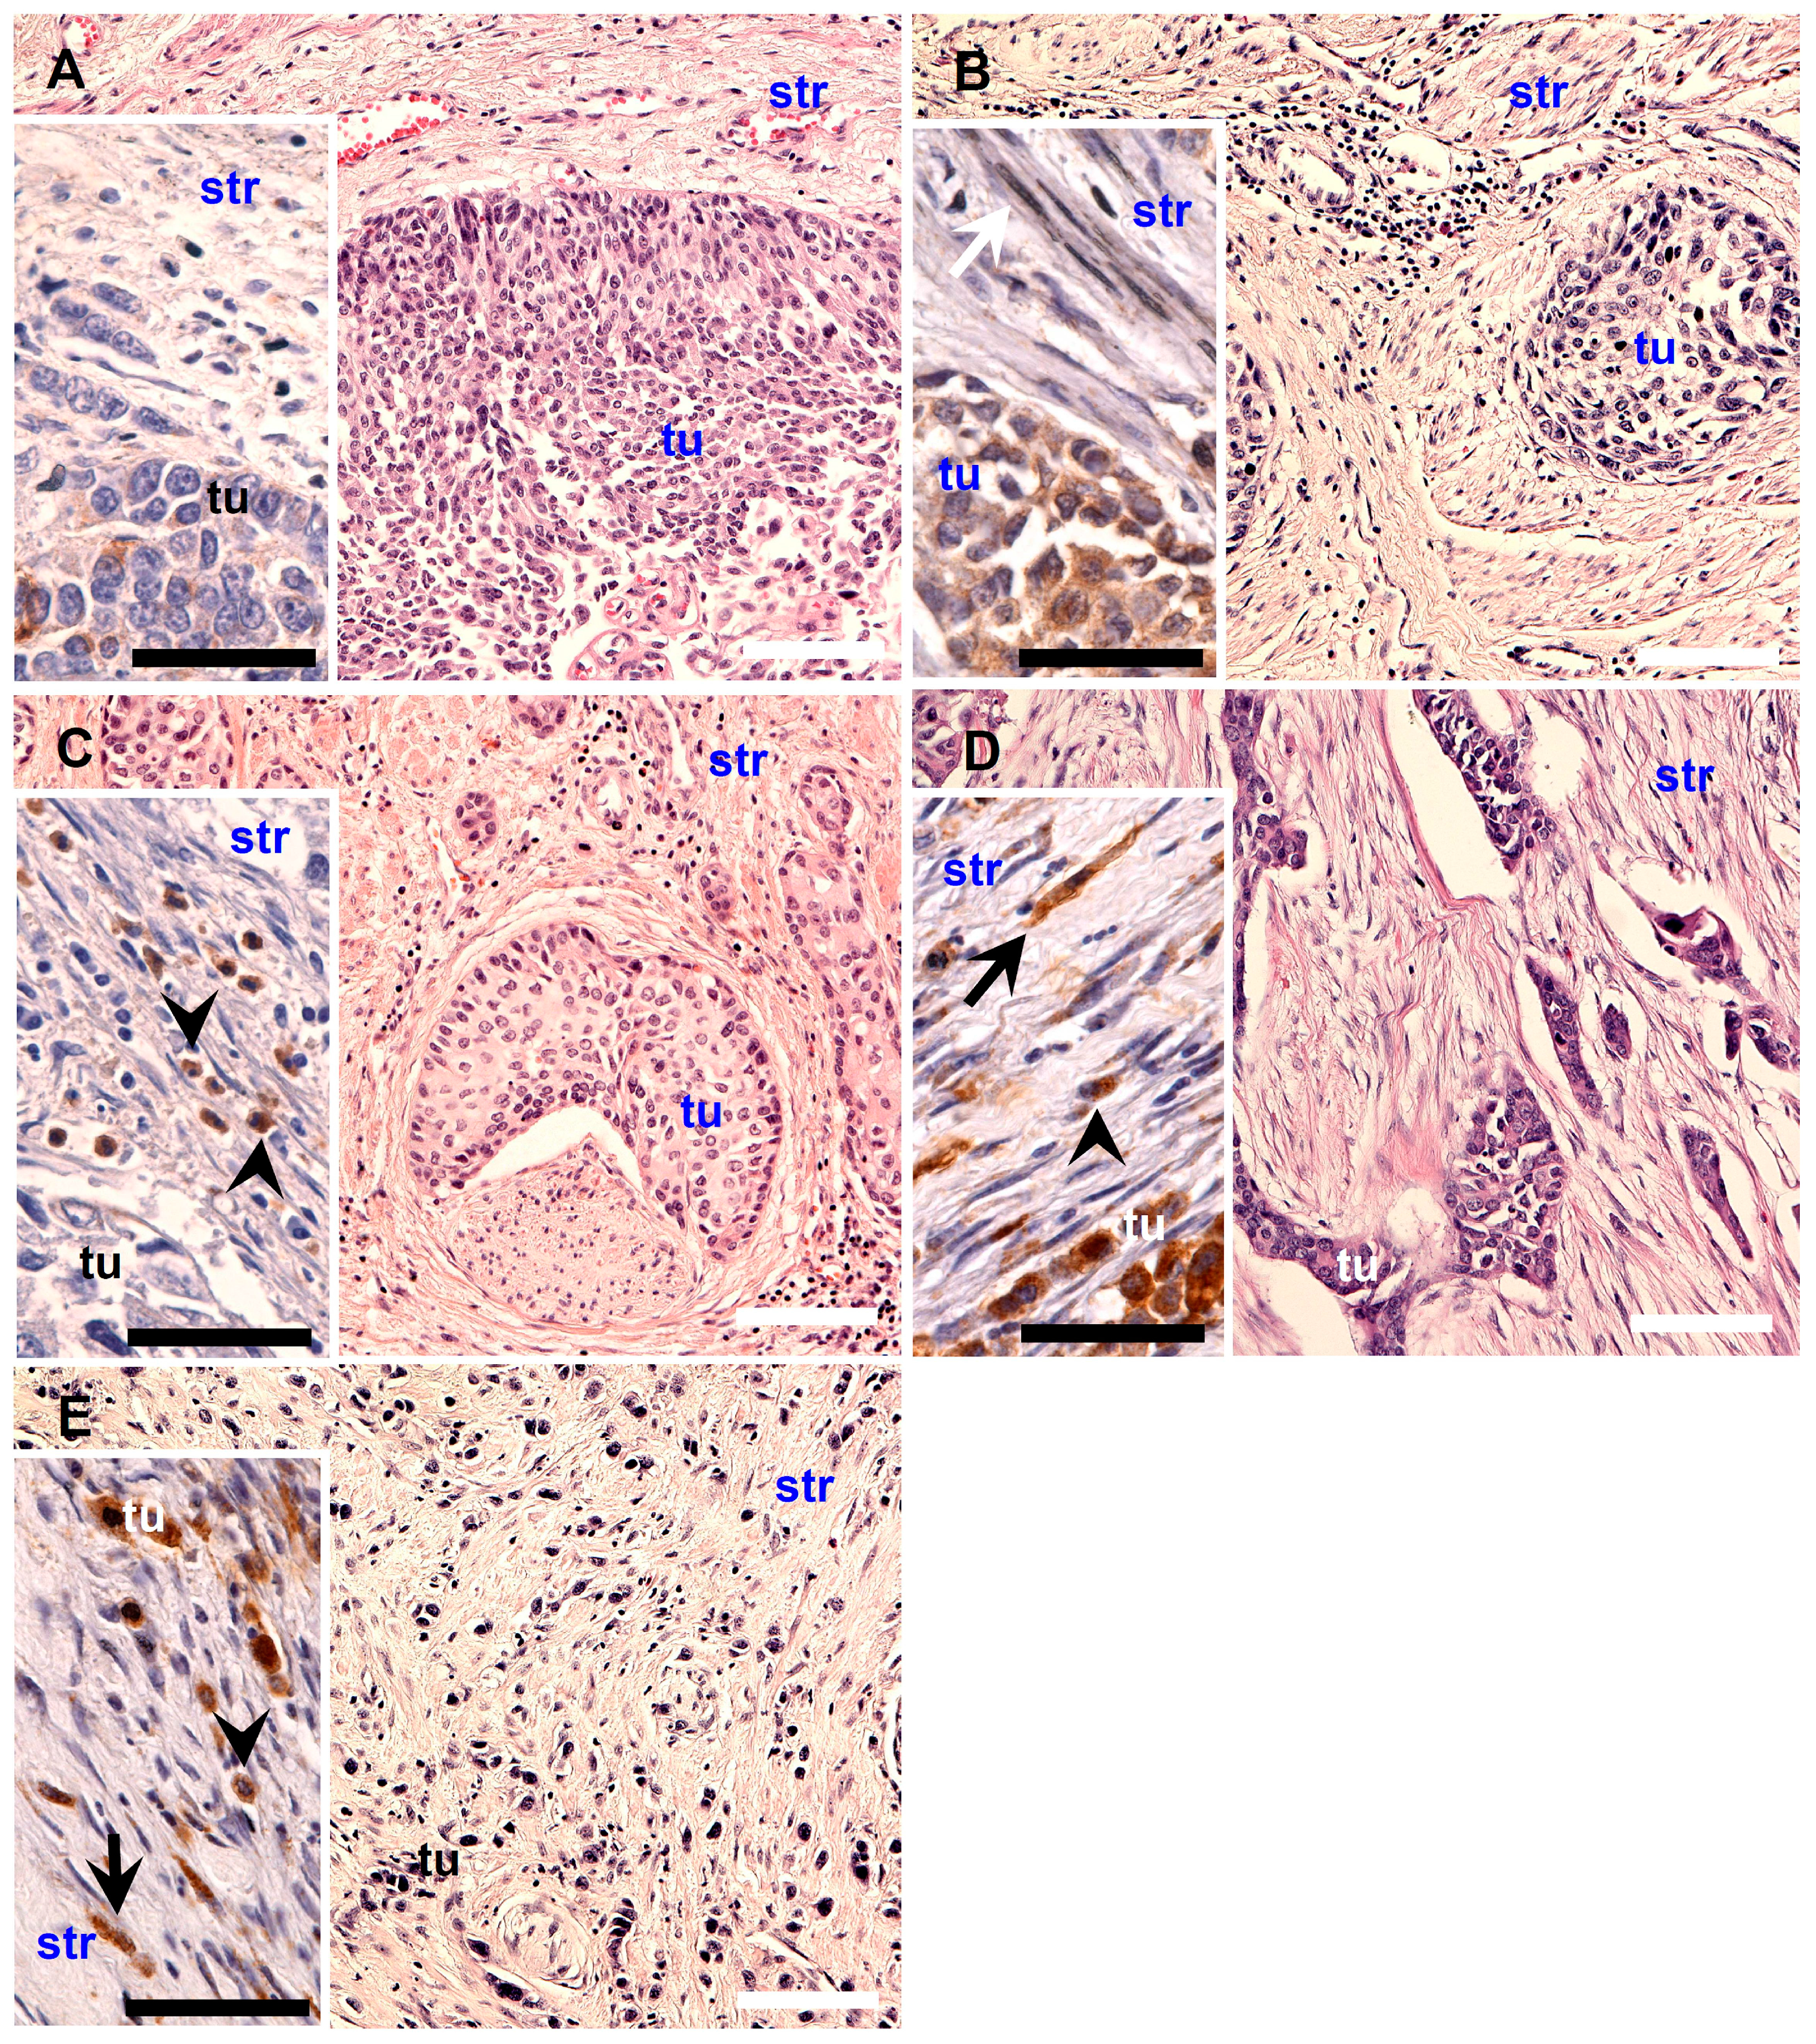
2.1. Characteristics of RCAS1 Expression within Cancer Cells


| Type of Expression and Number of Cells | Localization within Tumor | Grade | TIT | NDN | pT | pN |
|---|---|---|---|---|---|---|
| Membrane expression | BP cancer cells | − | − | − | + | + |
| p = 0.008 | p = 0.027 | |||||
| CP cancer cells | − | − | − | − | − | |
| Cytoplasmic expression | BP cancer cells | − | − | − | − | + |
| p = 0.019 | ||||||
| CP cancer cells | − | − | − | − | − | |
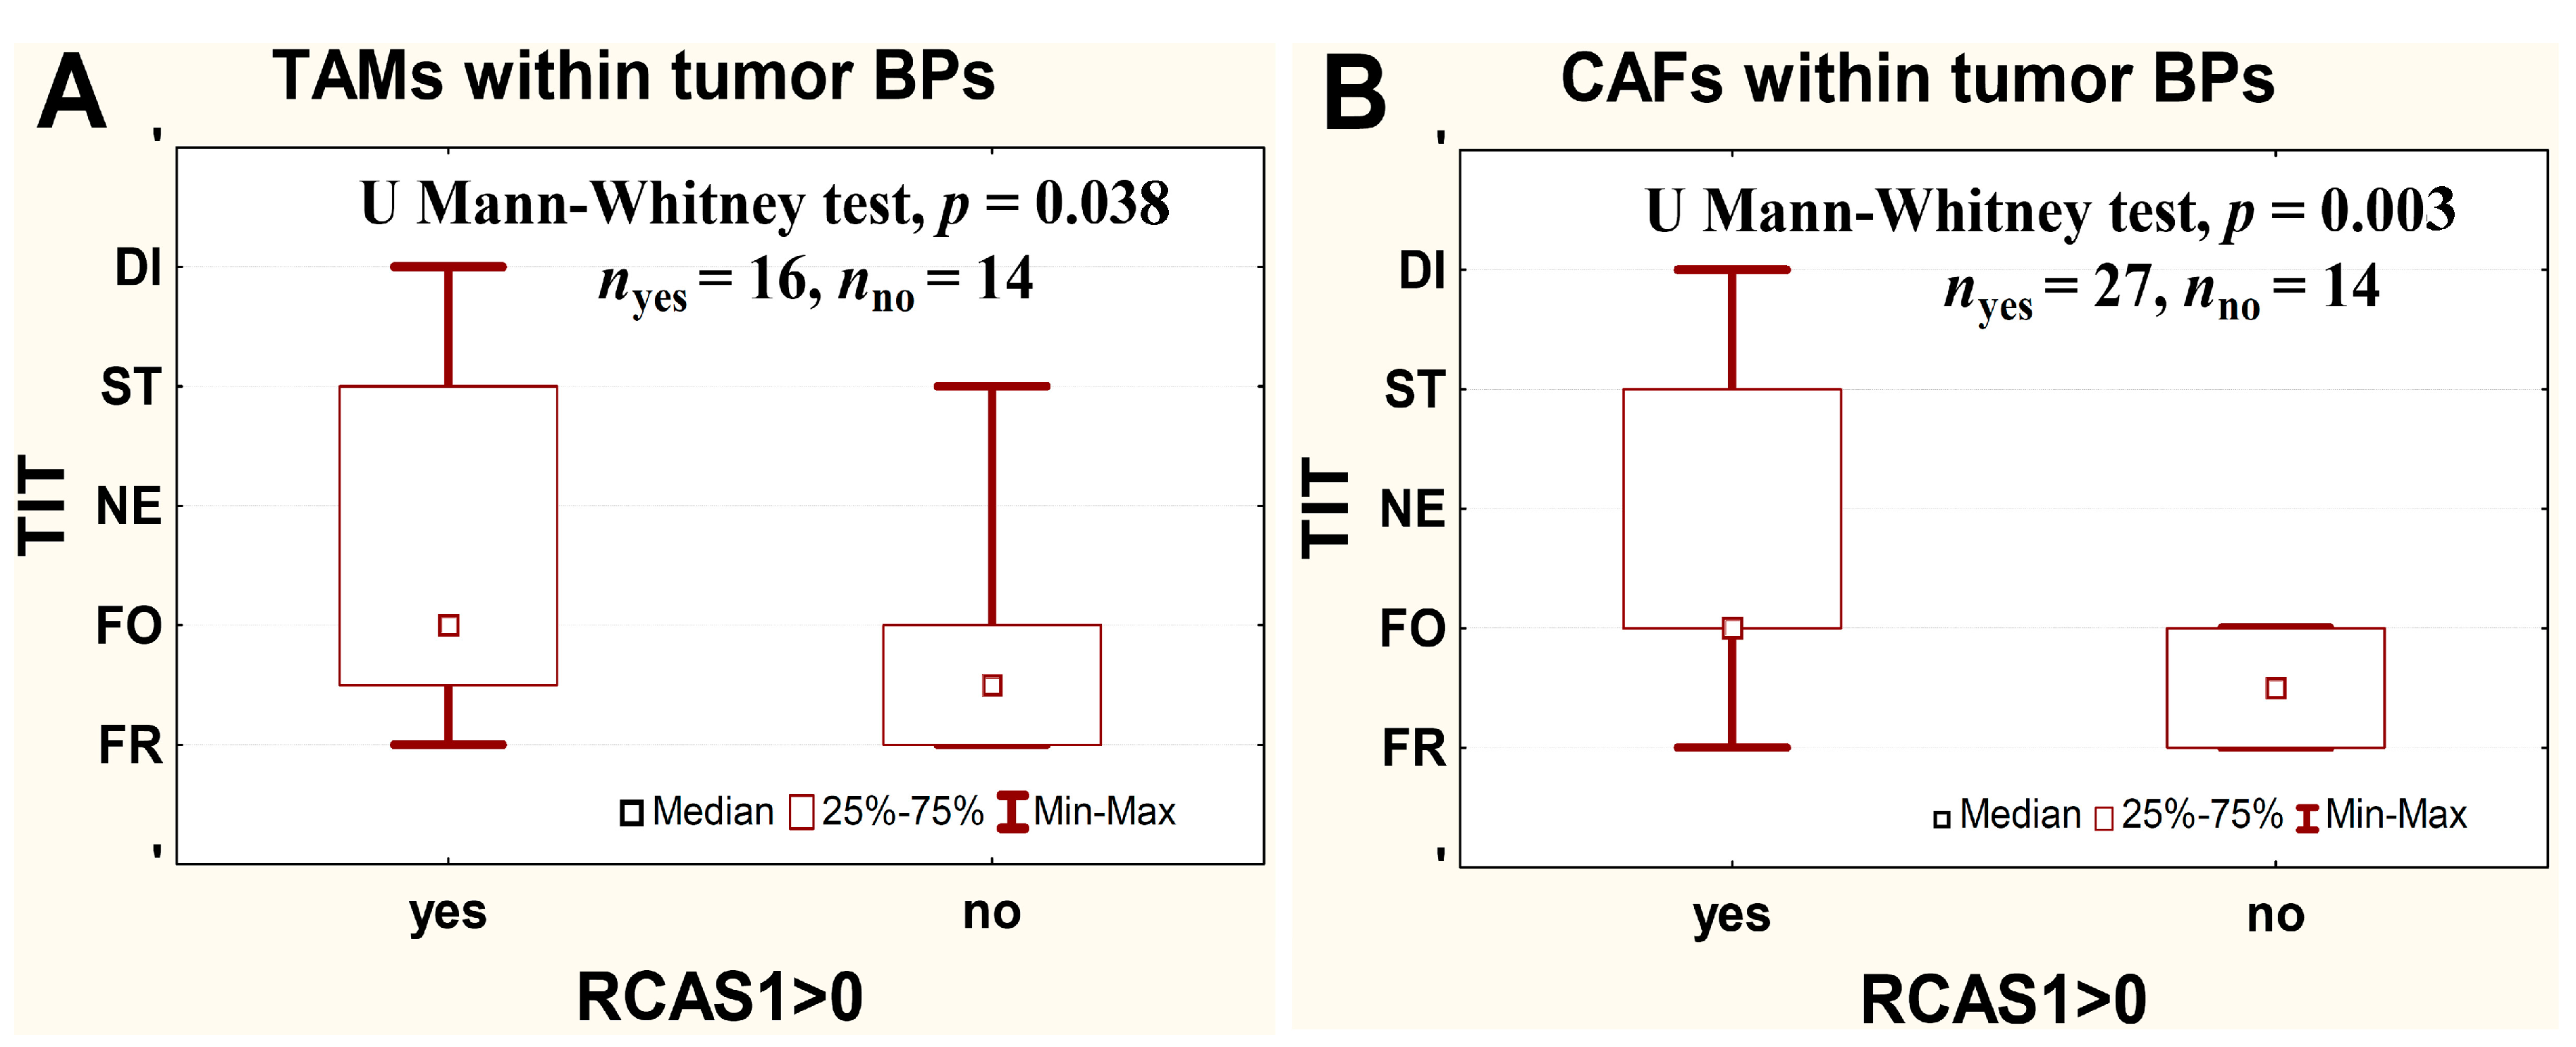
| BP TAMs | − | + | + | − | − | |
| p = 0.039 | p = 0.010 | |||||
| CP TAMs | – | – | – | − | − | |
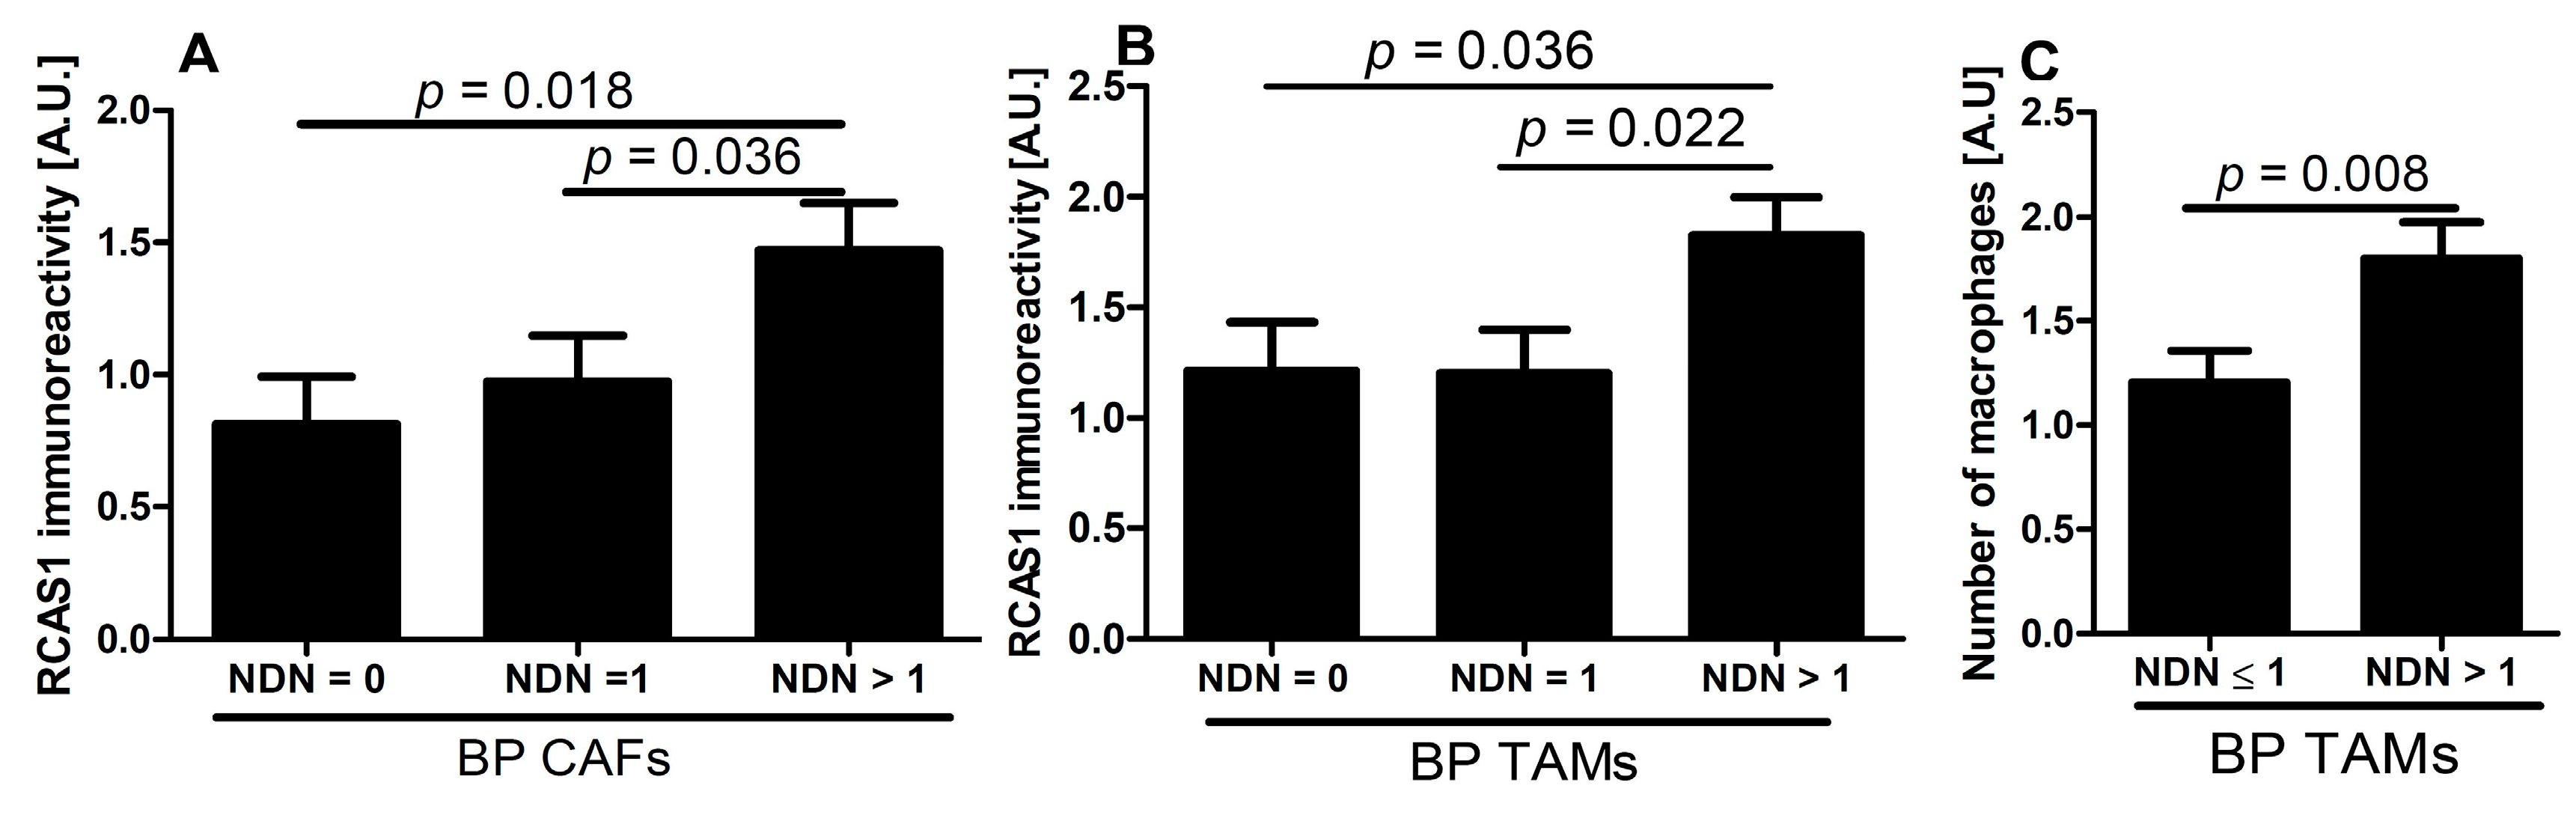
| BP CAFs | + | + | + | − | − | |
| p = 0.040 | p = 0.004 | p = 0.016 | ||||
| CP CAFs | − | − | – | − | − | |
| Number of cells | BP TAMs | + | − | + | – | − |
| p = 0.032 | p = 0.008 | |||||
| CP TAMs | − | − | – | − | − | |
| BP CAFs | − | − | – | + | − | |
| p = 0.035 | ||||||
| CP CAFs | − | − | – | – | − |
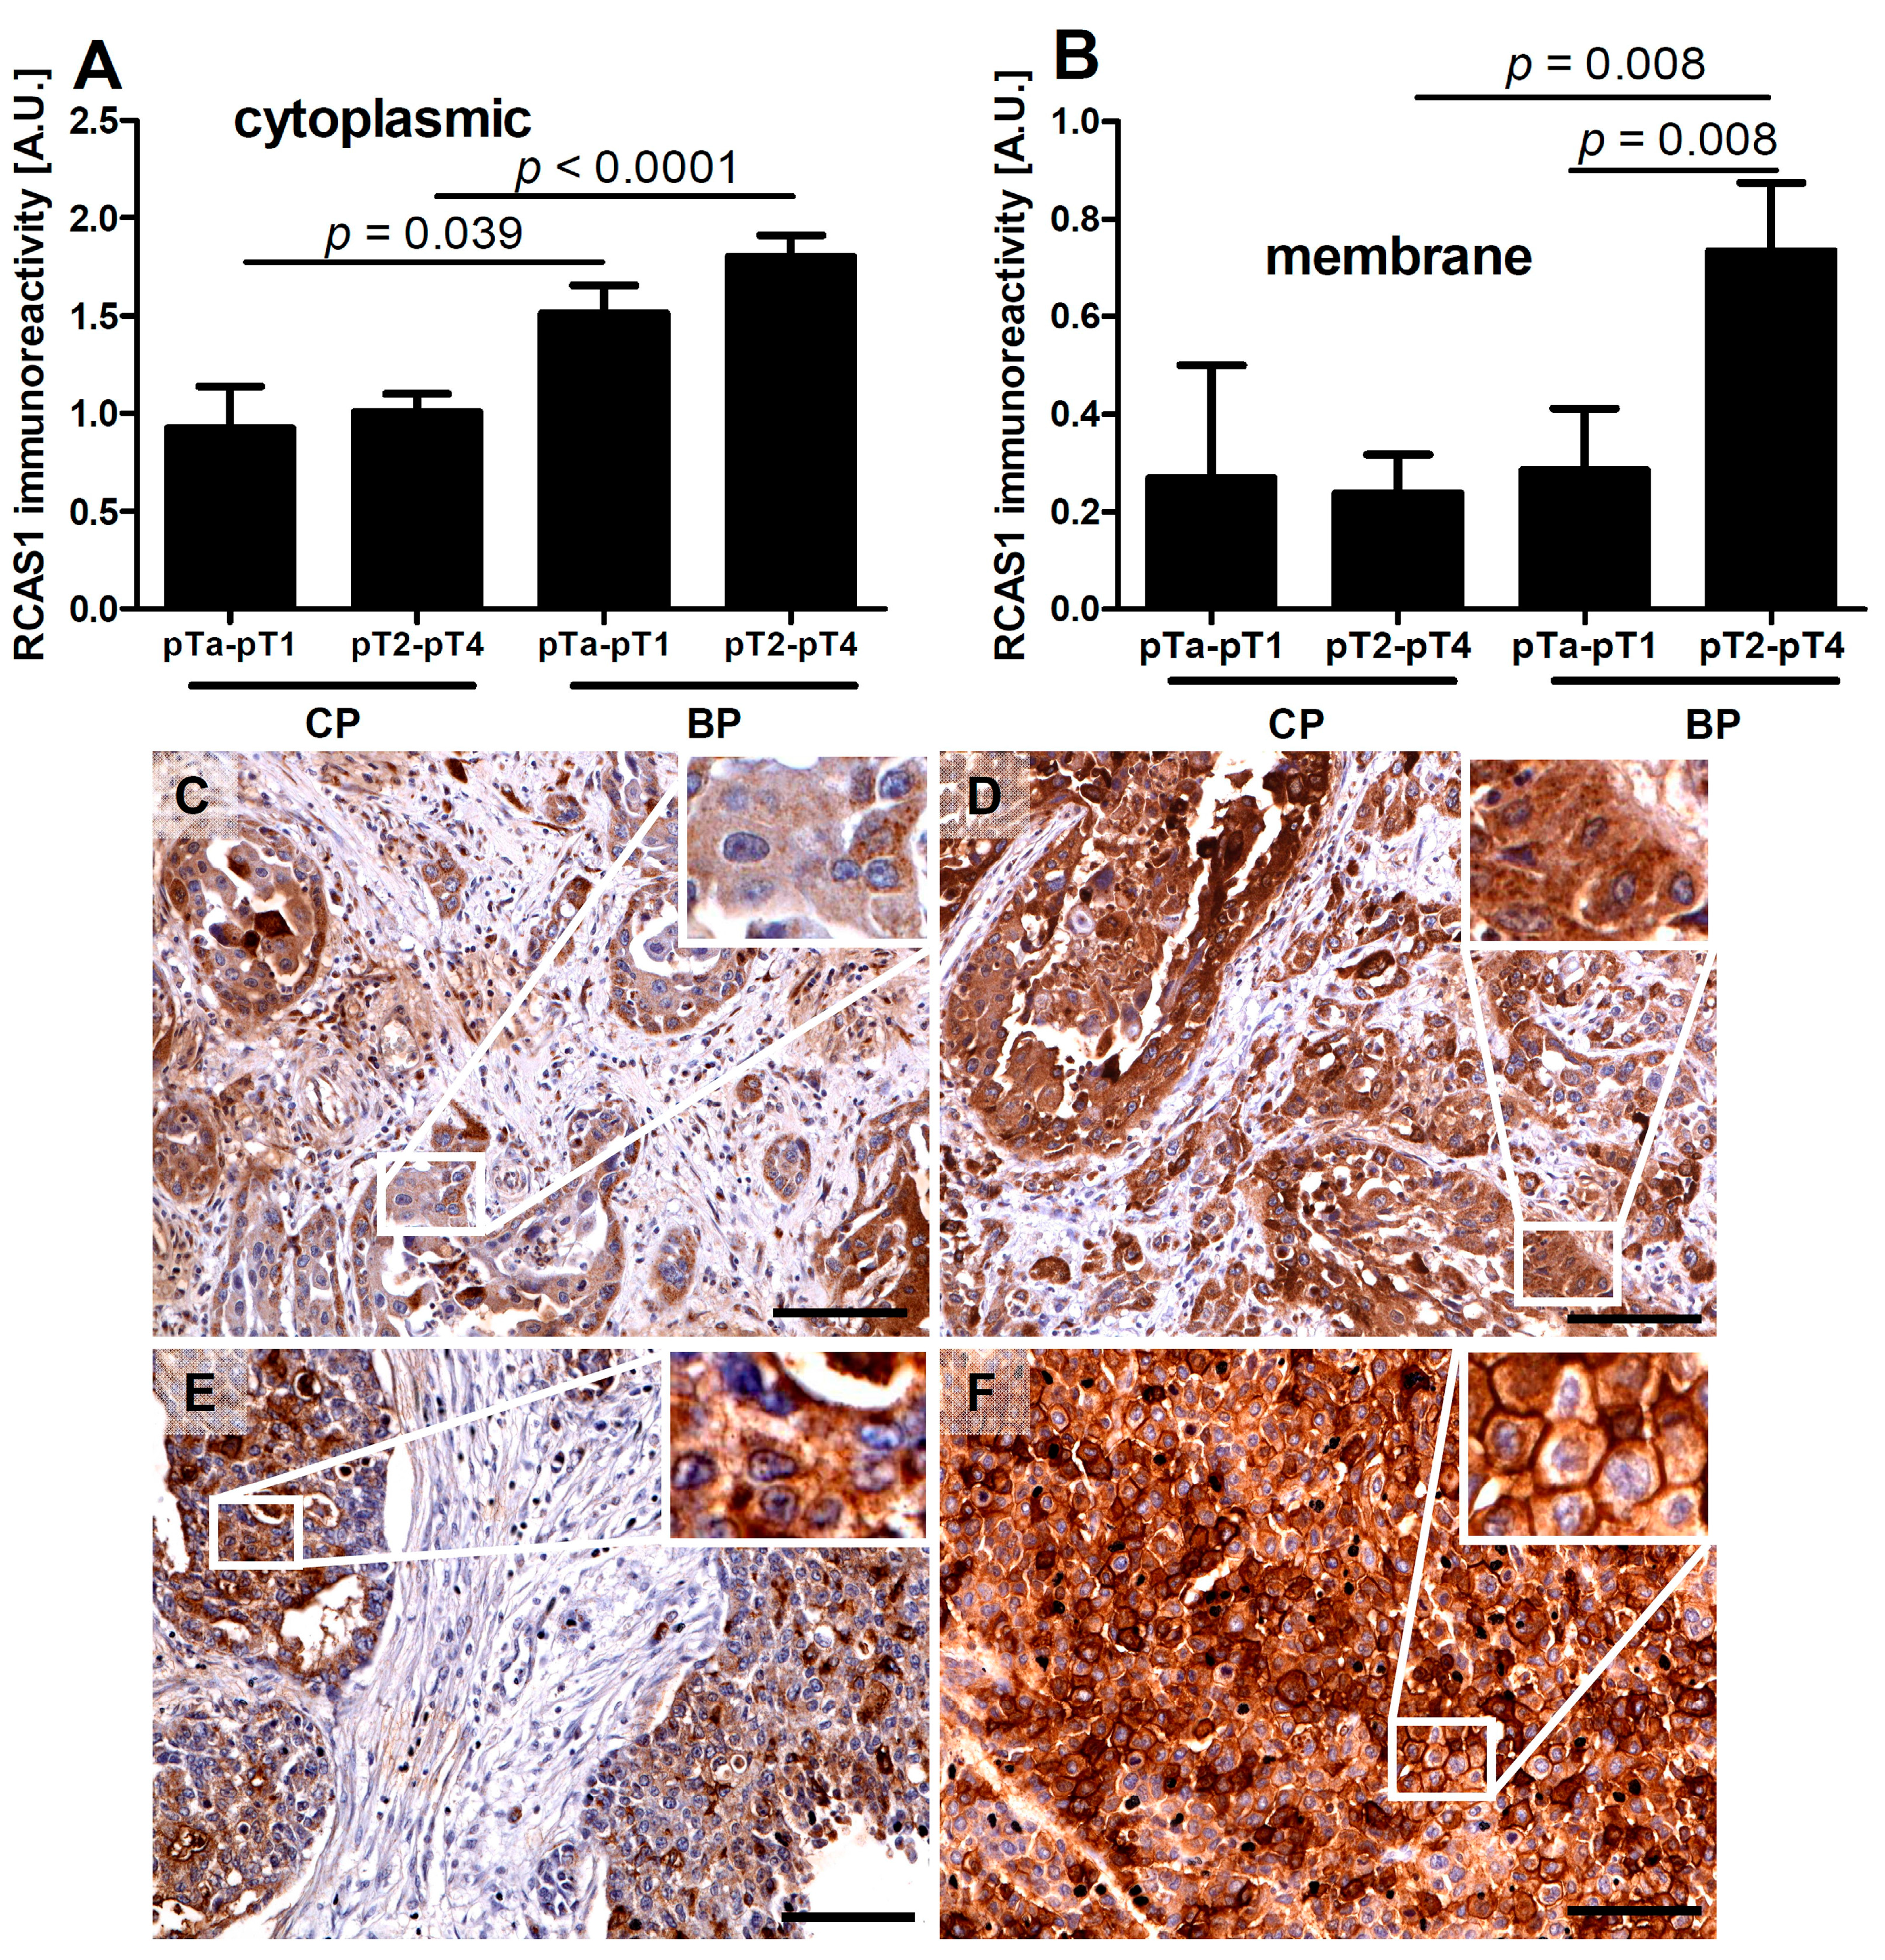
2.1.1. RCAS1 Immunoreactivity Relative to Tumor Stage
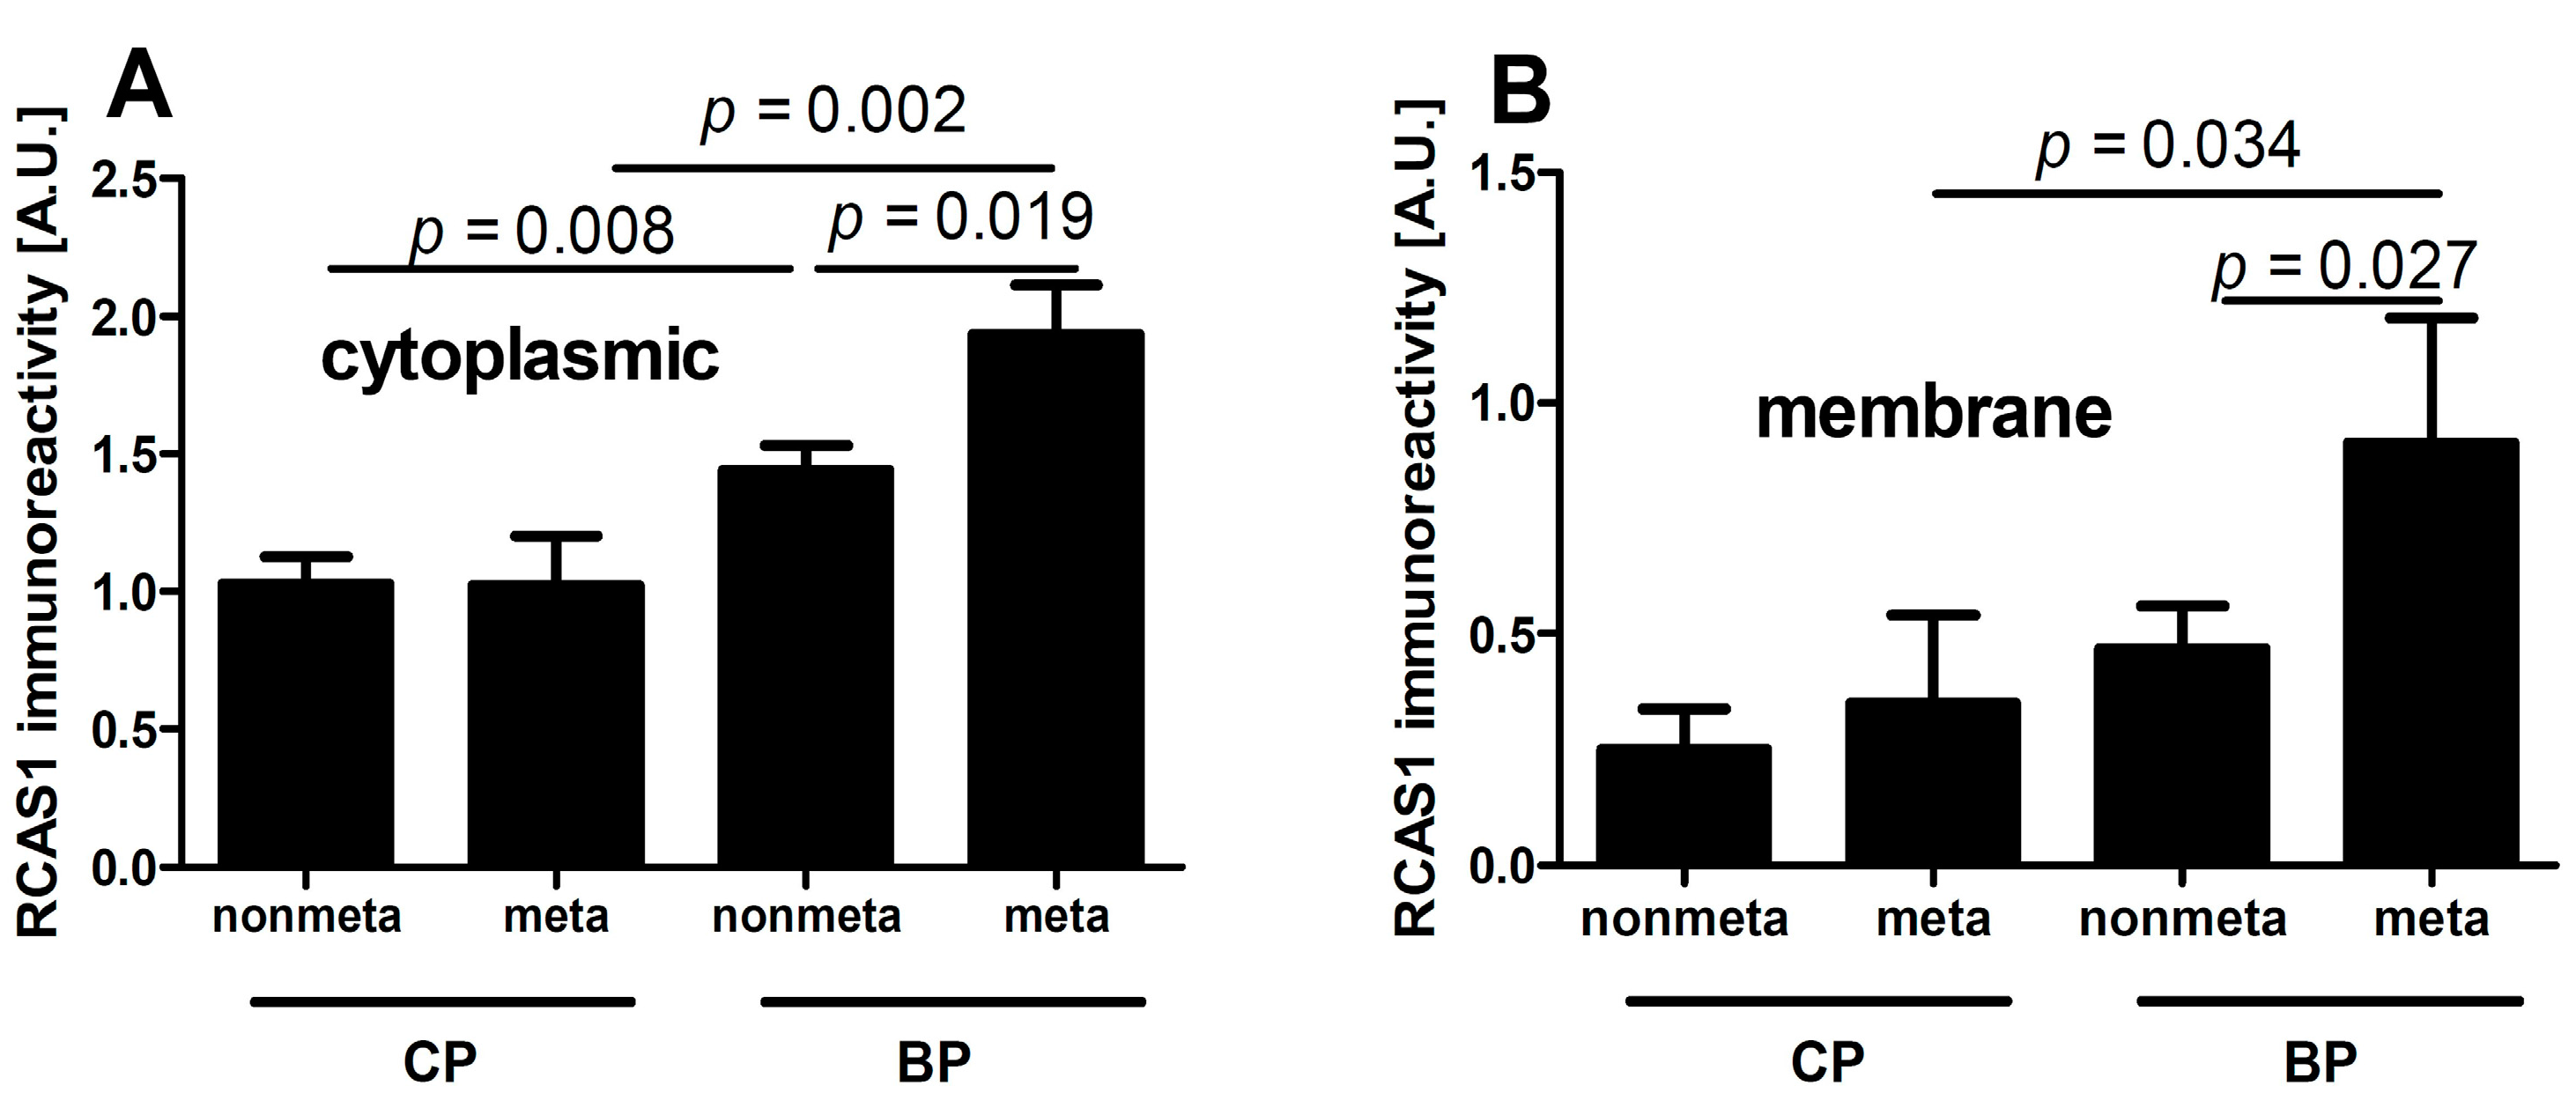
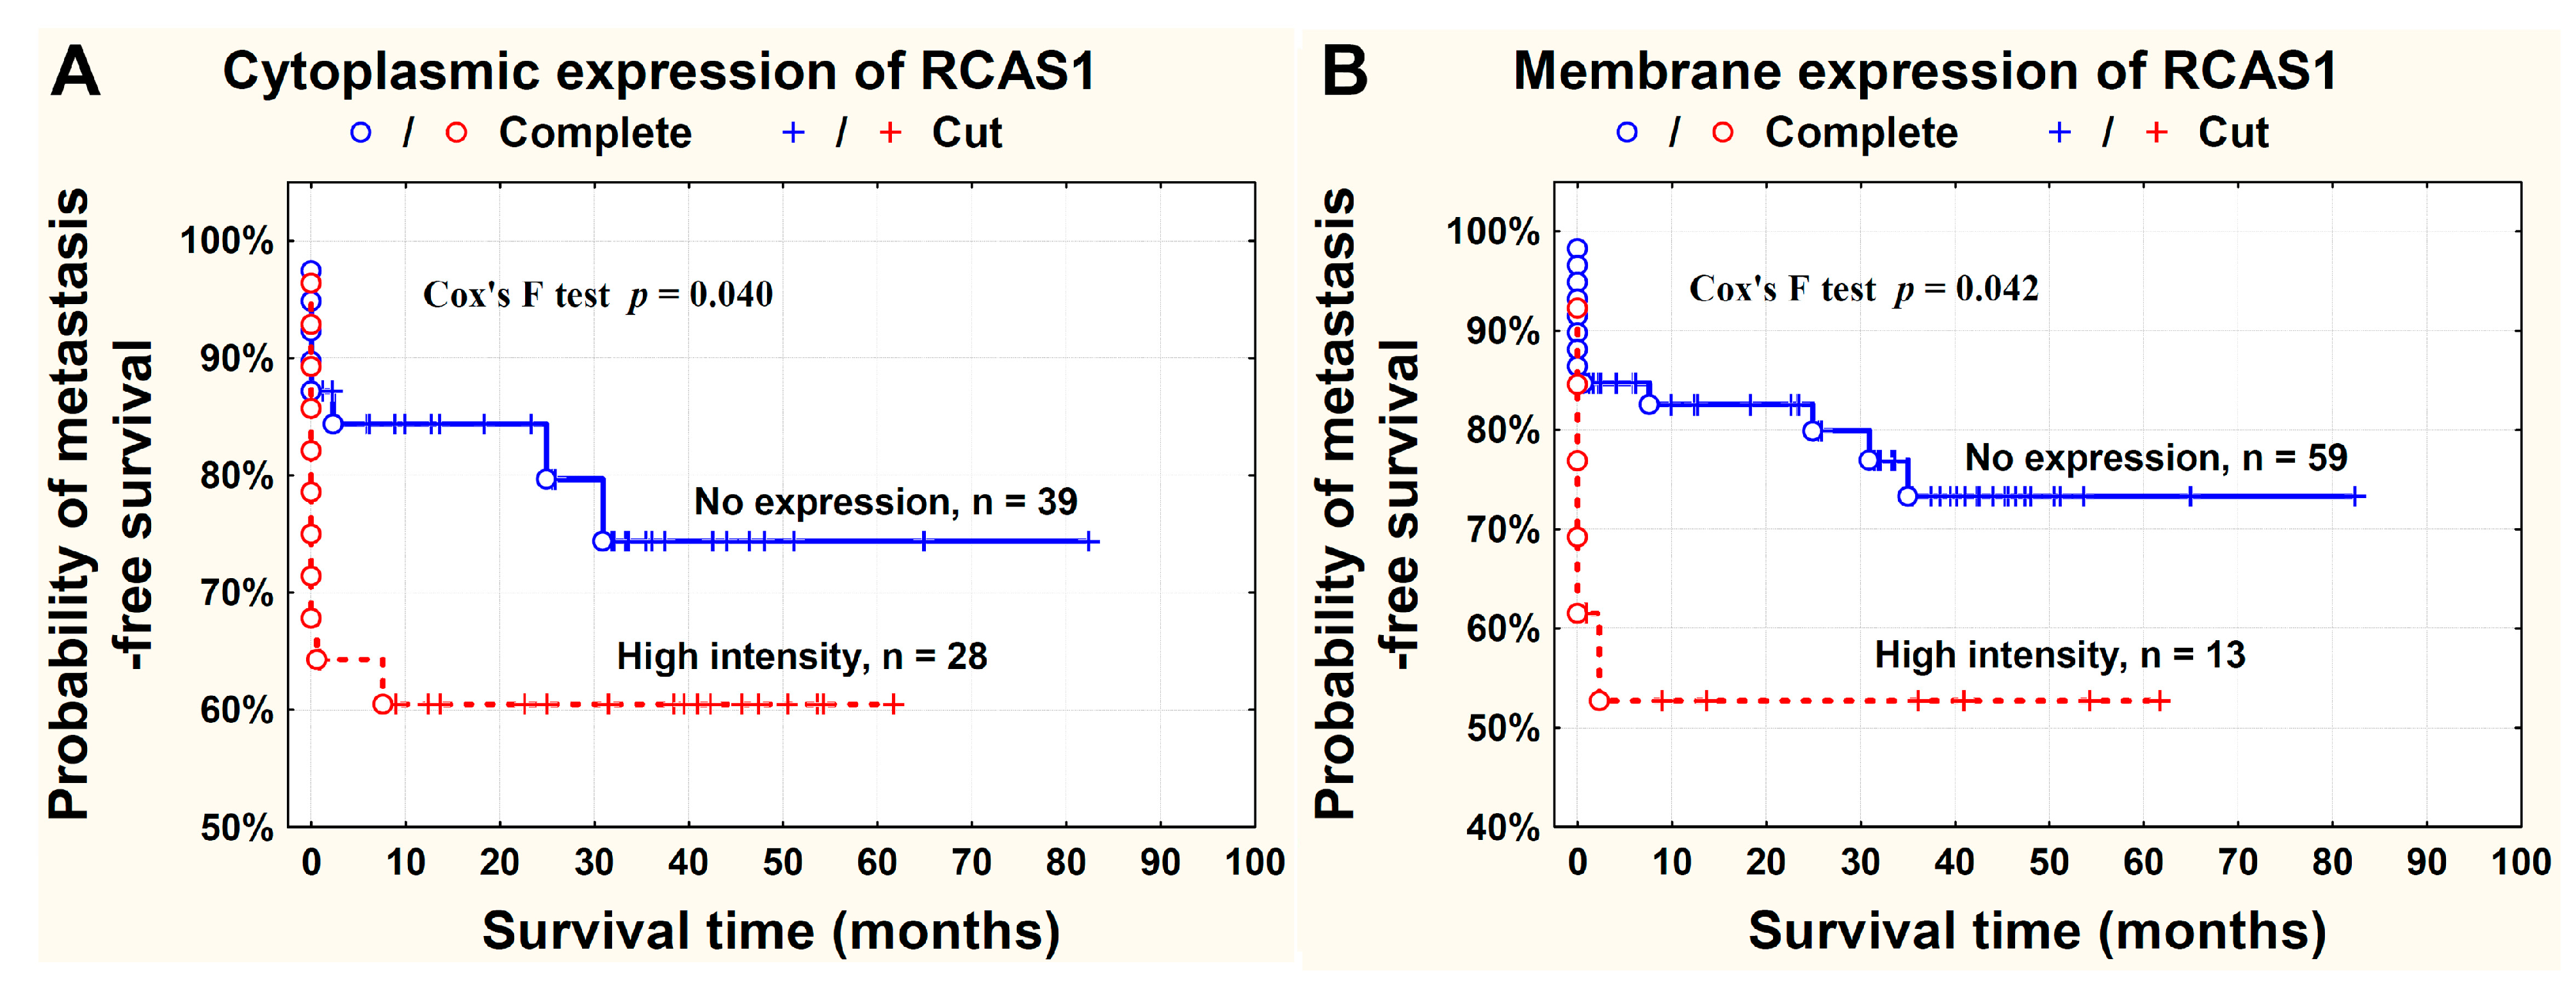
2.1.2. RCAS1 Immunoreactivity Relative to Metastasizing Capacity


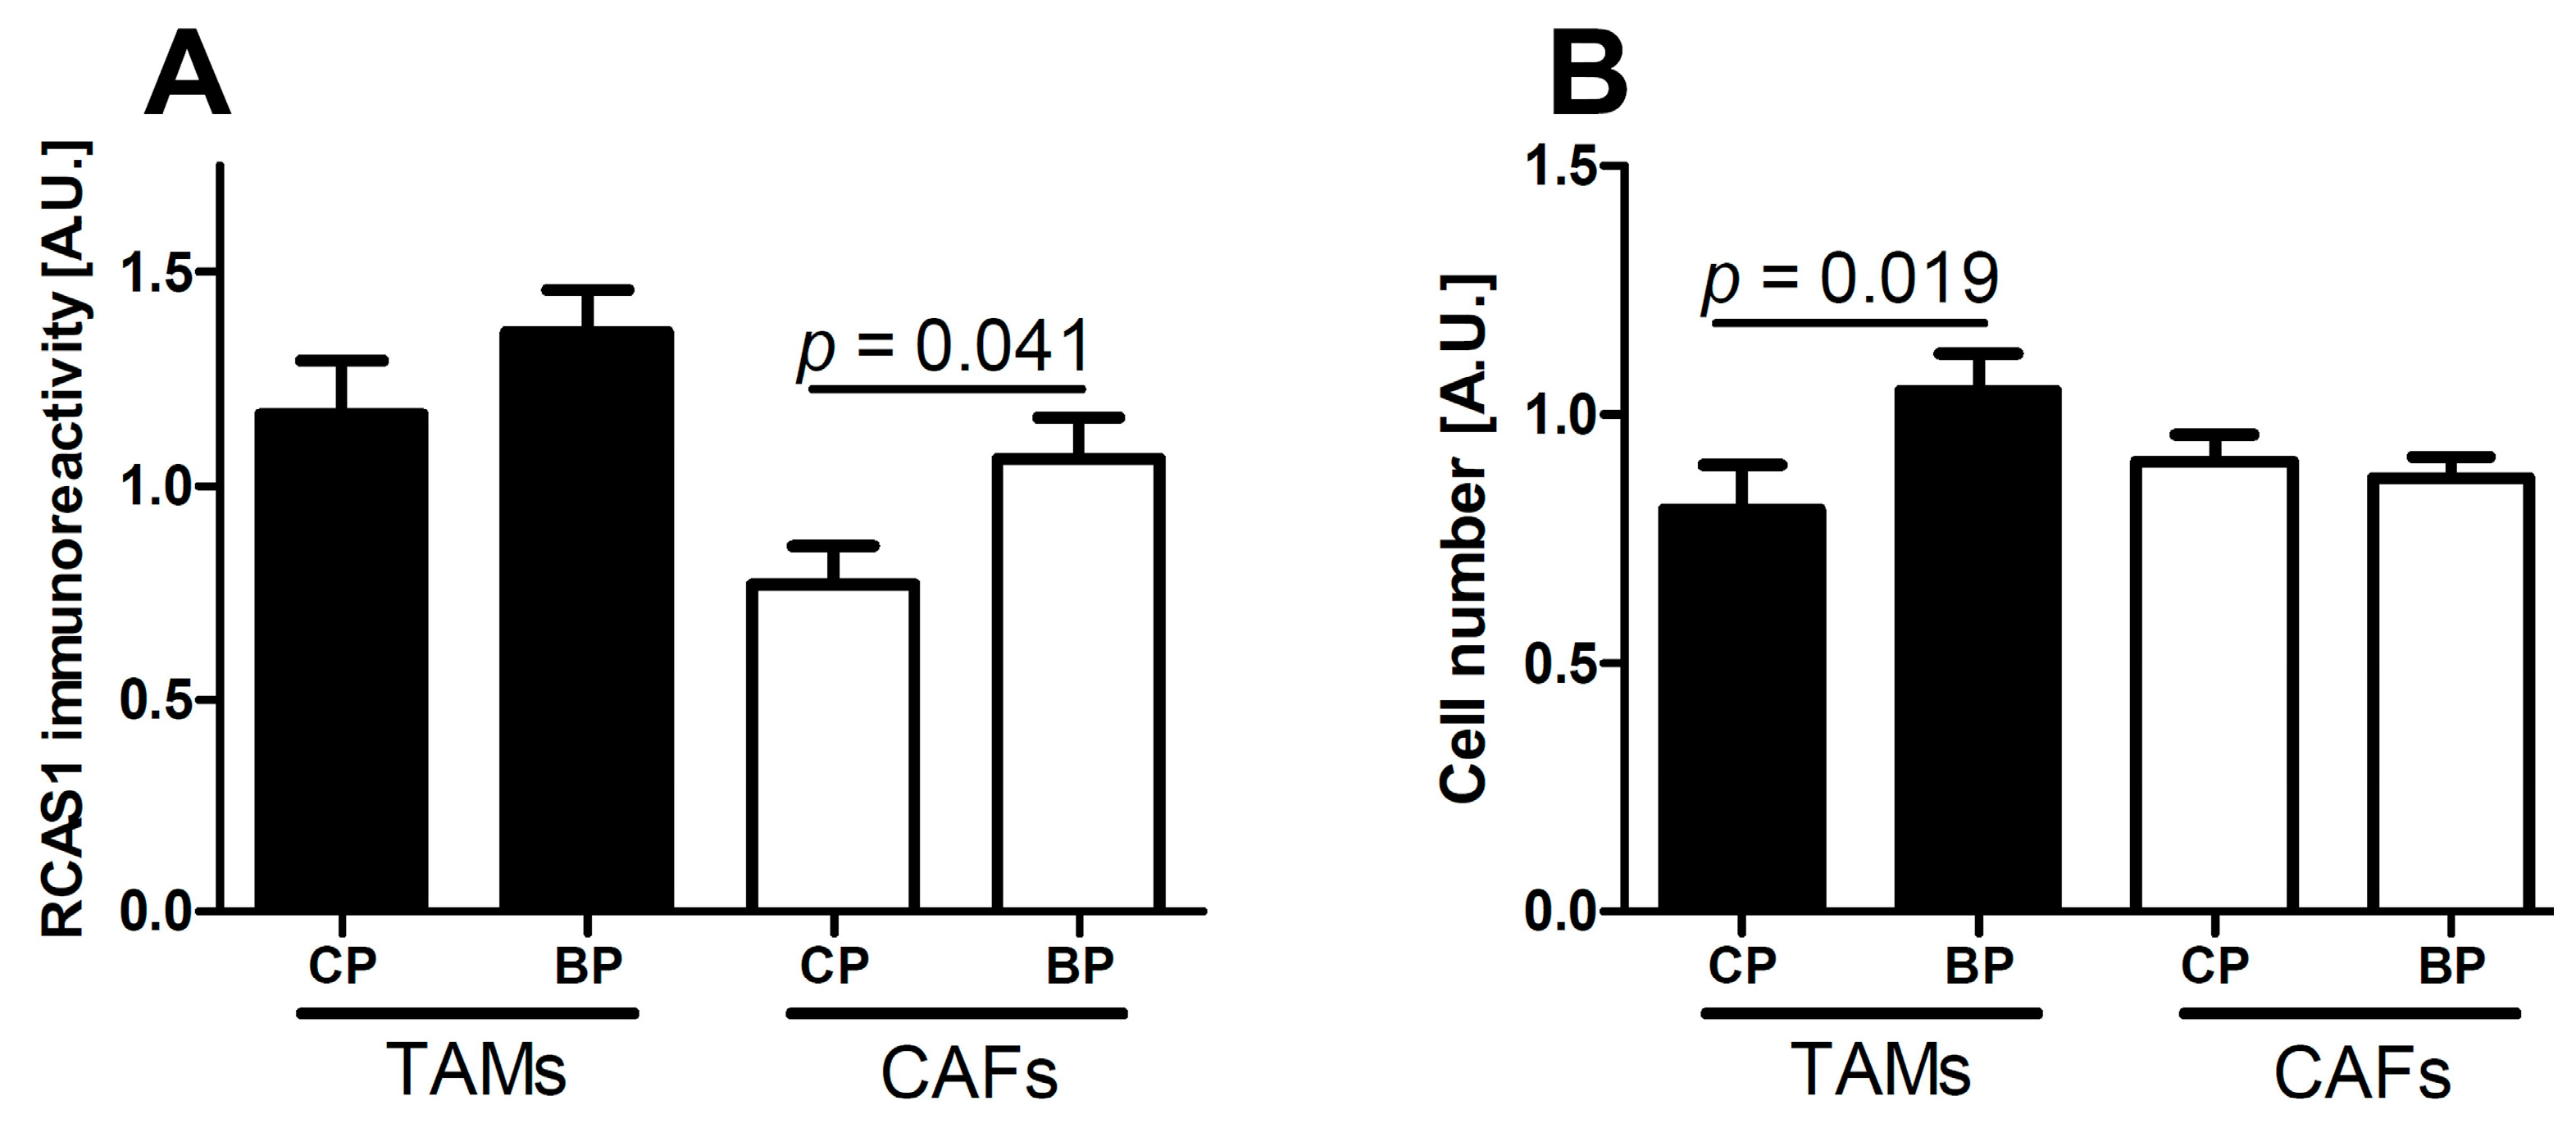
2.2. The Characteristics of TAMs and CAFs in the Microenvironment: RCAS1 Expression and Cell Number

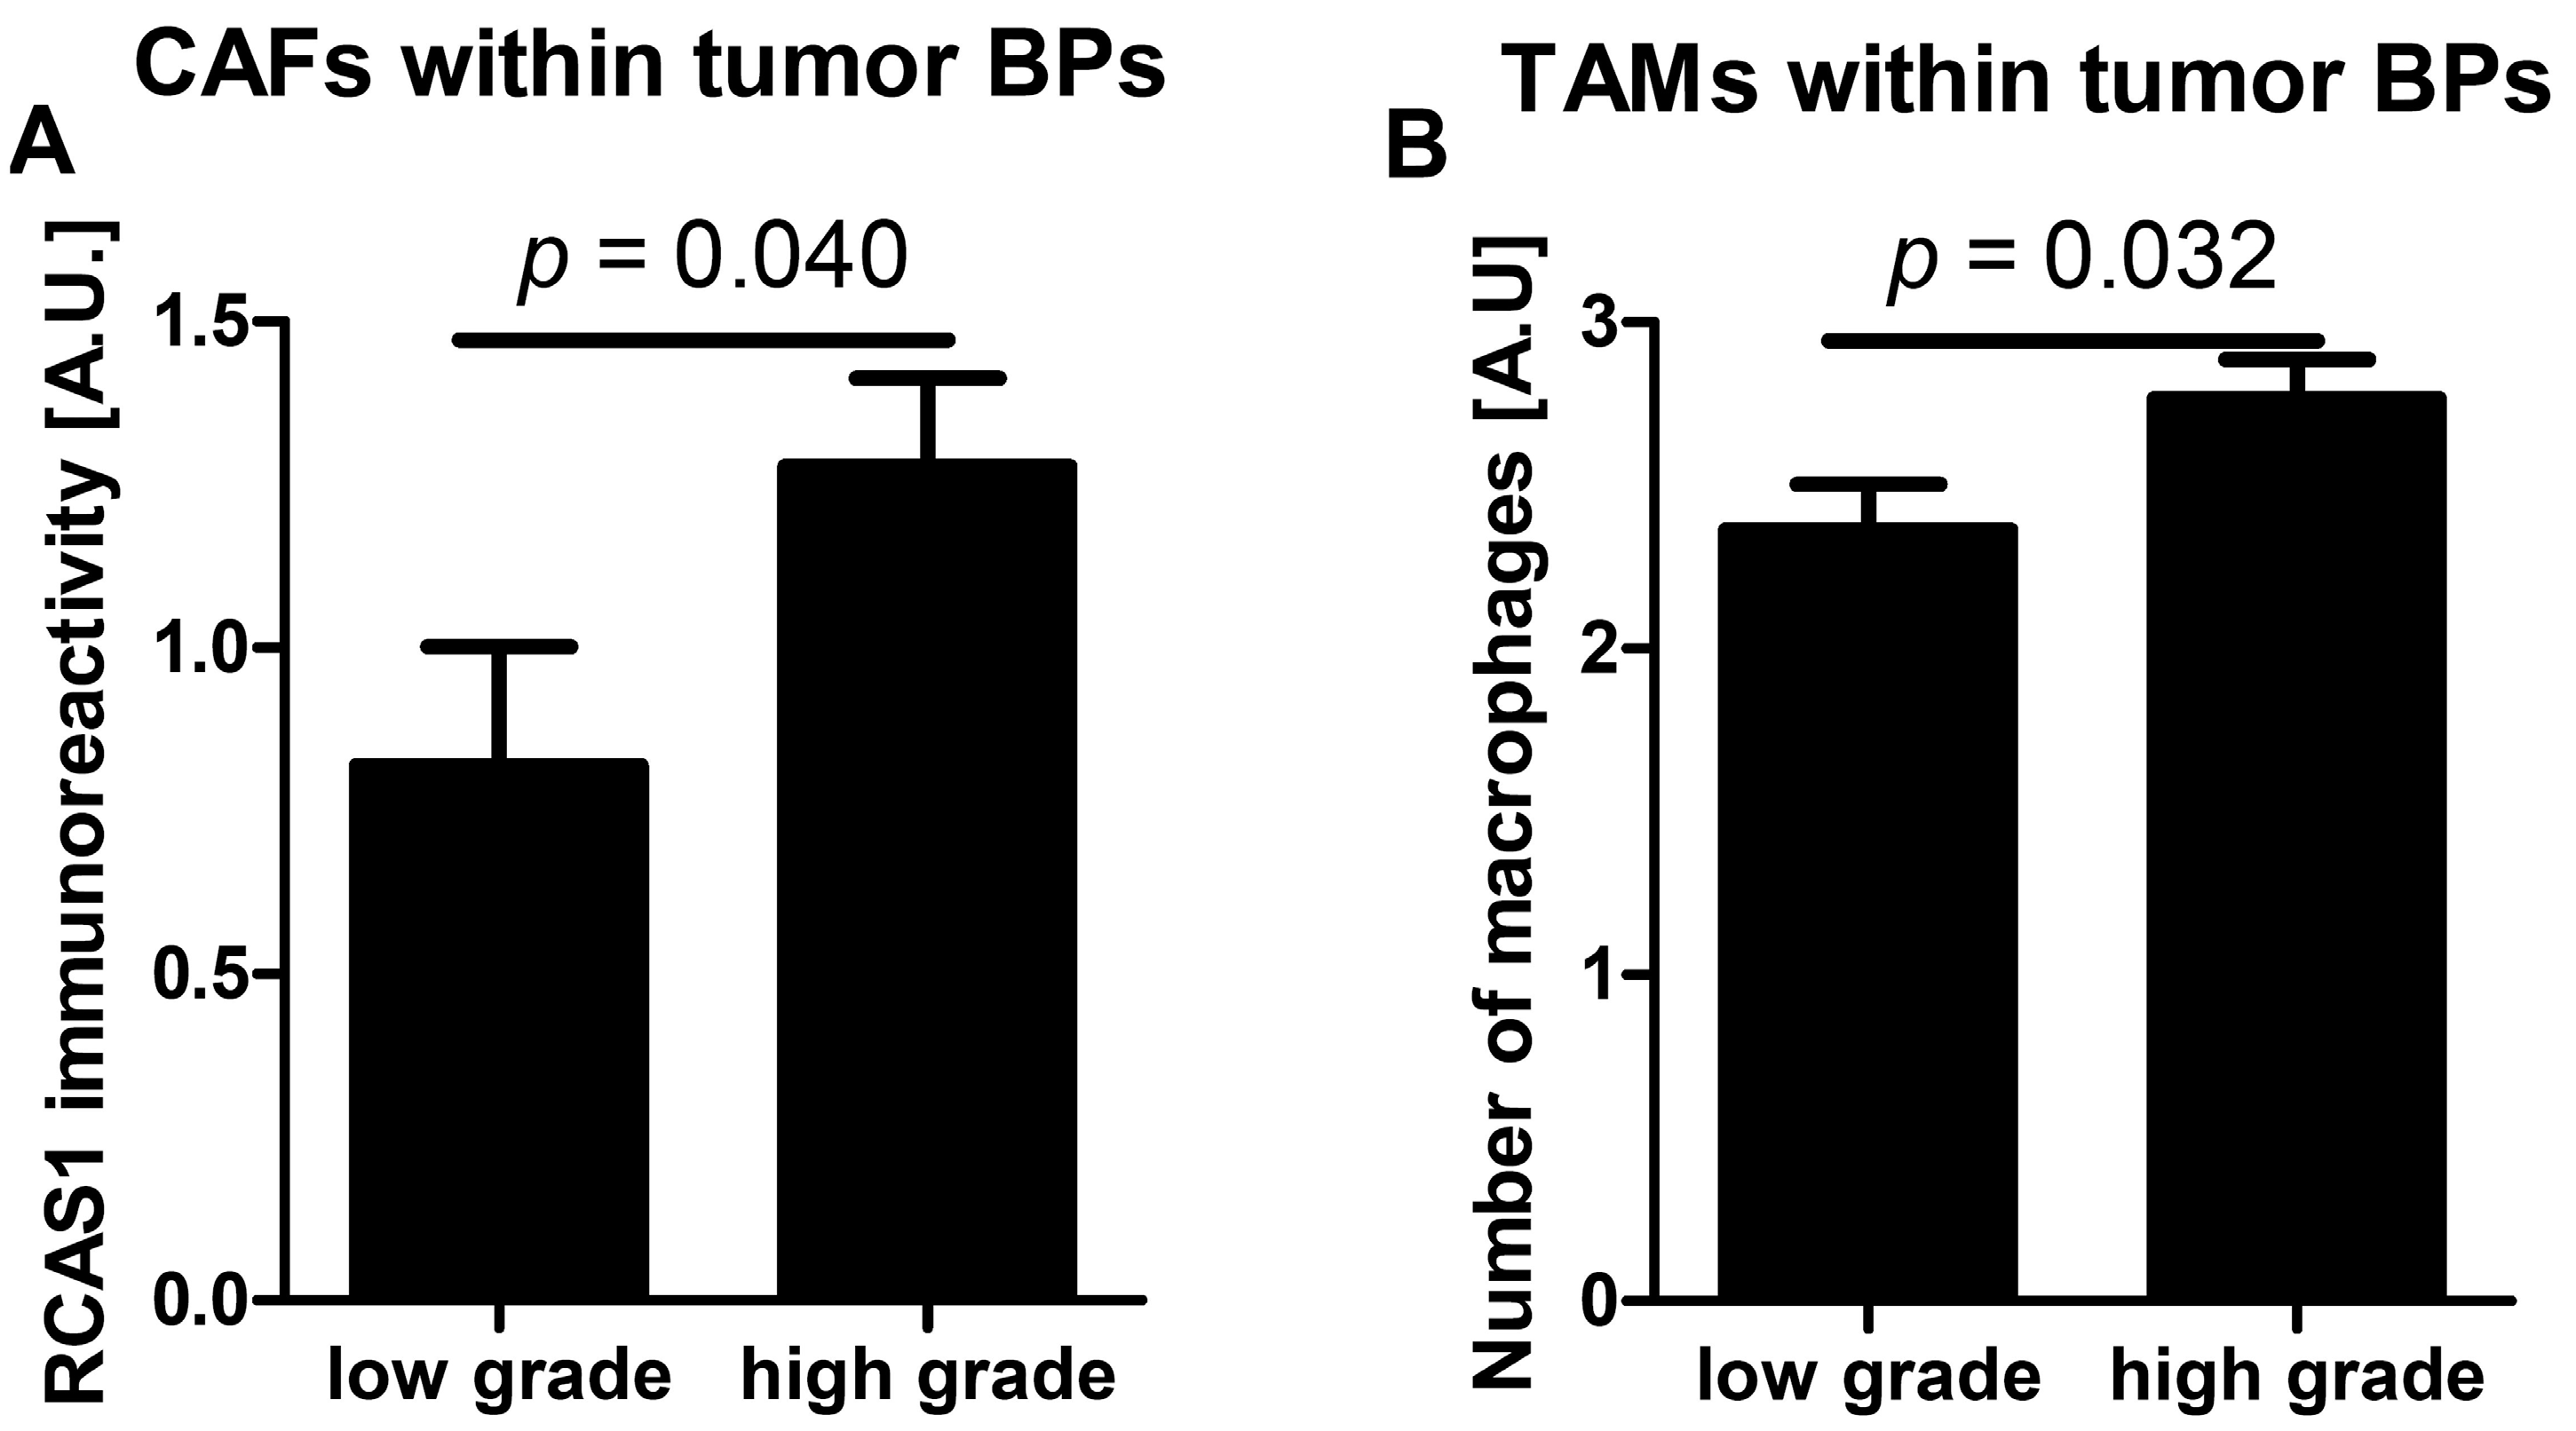
2.2.1. RCAS1 Immunoreactivity and Cell Number Relative to Tumor Grade

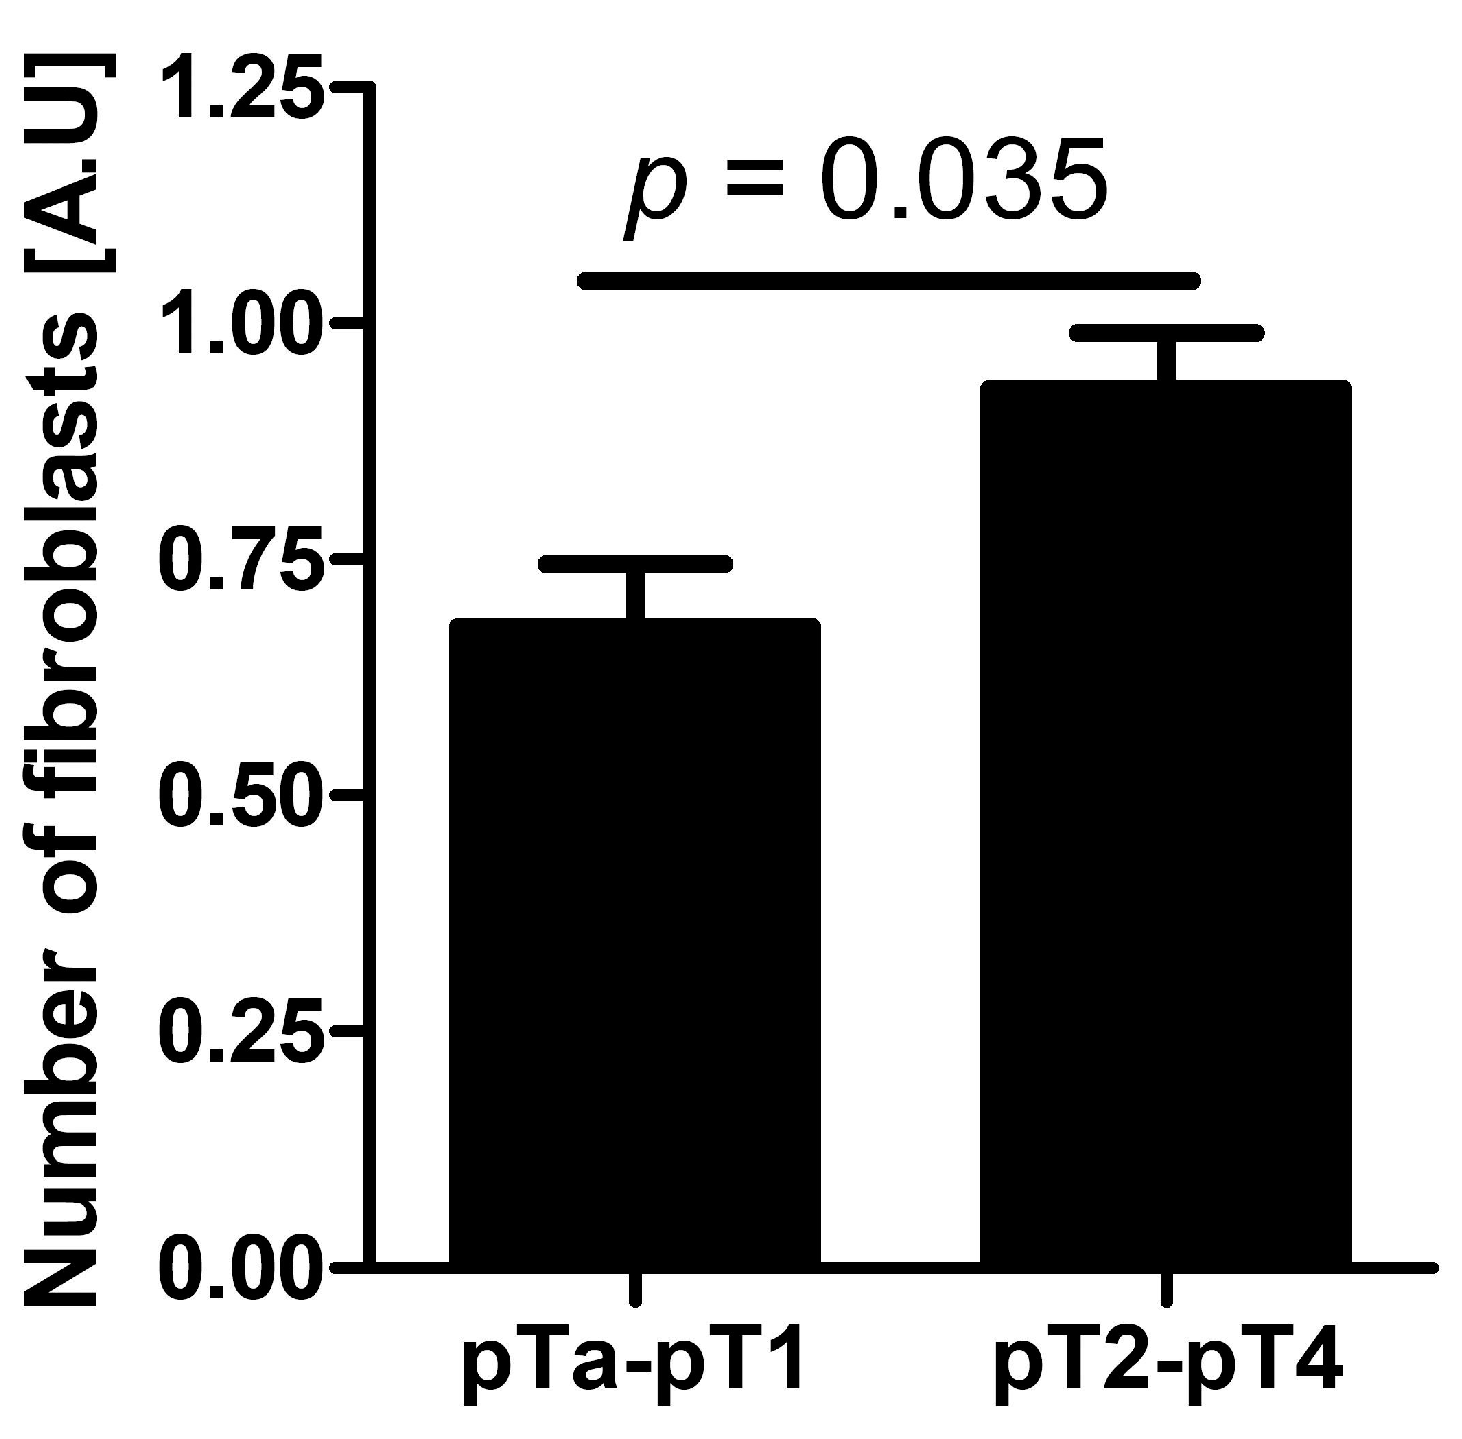
2.2.2. Cell Number Relative to Tumor Stage

2.2.3. RCAS1 Immunoreactivity and Cell Number Relative to TIT

2.2.4. RCAS1 Immunoreactivity Relative to NDN

3. Discussion
4. Experimental Section
| Feature | Number of Patients |
|---|---|
| pT | |
| pTa | 3 |
| pTis | 1 |
| pT1 | 16 |
| pT2 | 19 |
| pT3 | 32 |
| pT4 | 17 |
| pN | |
| pN0 | 64 |
| pN1–3 | 24 |
| Grade | |
| low grade | 20 |
| high grade | 67 |
| Recurrence | |
| no | 79 |
| yes | 9 |
| Second tumor | |
| absent | 61 |
| present | 27 |
| CP component | |
| absent (only BP present) | 24 |
| present | 64 |
| Concomitant in situ tumor | |
| absent | 76 |
| present | 12 |
| NDN | |
| NDN 0 | 35 |
| NDN 1 | 21 |
| NDN 2 | 21 |
| NDN ≥ 3 | 11 |
| CP TAMs | |
| absent | 25 |
| present | 39 * |
| BP TAMs | |
| absent | 18 |
| present | 70 |
| CP CAFs | |
| absent | 33 |
| present | 31 |
| BP CAFs | |
| absent | 35 |
| present | 53 |
4.1. Assessment of RCAS1 Expression
4.2. Definitions
4.2.1. Mitotic Index and CPs and BPs of Tumors
4.2.2. NDN of Tumors
4.2.3. TIT of Tumors

4.3. Identification of TAMs and CAFs and Assessment of Their Numbers
4.4. Statistical Analysis
5. Conclusions
Acknowledgments
Author Contributions
Conflicts of Interest
References
- Broders, A.C. Carcinoma: Grading and practical applications. Arch. Pathol. 1920, 2, 376–381. [Google Scholar]
- Henson, D.E. The histological grading of neoplasms. Arch. Pathol. Lab. Med. 1988, 112, 1091–1096. [Google Scholar]
- Amin, M.B. Histological variants of urothelial carcinoma: Diagnostic, therapeutic and prognostic implications. Mod. Pathol. 2009, 22, S96–S118. [Google Scholar]
- Holmang, S.; Johansson, S.L. The nested variant of transitional cell carcinoma—A rare neoplasm with poor prognosis. Scand. J. Urol. Nephrol. 2001, 35, 102–105. [Google Scholar]
- Johansson, S.L.; Borghede, G.; Holmang, S. Micropapillary bladder carcinoma: A clinicopathological study of 20 cases. J. Urol. 1999, 161, 1798–1802. [Google Scholar]
- Kim, S.P.; Frank, I.; Cheville, J.C.; Thompson, R.H.; Weight, C.J.; Thapa, P.; Boorjian, S.A. The impact of squamous and glandular differentiation on survival after radical cystectomy for urothelial carcinoma. J. Urol. 2012, 188, 405–409. [Google Scholar]
- Lopez-Beltran, A.; Pacelli, A.; Rothenberg, H.J.; Wollan, P.C.; Zincke, H.; Blute, M.L.; Bostwick, D.G. Carcinosarcoma and sarcomatoid carcinoma of the bladder: Clinicopathological study of 41 cases. J. Urol. 1998, 159, 1497–1503. [Google Scholar]
- Lopez, J.I.; Elorriaga, K.; Imaz, I.; Bilbao, F.J. Micropapillary transitional cell carcinoma of the urinary bladder. Histopathology 1999, 34, 561–562. [Google Scholar]
- Maranchie, J.K.; Bouyounes, B.T.; Zhang, P.L.; O’Donnell, M.A.; Summerhayes, I.C.; DeWolf, W.C. Clinical and pathological characteristics of micropapillary transitional cell carcinoma: A highly aggressive variant. J. Urol. 2000, 163, 748–751. [Google Scholar]
- Rink, M.; Robinson, B.D.; Green, D.A.; Cha, E.K.; Hansen, J.; Comploj, E.; Margulis, V.; Raman, J.D.; Ng, C.K.; Remzi, M.; et al. Impact of histological variants on clinical outcomes of patients with upper urinary tract urothelial carcinoma. J. Urol. 2012, 188, 398–404. [Google Scholar]
- Samaratunga, H.; Khoo, K. Micropapillary variant of urothelial carcinoma of the urinary bladder; a clinicopathological and immunohistochemical study. Histopathology 2004, 45, 55–64. [Google Scholar]
- Lopez-Beltran, A.; Sauter, G.; Gasser, T.; Hartmann, A.; Schmitz-Dräger, B.J.; Helpap, B.; Ayala, A.G.; Tamboli, P.; Knowles, M.A.; Sidransky, D.; et al. Tumours of the urinary system. Infiltrating urothelial carcinoma. In World Health Organization Classification of Tumours. Pathology and Genetics of Tumours of the Urinary System and Male Genital Organs; Eble, J.N., Sauter, G., Epstein, J.I., Sesterhenn, I.A., Eds.; IARC Press: Lyon, France, 2004; pp. 93–109. [Google Scholar]
- Wasco, M.J.; Daignault, S.; Zhang, Y.; Kunju, L.P.; Kinnaman, M.; Braun, T.; Lee, C.T.; Shah, R.B. Urothelial carcinoma with divergent histologic differentiation (mixed histologic features) predicts the presence of locally advanced bladder cancer when detected at transurethral resection. Urology 2007, 70, 69–74. [Google Scholar]
- Jozwicki, W.; Domaniewski, J.; Skok, Z.; Wolski, Z.; Domanowska, E.; Jozwicka, G. Usefulness of histologic homogeneity estimation of muscle-invasive urinary bladder cancer in an individual prognosis: A mapping study. Urology 2005, 66, 1122–1126. [Google Scholar]
- Jóźwicki, W.; Skok, Z.; Brożyna, A.; Siekiera, J.; Wolski, Z.; Domaniewski, J. Prognostic and diagnostic implications of histological differentiation in invasive urothelial cell carcinoma of the bladder: Variant or non-classic differentiation number. Cent. Eur. J. Urol. 2010, 63, 112–116. [Google Scholar]
- Domanowska, E.; Jozwicki, W.; Domaniewski, J.; Golda, R.; Skok, Z.; Wisniewska, H.; Sujkowska, R.; Wolski, Z.; Jozwicka, G. Muscle-invasive urothelial cell carcinoma of the human bladder: Multidirectional differentiation and ability to metastasize. Hum. Pathol. 2007, 38, 741–746. [Google Scholar]
- Jóźwicki, W.; Brożyna, A. Does stem cell marker Oct4a expression affect urothelial bladder cancer phenotype? In In Civilization and Social Diseases; Sokolowska, B., Ed.; Pope John II University in Biała Podlaska, Institute of Health: Biała Podlaska, Poland, 2010; pp. 43–53. [Google Scholar]
- Jóźwicki, W.; Brożyna, A.A.; Siekiera, J. Expression of OCT4A: The first step to the next stage of urothelial bladder cancer progression. Int. J. Mol. Sci. 2014, 15, 16069–16082. [Google Scholar]
- Jozwicki, W.; Windorbska, W.; Brożyna, A.A.; Jochymski, C.; Basta, P.; Sikora, J.; Stasienko, E.; Dutsch-Wicherek, M.; Koper, K.; Wicherek, L. The analysis of receptor-binding cancer antigen expressed on SiSo cells (RCAS1) immunoreactivity within the microenvironment of the ovarian cancer lesion relative to the applied therapeutic strategy. Cell Tissue Res. 2011, 345, 405–414. [Google Scholar]
- Dutsch-Wicherek, M.; Lazar, A.; Tomaszewska, R.; Kazmierczak, W.; Wicherek, L. Analysis of metallothionein and vimentin immunoreactivity in pharyngeal squamous cell carcinoma and its microenvironment. Cell Tissue Res. 2013, 352, 341–349. [Google Scholar]
- Dutsch-Wicherek, M. RCAS1, MT, and vimentin as potential markers of tumor microenvironment remodeling. Am. J. Reprod. Immunol. 2010, 63, 181–188. [Google Scholar]
- Ronnov-Jessen, L.; Petersen, O.W.; Bissell, M.J. Cellular changes involved in conversion of normal to malignant breast: Importance of the stromal reaction. Physiol. Rev. 1996, 76, 69–125. [Google Scholar]
- Rowley, D.R. What might a stromal response mean to prostate cancer progression? Cancer Metastasis Rev. 1998, 17, 411–419. [Google Scholar]
- Nakashima, M.; Sonoda, K.; Watanabe, T. Inhibition of cell growth and induction of apoptotic cell death by the human tumor-associated antigen RCAS1. Nat. Med. 1999, 5, 928–942. [Google Scholar]
- Darrasse-Jèze, G.; Bergot, A.S.; Durgeau, A.; Billiard, F.; Salomon, B.L.; Cohen, J.L.; Bellier, B.; Podsypanina, K.; Klatzmann, D. Tumor emergence is sensed by self-specific CD44hi memory Tregs that create a dominant tolerogenic environment for tumors in mice. J. Clin. Investig. 2009, 119, 2648–2662. [Google Scholar]
- Chen, T.; Wang, H.; Zhang, Z.; Li, Q.; Yan, K.; Tao, Q.; Ye, Q.; Xiong, S.; Wang, Y.; Zhai, Z. A novel cellular senescence gene, SENEX, is involved in peripheral regulatory t cells accumulation in aged urinary bladder cancer. PLoS One 2014, 9, e87774. [Google Scholar]
- Sonoda, K.; Nakashima, M.; Kaku, T.; Kamura, T.; Nakano, H.; Watanabe, T. A novel tumor-associated antigen expressed in human uterine and ovarian carcinomas. Cancer 1996, 77, 1501–1509. [Google Scholar]
- Sonoda, K.; Miyamoto, S.; Nakashima, M.; Wake, N. The biological role of the unique molecule RCAS1: A bioactive marker that induces connective tissue remodeling and lymphocyte apoptosis. Front. Biosci. 2008, 13, 1106–1116. [Google Scholar]
- Kato, H.; Nakajima, M.; Masuda, N.; Faried, A.; Sohda, M.; Fukai, Y.; Miyazaki, T.; Fukuchi, M.; Tsukada, K.; Kuwano, H. Expression of RCAS1 in esophageal squamous cell carcinoma is associated with a poor prognosis. J. Surg. Oncol. 2005, 90, 89–94. [Google Scholar]
- Nakakubo, Y.; Hida, Y.; Miyamoto, M.; Hashida, H.; Oshikiri, T.; Kato, K.; Suzuoki, M.; Hiraoka, K.; Ito, T.; Morikawa, T.; et al. The prognostic significance of RCAS1 expression in squamous cell carcinoma of the oesophagus. Cancer Lett. 2002, 177, 101–105. [Google Scholar]
- Akashi, T.; Oimomi, H.; Nishiyama, K.; Nakashima, M.; Arita, Y.; Sumii, T.; Kimura, T.; Ito, T.; Nawata, H.; Watanabe, T. Expression and diagnostic evaluation of the human tumor-associated antigen RCAS1 in pancreatic cancer. Pancreas 2003, 26, 49–55. [Google Scholar]
- Dutsch-Wicherek, M.; Lazar, A.; Tomaszewska, R. The potential role of MT and vimentin immunoreactivity in the remodeling of the microenvironment of parotid adenocarcinoma. Cancer Microenviron. 2011, 4, 105–113. [Google Scholar]
- Toyoshima, T.; Nakamura, S.; Kumamaru, W.; Kawamura, E.; Ishibashi, H.; Hayashida, J.N.; Moriyama, M.; Ohyama, Y.; Sasaki, M.; Shirasuna, K. Expression of tumor-associated antigen RCAS1 and its possible involvement in immune evasion in oral squamous cell carcinoma. J. Oral Pathol. Med. 2006, 35, 361–368. [Google Scholar]
- Tsujitani, S.; Saito, H.; Oka, S.; Sakamoto, T.; Kanaji, S.; Tatebe, S.; Ikeguchi, M. Prognostic significance of RCAS1 expression in relation to the infiltration of dendritic cells and lymphocytes in patients with esophageal carcinoma. Dig. Dis. Sci. 2007, 52, 549–554. [Google Scholar]
- Noguchi, K.; Enjoji, M.; Nakamuta, M.; Nakashima, M.; Nishi, H.; Choi, I.; Taguchi, K.; Kotoh, K.; Shimada, M.; Sugimachi, K.; et al. Expression of a tumor-associated antigen RCAS1 in hepatocellular carcinoma. Cancer Lett. 2001, 168, 197–202. [Google Scholar]
- Ikeguchi, M.; Hirooka, Y.; Kaibara, N. Gene and protein expression of RCAS1 in hepatocellular carcinoma. Anticancer Res. 2003, 23, 4967–4971. [Google Scholar]
- Suzuoki, M.; Hida, Y.; Miyamoto, M.; Oshikiri, T.; Hiraoka, K.; Nakakubo, Y.; Shinohara, T.; Itoh, T.; Okushiba, S.; Kondo, S.; et al. RCAS1 expression as a prognostic factor after curative surgery for extrahepatic bile duct carcinoma. Ann. Surg. Oncol. 2002, 9, 388–393. [Google Scholar]
- Fukuda, K.; Tsujitani, S.; Maeta, Y.; Yamaguchi, K.; Ikeguchi, M.; Kaibara, N. The expression of RCAS1 and tumor infiltrating lymphocytes in patients with T3 gastric carcinoma. Gastric Cancer 2002, 5, 220–227. [Google Scholar]
- Leelawat, K.; Watanabe, T.; Nakajima, M.; Tujinda, S.; Suthipintawong, C.; Leardkamolkarn, V. Upregulation of tumour associated antigen RCAS1 is implicated in high stages of colorectal cancer. J. Clin. Pathol. 2003, 56, 764–768. [Google Scholar]
- Matsushima, T.; Nakashima, N.; Oshima, K.; Abe, Y.; Nishimura, J.; Nawata, H.; Watanabe, T.; Muta, K. Receptor binding cancer antigen expressed on SiSo cells, a novel regulator of apoptosis of erythroid progenitor cells. Blood 2001, 15, 313–321. [Google Scholar]
- Pollard, J.W. Tumor-educated macrophages promote tumor progression and metastasis. Nat. Rev. Cancer 2004, 4, 71–78. [Google Scholar]
- Polverini, P.; Leibovich, S.J. Induction of neovascularization in vivo and endothelial proliferation in vitro by tumor-associated macrophages. Lab. Investig. 1984, 51, 635–642. [Google Scholar]
- Richter, G.; Kruger-Krasagakes, S.; Hein, G.; Huls, C.; Schmitt, E.; Diamantstein, T.; Blankenstein, T. Interleukin 10 gene transfected into Chinese hamster ovary cells prevents tumor growth and macrophage infiltration. Cancer Res. 1993, 53, 4134–4137. [Google Scholar]
- Kessenbrock, K.; Plaks, V.; Werb, Z. Matrix metalloproteinases: Regulators of the tumor microenvironment. Cell 2010, 141, 52–67. [Google Scholar]
- Dutsch-Wicherek, M.; Lazar, A.; Tomaszewska, R. The involvement of RCAS1 in creating a suppressive tumor microenvironment in patients with salivary gland adenocarcinoma. Cancer Microenviron. 2011, 4, 13–21. [Google Scholar]
- Fuyuhiro, Y.; Yashiro, M.; Noda, S.; Kashiwagi, S.; Matsuoka, J.; Doi, Y.; Kato, Y.; Hasegawa, T.; Sawada, T.; Hirakawa, K. Upregulation of cancer-associated myofibroblasts by TGF-β from scirrhous gastric carcinoma cells. Br. J. Cancer 2011, 105, 996–1001. [Google Scholar]
- Casey, T.M.; Eneman, J.; Crocker, A.; White, J.; Tessitore, J.; Stanley, M.; Harlow, S.; Bunn, J.Y.; Weaver, D.; Muss, H.; et al. Cancer associated fibroblasts stimulated by transforming growth factor beta1 (TGF-β1) increase invasion rate of tumor cells: A population study. Breast Cancer Res. Treat. 2008, 110, 39–49. [Google Scholar]
- Cirri, P.; Chiarugi, P. Cancer associated fibroblasts: The dark side of the coin. Am. J. Cancer Res. 2011, 1, 482–497. [Google Scholar]
- Orimo, A.; Gupta, P.B.; Sgroi, D.C.; Arenzana-Seisdedos, F.; Delaunay, T.; Naeem, R.; Carey, V.J.; Richardson, A.L.; Weinberg, R.A. Stromal fibroblasts present in invasive human breast carcinomas promote tumor growth and angiogenesis through elevated SDF-1/CXCL12 secretion. Cell 2005, 121, 335–348. [Google Scholar]
- Apostolova, M.D.; Cherian, M.G. Nuclear localization of metallothionein during cell proliferation and differentiation. Cell. Mol. Biol. 2000, 46, 347–356. [Google Scholar]
- Tsai, T.C.; Yu, C.H.; Cheng, S.J.; Liu, B.Y.; Chen, H.M.; Chiang, C.P. Expression of RCAS1 is significantly associated with the progression and prognosis of oral squamous cell carcinomas in Taiwan. Oral Oncol. 2008, 44, 759–766. [Google Scholar]
- Sobin, L.H.; Gospodarowicz, M.K.; Wittekind, C. TNM Classification of Malignant Tumours,, 7th ed.; Wiley-Blackwell. A John Willey & Sons Ltd. Publication: Chichester, UK, 2009; pp. 262–265. [Google Scholar]
- Wittekind, C.; Compton, C.C.; Brierley, J.; Sobin, L.H. TNM Supplement: A Commentary on Uniform Use, 4th ed.; Wiley-Blackwell. A John Willey & Sons Ltd. Publication: Chichester, UK, 2012; pp. 107–109. [Google Scholar]
- Witjes, J.A.; Compérat, E.; Cowan, N.C.; de Santis, M.; Gakis, G.; Lebret, T.; Ribal, M.J.; van der Heijden, A.G.; Sherif, A. European Association of Urology: EAU guidelines on muscle-invasive and metastatic bladder cancer: Summary of the 2013 guidelines. Eur. Urol. 2014, 65, 778–792. [Google Scholar]
- Dutsch-Wicherek, M.; Windorbska, W.; Jozwicki, W.; Kazmierczak, H. The involvement of RCAS1 in creating a suppressive tumor microenvironment in patients with pharyngeal squamous cell carcinoma. Otolaryngol. Pol. 2012, 66, 49–59. [Google Scholar]
- Fu, Z.; Zuo, Y.; Li, D.; Xu, W.; Li, D.; Chen, H.; Zheng, S. The crosstalk: Tumor-infiltrating lymphocytes rich in regulatory T cells suppressed cancer-associated fibroblasts. Acta Oncol. 2013, 52, 1760–1770. [Google Scholar]
© 2015 by the authors; licensee MDPI, Basel, Switzerland. This article is an open access article distributed under the terms and conditions of the Creative Commons Attribution license (http://creativecommons.org/licenses/by/4.0/).
Share and Cite
Jóźwicki, W.; Brożyna, A.A.; Siekiera, J.; Slominski, A.T. Expression of RCAS1 Correlates with Urothelial Bladder Cancer Malignancy. Int. J. Mol. Sci. 2015, 16, 3783-3803. https://doi.org/10.3390/ijms16023783
Jóźwicki W, Brożyna AA, Siekiera J, Slominski AT. Expression of RCAS1 Correlates with Urothelial Bladder Cancer Malignancy. International Journal of Molecular Sciences. 2015; 16(2):3783-3803. https://doi.org/10.3390/ijms16023783
Chicago/Turabian StyleJóźwicki, Wojciech, Anna A. Brożyna, Jerzy Siekiera, and Andrzej T. Slominski. 2015. "Expression of RCAS1 Correlates with Urothelial Bladder Cancer Malignancy" International Journal of Molecular Sciences 16, no. 2: 3783-3803. https://doi.org/10.3390/ijms16023783