Dynamics of Land Use and Land Cover Changes in An Arid Piedmont Plain in the Middle Reaches of the Kaxgar River Basin, Xinjiang, China


Abstract
:1. Introduction
2. Material and Methods
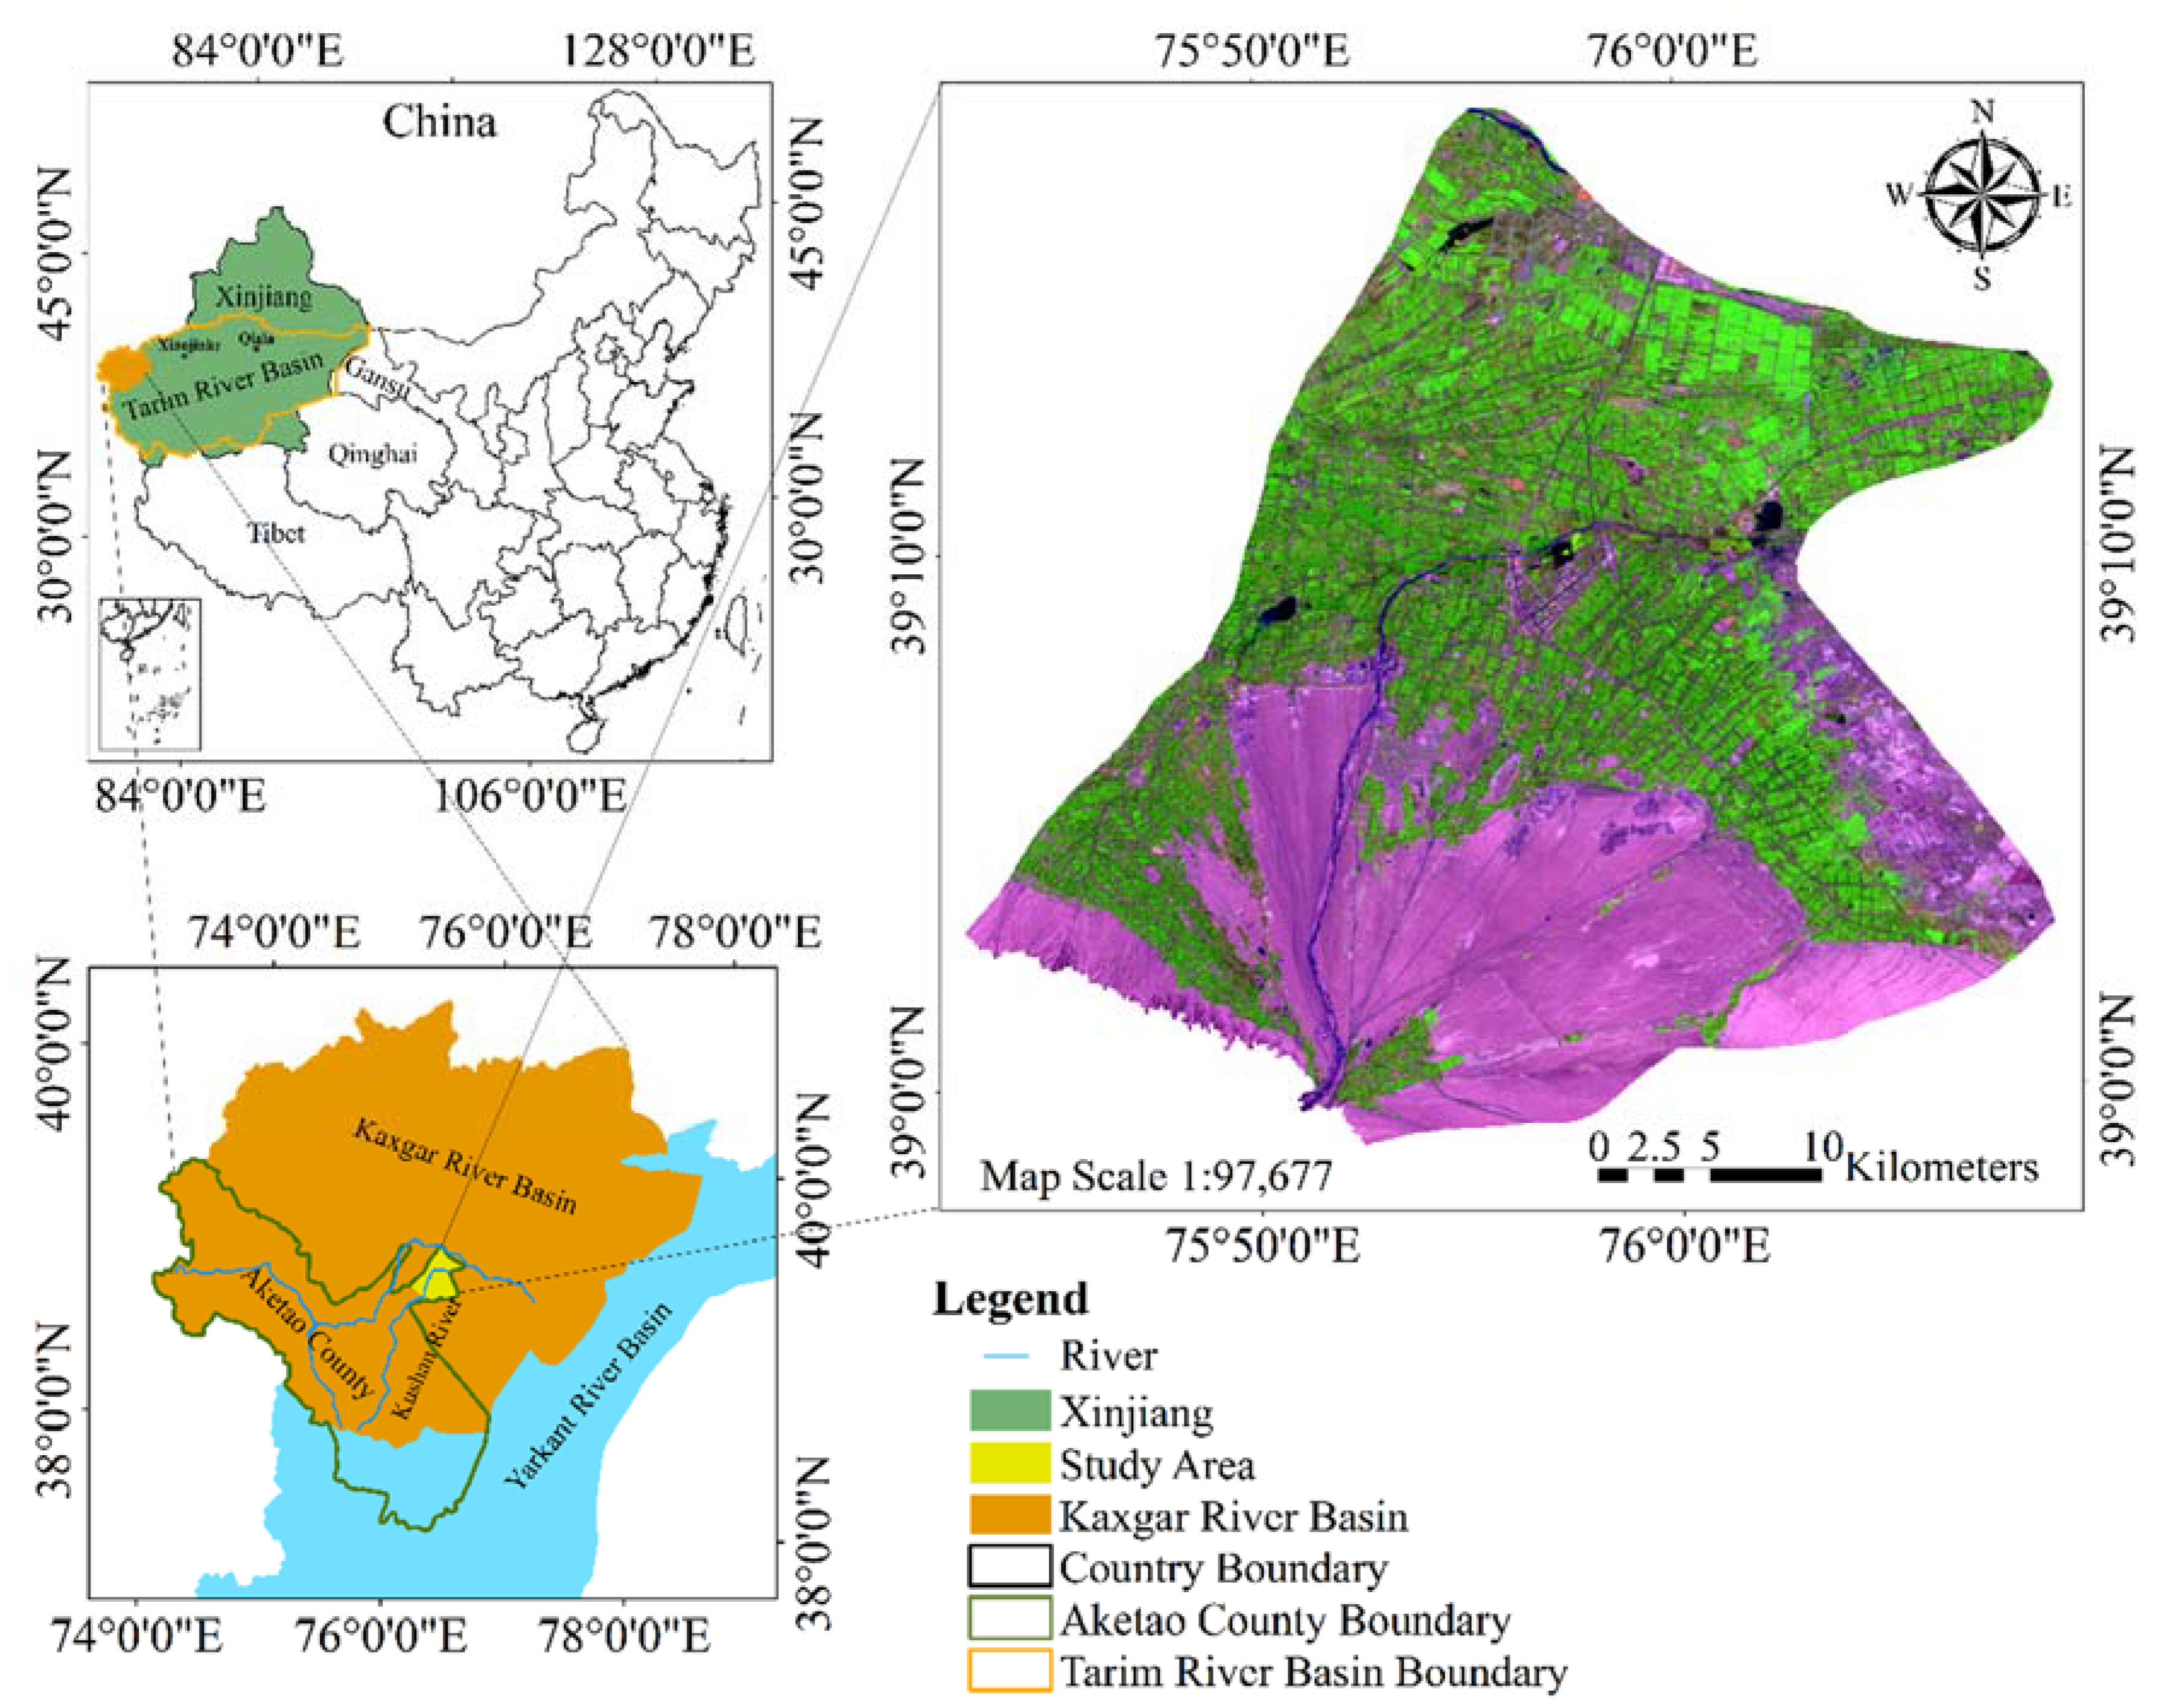
2.1. Location
2.2. LULC Classification and Accuracy Assessment
2.3. Methods for Analyzing LULC Changes
3. Results
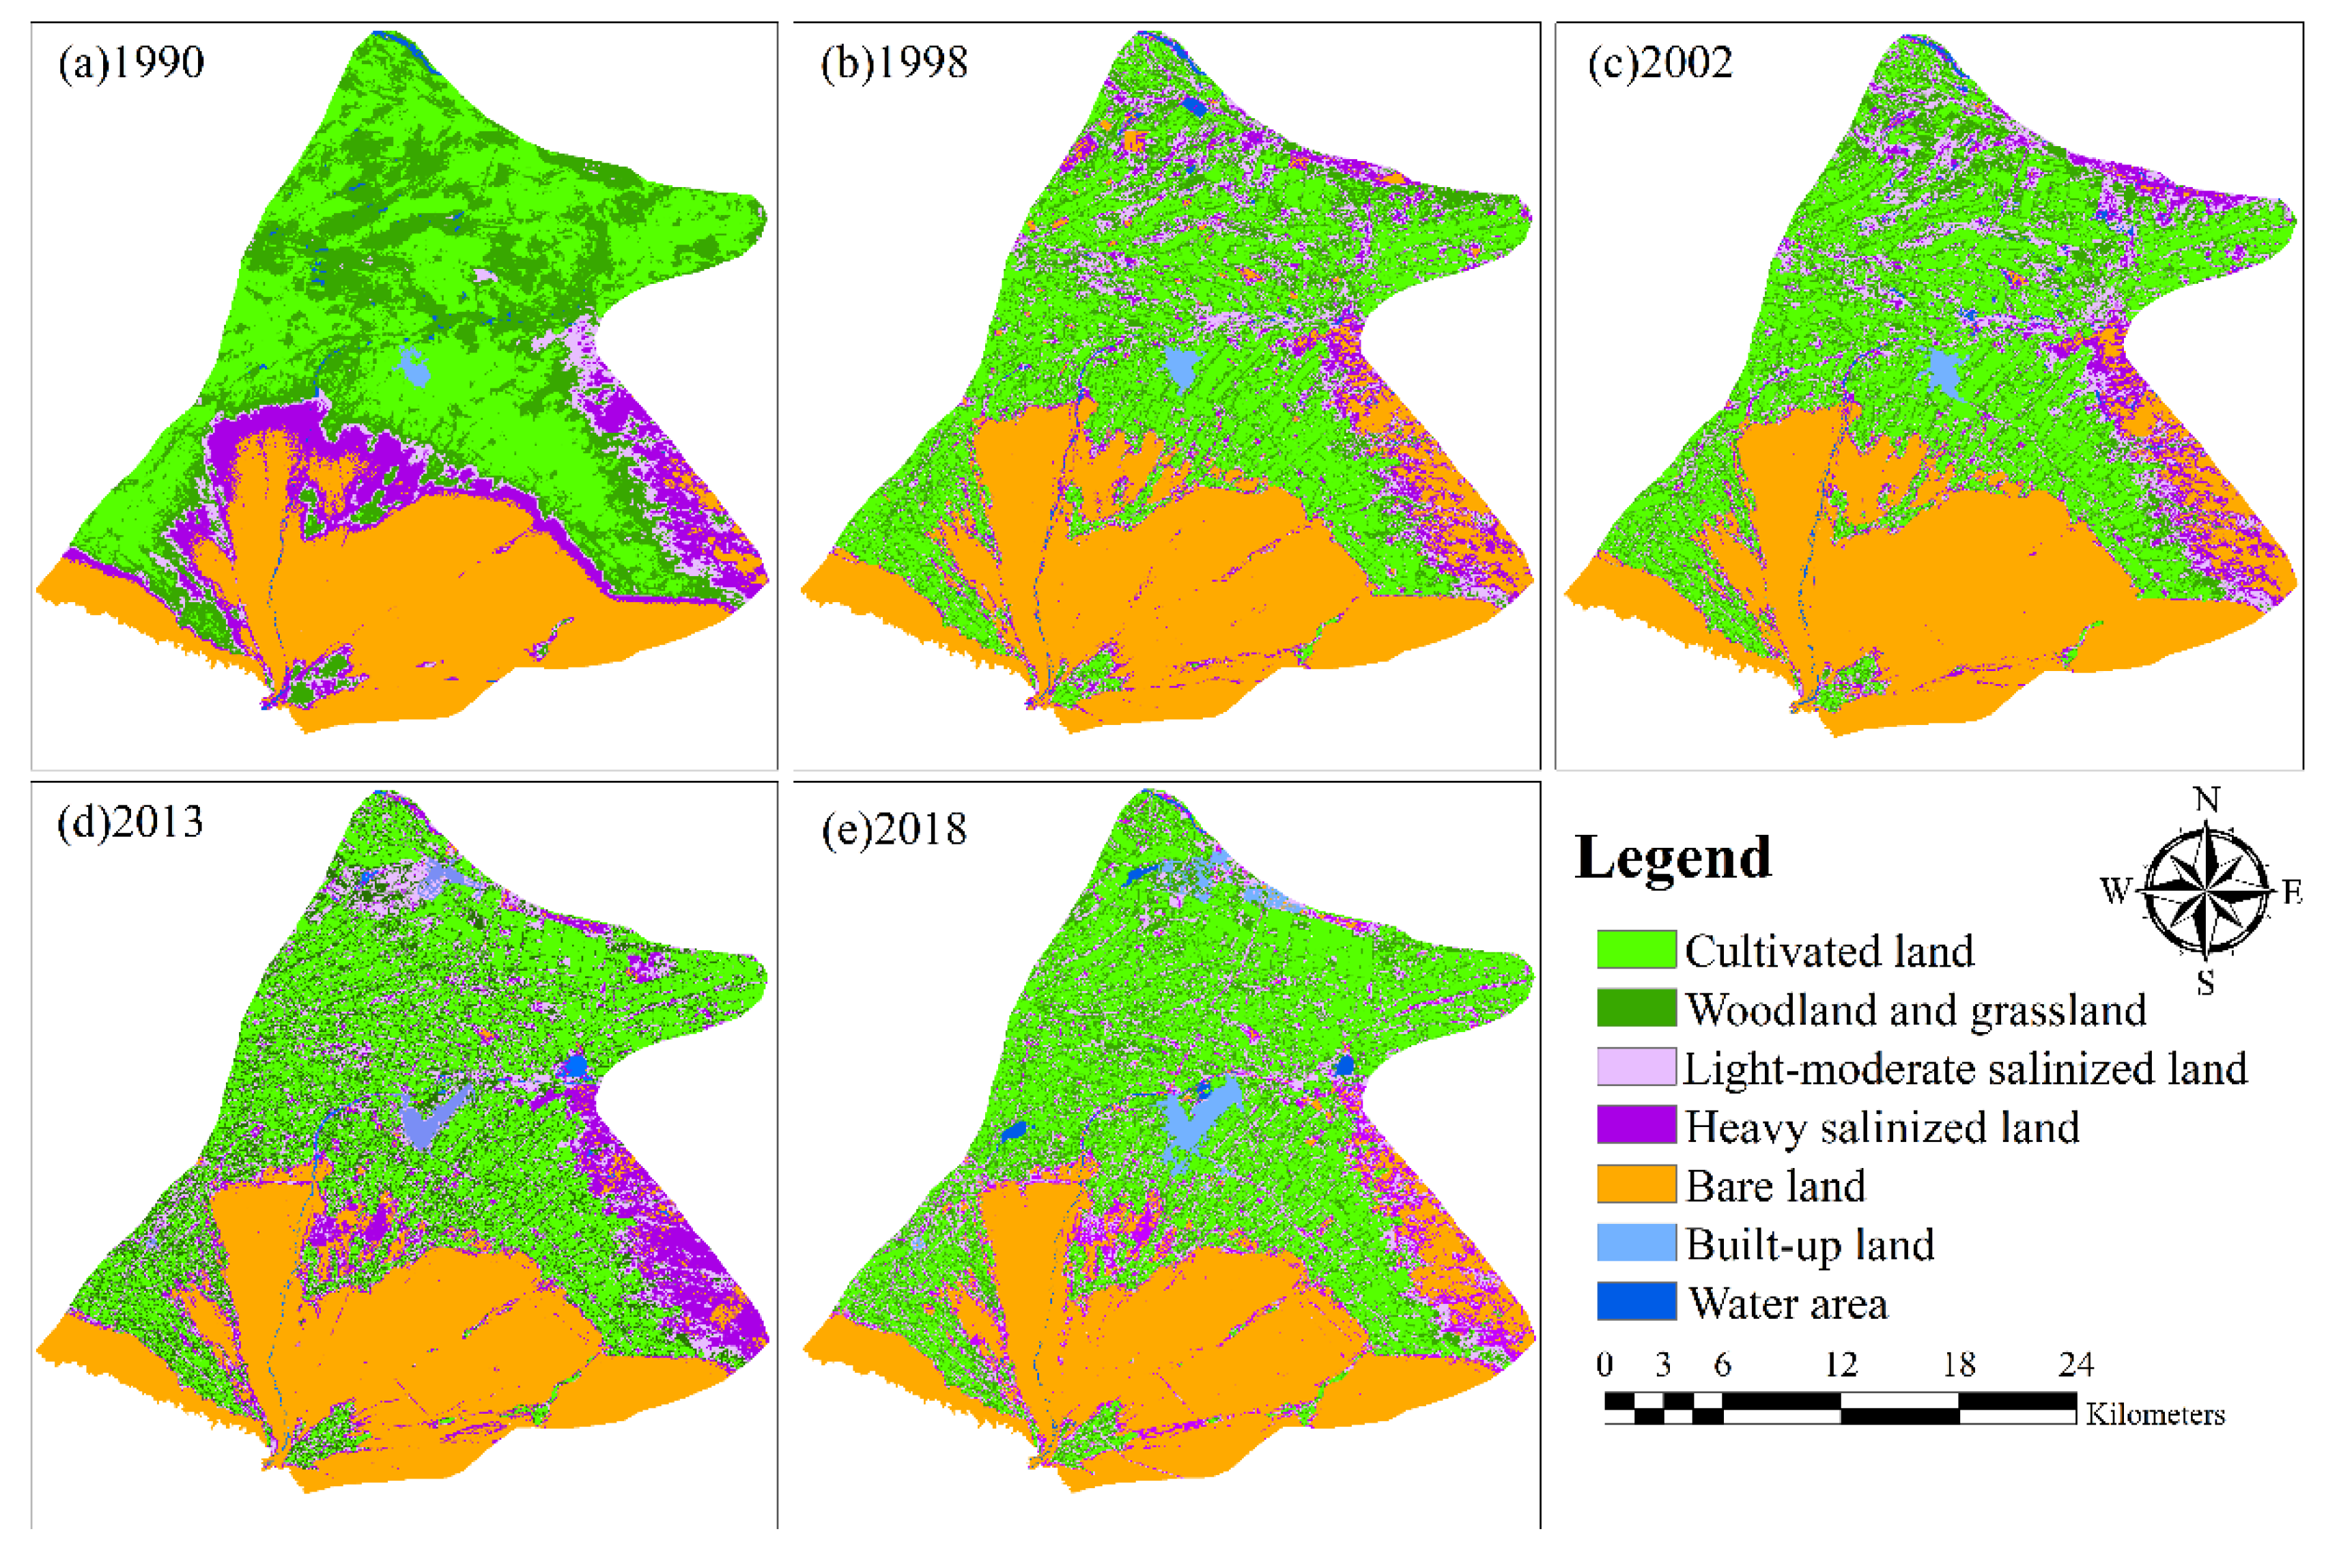
3.1. Analysis of LULC Change
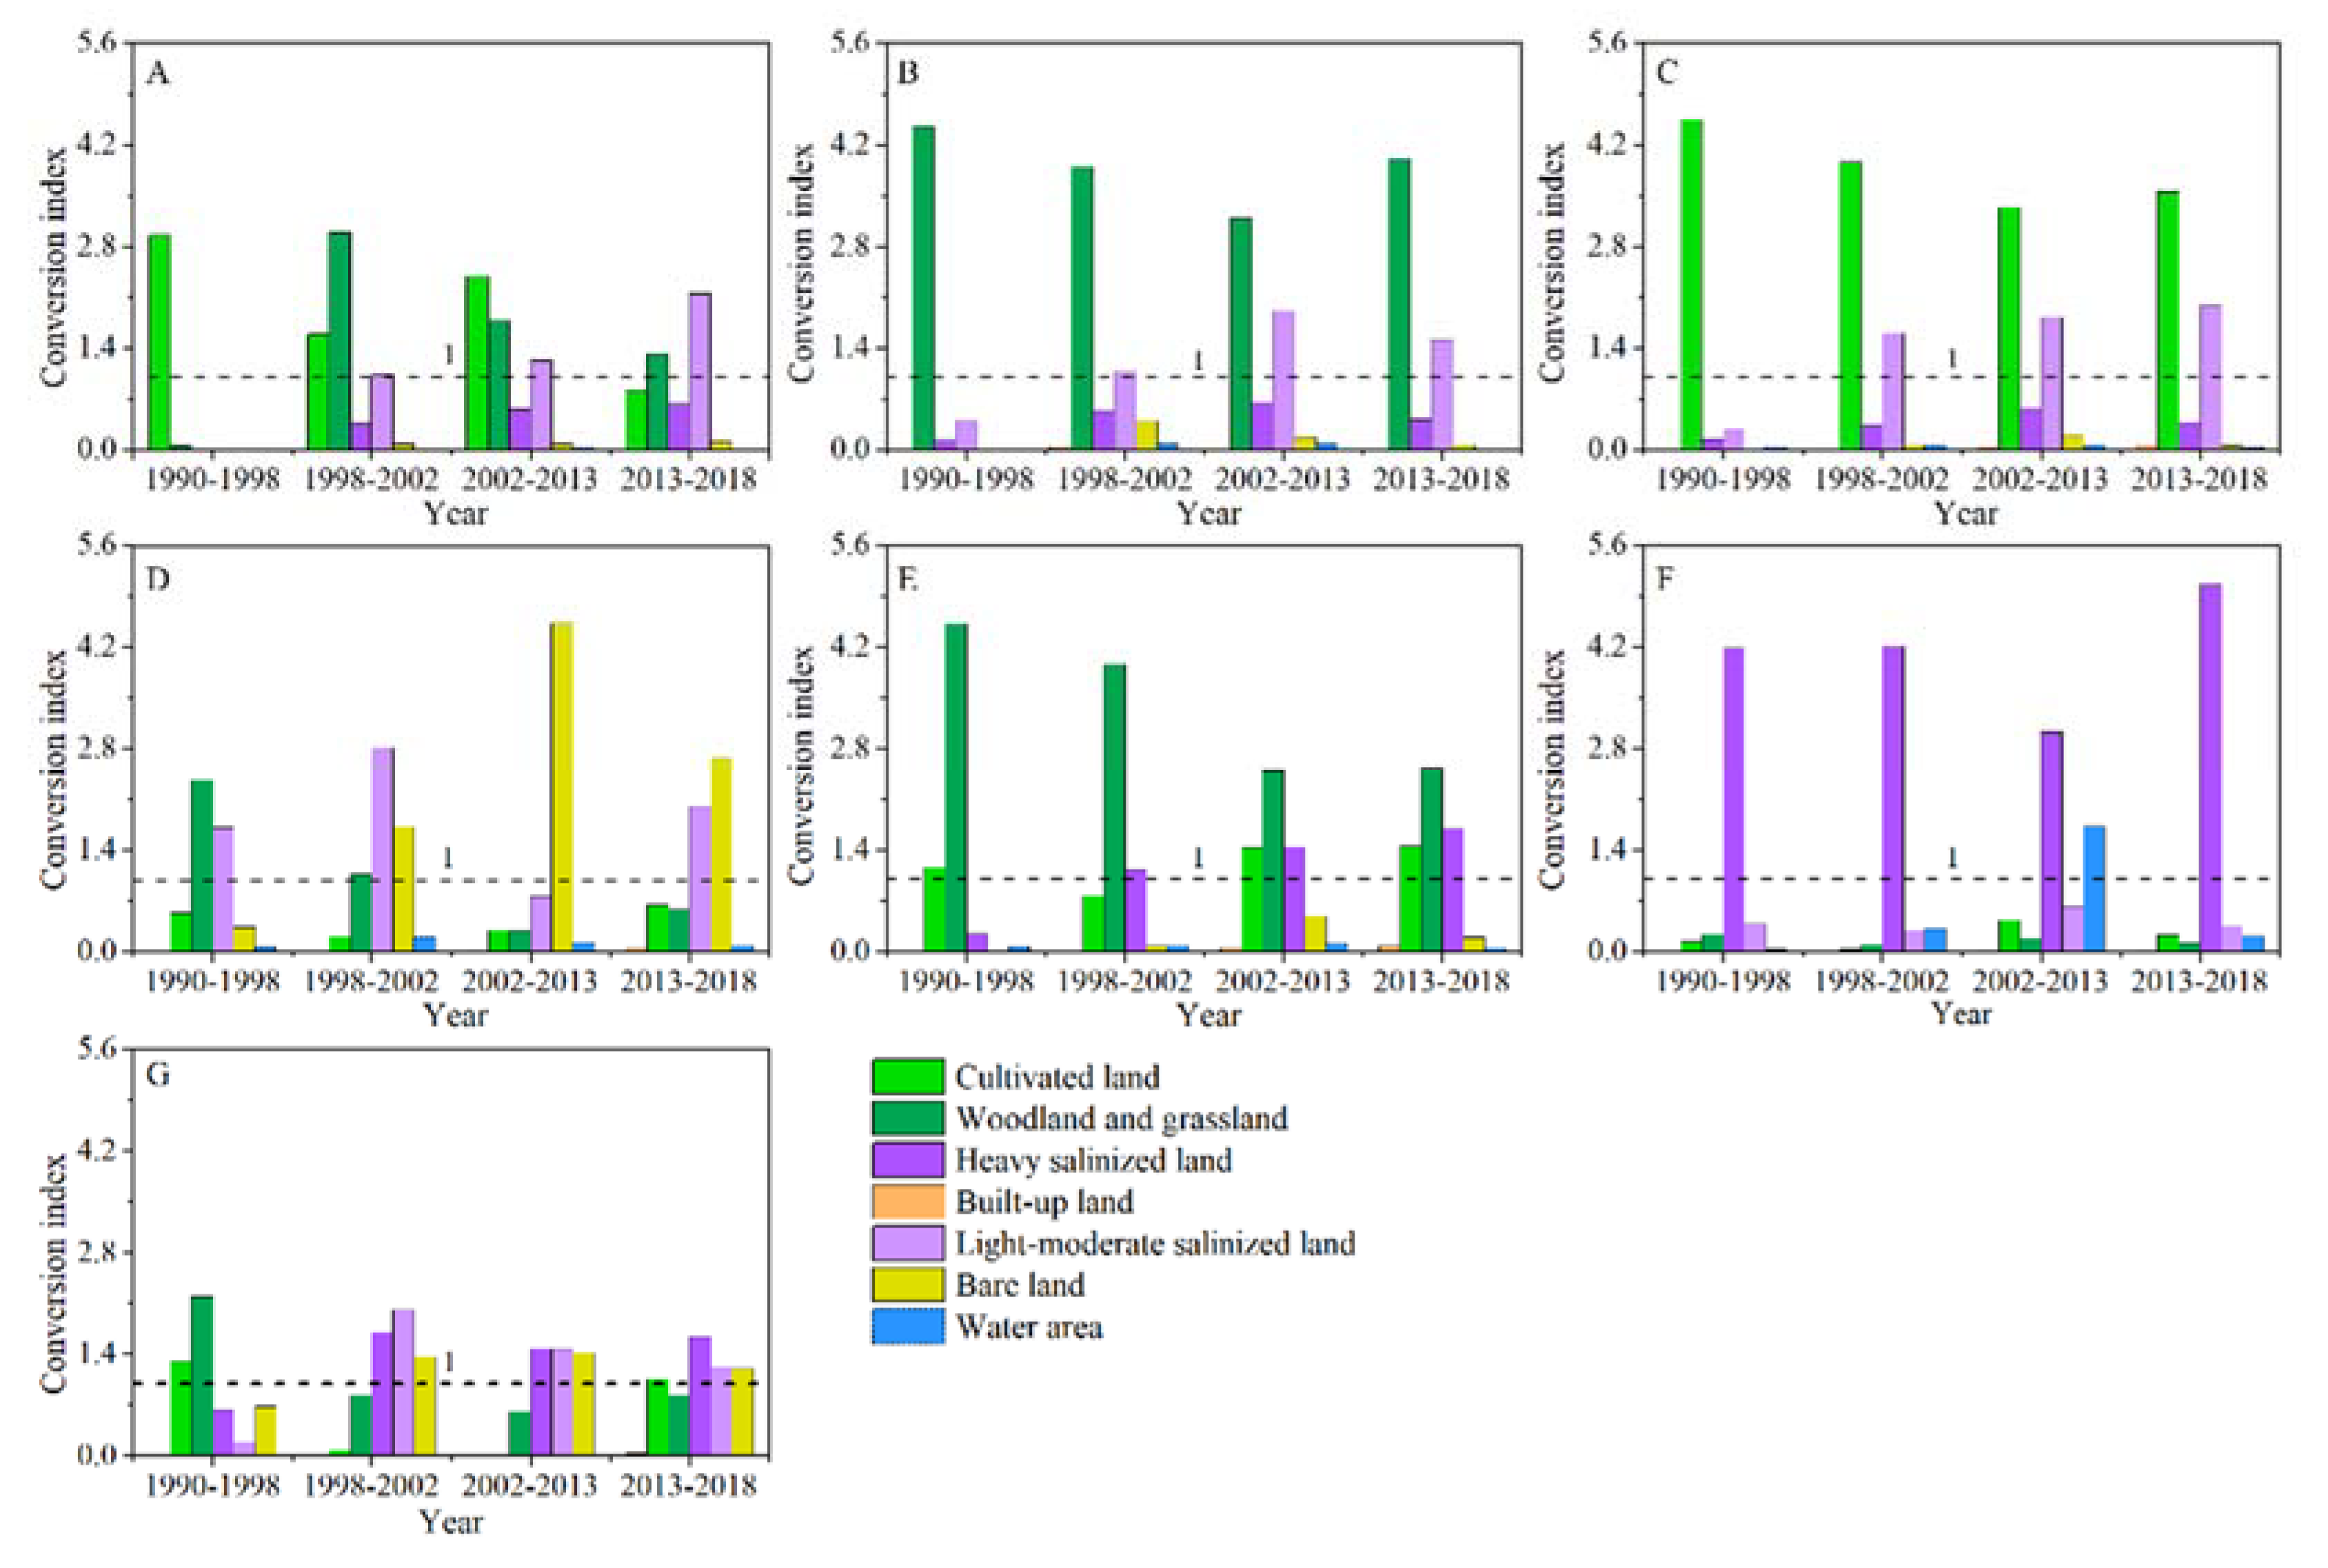
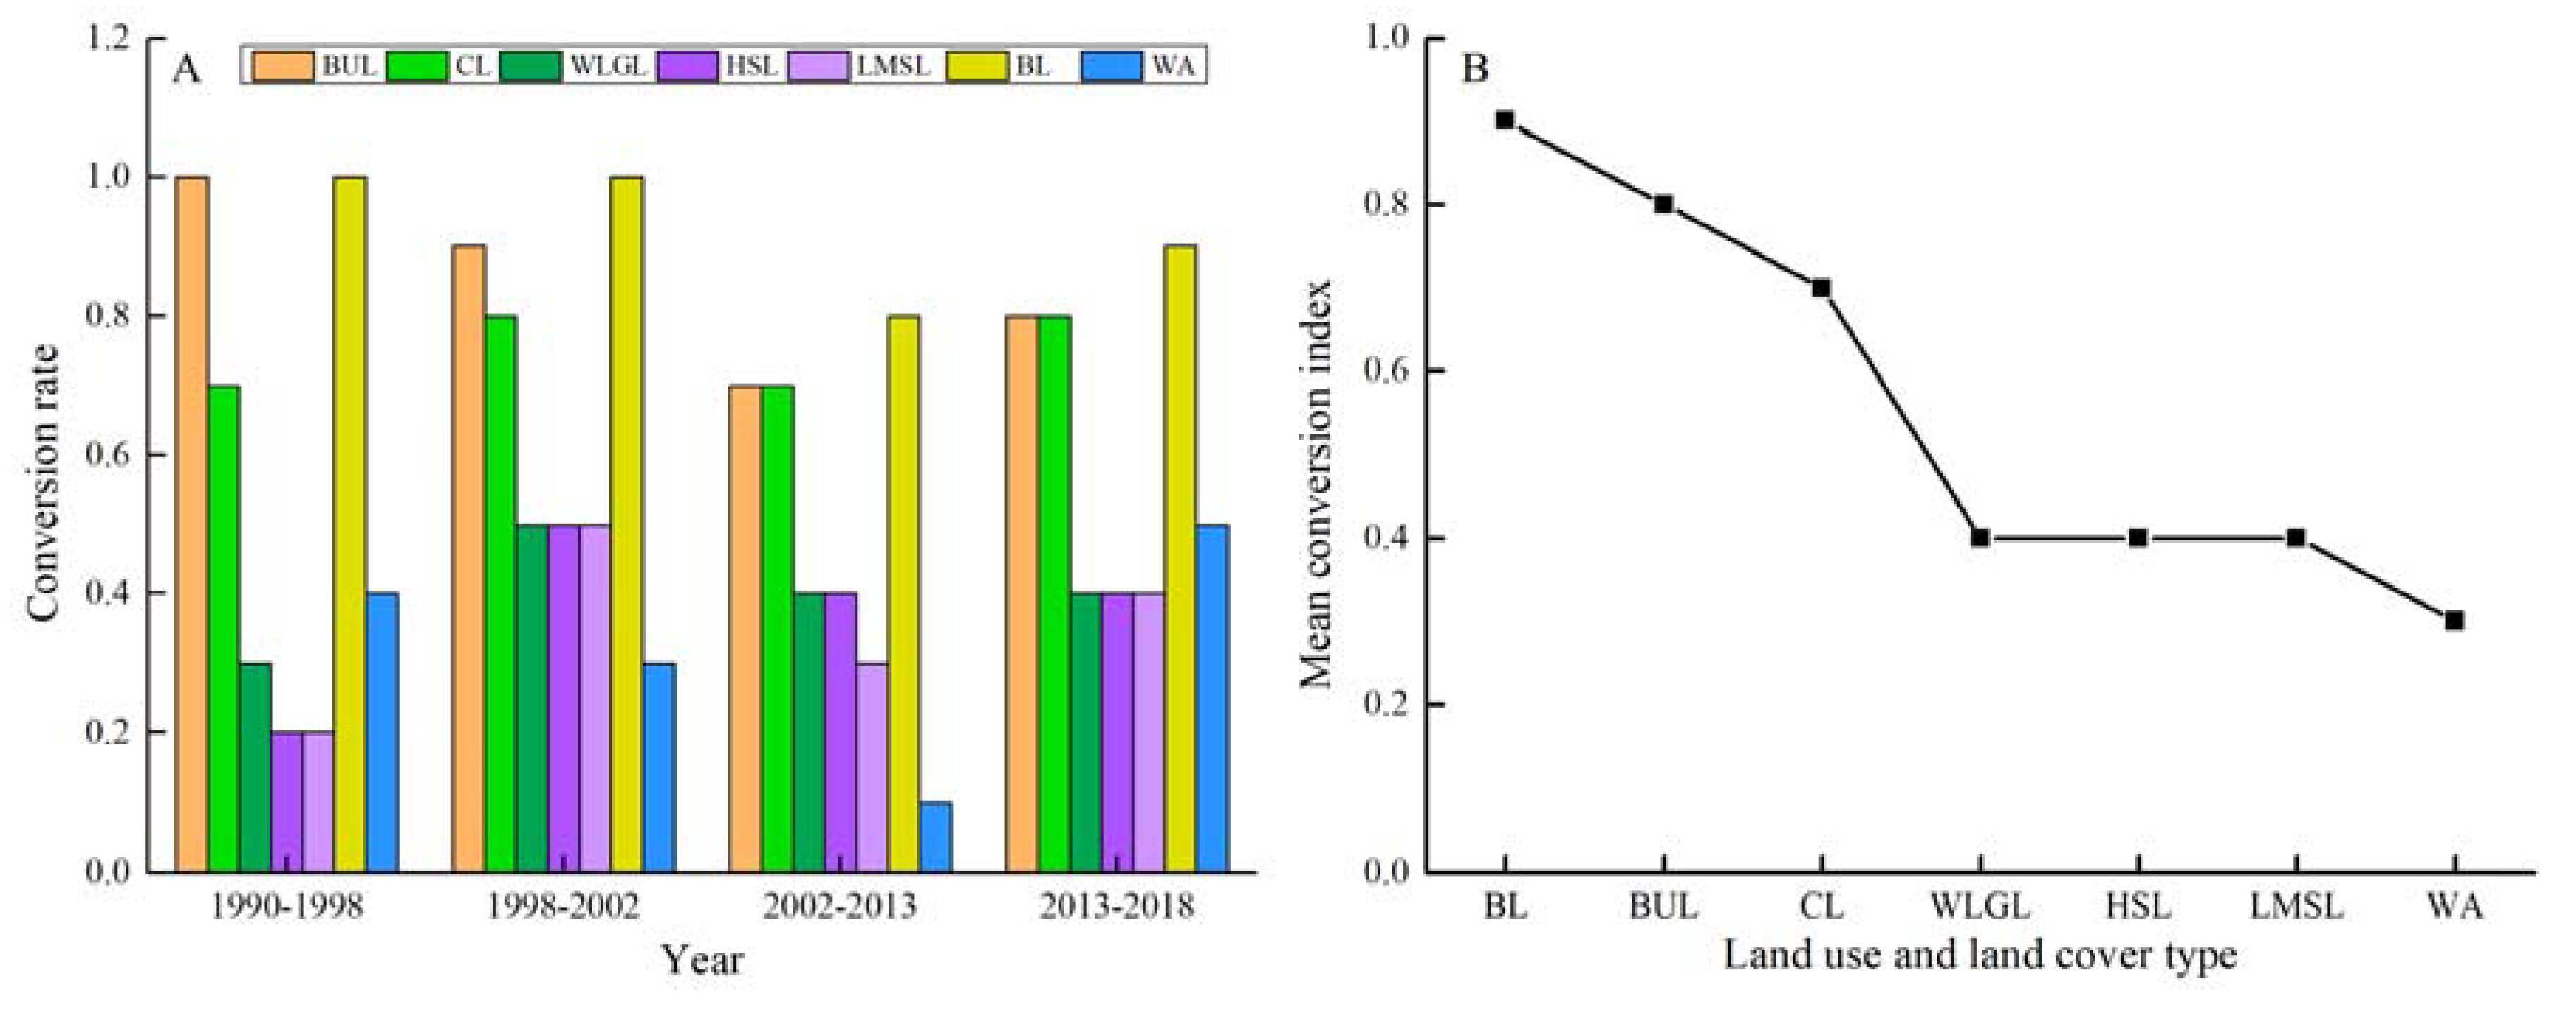
3.2. Analysis of Transitions Between LULC Types
4. Discussion
4.1. LULC Dynamics (1990–2018)
4.2. Conversion Between LULC Types
4.3. Driving Factors of LULC Changes
4.3.1. Human Factors
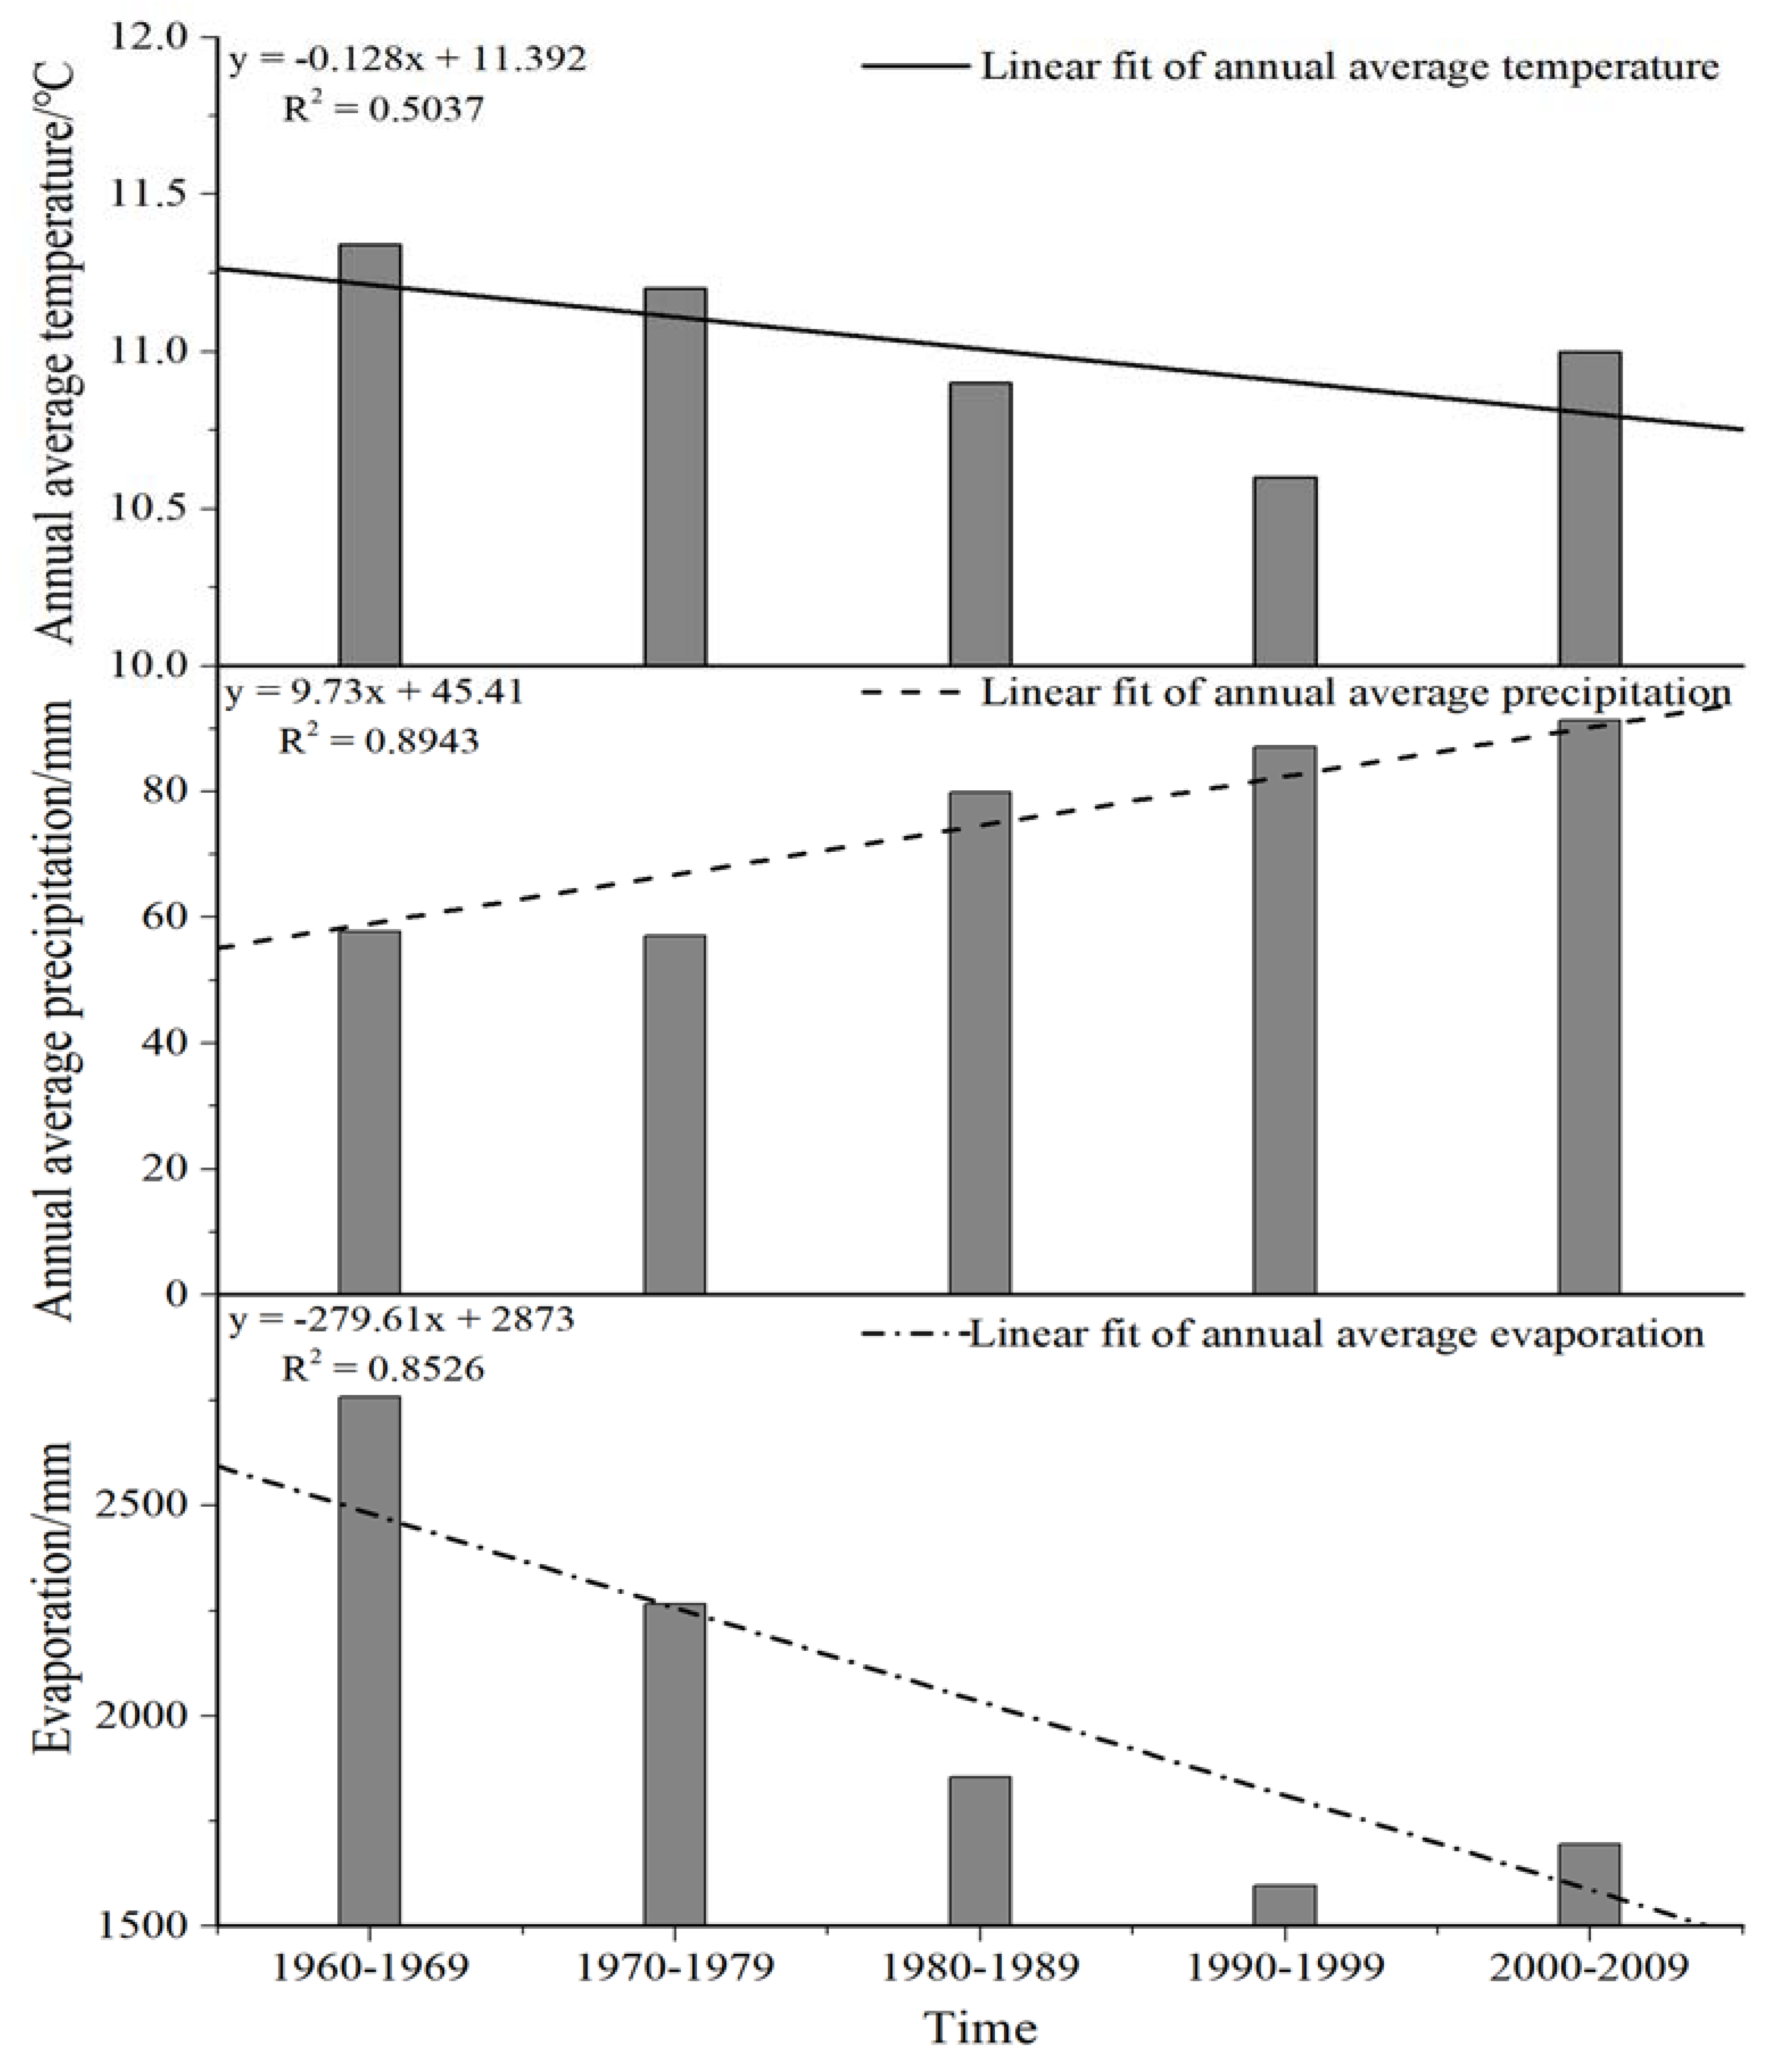
4.3.2. Natural Forces
4.3.3. Policy
5. Conclusions
Author Contributions
Funding
Acknowledgments
Conflicts of Interest
References
- Fu, B.; Hu, C.; Chen, L.; Honnay, O.; Gulinck, H. Evaluating change in agricultural landscape pattern between 1980 and 2000 in the Loess hilly region of Ansai County, China. Agric. Ecosyst. Environ. 2006, 114, 387–396. [Google Scholar] [CrossRef]
- Luo, G.; Zhou, C.; Chen, X.; Li, Y. A methodology of characterizing status and trend of land changes in oases: A case study of Sangong River watershed, Xinjiang, China. J. Environ. Manag. 2008, 88, 775–783. [Google Scholar] [CrossRef] [PubMed]
- Huang, J.; Song, C. Effects of land use on soil water soluble organic C and microbial biomass C concentrations in the Sanjiang Plain in northeast China. Acta Agric. Scand. 2010, 60, 182–188. [Google Scholar] [CrossRef]
- Shen, G.; Sakai, K. Landscape Changes and Spatial Inclinations in the Satoyama of Sano, Japan by Aerial Photos. In Proceedings of the 2nd International Conference on Remote Sensing, Environment and Transportation Engineering (RSETE), Nanjing, China, 1–3 June 2012; pp. 1–4. [Google Scholar]
- Brookfield, H. Environmental damage: Distinguishing human from geophysical causes. Environ. Hazards 1999, 1, 3–11. [Google Scholar]
- Mather, A.S. Driving forces. In Our Earth’s Changing Land: An Encyclopedia of Land-Use and Land-Cover Change; Geist, H.J., Ed.; Greenwood Press: Westport, CT, USA; London, UK, 2006; Volume 1 (A–K), pp. 179–185. [Google Scholar]
- Braimoh, A.K.; Vlek, P.L.G. Impact of land use on soil resources. In Land Use and Soil Resources; Springer Science and Business Media: Dordrecht, The Netherlands, 2008. [Google Scholar]
- Agarwal, C.; Green, M.G.; Grove, J.M.; Evans, T.P.; Schweik, C.M. A Review and Assessment of Land Use Change Models: Dynamics of Space, Time, and Human Choice; Center for the Study of Institutions, Population, and Environmental Change, Indiana University, and USDA Forest Service, Northern Research Station: South Burlington, VT, USA, 2000; p. 90. [Google Scholar]
- Lambin, E.F.; Turner, B.L.; Geist, H.J.; Agbola, S.B.; Angelsen, A.; Bruce, J.W.; Coomes, O.T.; Dirzo, R.; Fischer, G.; Folke, C.; et al. The causes of land-use and land-cover change: Moving beyond the myths. Glob. Environ. Chang. 2001, 11, 261–269. [Google Scholar] [CrossRef]
- Ramankutty, N.; Graumlich, L.; Achard, F.; Alves, D.; Chhabra, A.; DeFries, R.S.; Foley, J.A.; Geist, H.; Houghton, R.A.; Goldewijk, K.K.; et al. Global land-cover change: Recent progress, remaining challenges. In Land-use and Land-cover Change: Local Processes and Global Impacts; Lambin, E.F., Geist, H.J., Eds.; Springer: Berlin, Germany; New York, NY, USA, 2006; pp. 9–39. [Google Scholar]
- Crist, P.J.; Kohley, T.W.; Oakleaf, J. Assessing land-use impacts on biodiversity using an expert systems tool. Landsc. Ecol. 2000, 15, 47–62. [Google Scholar] [CrossRef]
- Weber, A.; Fohrer, N.; Möller, D. Long-term land use changes in a mesoscale water-shed due to socio-economic factors-effects on landscape structures and functions. Ecol. Model. 2001, 140, 125–140. [Google Scholar] [CrossRef]
- Gerlach, J.D. The impacts of serial land-use changes and biological invasions on soil water resources in California, USA. J. Arid Environ. 2004, 57, 365–379. [Google Scholar] [CrossRef]
- Niyogi, D.; Mahmood, R.; Adegoke, J.O. Land-use/land-cover change and its impacts on weather and climate. Bound. Layer Meteorol. 2009, 133, 297–298. [Google Scholar] [CrossRef]
- Wu, X.; Cai, Y. Land cover changes and landscape dynamics assessment in lower reaches of Tarim River in China. Chin. Geogr. Sci. 2004, 14, 28–33. [Google Scholar] [CrossRef]
- Li, Z.; Bao, X. Studies on the Water Resource Utilization and Management in Tarim Watershed. South North Water Transf. Water Sci. Technol. 2003, 1, 28–32. (In Chinese) [Google Scholar]
- Fan, Z. Resources Environment and Sustainable Development in the Lower Reaches of Tarim River; Science Press: Beijing, China, 1998. (In Chinese) [Google Scholar]
- Zhu, C.; Zhang, L.; Yu, J. The character of diversiform-leaved poplar grove habitat of Tarim River and improving measure. Environ. Prot. Xinjiang 2000, 22, 101–104. (In Chinese) [Google Scholar]
- Li, X.; Zhao, H.; Zhang, Q. On Population Aging, Labor Mobility and Economic Growth—Based on the Panel Data of Ten Provinces in China’s Western Region. J. Southwest Univ. (Nat. Sci. Ed.) 2018, 40, 76–85. (In Chinese) [Google Scholar]
- Zhao, R.; Chen, Y.; Shi, P.; Zhang, L.; Pan, J.; Zhao, H. Land use and land cover change and driving mechanism in the arid inland river basin: A case study of Tarim River, Xinjiang, China. Environ. Earth Sci. 2013, 68, 591–604. [Google Scholar] [CrossRef]
- Zhang, F.; Tiyip, T.; Feng, Z.; Kung, H.; Johnson, V.; Ding, J.; Tashpolat, N.; Sawut, M.; Gui, D. Spatio-temporal patterns of land use/cover changes over the past 20 years in the middle reaches of the tarim river, Xinjiang, China. Land Degrad. Dev. 2015, 26, 284–299. [Google Scholar] [CrossRef]
- Zhao, R.; Jiang, P.; Chen, Y.; Shi, P.; Pan, J.; Zhao, H. Land Use/Cover Change and Its Eco-environment Effect in the Main Stream of Tarim River. Sci. Geogr. Sin. 2012, 32, 244–250. (In Chinese) [Google Scholar]
- Sun, Q.; Tiyip, T.; Zhang, F.; Ding, J.; Sawut, M.; Han, G.; Gui, D. Dynamics of land use/cover changes in the Weigan and Kuqa rivers delta oasis based on Remote Sensing. Acta Ecol. Sin. 2012, 32, 3252–3265. (In Chinese) [Google Scholar]
- Gong, L.; Pan, X.; Shi, Q.; Wang, Z.; Gao, W. Land Use Pattern and Influential Factors in the Upper Reaches of Tarim River. Resour. Sci. 2005, 27, 71–75. (In Chinese) [Google Scholar]
- Wu, X.; Meng, J. The Land Use/Cover Changes and the eco-environmental responses in the lower reaches of Tarim River, Xinjiang. Arid Zone Res. 2004, 21, 38–43. (In Chinese) [Google Scholar]
- Mao, W.; Sun, B.; Wang, T.; Luo, G.; Zhang, C.; Huo, L. Change Trends of Temperature, Precipitation and Runoff Volume in the Kaxgar River Basin since Recent 50 years. Arid Zone Res. 2006, 23, 531–538. (In Chinese) [Google Scholar]
- Chen, Z.; Chen, Y.; Cao, Z.; Sun, C.; Fan, Y. The Change of Annual Runoff and Its Connectivity with Human Driving Factors in the Mainstream of Tarim River. Sci. Geogr. Sin. 2011, 31, 1506–1511. [Google Scholar]
- Fan, Z. Causes analysis of salinized land formation and its treatment measures in the plain area of Aketao county, Xinjiang. Ground Water 2014, 36, 61–62. (In Chinese) [Google Scholar]
- Hou, X.; Ma, G.; Rong, W. Exploration of ecological environment construction in saline land consolidation project of sourthern Xinjiang. Land Dev. Eng. Res. 2018, 3, 31–37. (In Chinese) [Google Scholar]
- Usour, N.; Usour, N. Analysis of salinized land characteristic in irrigation area, Aketao county, Xinjiang. Groundwater 2016, 6, 33–34. (In Chinese) [Google Scholar]
- Zhao, N.; Wei, S.; Wu, H.; Hui, X. Rational allocation and countermeasures of water resources in irrigation area, Aketao county, Xinjiang. Groundwater 2008, 30, 100–101. (In Chinese) [Google Scholar]
- Minta, M.; Kibret, K.; Thorne, P.; Nigussie, T.; Nigatu, L. Land use and land cover dynamics in Dendi-Jeldu hilly-mountainous areas in the central Ethiopian highlands. Geoderma 2018, 314, 27–36. [Google Scholar] [CrossRef]
- Sherefa, B. Remote Sensing and GIS for Land Cover/Land Use Change Detection and Analysis in the Semi-natural Ecosystems and Agriculture Landscapes of the Central Ethiopian Rift Valley. Ph.D. Thesis, Institute of Photogrammetry and Remote Sensing, Technology University of Dresden, Dresden, Germany, 2006. [Google Scholar]
- Lillesand, T.M.; Kiefer, R.W.; Chipman, J.W. Remote Sensing and Image Interpretation, 5th ed.; John Wiley and Sons, Inc.: Hoboken, NJ, USA, 2004. [Google Scholar]
- Shabit, M.; Mamut, A. Analysis on the Spatiotemporal Characteristics of Land Use Change in Kizilsu Kirgiz Autonomous Prefecture, Xinjiang, China. Arid Zone Res. 2007, 24, 296–301. (In Chinese) [Google Scholar]
- Wang, L.; Zhang, Y. Dynamic Change and Prediction of Land Use in Xinjiang. Hubei Agric. Sci. 2018, 57, 25–31. (In Chinese) [Google Scholar]
- Huang, L.; Xu, L. Spatiotemporal Evolution of the Oasis and Change of Landscape Pattern in the Manas River Basin. Arid Zone Res. 2019, 36, 1261–1269. (In Chinese) [Google Scholar]
- Aizimu, A.; Siyiti, H. A brief analysis of the transfer of surplus rural labor force in kizilesu autonomous prefecture—Taking Aketao County as an example. Xinjiang Agric. Sci. Technol. 2012, 02, 62–63. (In Chinese) [Google Scholar]
- Zeng, L.; Yang, T.; Tian, H. Response of glacier variations in the eastern Pamirs plateau to climate change, during the last 40 years. J. Arid. Land Resour. Environ. 2013, 27, 144–150. (In Chinese) [Google Scholar]
- Du, Q.; Xu, H.; Zhao, X.; Zhang, P.; Ling, H.; Wang, X. Changing characteristics of land use/cover and landscape pattern from 1990 to 2010 in the Kaxgar River basin, Xinjiang. J. Glaciol. Geocryol. 2014, 36, 1548–1555. (In Chinese) [Google Scholar]
- Shen, T. Survey and Consideration on Social Stability of Aketao County in Southern Xinjiang. J. Xinjiang Police Off. Acad. 2014, 34, 13–16. (In Chinese) [Google Scholar]
- Ha, L.; Ren, F.; Tuohuti, A. The investigation of development status of livestock in the agricultural area of Aketao County. Xinjiang Livest. 1991, 03, 26–29. (In Chinese) [Google Scholar]


| Code | Land Use/Cover Types | Description |
|---|---|---|
| A | Built-up land | Residential areas (emerging rural towns, villages) occupied by living houses including backyard, manufacturing district |
| B | Cultivated land | Land areas under cropland with visible patterns on satellite imageries |
| C | Woodland and grassland | Grassland mainly evolved from abandoned agricultural lands, also appeared in low-lying, relatively humid environment at the edge of the oasis. Woodland mainly refers to farmland shelterbelts, orchards and indigenous and landscape trees (growing around the urban and rural settlements ) |
| D | Heavy salinized land | The land serious salinization and at the edge of oasis, surrounded non-cultivated soil salinity is very high and poor environmental conditions |
| E | Light-moderate salinized land | Distribution terrain relatively flat, in the lower part of alluvial fan, high soil salinity and poor environmental conditions |
| F | Bare land | Unused land, barren land, Gobi, sandy land, etc. |
| G | Water area | River and reservoir |
| Land Use/Cover | 1990 | 1998 | 2002 | 2013 | 2018 | |||||
|---|---|---|---|---|---|---|---|---|---|---|
| Area (ha) | % | Area (ha) | % | Area (ha) | % | Area (ha) | % | Area (ha) | % | |
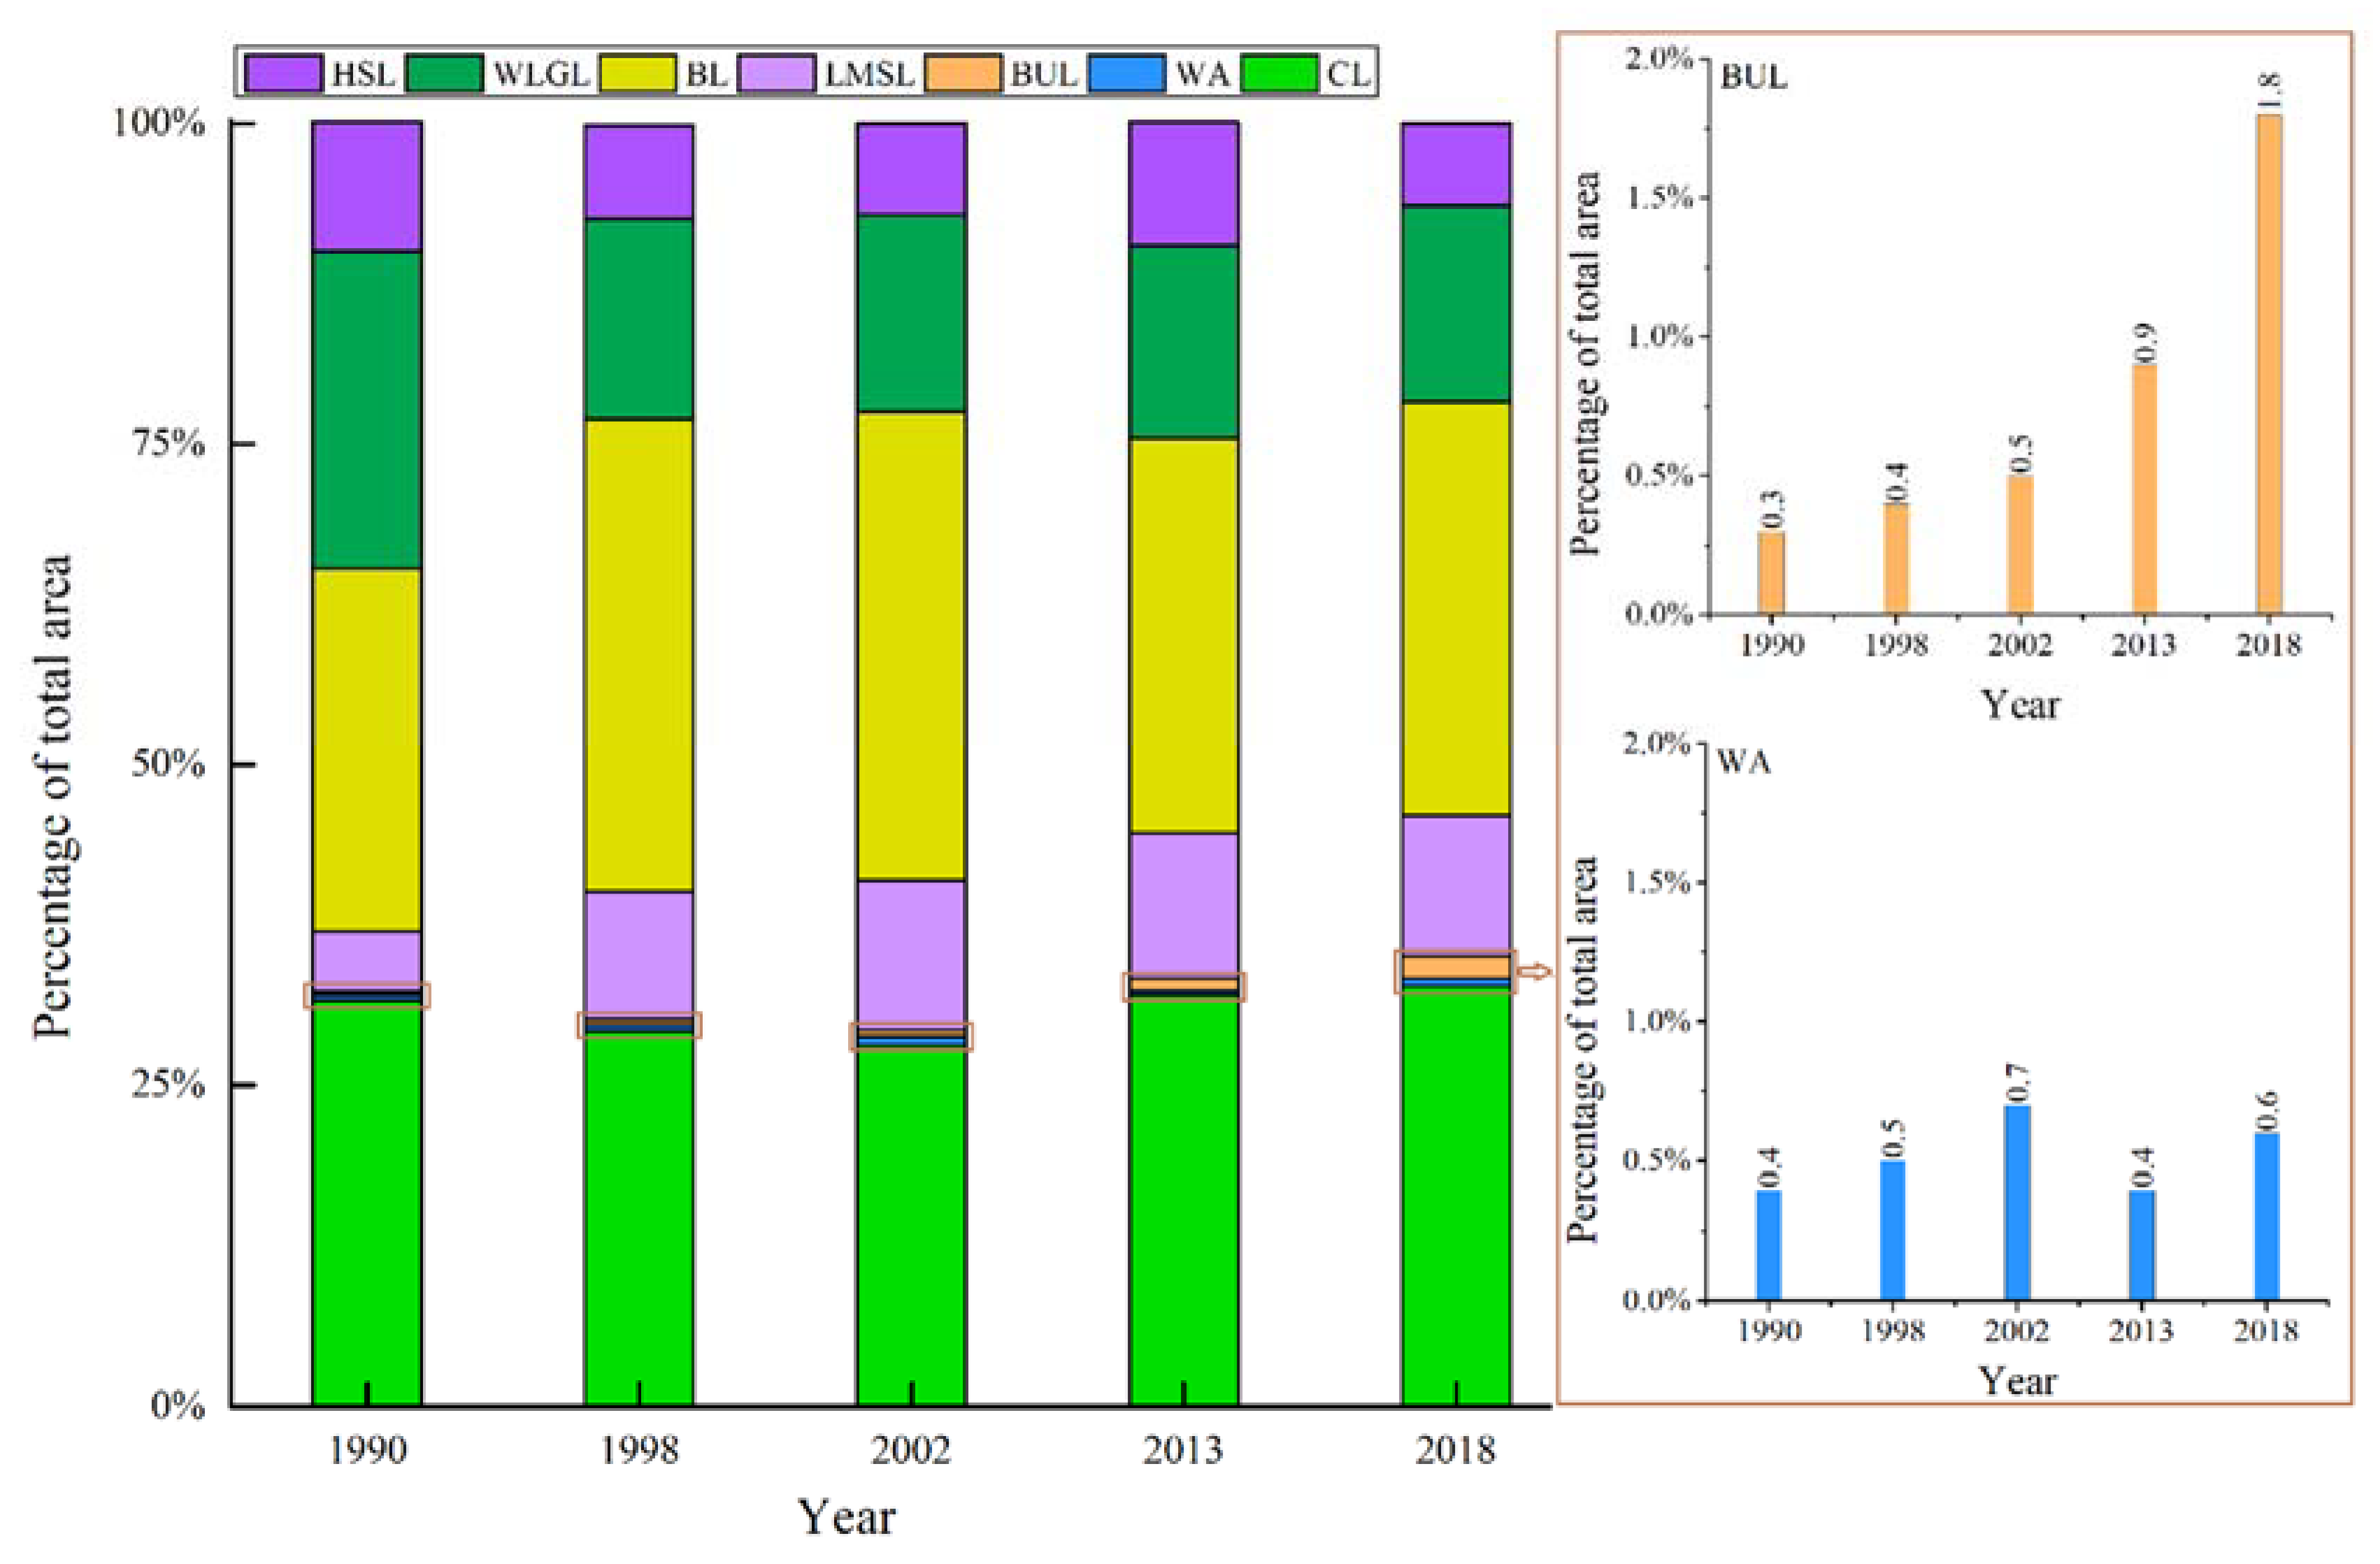
| Built-up land | 196.9 | 0.3 | 275.1 | 0.4 | 339.8 | 0.5 | 698.3 | 0.9 | 1353.3 | 1.8 |
| Cultivated land | 23,605.5 | 31.6 | 21,840.4 | 29.2 | 21,021.4 | 28.1 | 23,886.8 | 32.0 | 24,463.5 | 32.7 |
| Woodland and grassland | 18,457.3 | 24.7 | 11,747.7 | 15.7 | 11,486.3 | 15.4 | 11,253.5 | 15.1 | 11,419.4 | 15.3 |
| Heavy salinized land | 7540.8 | 10.1 | 5475.4 | 7.3 | 5324.0 | 7.1 | 7142.9 | 9.6 | 4762.9 | 6.4 |
| Light-moderate salinized land | 3486.8 | 4.7 | 7496.2 | 10.0 | 8650.4 | 11.6 | 8440.7 | 11.3 | 8132.5 | 10.9 |
| Bare land | 21135.8 | 28.3 | 27,518.4 | 36.8 | 27,396.0 | 36.6 | 23,006.3 | 30.8 | 24,178.6 | 32.3 |
| Water area | 331.6 | 0.4 | 401.7 | 0.5 | 536.8 | 0.7 | 326.4 | 0.4 | 444.6 | 0.6 |
| Total | 74,754.8 | 100.0 | 74,754.8 | 100.0 | 74,754.8 | 100.0 | 74,754.8 | 100.0 | 74,754.8 | 100.0 |
| Land Use and Land Cover | Reference Year (1990) | Reference Year (1998) | Reference Year (2002) | Reference Year (2013) | Reference Year (1990) | |||||
|---|---|---|---|---|---|---|---|---|---|---|
| 1990–1998 | 1998–2002 | 2002–2013 | 2013–2018 | 1990–2018 | ||||||
| Net Change in Area (NC, %) | Annual Rate of Change (ARC, %) | NC (%) | ARC (%) | NC (%) | ARC (%) | NC (%) | ARC (%) | NC (%) | ARC (%) | |
| Built-up land (BUL) | 39.7 | 5.0 | 23.5 | 5.9 | 105.5 | 9.6 | 93.8 | 18.8 | 587.4 | 21.0 |
| Cultivated land (CL) | −7.5 | −0.9 | −3.7 | −0.9 | 13.6 | 1.2 | 2.4 | 0.5 | 3.6 | 0.1 |
| Woodland and grassland (WLGL) | −36.4 | −4.5 | −2.2 | −0.6 | -2.0 | −0.2 | 1.5 | 0.3 | −38.1 | −1.4 |
| Heavy salinized land (HSL) | −27.4 | −3.4 | −2.8 | −0.7 | 34.2 | 3.1 | −33.3 | −6.7 | −36.8 | −1.3 |
| Light-moderate salinized land (LMSL) | 115.0 | 14.4 | 15.4 | 3.8 | −2.4 | −0.2 | −3.7 | −0.7 | 133.2 | 4.8 |
| Bare land (BL) | 30.2 | 3.8 | −0.4 | −0.1 | −16.0 | −1.5 | 5.1 | 1.0 | 14.4 | 0.5 |
| Water area (WA) | 21.1 | 2.6 | 33.6 | 8.4 | −39.2 | −3.6 | 36.2 | 7.2 | 34.1 | 1.2 |
© 2020 by the authors. Licensee MDPI, Basel, Switzerland. This article is an open access article distributed under the terms and conditions of the Creative Commons Attribution (CC BY) license (http://creativecommons.org/licenses/by/4.0/).
Share and Cite
Wei, T.; Shangguan, D.; Shen, X.; Ding, Y.; Yi, S. Dynamics of Land Use and Land Cover Changes in An Arid Piedmont Plain in the Middle Reaches of the Kaxgar River Basin, Xinjiang, China. ISPRS Int. J. Geo-Inf. 2020, 9, 87. https://doi.org/10.3390/ijgi9020087
Wei T, Shangguan D, Shen X, Ding Y, Yi S. Dynamics of Land Use and Land Cover Changes in An Arid Piedmont Plain in the Middle Reaches of the Kaxgar River Basin, Xinjiang, China. ISPRS International Journal of Geo-Information. 2020; 9(2):87. https://doi.org/10.3390/ijgi9020087
Chicago/Turabian StyleWei, Tianfeng, Donghui Shangguan, Xia Shen, Yongjian Ding, and Shuhua Yi. 2020. "Dynamics of Land Use and Land Cover Changes in An Arid Piedmont Plain in the Middle Reaches of the Kaxgar River Basin, Xinjiang, China" ISPRS International Journal of Geo-Information 9, no. 2: 87. https://doi.org/10.3390/ijgi9020087