Evaluating Urban Bicycle Infrastructures through Intersubjectivity of Stress Sensations Derived from Physiological Measurements


Abstract
:1. Introduction
2. Materials and Methods
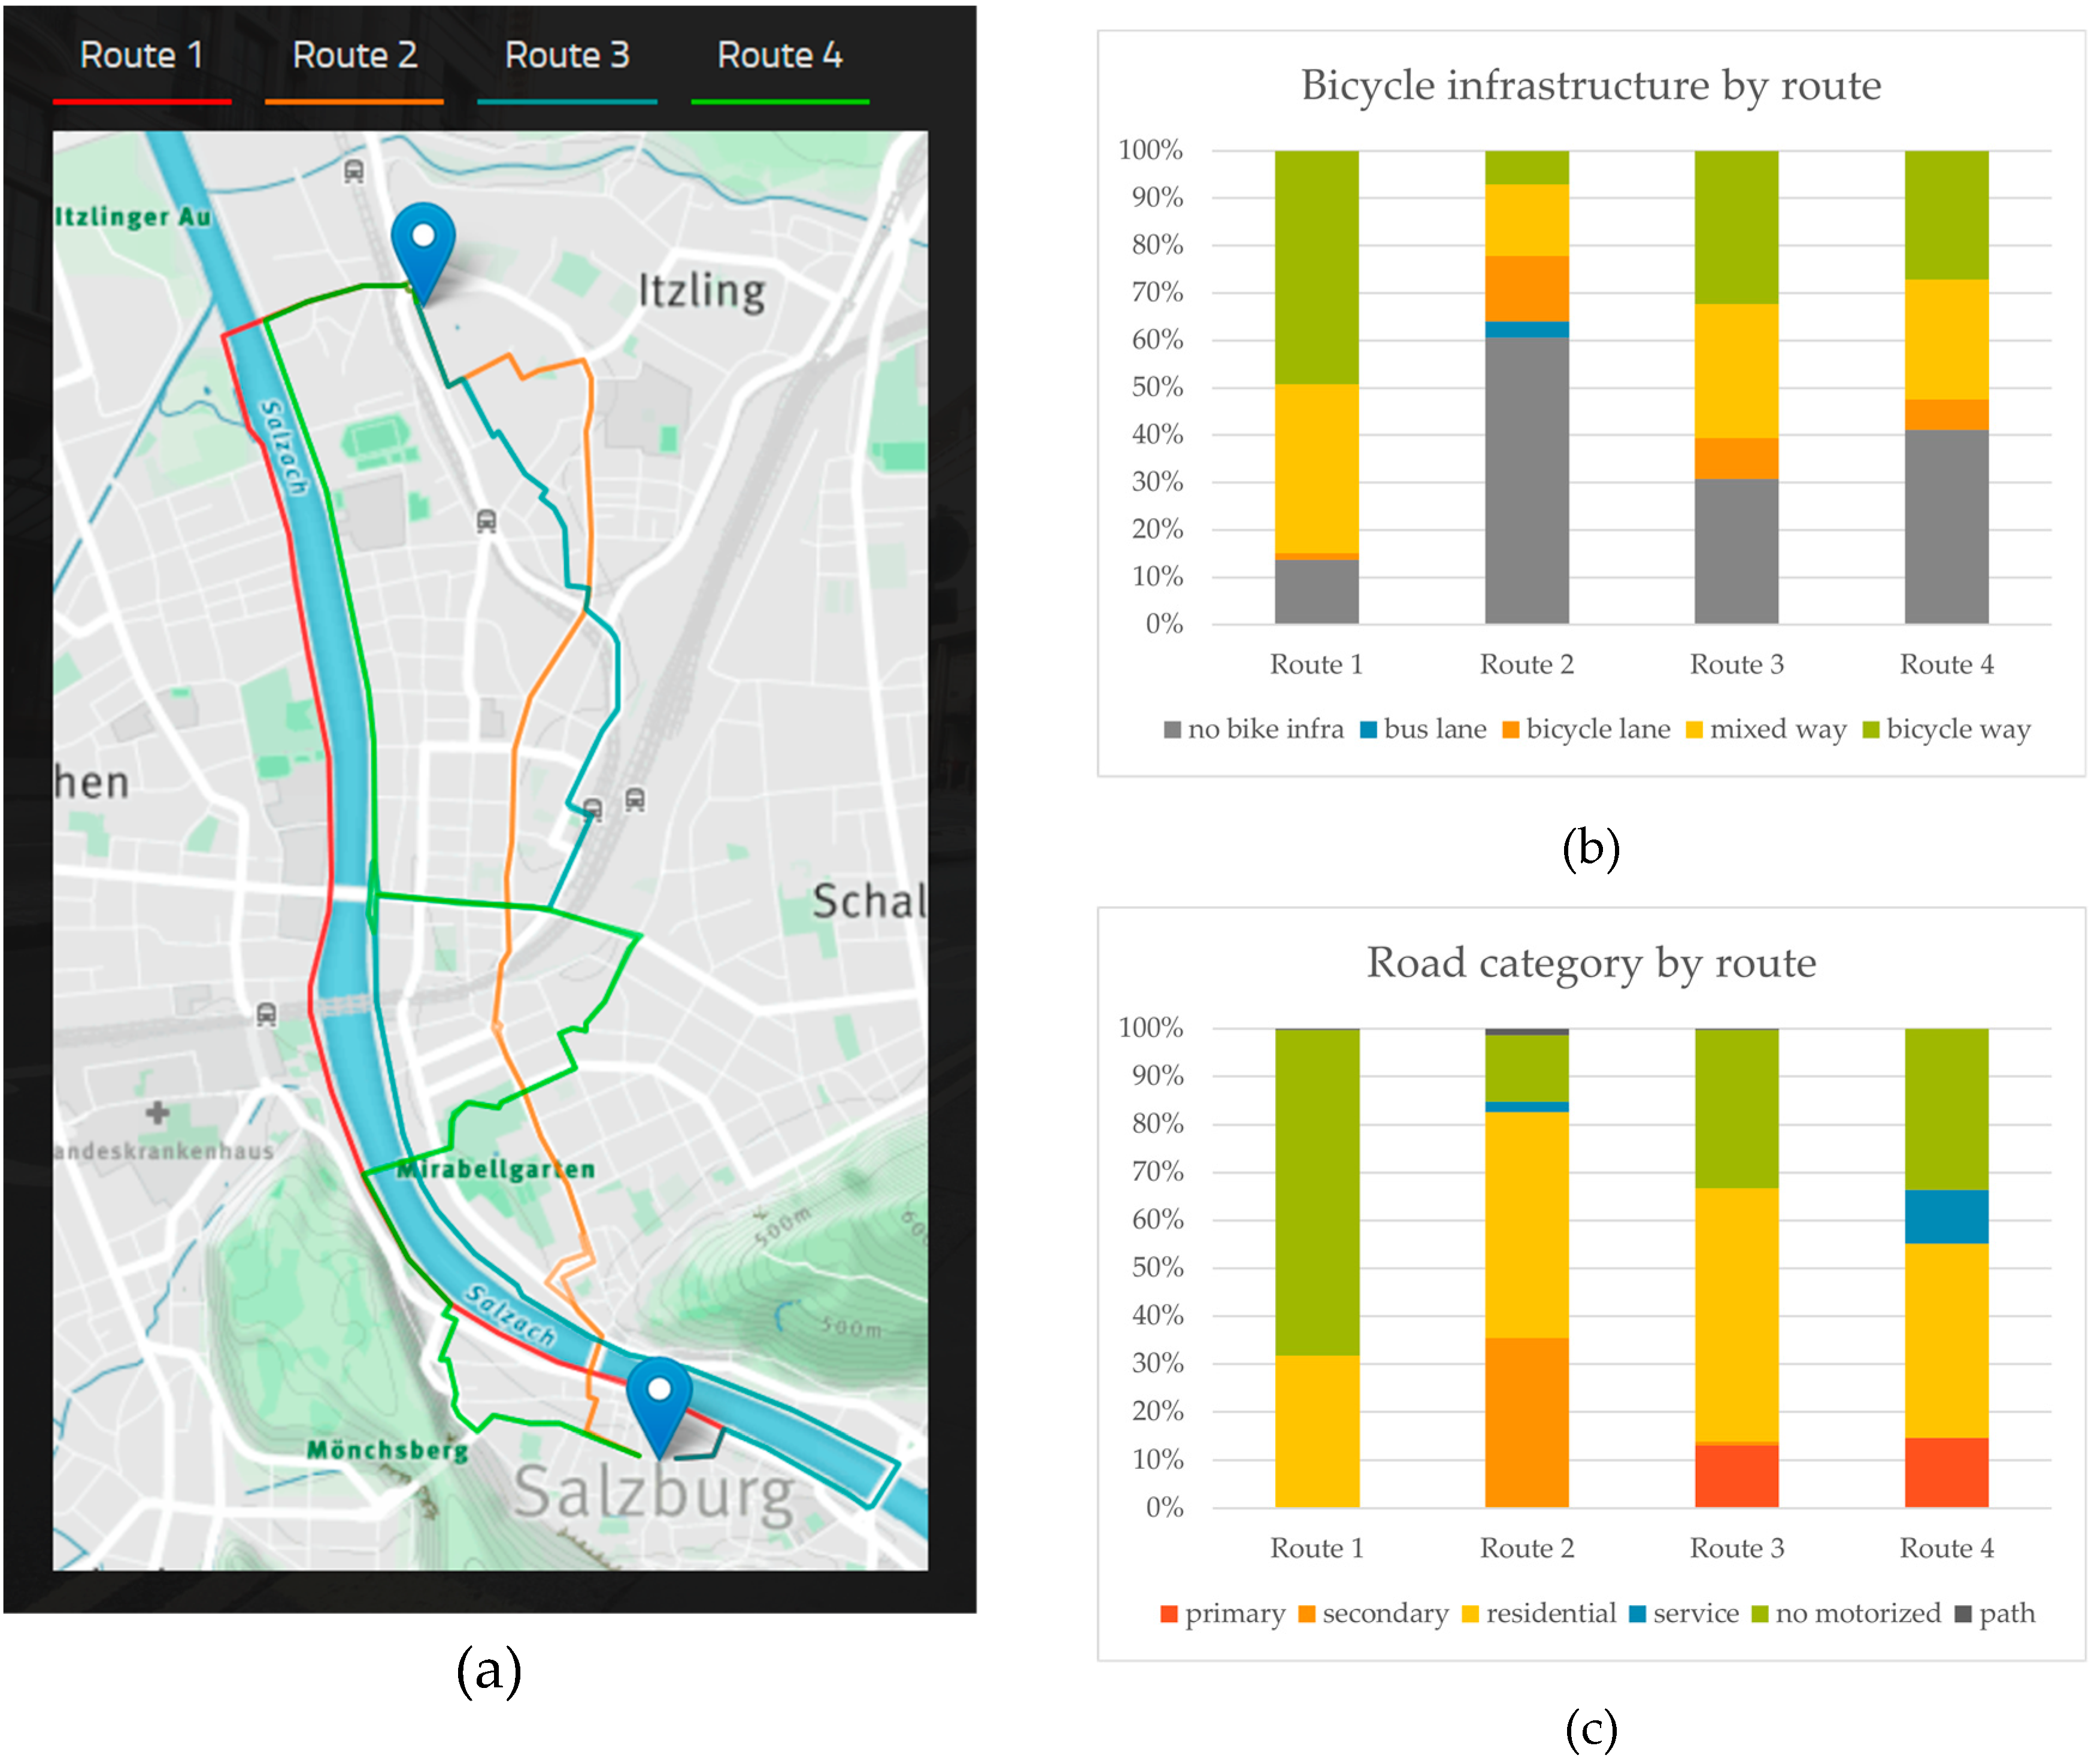
2.1. Case Study
2.1.1. Trip Survey
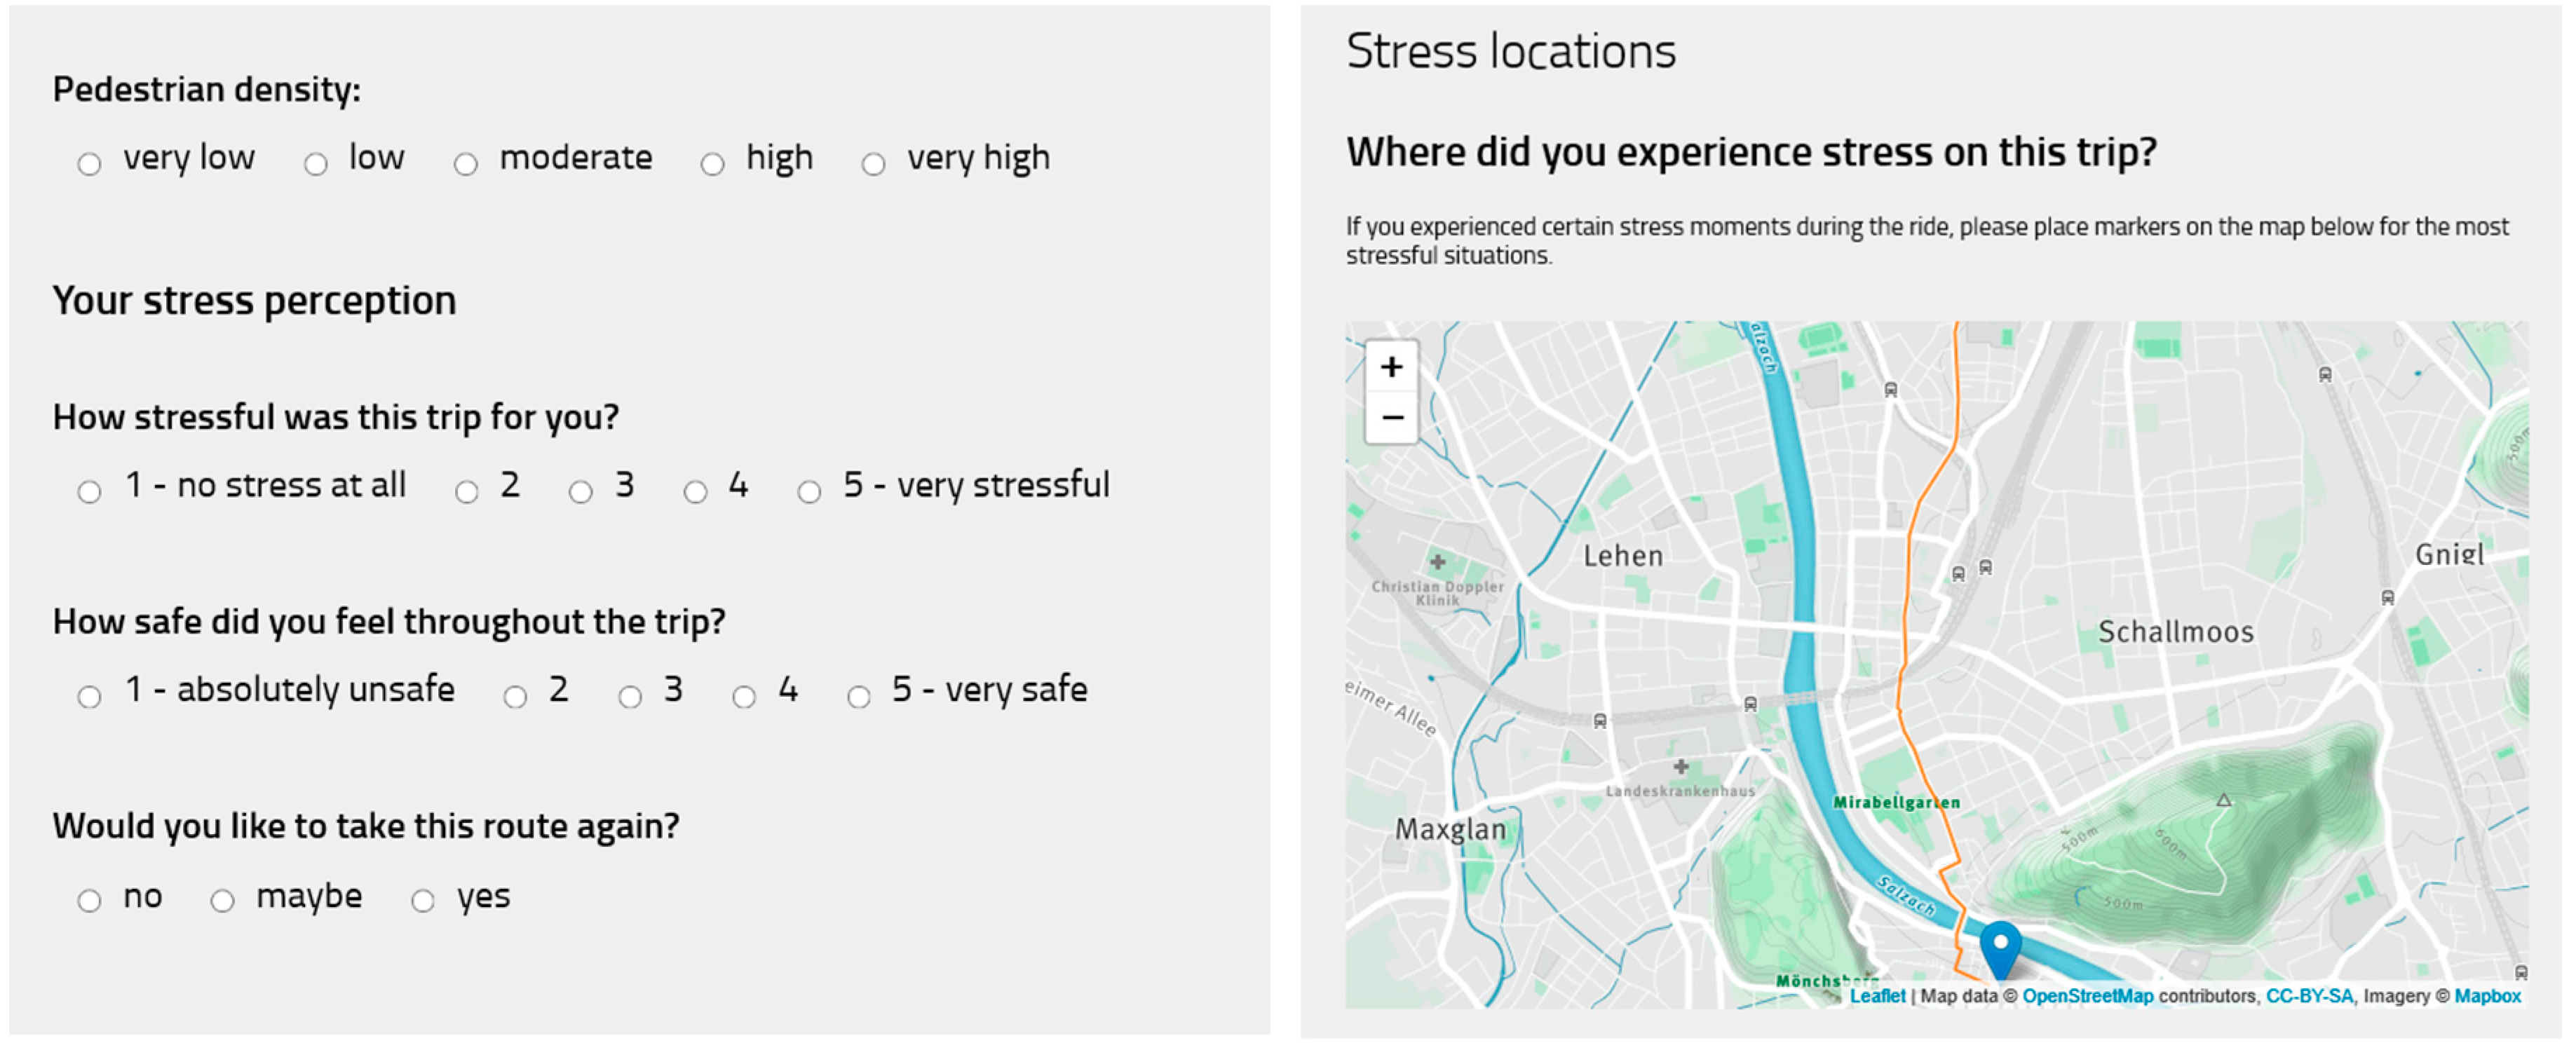
2.1.2. Final Survey
2.1.3. Participants
2.1.4. Privacy
2.2. Data Processing
2.2.1. Preprocessing
2.2.2. Map Matching
2.2.3. Stress Detection
2.2.4. Aggregation
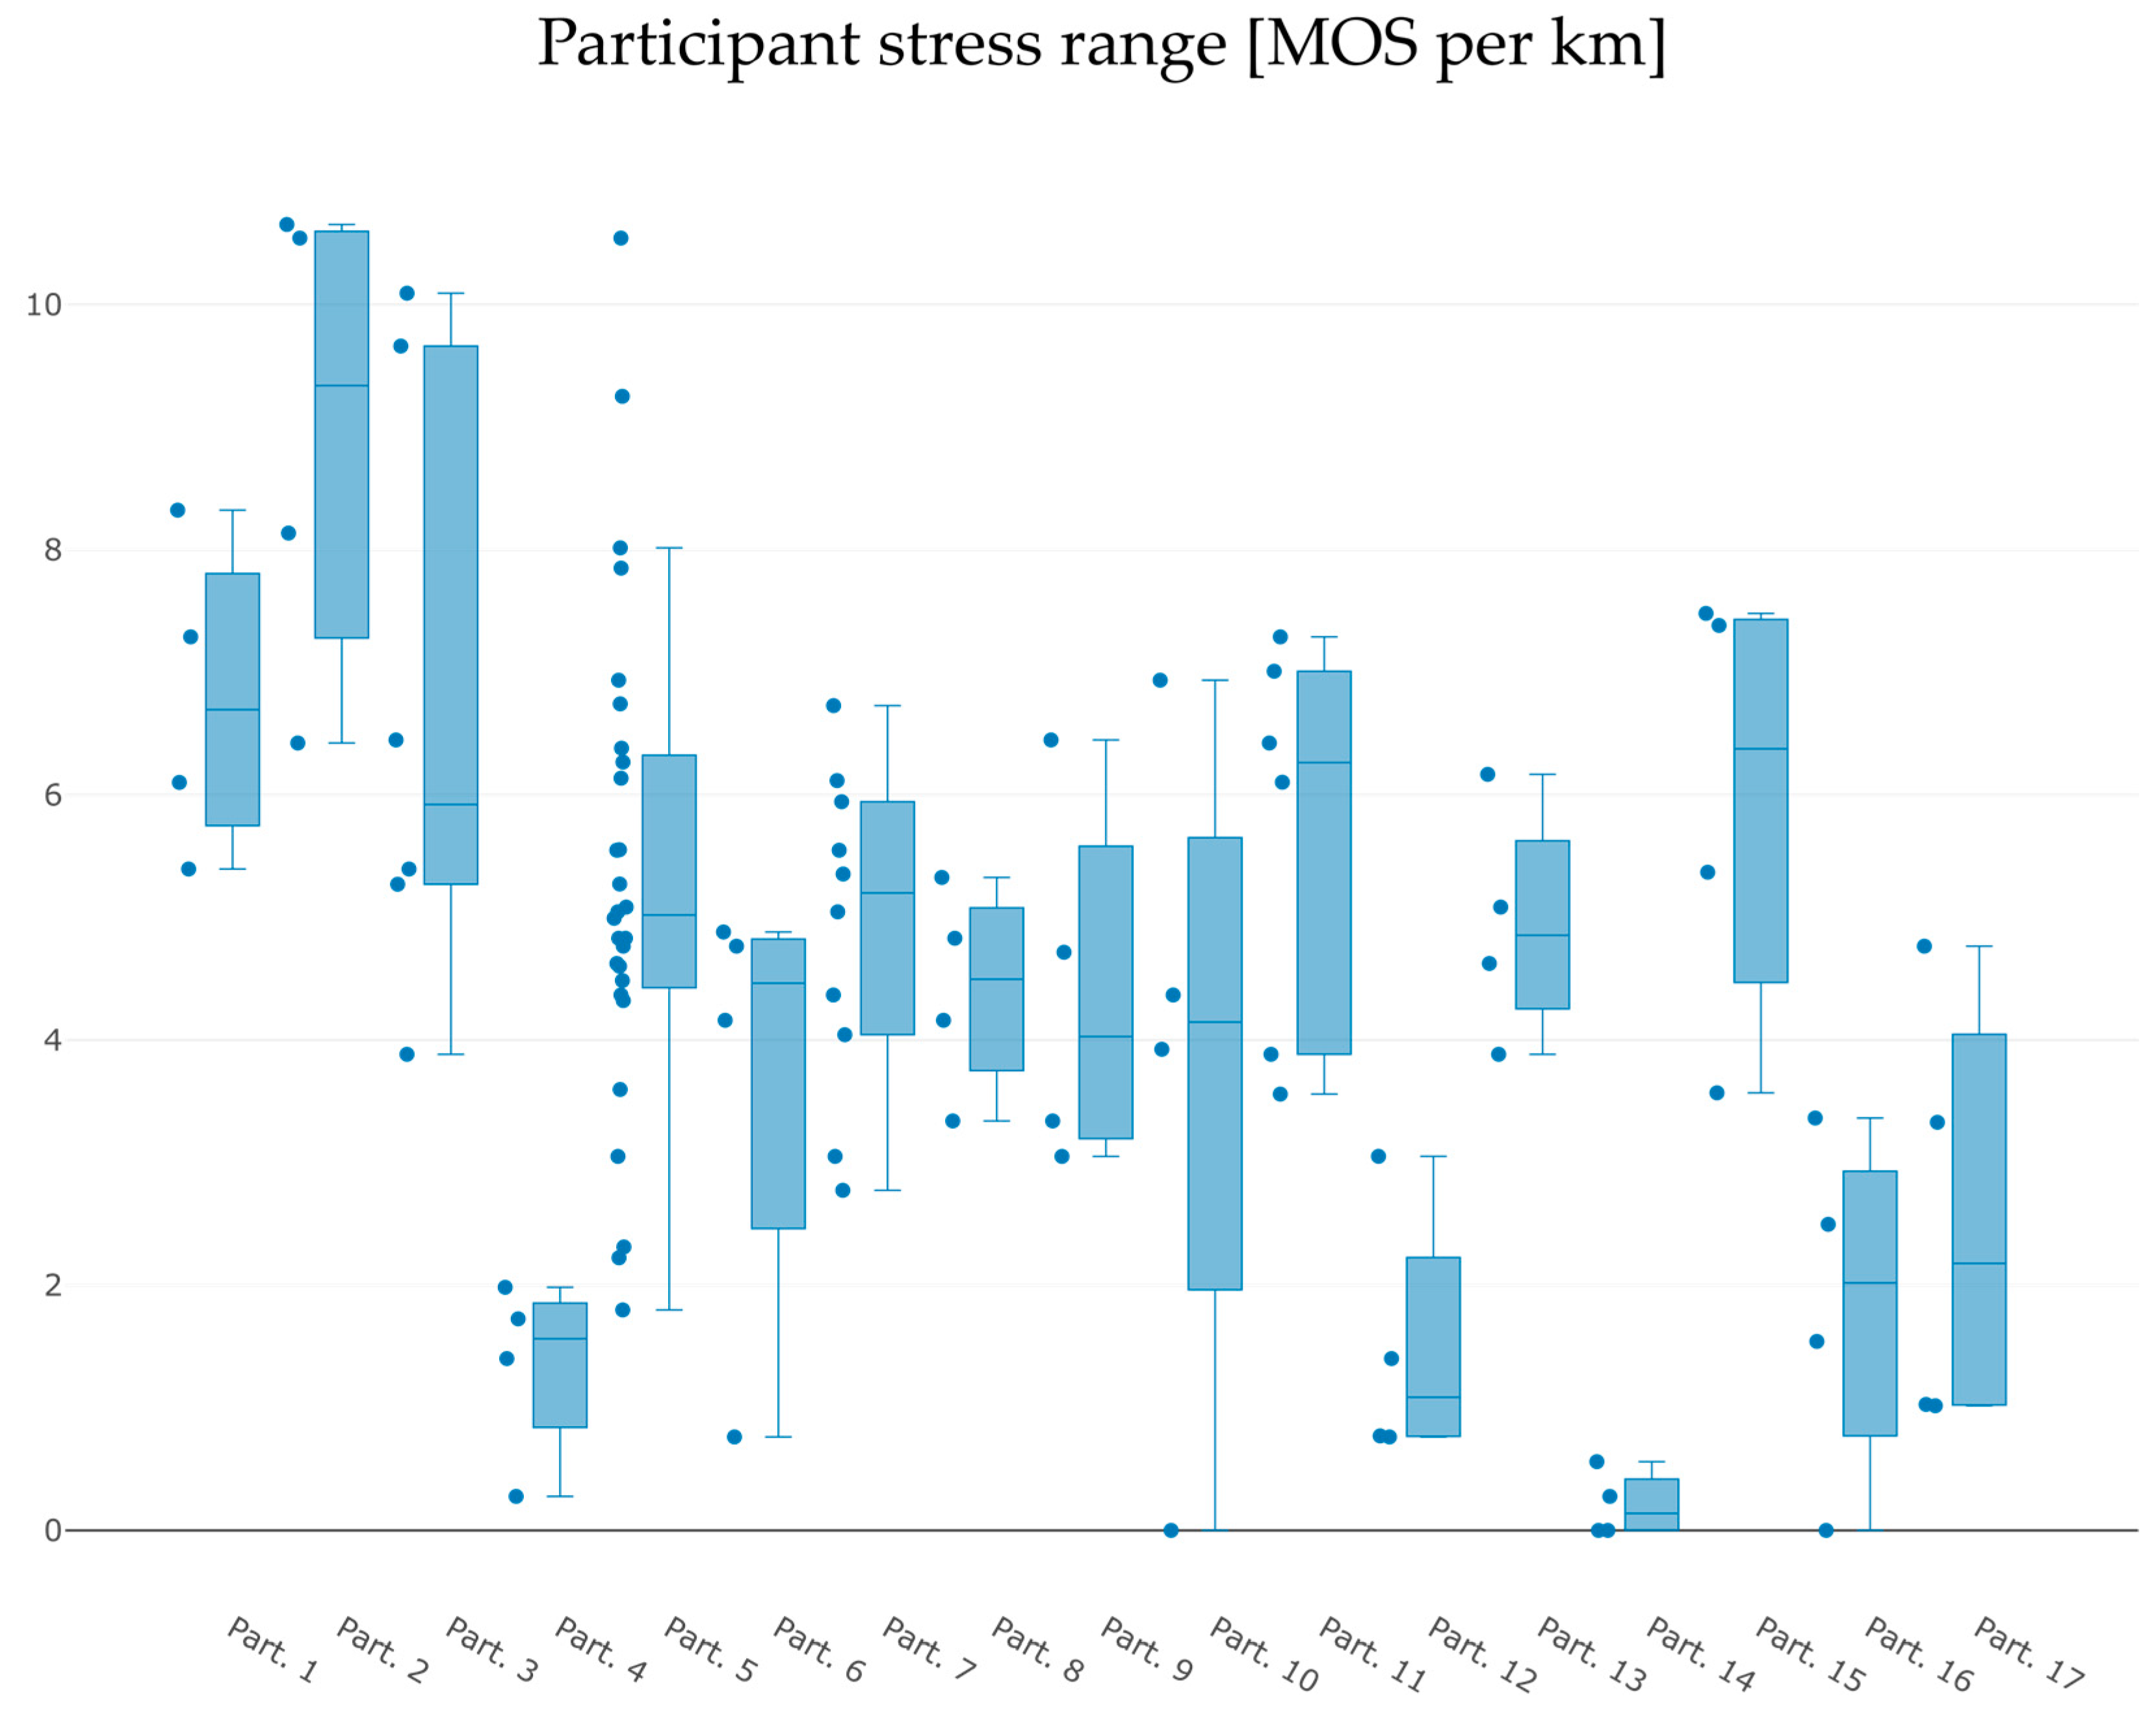
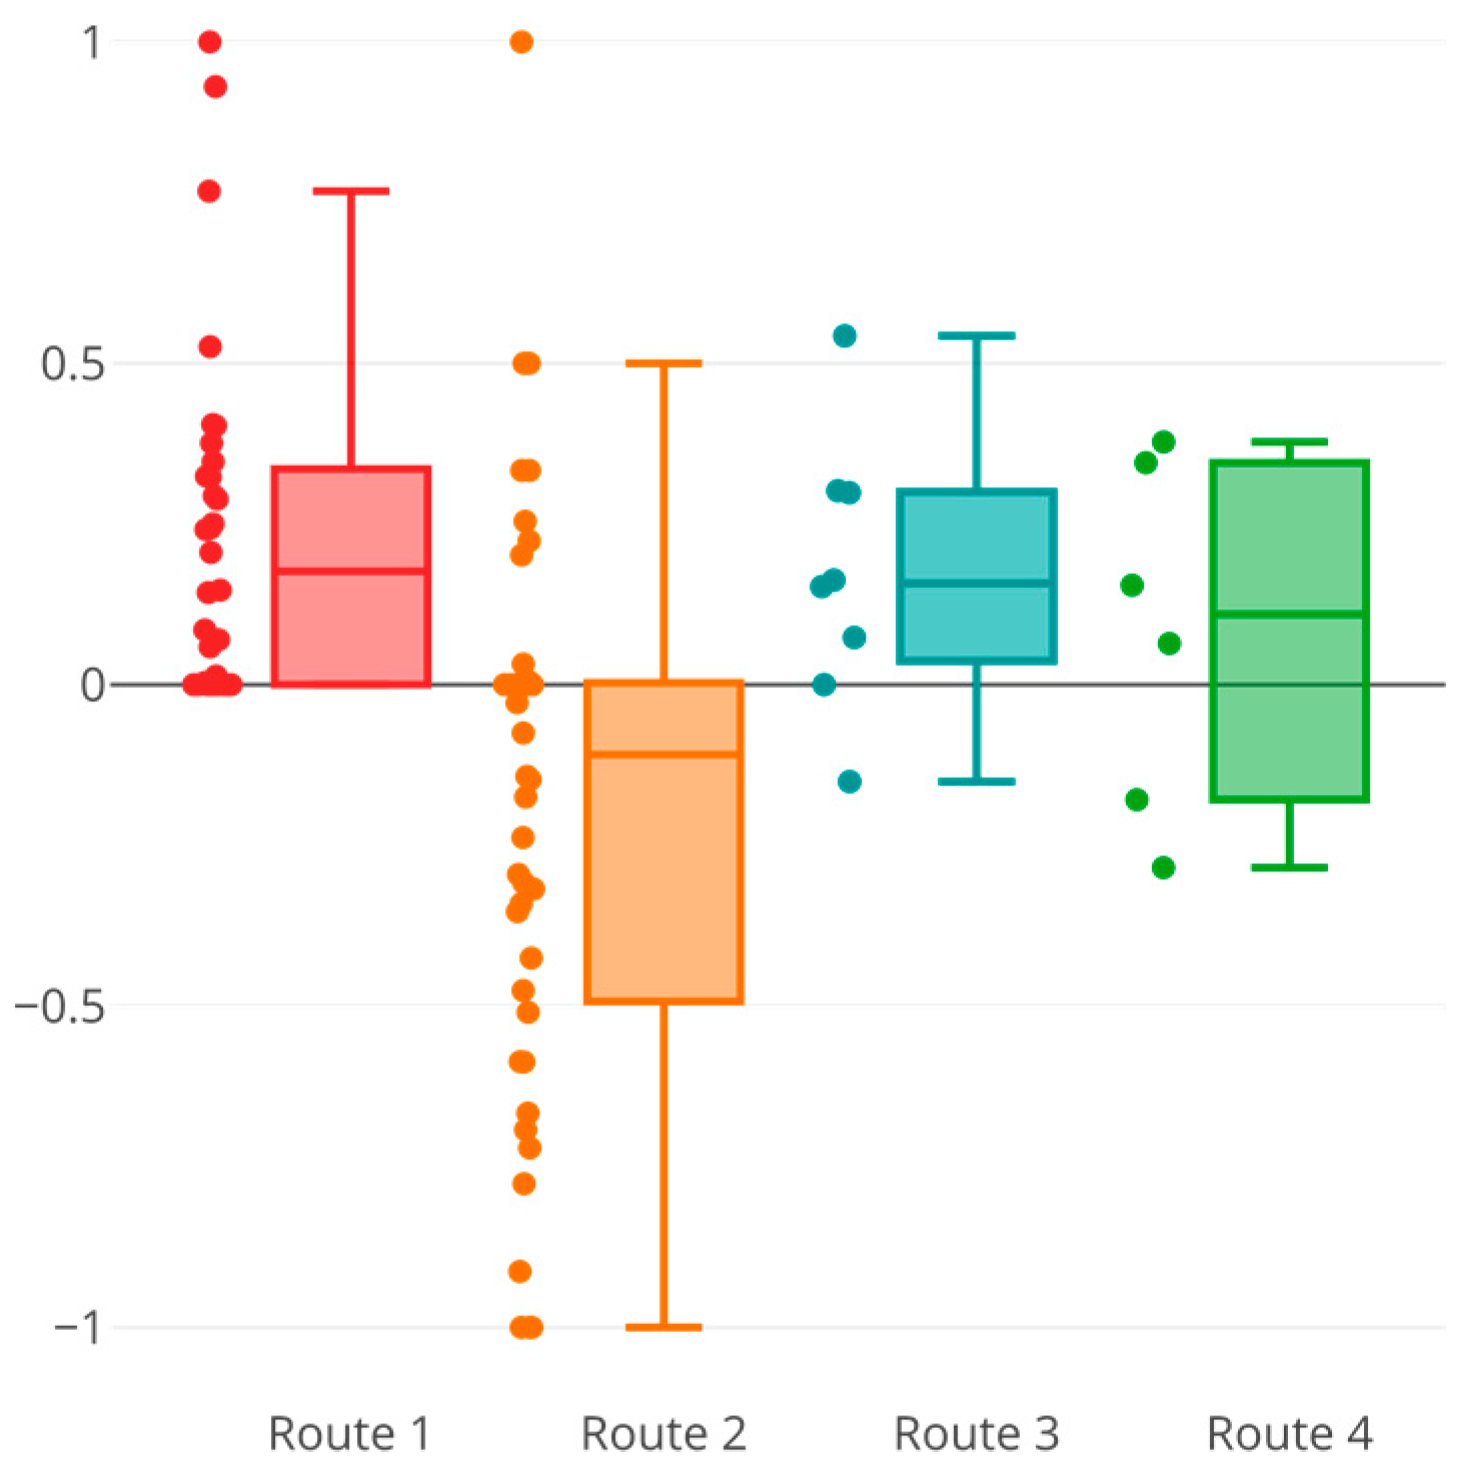
3. Results
4. Discussion
5. Conclusions
Author Contributions
Funding
Acknowledgments
Conflicts of Interest
References
- Beelen, R.; Raaschou-Nielsen, O.; Stafoggia, M.; Andersen, Z.J.; Weinmayr, G.; Hoffmann, B.; Wolf, K.; Samoli, E.; Fischer, P.; Nieuwenhuijsen, M.; et al. Effects of long-term exposure to air pollution on natural-cause mortality: An analysis of 22 European cohorts within the multicentre ESCAPE project. Lancet 2014, 383, 785–795. [Google Scholar] [CrossRef]
- Gee, G.C.; Takeuchi, D.T. Traffic stress, vehicular burden and well-being: A multilevel analysis. Soc. Sci. Med. 2004, 59, 405–414. [Google Scholar] [CrossRef] [PubMed]
- Hoek, G.; Krishnan, R.M.; Beelen, R.; Peters, A.; Ostro, B.; Brunekreef, B.; Kaufman, J.D. Long-term air pollution exposure and cardio-respiratory mortality: A review. Environ. Health 2013, 12, 43. [Google Scholar] [CrossRef] [PubMed]
- Raaschou-Nielsen, O.; Andersen, Z.J.; Beelen, R.; Samoli, E.; Stafoggia, M.; Weinmayr, G.; Hoffmann, B.; Fischer, P.; Nieuwenhuijsen, M.J.; Brunekreef, B.; et al. Air pollution and lung cancer incidence in 17 European cohorts: Prospective analyses from the European Study of Cohorts for Air Pollution Effects (ESCAPE). Lancet Oncol. 2013, 14, 813–822. [Google Scholar] [CrossRef]
- Shah, A.S.; Langrish, J.P.; Nair, H.; McAllister, D.A.; Hunter, A.L.; Donaldson, K.; Newby, D.E.; Mills, N.L. Global association of air pollution and heart failure: A systematic review and meta-analysis. Lancet 2013, 382, 1039–1048. [Google Scholar] [CrossRef]
- Song, Y.; Gee, G.C.; Fan, Y.; Takeuchi, D.T. Do physical neighborhood characteristics matter in predicting traffic stress and health outcomes? Transp. Res. Part F Traffic Psychol. Behav. 2007, 10, 164–176. [Google Scholar] [CrossRef] [Green Version]
- Flint, E.; Cummins, S.; Sacker, A. Associations between active commuting, body fat, and body mass index: population based, cross sectional study in the United Kingdom. BMJ 2014, 349, g4887. [Google Scholar] [CrossRef]
- Götschi, T.; Garrard, J.; Giles-Corti, B. Cycling as a Part of Daily Life: A Review of Health Perspectives. Transp. Rev. 2016, 36, 45–71. [Google Scholar] [CrossRef]
- Land Salzburg Landesmobilitätskonzept 2016 bis 2025—Präsentation der Landesregierung. Available online: https://www.salzburg.gv.at/verkehr_/Documents/pdf-salzburgmobil2025_vorschau_dialogforum1.pdf (accessed on 27 March 2018).
- Neuhold, T. Leidensdruck zwingt die Salzburger Verkehrspolitik zum Handeln. Der Standard, 17 July 2017. [Google Scholar]
- Cycling Embassy of Denmark (CED) COPENHAGEN CITY OF CYCLISTS—FACTS & FIGURES 2017. Available online: http://www.cycling-embassy.dk/wp-content/uploads/2017/07/Velo-city_handout.pdf (accessed on 27 March 2018).
- Dill, J. Bicycling for Transportation and Health: The Role of Infrastructure. J. Public Health Policy 2009, 30, S95–S110. [Google Scholar] [CrossRef]
- Ng, A.; Debnath, A.K.; Heesch, K.C. Cyclist’ safety perceptions of cycling infrastructure at un-signalised intersections: Cross-sectional survey of Queensland cyclists. J. Transp. Health 2017, 6, 13–22. [Google Scholar] [CrossRef]
- Sanders, R.L. Perceived traffic risk for cyclists: The impact of near miss and collision experiences. Accid. Anal. Prev. 2015, 75, 26–34. [Google Scholar] [CrossRef] [PubMed]
- Wahlgren, L.; Schantz, P. Exploring bikeability in a metropolitan setting: Stimulating and hindering factors in commuting route environments. BMC Public Health 2012, 12, 168. [Google Scholar] [CrossRef] [PubMed]
- Pánek, J.; Benediktsson, K. Emotional mapping and its participatory potential: Opinions about cycling conditions in Reykjavík, Iceland. Cities 2017, 61, 65–73. [Google Scholar] [CrossRef]
- Moudon, A.V.; Lee, C. Walking and Bicycling: An Evaluation of Environmental Audit Instruments. Am. J. Health Promot. 2003, 18, 21–37. [Google Scholar] [CrossRef] [PubMed]
- Winters, M.; Teschke, K.; Brauer, M.; Fuller, D. Bike Score®: Associations between urban bikeability and cycling behavior in 24 cities. Int. J. Behav. Nutr. Phys. Act. 2016, 13, 18. [Google Scholar] [CrossRef] [PubMed]
- Broach, J.; Dill, J.; Gliebe, J. Where do cyclists ride? A route choice model developed with revealed preference GPS data. Transp. Res. Part A Policy Pract. 2012, 46, 1730–1740. [Google Scholar] [CrossRef]
- Hood, J.; Sall, E.; Charlton, B. A GPS-based bicycle route choice model for San Francisco, California. Transp. Lett. 2011, 3, 63–75. [Google Scholar] [CrossRef]
- Loidl, M.; Zagel, B. Assessing Bicycle Safety in Multiple Networks with Different Data Models. In GI_Forum 2014. Geospatial Innovation for Society; Wichmann Verlag: Salzburg, Austria, 2014; pp. 144–154. [Google Scholar]
- Reynolds, C.C.; Harris, M.A.; Teschke, K.; Cripton, P.A.; Winters, M. The impact of transportation infrastructure on bicycling injuries and crashes: A review of the literature. Environ. Health 2009, 8, 47. [Google Scholar] [CrossRef]
- Lowry, M.B.; Furth, P.; Hadden-Loh, T. Prioritizing new bicycle facilities to improve low-stress network connectivity. Transp. Res. Part A Policy Pract. 2016, 86, 124–140. [Google Scholar] [CrossRef]
- Mekuria, M.; Furth, P.; Nixon, H. Low-Stress Bicycling and Network Connectivity; Mineta Transportation Institute Publications: San Jose, CA, USA, 2012. [Google Scholar]
- Krenn, P.J.; Oja, P.; Titze, S. Route choices of transport bicyclists: A comparison of actually used and shortest routes. Int. J. Behav. Nutr. Phys. Act. 2014, 11, 31. [Google Scholar] [CrossRef]
- Van Dyck, D.; Cerin, E.; Conway, T.L.; De Bourdeaudhuij, I.; Owen, N.; Kerr, J.; Cardon, G.; Frank, L.D.; Saelens, B.E.; Sallis, J.F. Perceived neighborhood environmental attributes associated with adults’ transport-related walking and cycling: Findings from the USA, Australia and Belgium. Int. J. Behav. Nutr. Phys. Act. 2012, 9, 70. [Google Scholar] [CrossRef] [PubMed]
- Vedel, S.E.; Jacobsen, J.B.; Skov-Petersen, H. Bicyclists’ preferences for route characteristics and crowding in Copenhagen—A choice experiment study of commuters. Transp. Res. Part A Policy Pract. 2017, 100, 53–64. [Google Scholar] [CrossRef]
- Alivand, M.; Hochmair, H.; Srinivasan, S. Analyzing how travelers choose scenic routes using route choice models. Comput. Environ. Urban Syst. 2015, 50, 41–52. [Google Scholar] [CrossRef]
- Hogertz, C. Emotions of the urban pedestrian: Sensory mapping. In COST 358—PQN Final Report; WALK21: Cheltenham, UK, 2010; p. 31. [Google Scholar]
- Höffken, S.; Wilhelm, J.; Groß, D.; Bergner, B.S.; Zeile, P. EmoCycling—Analysen von Radwegen mittels Humansensorik und Wearable Computing. In REAL CORP 2014—PLAN IT SMART! Clever Solutions for Smart Cities. Proceedings of 19th International Conference on Urban Planning, Regional Development and Information Society, Vienna, Austria, 21–23 May 2014; self-publishing by CORP – Competence Center of Urban and Regional Planning: Schwechat-Rannersdorf, Austria, 2014; pp. 851–860. [Google Scholar]
- Resch, B.; Sudmanns, M.; Sagl, G.; Summa, A.; Zeile, P.; Exner, J.-P. Crowdsourcing Physiological Conditions and Subjective Emotions by Coupling Technical and Human Mobile Sensors. GI-Forum 2015, 1, 514–524. [Google Scholar] [CrossRef] [Green Version]
- Zeile, P.; Resch, B.; Loidl, M.; Petutschnig, A.; Dörrzapf, L. Urban Emotions and Cycling Experience–enriching traffic planning for cyclists with human sensor data. GI_Forum 2016, 1, 204–216. [Google Scholar] [CrossRef]
- Healey, J.A.; Picard, R.W. Detecting stress during real-world driving tasks using physiological sensors. IEEE Trans. Intell. Transp. Syst. 2005, 6, 156–166. [Google Scholar] [CrossRef]
- Hernandez, J.; McDuff, D.; Benavides, X.; Amores, J.; Maes, P.; Picard, R. AutoEmotive: Bringing Empathy to the Driving Experience to Manage Stress. In Proceedings of the 2014 Companion Publication on Designing Interactive Systems, Vancouver, BC, Canada, 21–25 June 2014; ACM: New York, NY, USA, 2014; pp. 53–56. [Google Scholar]
- Shoval, N.; Schvimer, Y.; Tamir, M. Real-Time Measurement of Tourists’ Objective and Subjective Emotions in Time and Space. J. Travel Res. 2018, 57, 3–16. [Google Scholar] [CrossRef]
- Blackburn, S. Intersubjectivity. In The Oxford Dictionary of Philosophy; Oxford University Press: Oxford, UK, 2008. [Google Scholar]
- Chandler, D.; Munday, R. Intersubjectivity. In A Dictionary of Media and Communication; Oxford University Press: Oxford, UK, 2011. [Google Scholar]
- Land Salzburg LandSalzburginZahlen.pdf. Available online: https://www.salzburg.gv.at/salzburg_/Documents/LandSalzburginZahlen.pdf (accessed on 29 March 2018).
- Empatica Empatica E4 Technical Specifications. Available online: http://box.empatica.com/documentation/20141119_E4_TechSpecs.pdf (accessed on 25 March 2018).
- Empatica Comparison Procomp vs. Empatica E3 Skin Conductance Signal. Available online: https://empatica.app.box.com/s/a53t8mnose4l3331529r1ma3fbzmxtcb (accessed on 27 March 2018).
- Garbarino, M.; Lai, M.; Bender, D.; Picard, R.W.; Tognetti, S. Empatica E3 #x2014; A wearable wireless multi-sensor device for real-time computerized biofeedback and data acquisition. In Proceedings of the 2014 4th International Conference on Wireless Mobile Communication and Healthcare—Transforming Healthcare Through Innovations in Mobile and Wireless Technologies (MOBIHEALTH), Athens, Greece, 3–5 November 2014; pp. 39–42. [Google Scholar]
- Kounadi, O.; Resch, B. A Geoprivacy by Design Guideline for Research Campaigns That Use Participatory Sensing Data. J. Empir. Res. Hum. Res. Ethics 2018, 13, 203–222. [Google Scholar] [CrossRef] [Green Version]
- Lykken, D.T.; Venables, P.H. Direct measurement of skin conductance: A proposal for standardization. Psychophysiology 1971, 8, 656–672. [Google Scholar] [CrossRef]
- Benedek, M.; Kaernbach, C. Decomposition of skin conductance data by means of nonnegative deconvolution. Psychophysiology 2010, 47, 647–658. [Google Scholar] [CrossRef] [Green Version]
- Kyriakou, K.; Resch, B.; Sagl, G.; Petutschnig, A.; Werner, C.; Niederseer, D.; Liedlgruber, M.; Wilhelm, F. Detecting Moments of Stress from Measurements of Wearable Physiological Sensors. Sensors. submitted.
- Quddus, M.A.; Ochieng, W.Y.; Noland, R.B. Current map-matching algorithms for transport applications: State-of-the art and future research directions. Transp. Res. Part C Emerging Technologies 2007, 15, 312–328. [Google Scholar] [CrossRef] [Green Version]
- Schweizer, J.; Bernardi, S.; Rupi, F. Map-matching algorithm applied to bicycle global positioning system traces in Bologna. IET Intell. Transp. Syst. 2016, 10, 244–250. [Google Scholar] [CrossRef]
- Google LLC Location. Available online: https://developer.android.com/reference/android/location/Location (accessed on 12 May 2019).
- Posada-Quintero, H.F.; Reljin, N.; Mills, C.; Mills, I.; Florian, J.P.; VanHeest, J.L.; Chon, K.H. Time-varying analysis of electrodermal activity during exercise. PLoS ONE 2018, 13, e0198328. [Google Scholar] [CrossRef] [PubMed]
- Gjoreski, M.; Luštrek, M.; Gams, M.; Gjoreski, H. Monitoring stress with a wrist device using context. J. Biomed. Inform. 2017, 73, 159–170. [Google Scholar] [CrossRef] [PubMed]
- Bluemke, M.; Resch, B.; Lechner, C.; Westerholt, R.; Kolb, J.-P. Integrating Geographic Information into Survey Research: Current Applications, Challenges and Future Avenues. Surv. Res. Methods 2017, 11, 307–327. [Google Scholar]


© 2019 by the authors. Licensee MDPI, Basel, Switzerland. This article is an open access article distributed under the terms and conditions of the Creative Commons Attribution (CC BY) license (http://creativecommons.org/licenses/by/4.0/).
Share and Cite
Werner, C.; Resch, B.; Loidl, M. Evaluating Urban Bicycle Infrastructures through Intersubjectivity of Stress Sensations Derived from Physiological Measurements. ISPRS Int. J. Geo-Inf. 2019, 8, 265. https://doi.org/10.3390/ijgi8060265
Werner C, Resch B, Loidl M. Evaluating Urban Bicycle Infrastructures through Intersubjectivity of Stress Sensations Derived from Physiological Measurements. ISPRS International Journal of Geo-Information. 2019; 8(6):265. https://doi.org/10.3390/ijgi8060265
Chicago/Turabian StyleWerner, Christian, Bernd Resch, and Martin Loidl. 2019. "Evaluating Urban Bicycle Infrastructures through Intersubjectivity of Stress Sensations Derived from Physiological Measurements" ISPRS International Journal of Geo-Information 8, no. 6: 265. https://doi.org/10.3390/ijgi8060265