Evacuation Priority Method in Tsunami Hazard Based on DMSP/OLS Population Mapping in the Pearl River Estuary, China


1
Guangdong Open Laboratory of Geospatial Information Technology and Application, Guangdong Engineering Technology Center for Remote Sensing Big Data Application, Guangdong Key Laboratory of Remote Sensing and GIS Technology Application, Guangzhou Institute of Geography, Guangzhou 510070, China
2
State Key Laboratory of Information Engineering in Surveying, Mapping and Remote Sensing, Wuhan University, Wuhan 430079, China
*
Author to whom correspondence should be addressed.
ISPRS Int. J. Geo-Inf. 2019, 8(3), 137; https://doi.org/10.3390/ijgi8030137
Submission received: 9 January 2019
/
Revised: 26 February 2019
/
Accepted: 4 March 2019
/
Published: 9 March 2019
Abstract
:Evacuation plans are critical in case of natural disaster to save people’s lives. The priority of population evacuation on coastal areas could be useful to reduce the death toll in case of tsunami hazard. In this study, the population density remote sensing mapping approach was developed using population records in 2013 and Defense Meteorological Satellite Program’s Operational Linescan System (DMSP/OLS) night-time light (NTL) image of the same year for defining the coastal densest resident areas in Pearl River Estuary (PRE), China. Two pixel-based saturation correction methods were evaluated for application of population density mapping to enhance DMSP/OLS NTL image. The Vegetation Adjusted NTL Urban Index (VANUI) correction method (R2 (original/corrected): 0.504, Std. error: 0.0069) was found to be the better-fit correction method of NTL image saturation for the study area compared to Human Settlement Index (HSI) correction method (R2 (original/corrected): 0.219, Std. error: 0.1676). The study also gained a better dynamic range of HSI correction (0~25 vs. 0.1~5.07) compared to the previous one [27]. The town-level’s population NTL simulation model is built (R2 = 0.43, N = 47) for the first time in PRE with mean relative error (MSE) of 32% (N = 24, town level), On the other side, the tsunami hazard map was produced based on numerical modeling of potential tsunami wave height and velocity, combining with the river net system, elevation, slope, and vegetation cover factors. Both results were combined to produce an evacuation map in PRE. The simulation of tsunami exposure on density of population showed that the highest evacuation priority was found to be in most of Zhuhai city area and the coastal area of Shenzhen City under wave height of nine meters, while lowest evacuation priority was defined in Panyu and Nansha Districts of Guangzhou City, eastern and western parts of Zhongshan City, and northeast and northwest parts of Dongguan City. The method of tsunami risk simulation and the result of mapped tsunami exposure are of significance for direction to tsunami disaster-risk reduction or evacuation traffic arrangement in PRE or other coastal areas in the world.
1. Introduction
A tsunami can severely influence coastal areas in many countries worldwide. It is one of the most devastating natural coastal disasters. Submarine earthquakes occurring in subduction zones generate most of the large tsunamis. However, Tsunamis can also be triggered by volcanic eruptions and massive landslides [1,2].
The population evacuation plan is critical for coastal people safety in case of a tsunami hazard. Reliable information on population distribution is essential to help decision-makers to reduce the death toll of the disaster occurring. Hence, it is crucial to map population distribution in coastal areas and include it in evacuation planning to give the government a chance to take the right decision in evacuation prioritization and rescue operations.
The Pearl River Estuary (PRE) could be affected by a tsunami generated by an earthquake in the Manila subduction zone [2,3,4,5], Taiwan region [6], and local sources [7]. The potential tsunami from the Manila trench is the most expected source for hazardous tsunamis in the South China Sea [2,8]. The Manila subduction zone, or so-called Manila Trench, is an active subduction zone starting from the northern tip of Palawan, Philippine, evolving to the north along the Western edge of Luzon, Philippine and ending in Taiwan with the length of about 1000 km. It was initiated in the early Miocene (22–25 Ma) and remains active to the present day [4,8,9].
Historical records show past tsunami earthquakes in the PRE region [10], such as the huge tsunami in 1076 A.D which reached 500 km away from the shoreline of PRE. More information about historical tsunami events and potential future tsunamis in the study area and the South China Sea (SCS) in general could be extracted from the literature [2,11].
Literature has employed numerical modeling techniques to analyze the probability for tsunami waves of various heights to hit the PRE based on potential large earthquakes originating from the Manila Trench [1,3,4,5,12]. Some have concluded that the wave height could reach between eight to ten meters in case of high magnitude earthquake [4,9,13]. Time of the tsunami wave arrival to the PRE coast was also estimated in some models between two hours and a half to three hours [4,9].
Evacuation plans were proposed in different ways. Mainly, as a GIS-based analysis to map the best routes for horizontal evacuation [14,15,16], and vertical evacuation [17,18]. Nevertheless, present evacuation plans in many studies did not evaluate population density in hazardous areas. Besides, those plans are typically applied in a city scale ignoring population in suburban and rural areas.
On the other hand, GIS and remote sensing were successfully utilized to improve the spatial distribution of population statistical data. Among different remote sensing data sources, night-time light (NTL) imagery was used successfully to distribute population density over wide areas [19,20,21]. NTL imagery offers a unique ability to observe human activities by measuring the night-time radiance in the visible and near-infrared (VNIR) wavelength. Distribution of population based on NTL seem to provide a basis for reliable population modeling to a resolution of at least 1 km [22].
The use of light emissions data as a proxy of population distribution and density has received growing attention in recent years. Data from the Defense Meteorological Satellite Program’s Operational Linescan System (DMSP/ OLS) have already been used depending on the relationship between night-time light emissions and population density have likewise been demonstrated across some countries and used as a basis for mapping population distribution [23,24].
For the best of our knowledge, there were few studies produced to evaluate saturation correction of DMSP/OLS image in the whole metropolitan region of PRE. Tsunami evacuation assessment has not been produced in PRE, nor had the combination of detailed population density and DMSP/OLS remote sensing involved in evacuation models in a large area like PRE. Moreover, this study was conducted for the first time to develop the remote sensing simulation method of population density in risky areas under the case of tsunami hazard at the town level for whole PRE area. Based on the method, a feasible way for town-level’s population mapping to a high resolution of at least 1 km2 was produced. Finally., it was pointed out the areas with different population densities and risks, to assist decision makers with proper population evacuation plans to reduce potential loss of citizens lives.
2. Study Area
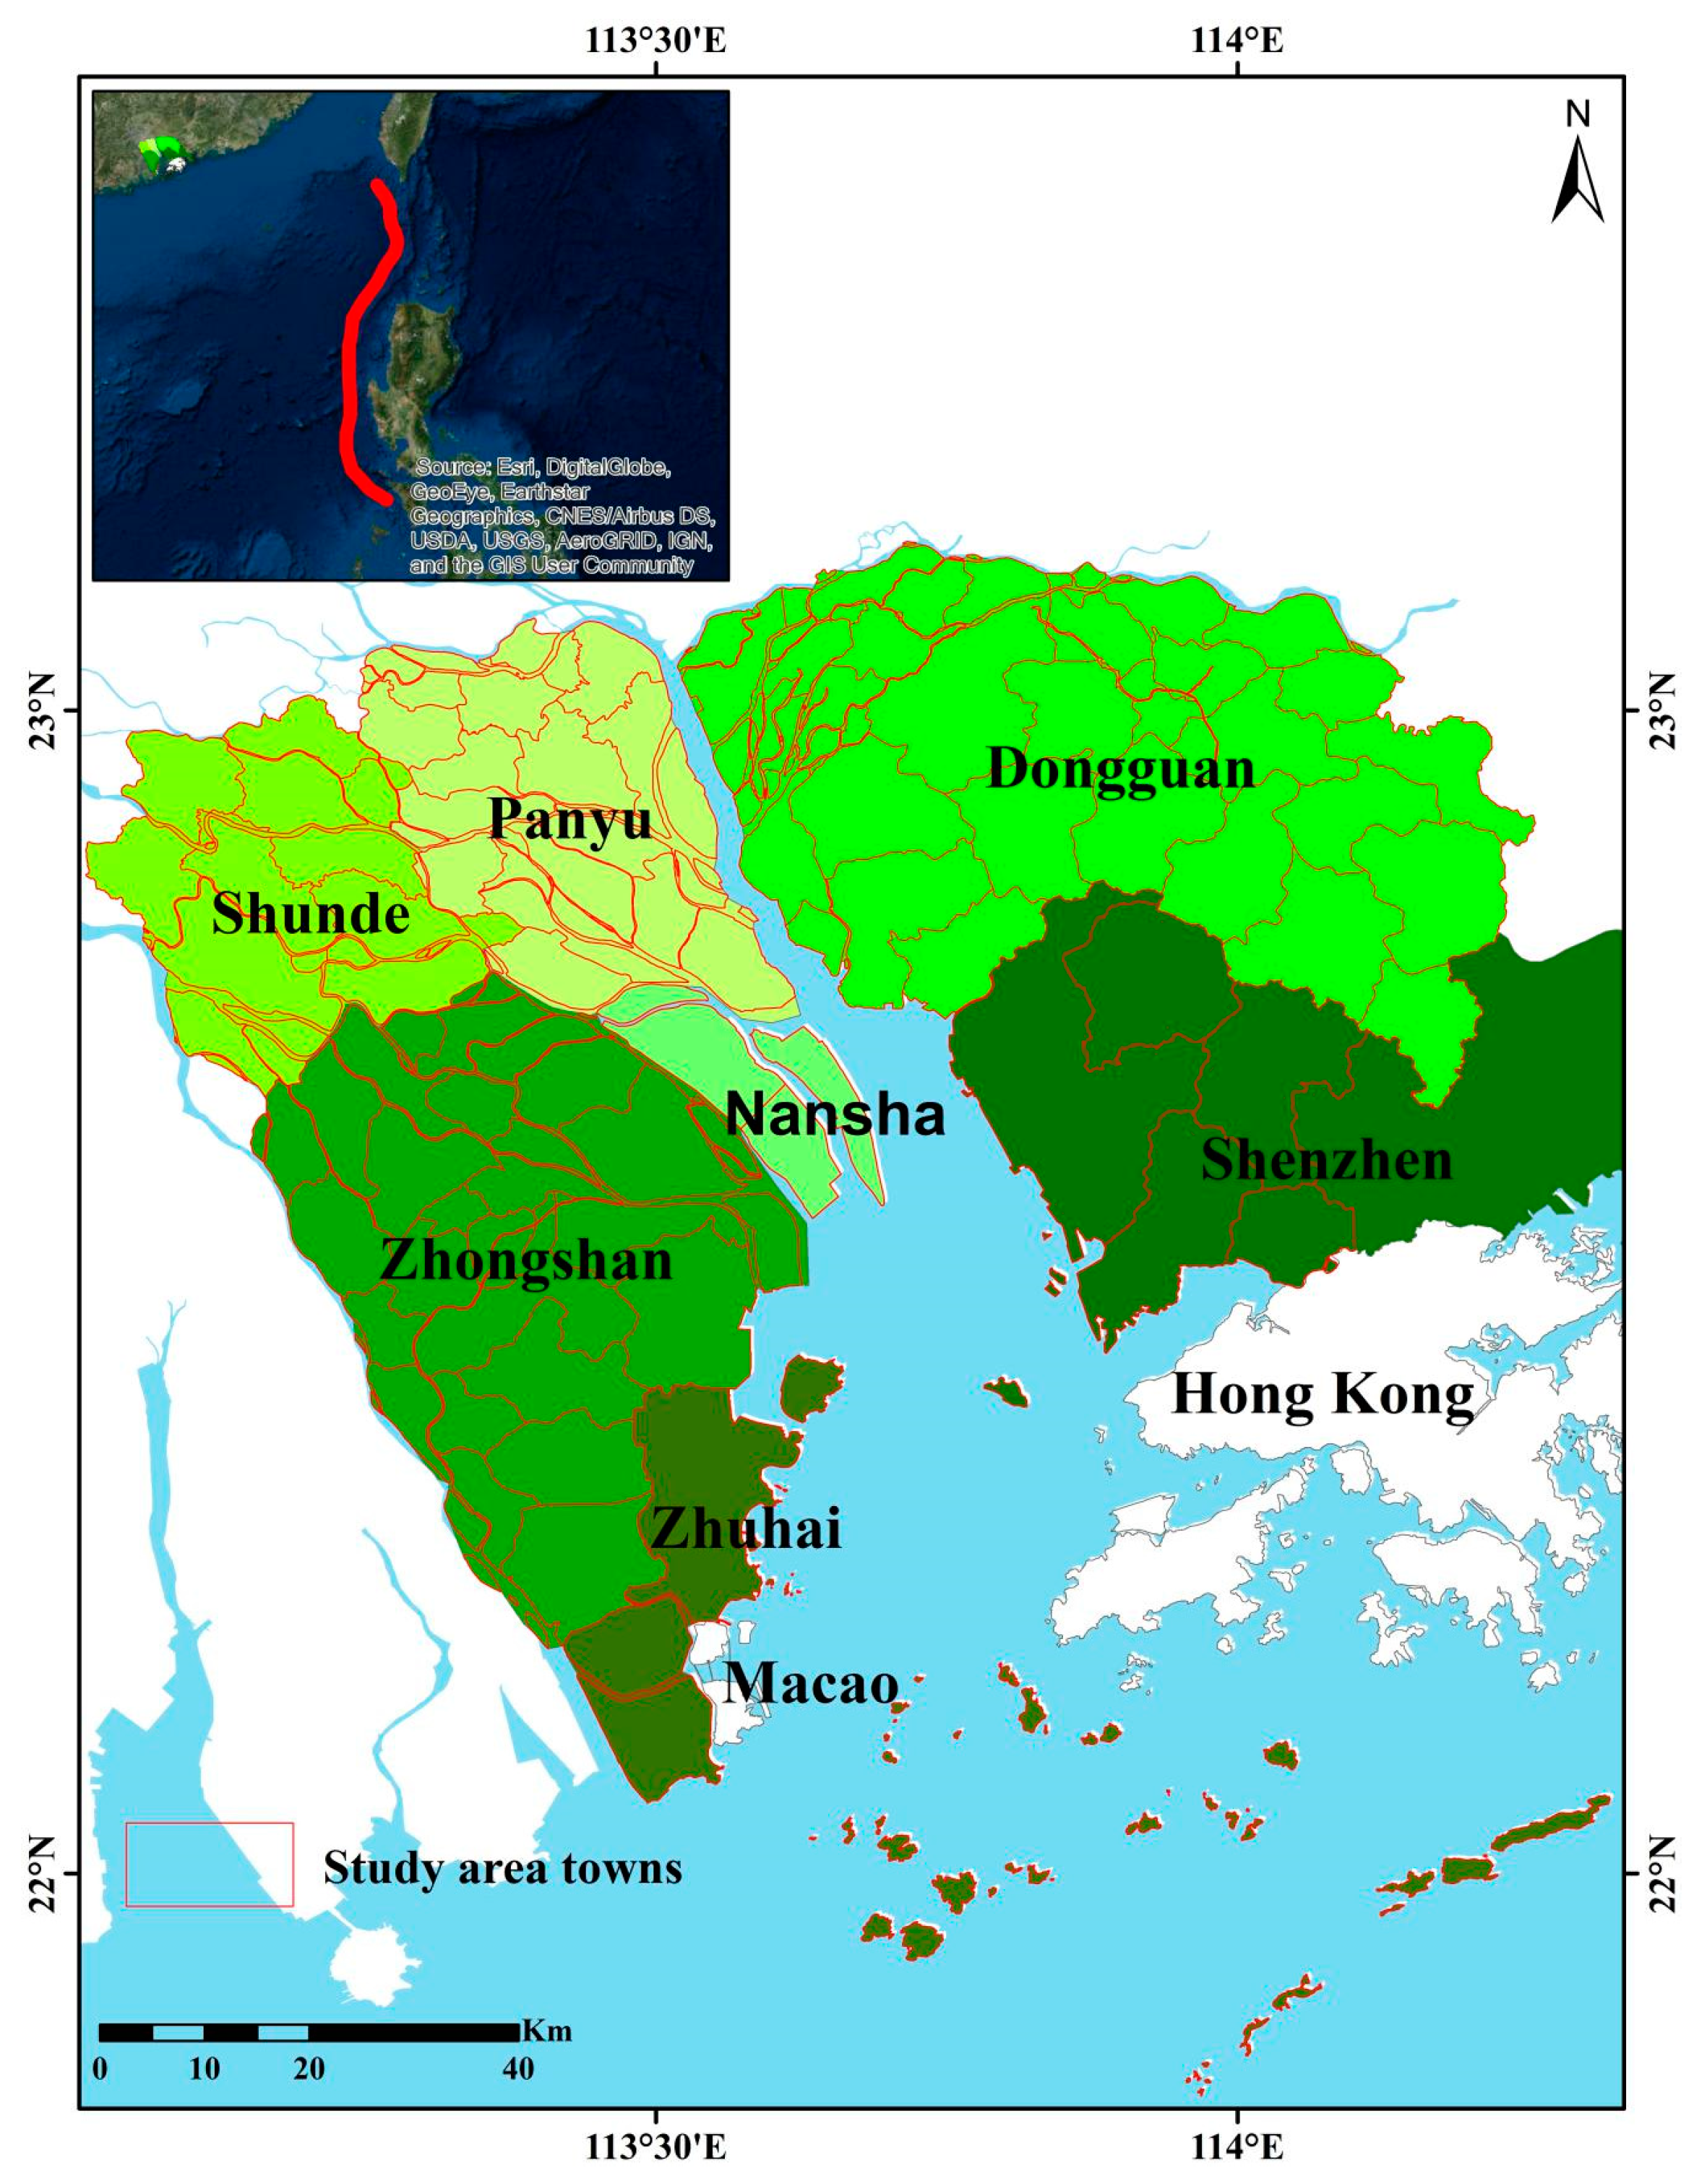
The PRE region is situated on the southeast coast of China. It is one of the largest urban areas in the South China Sea [2]. This region has become one of the most economically developed regions in China since the reform opening to the outer world in the late 1970s. It has major infrastructure projects, such as the Hong Kong−Zhuhai-Macao Bridge, and two Special Economic Zones of Zhuhai and Shenzhen cities. Besides, there are other middle-sized cities, such as Zhongshan, and Dongguan [7,23].
As a result of the economic development in the PRE, this area has become one of the country’s densest regions in the population [23]. The high population density combining with the great economic importance of the PRE because of the intensive growth of harbors and manufacture industry in the coastal areas, gives importance to prepare for any potential tsunami waves. Especially, because of the low altitude of the PRE coast and the number of river branches in the area, that created a complicated river net system in Pearl River Delta. This makes the coastal area extremely vulnerable to potential tsunami waves, probably suffering a large-scale tsunami disaster, even with very low tsunami wave height [10,23].
Figure 1 presents the location of the Manila Trench and the area of interest in this study. This area includes the whole districts of Dongguan, Zhongshan, and Zhuhai Cities, Shunde District of Foshan City, Panyu and Nansha Districts of Guangzhou City, and the Western part of Shenzhen city, which located directly on the eastern coast of the PRE.
3. Methodology
3.1. Data Collection
The latest available cloud-free DMSP/OLS NTL composite image provided by the American National Oceanic and Atmospheric Administration (NOAA), was acquired in the year 2013. This image was downloaded from the American National Geophysical Data Center website [24]. This composite image was made using all the available archived DMSP/OLS smooth resolution data for the calendar year of 2013.
The DMSP program first provided low-light imaging data in 1972, and now provides a routine source of NTL emissions data. The DMSP satellites are in low-altitude (830 km) sun-synchronous polar orbits and carry oscillating scan radiometers—Operational Line-scan Systems (OLS)—with low-light visible and thermal infrared imaging capabilities. While the primary purpose of these satellites is to monitor global weather conditions during daylight hours, at least one sensor has been regularly operated at night, at a gain setting capable of detecting clouds using moonlight [22].
Based on the DMSP/OLS NTL available image of 2013, the population data of the same year was collected online from the Statistics Information Network (Statistical Yearbook) of each city’s website in PRE, as shown in Table 1. In total, the population of 85 towns in PRE was collected.
To improve the capability of population density modeling of the study area from remote sensing, saturation correction of DMSP/OLS image has to be produced for the bright cores of urban centers. Hence, a set of 23 MODIS Normalized Difference Vegetation Index (NDVI) images [25], acquired in 2013 were downloaded from The Global Visualization interface website (http://glovis.usgs.gov), to be used for this purpose. Additionally, Shuttle Radar Topography Mission (SRTM) 1 arc data of DEM was used as an input to the GIS evacuation prioritization model [26].
3.2. DMSP/OLS Data Saturation Correction
DMSP/OLS sensor was typically operated in a high gain setting to enable the detection of moonlit clouds at the nighttime. This operation resulted in the saturation of recorded data in the bright cores of urban centers, due to the six-bit quantization and a limited dynamic range. The loss of inner-urban variation caused by saturation effects limits the application of Night Time Light image for population distribution and economic activities [27].
The saturation correction method of NTL data needs to be selected carefully according to the study area and the purpose of research [20]. In this study, two saturation correction methods were tested to improve the DMSP/OLS NTL image, and the better result was used to model distribute population density based on population statistics of the study area’s cities.
Two saturation correction methods at a pixel level were examined to compare their results and select the suitable one to be used in population density distribution in the Pearl River Estuary. These two methods are the Human Settlement Index (HSI) and the Vegetation Adjusted NTL Urban Index (VANUI). Both HSI and VANUI methods are using contemporaneous NDVI to correct DN saturation based on the principle that key urban features are inversely correlated with vegetation health and abundance. HSI can be produced by using the following formula [27]:
where NDVImax is the annual maximum NDVI for all MODIS NDVI images of 2013, and NTLn is the normalized value of DMSP/OLS’s DN. Whereas, VANUI correction can be applied as [27]:
where NDVImean is the average value of annual MODIS NDVI data, and NTL is the DMSP/OLS stable NTL data.
Negative values of NDVImax and NDVI mean were removed before the saturation correction process to exclude water bodies [27]. A comparison between HSI and VANUI results was conducted based on DMSP/OLS original data by using R2 and standard error measurements to select the optimum one for population distribution in PRE.
3.3. Modeling Population Density
The best saturation correction of the original image was then re-sampled to a pixel size of one square km. After, it was used to model the population density based on population statistical reports of each town individually. The total population of each town was divided by the sum of saturation-corrected values inside the town boundary. Then, this value was multiplied by these pixel values to calculate population density per Km2. This process is representing in Equation (3):
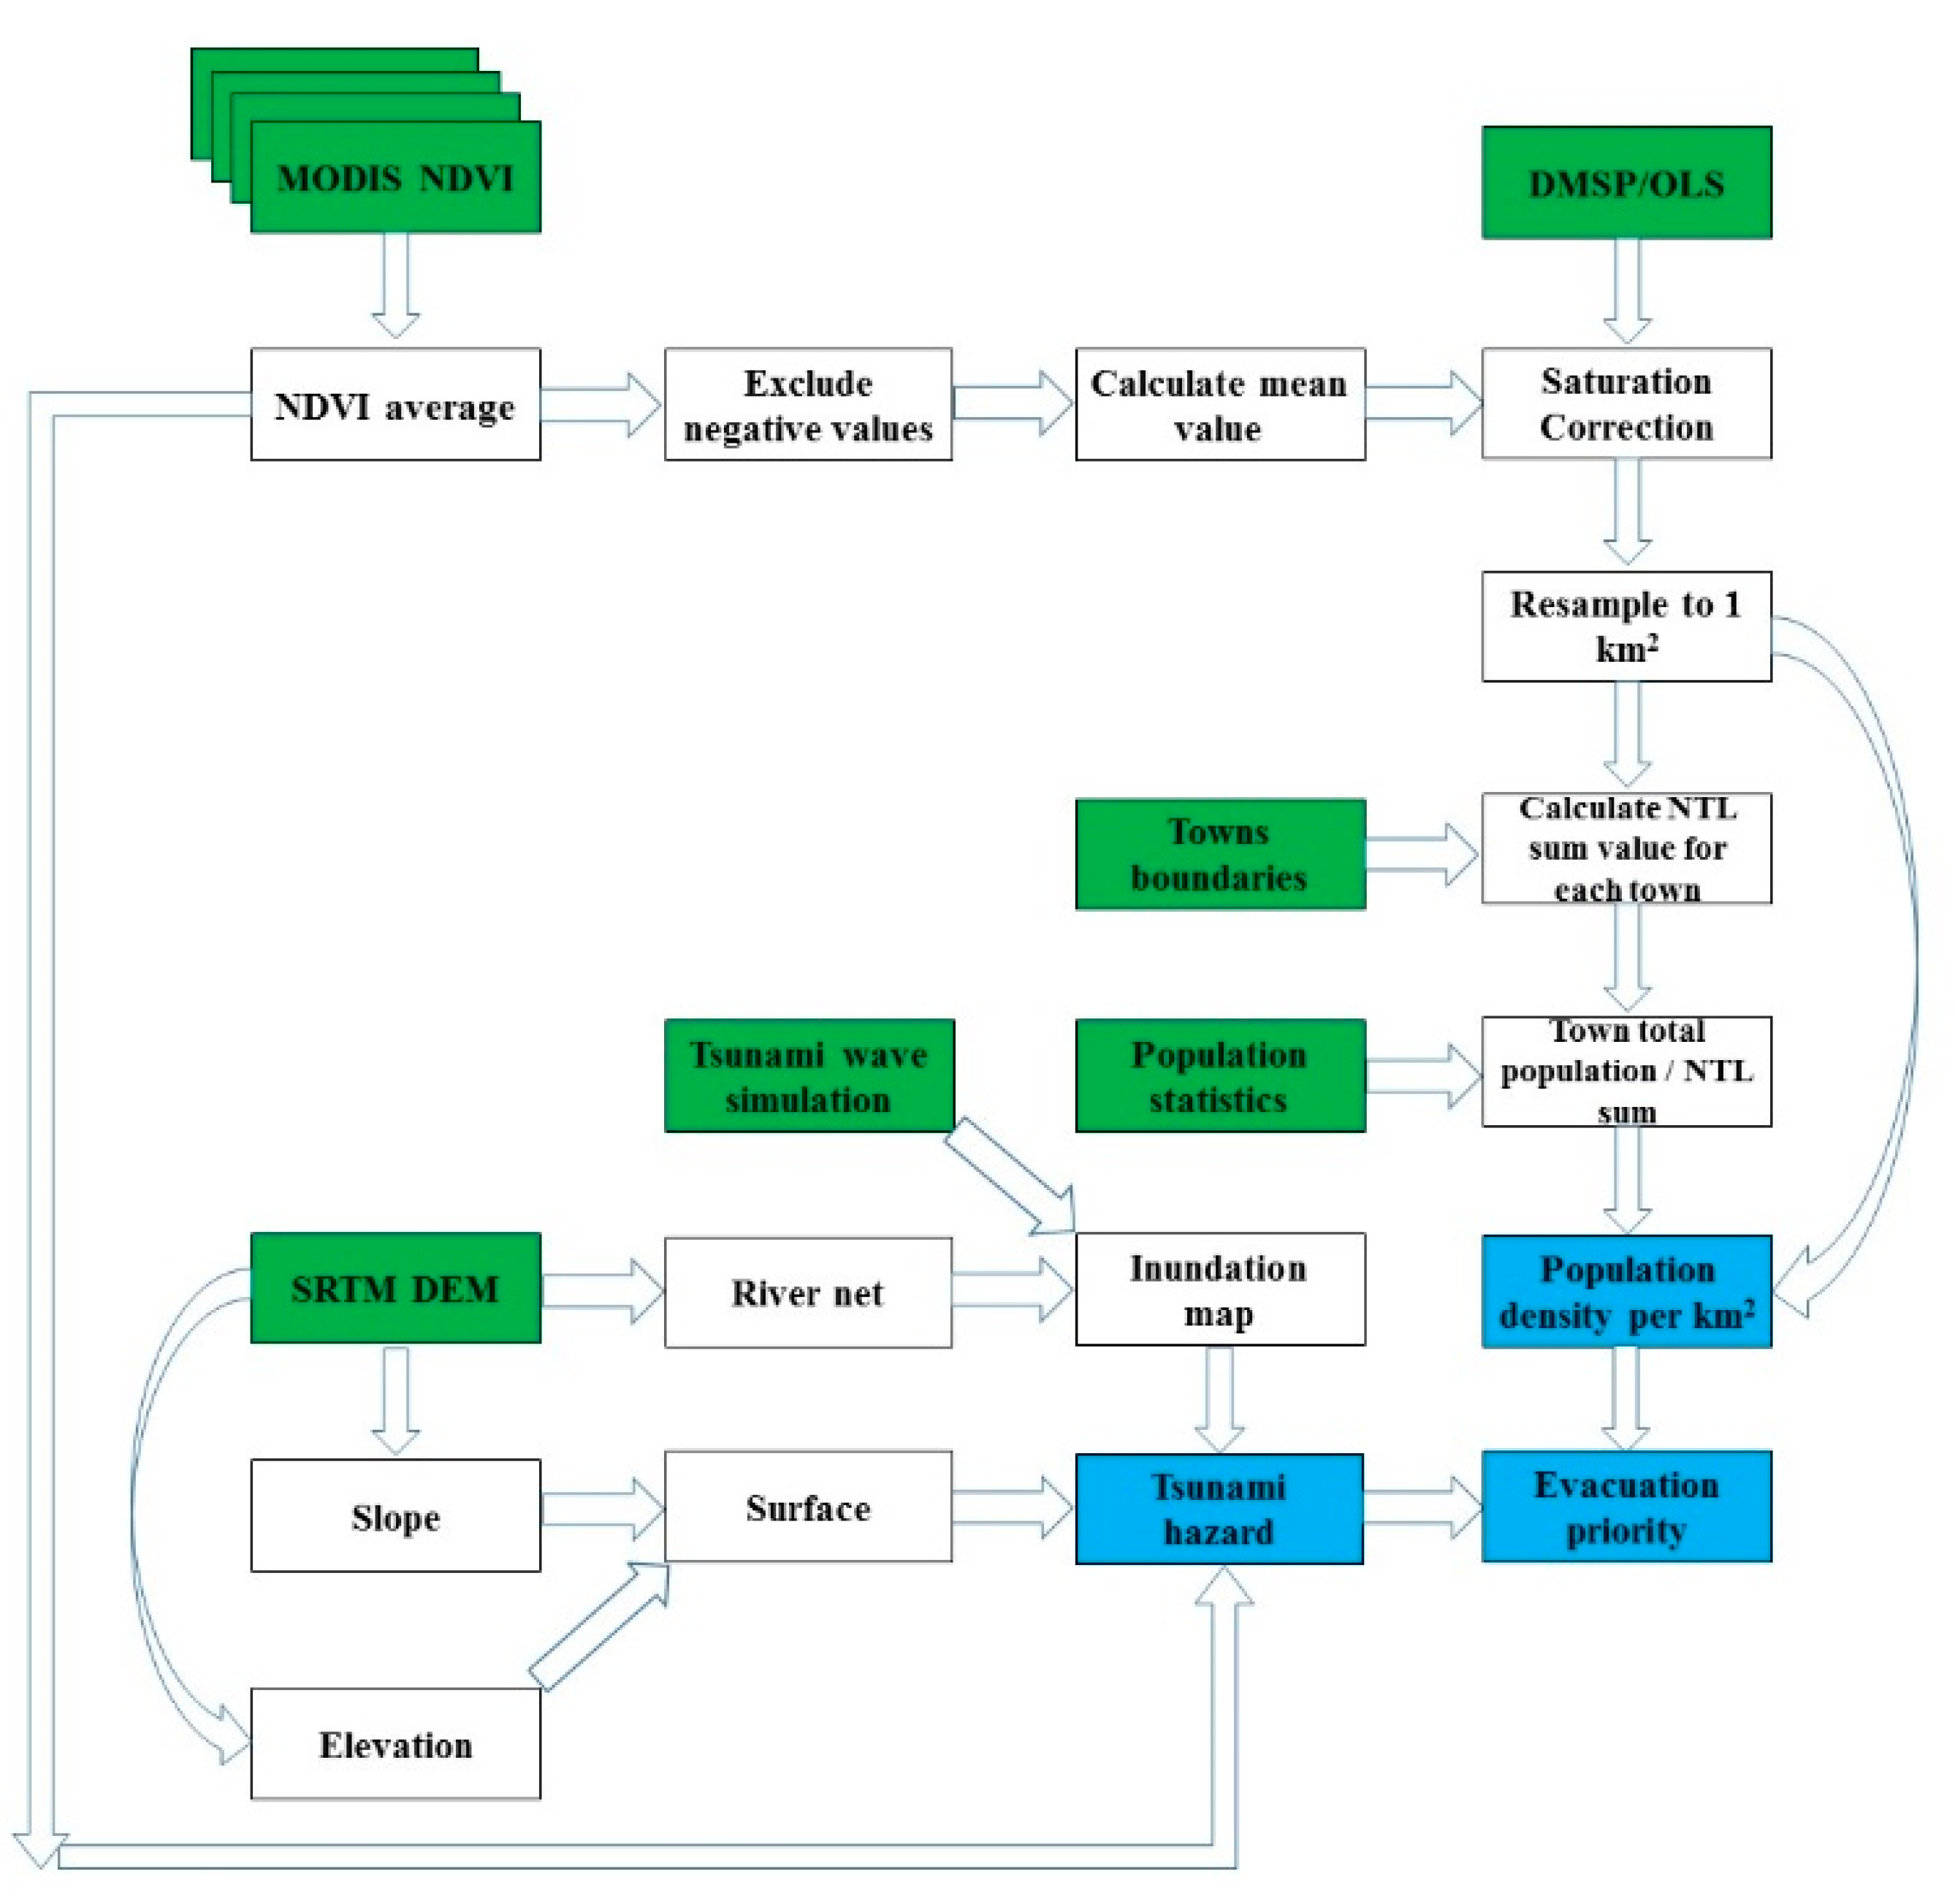
where Pd is the population density, TP is the total population of the town, TLtvalue is the total NTL value inside the town, and Lp-value is the NTL pixel value. This process was simplified and presented as a part of the study workflow in Figure 2.
3.4. Map Evacuation Prioritization Zones
Model inundation map in case of tsunami hazard is essential for evacuation plans to know how far tsunami wave could inundate the land. In this study, we used the simulation of wave height and velocity in case of the worst scenario as results by simulation of Ren et al. [4], which was presented in Lingding Bay simulation graphs of that study. Simulation graphs in that study, tsunami wave may reach more than five meters with a potential to reach ten meters of height in the open water before access the Lingding Bay. In our study, we take the average of nine meters height in the open water depending on the highest recorded tsunami wave in the history that hit the PRE in May 1765, which had killed more than ten thousand people in the region [28].
Nevertheless, wave height decreases to five meters when it enters the Bay as a result of Lantou islands which working as wave breakers in front of the Bay. With moving forward in the bay, tsunami wave height is gradually decreased as the influence by the decreasing of water depth inside the Lingding Bay.
A buffer area was created for each tsunami wave height zone based on its corresponding wave velocity on water as simulated in Ren et al. [4]. Each buffer area was designed by considering the worst case of continuous penetration on land with the same velocity for one hour as we suggested in Table 2.
The SRTM DEM was used firstly to extract the river net in the study area to support the inundation map simulation. Then, it was used again to produce elevation and slope maps in the study area. For the elevation map, only areas of nine meters (or less) elevation were extracted and reclassified in descending as areas with less than one meter has the highest rank of 9 and areas between eight to nine meters elevation as the lowest rank of 1. The slope percentages were classified into five ranks. The slope of less than 5% has the highest rank of 5 and the slope of more than 20% as the lowest rank of 1.
In addition, MODIS NDVI data was used again to acquire the 2013 annual mean of vegetation coverage in the study area. Negative NDVI values have the highest rank of 6. While ranks gradually decreased for NDVI values between 0.8 and 1. Detailed criteria of hazard map modeling are shown in Table 3.
Elevation and slope maps were firstly combined to produce a surface map for the study area. Next, surface map, NDVI, and inundation map were multiplied to map tsunami hazard areas in PRE. Tsunami hazard parameters are illustrated in Figure 3.
Finally, hazard and population density maps were classified to quartiles and integrated to produce the evacuation priority model in PRE. This process is described in Equation (4):
where S is the produced surface image, I is the inundation map, and P is the population density. The result was classified to quartiles; highest evacuation priority, second, third, and lowest evacuation priority.
(S × I × NDVImean) P,
4. Results
4.1. Saturation Correction Capability
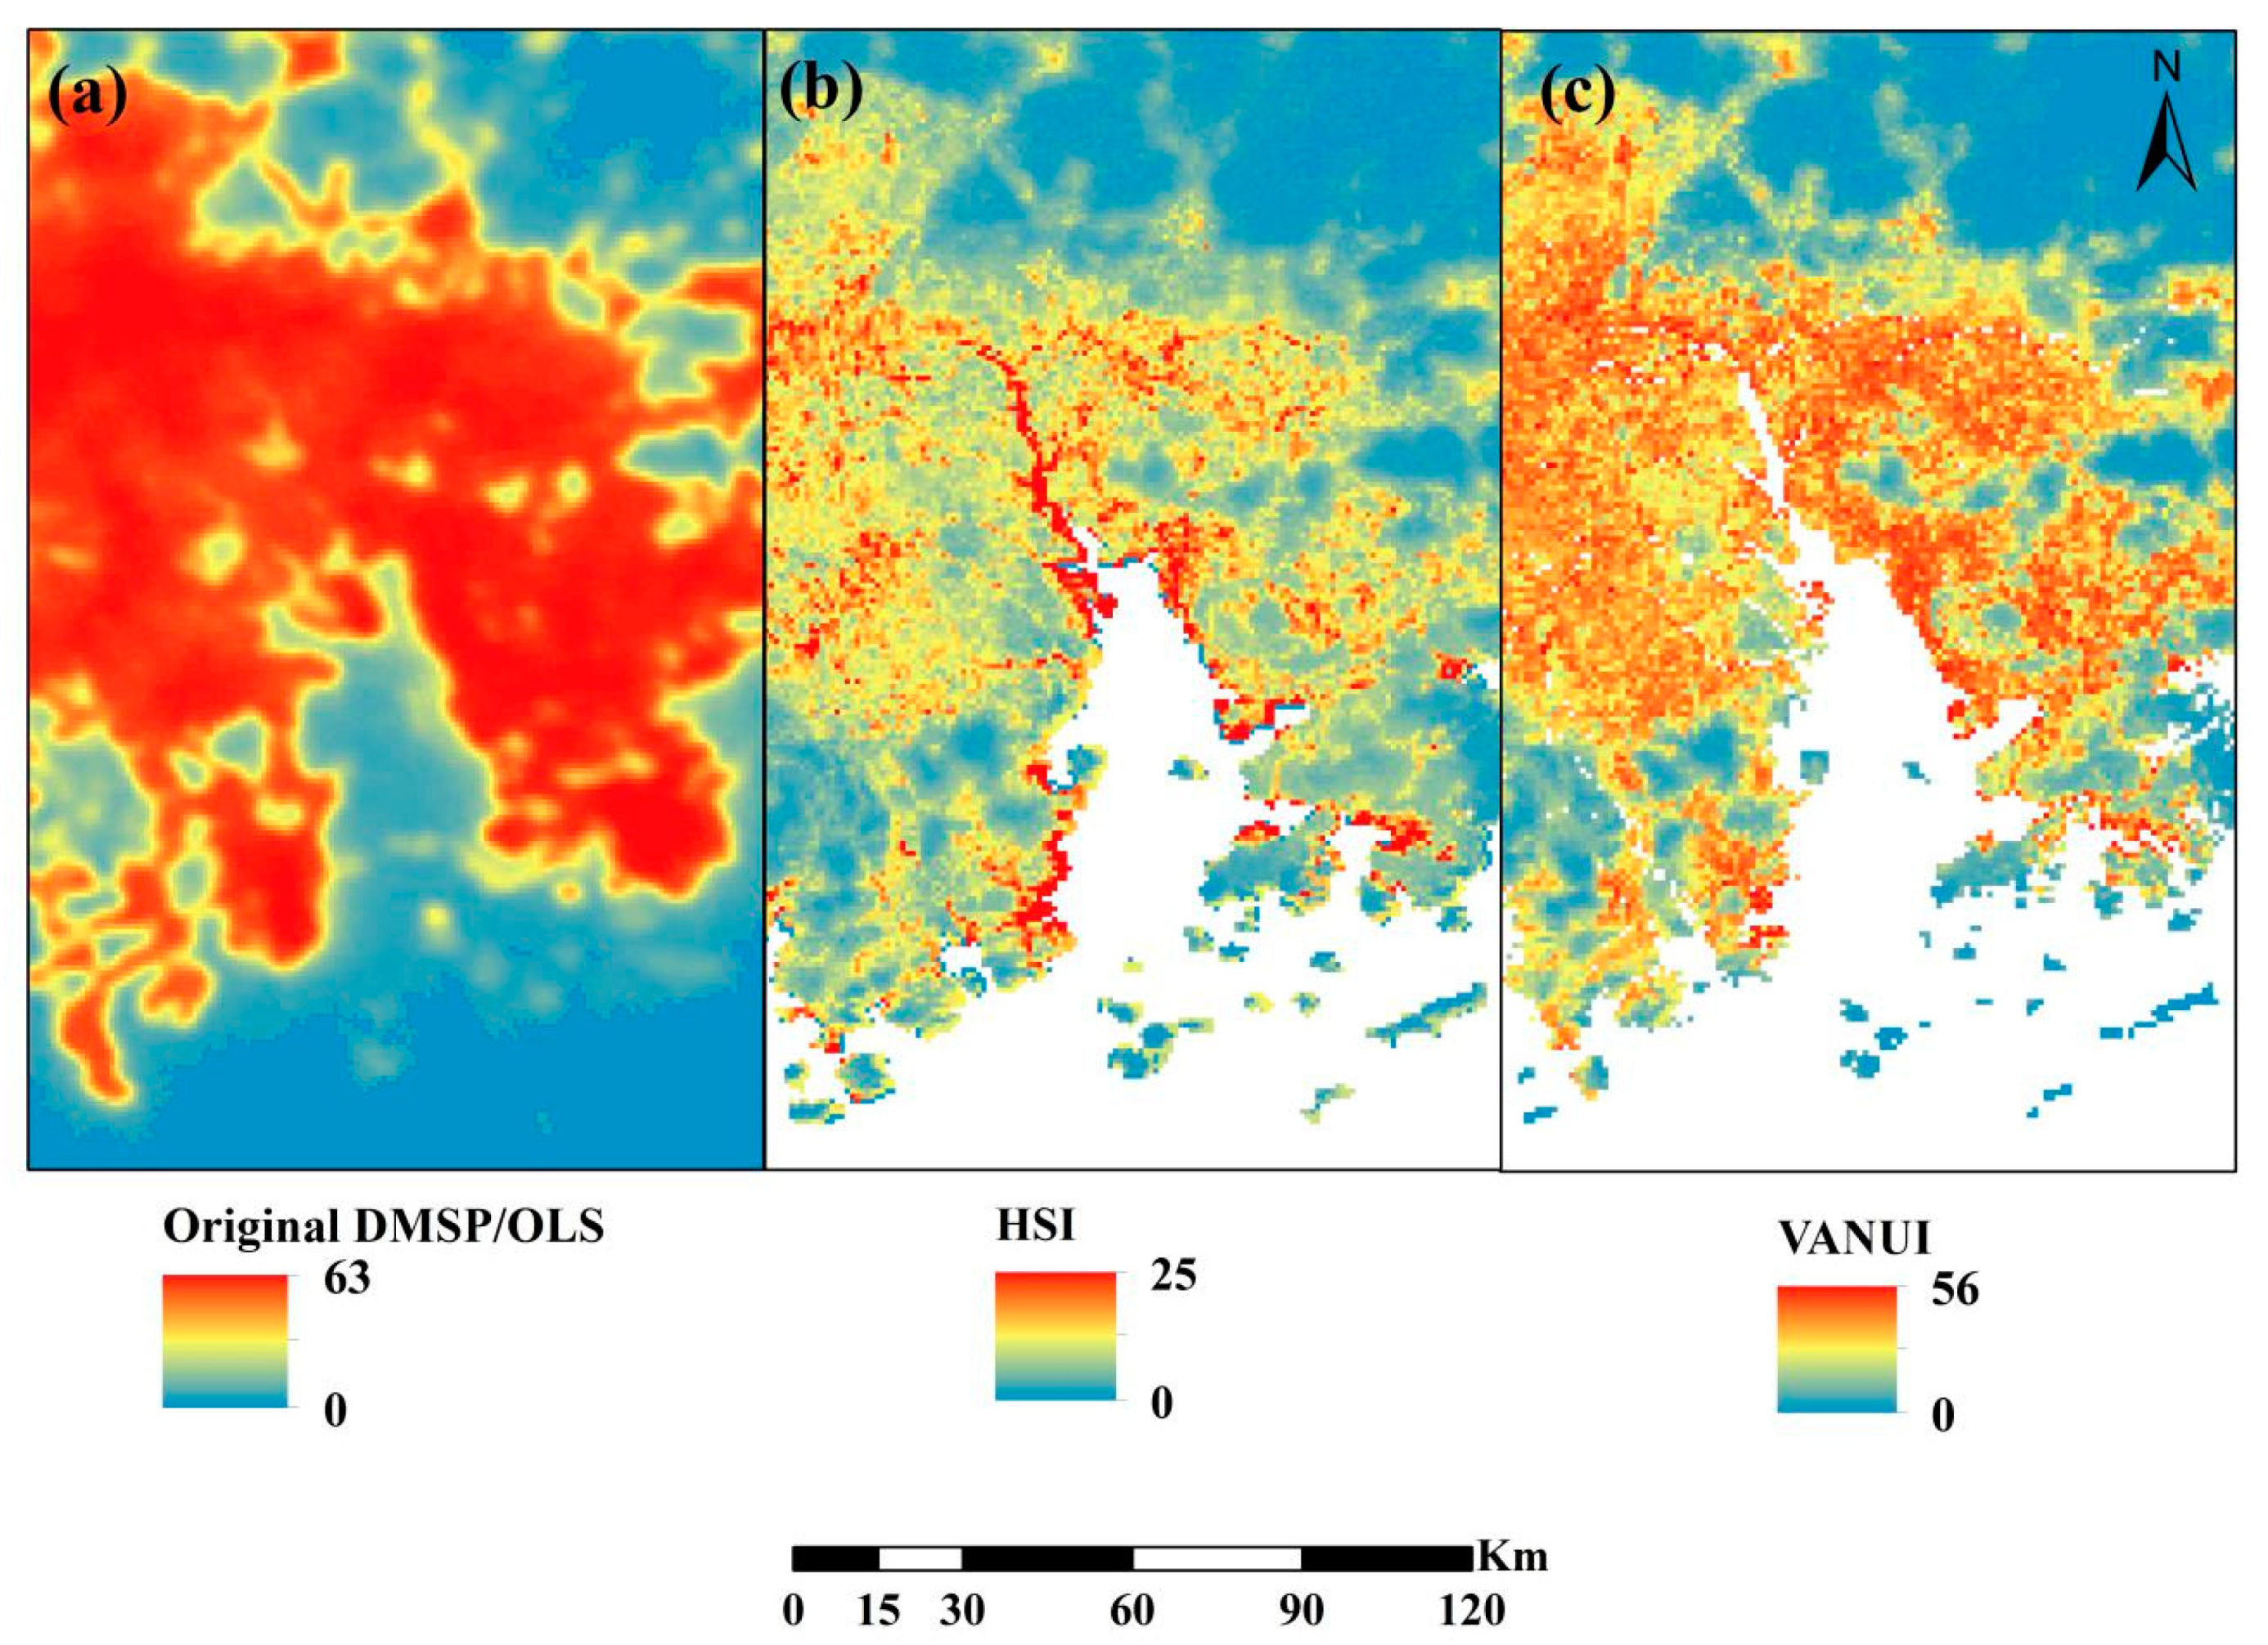
Both HSI and VANUI methods showed a good ability to enhance saturation effects of urban cores lights on DMSP/OLS NTL. A chi-squared test showed a statistically significant p-value (p < 0.05) of the correlation between original DMSP/OLS DN values (Figure 4a) and saturation-corrected results of the two methods (Figure 4b,c). However, VANUI demonstrated better result by the R2 value of (0.504) and Std. error (0.0069), compared to HSI’s R2 (0.219) and Std. error (0.1676).
Apart from better dynamic range of HSI in the study than Ma et al.’s result (0~25 vs. 0.1~5.07), this result is in line with Ma et al. [27] which concluded that VANUI method enhances the correlation with DMSP/OLS original data better than HSI method, as HIS reduced the applicability of original NTL data. The saturation correction error was tested using the Root Mean Square Error (RMSE) for both results. RMSE in VANUI results was smaller than HSI with values of 0.247 and 0.489 respectively. Hence, VANUI correction result was selected for population density distribution over the study area of PRE.
4.2. Population Density Distribution in PRE
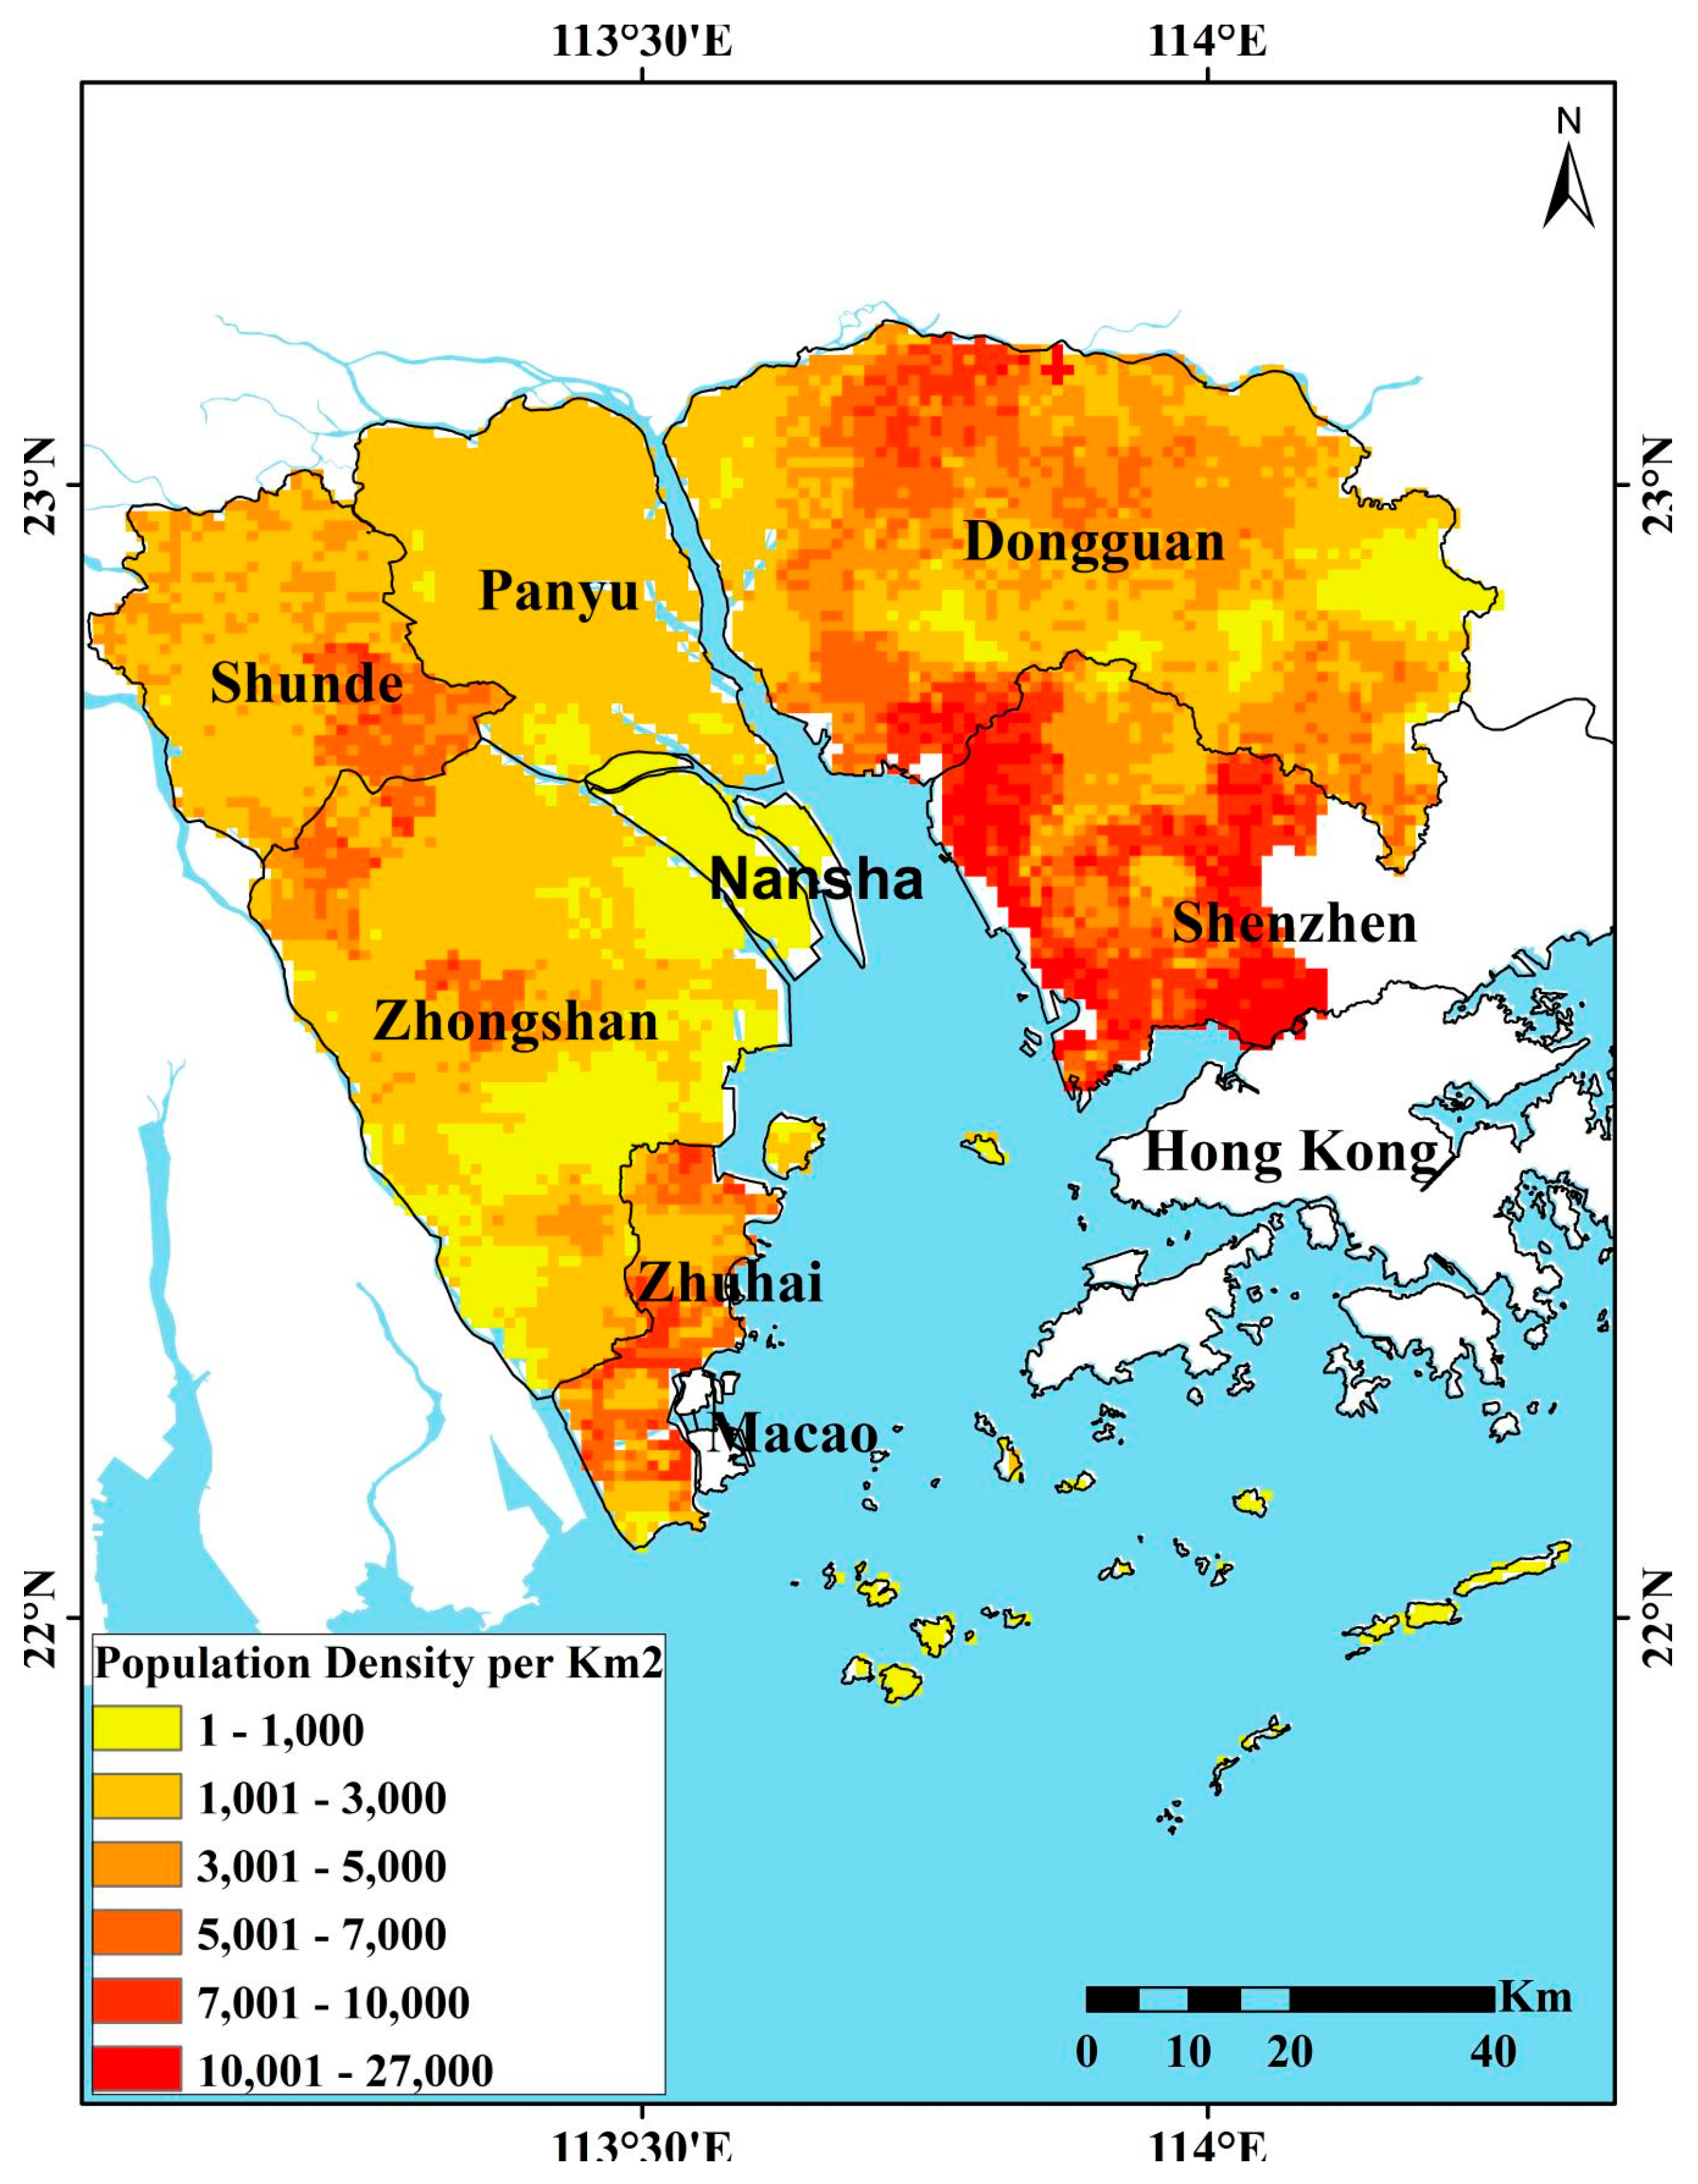
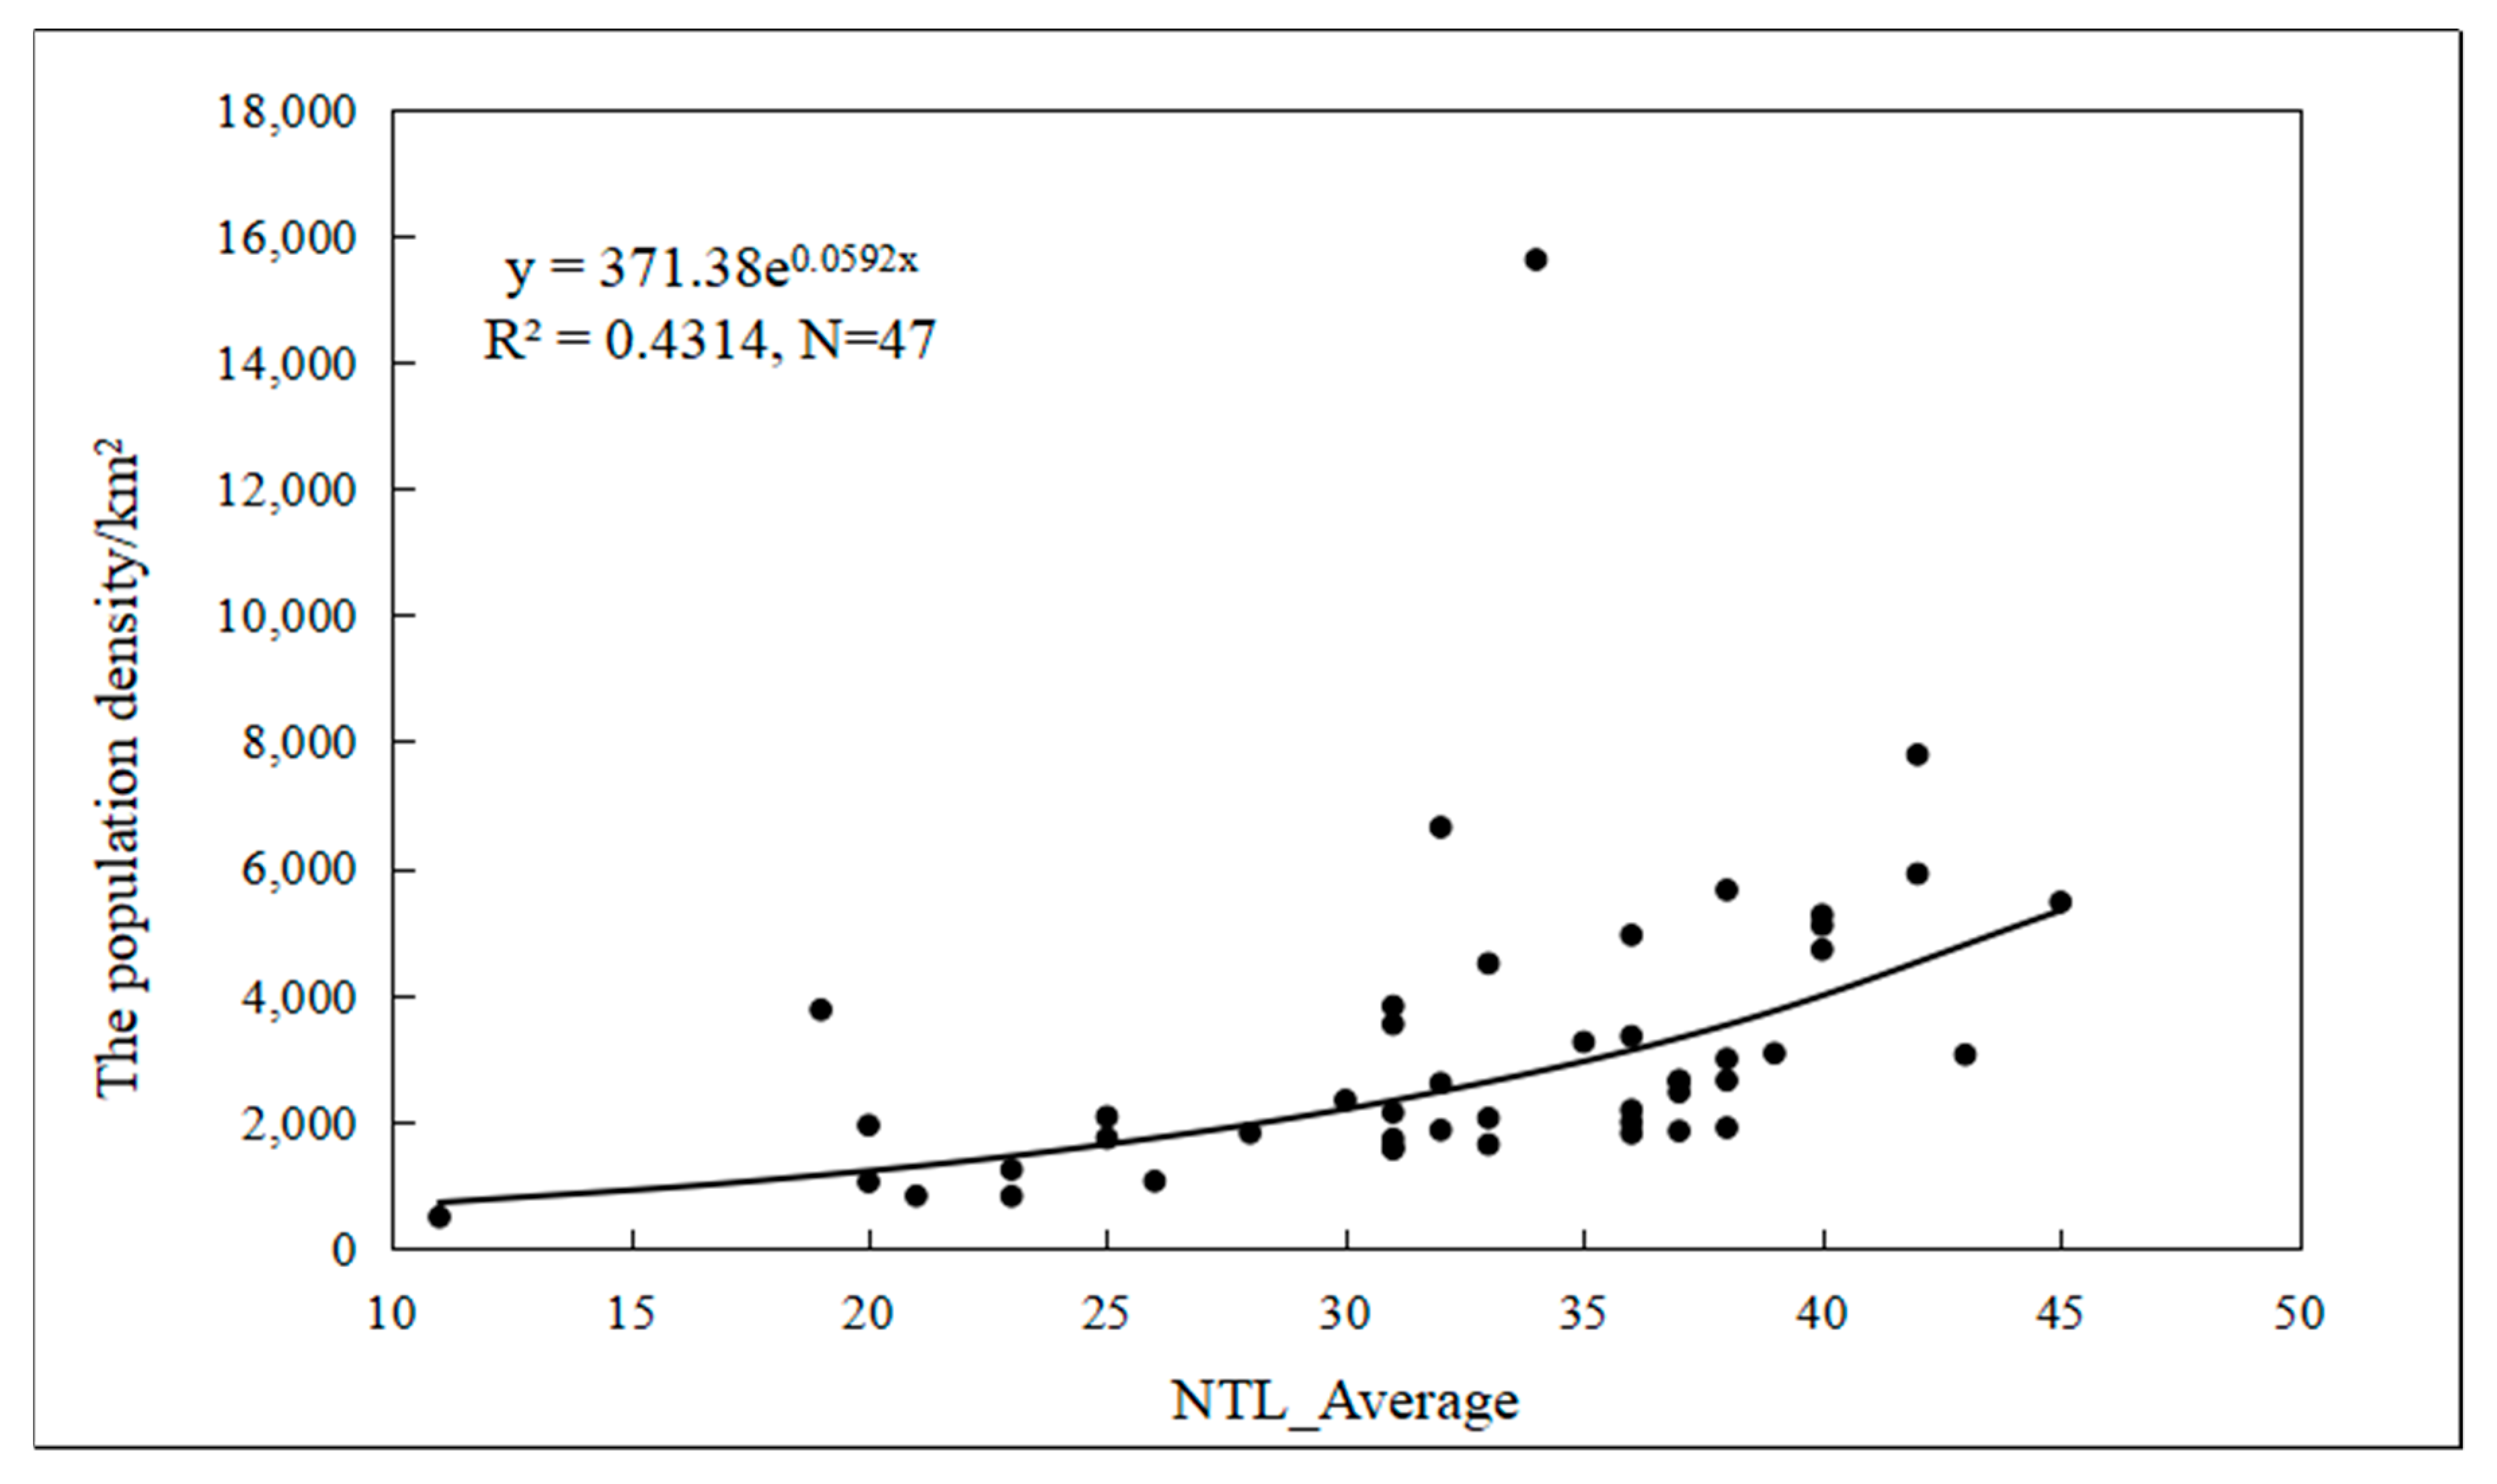
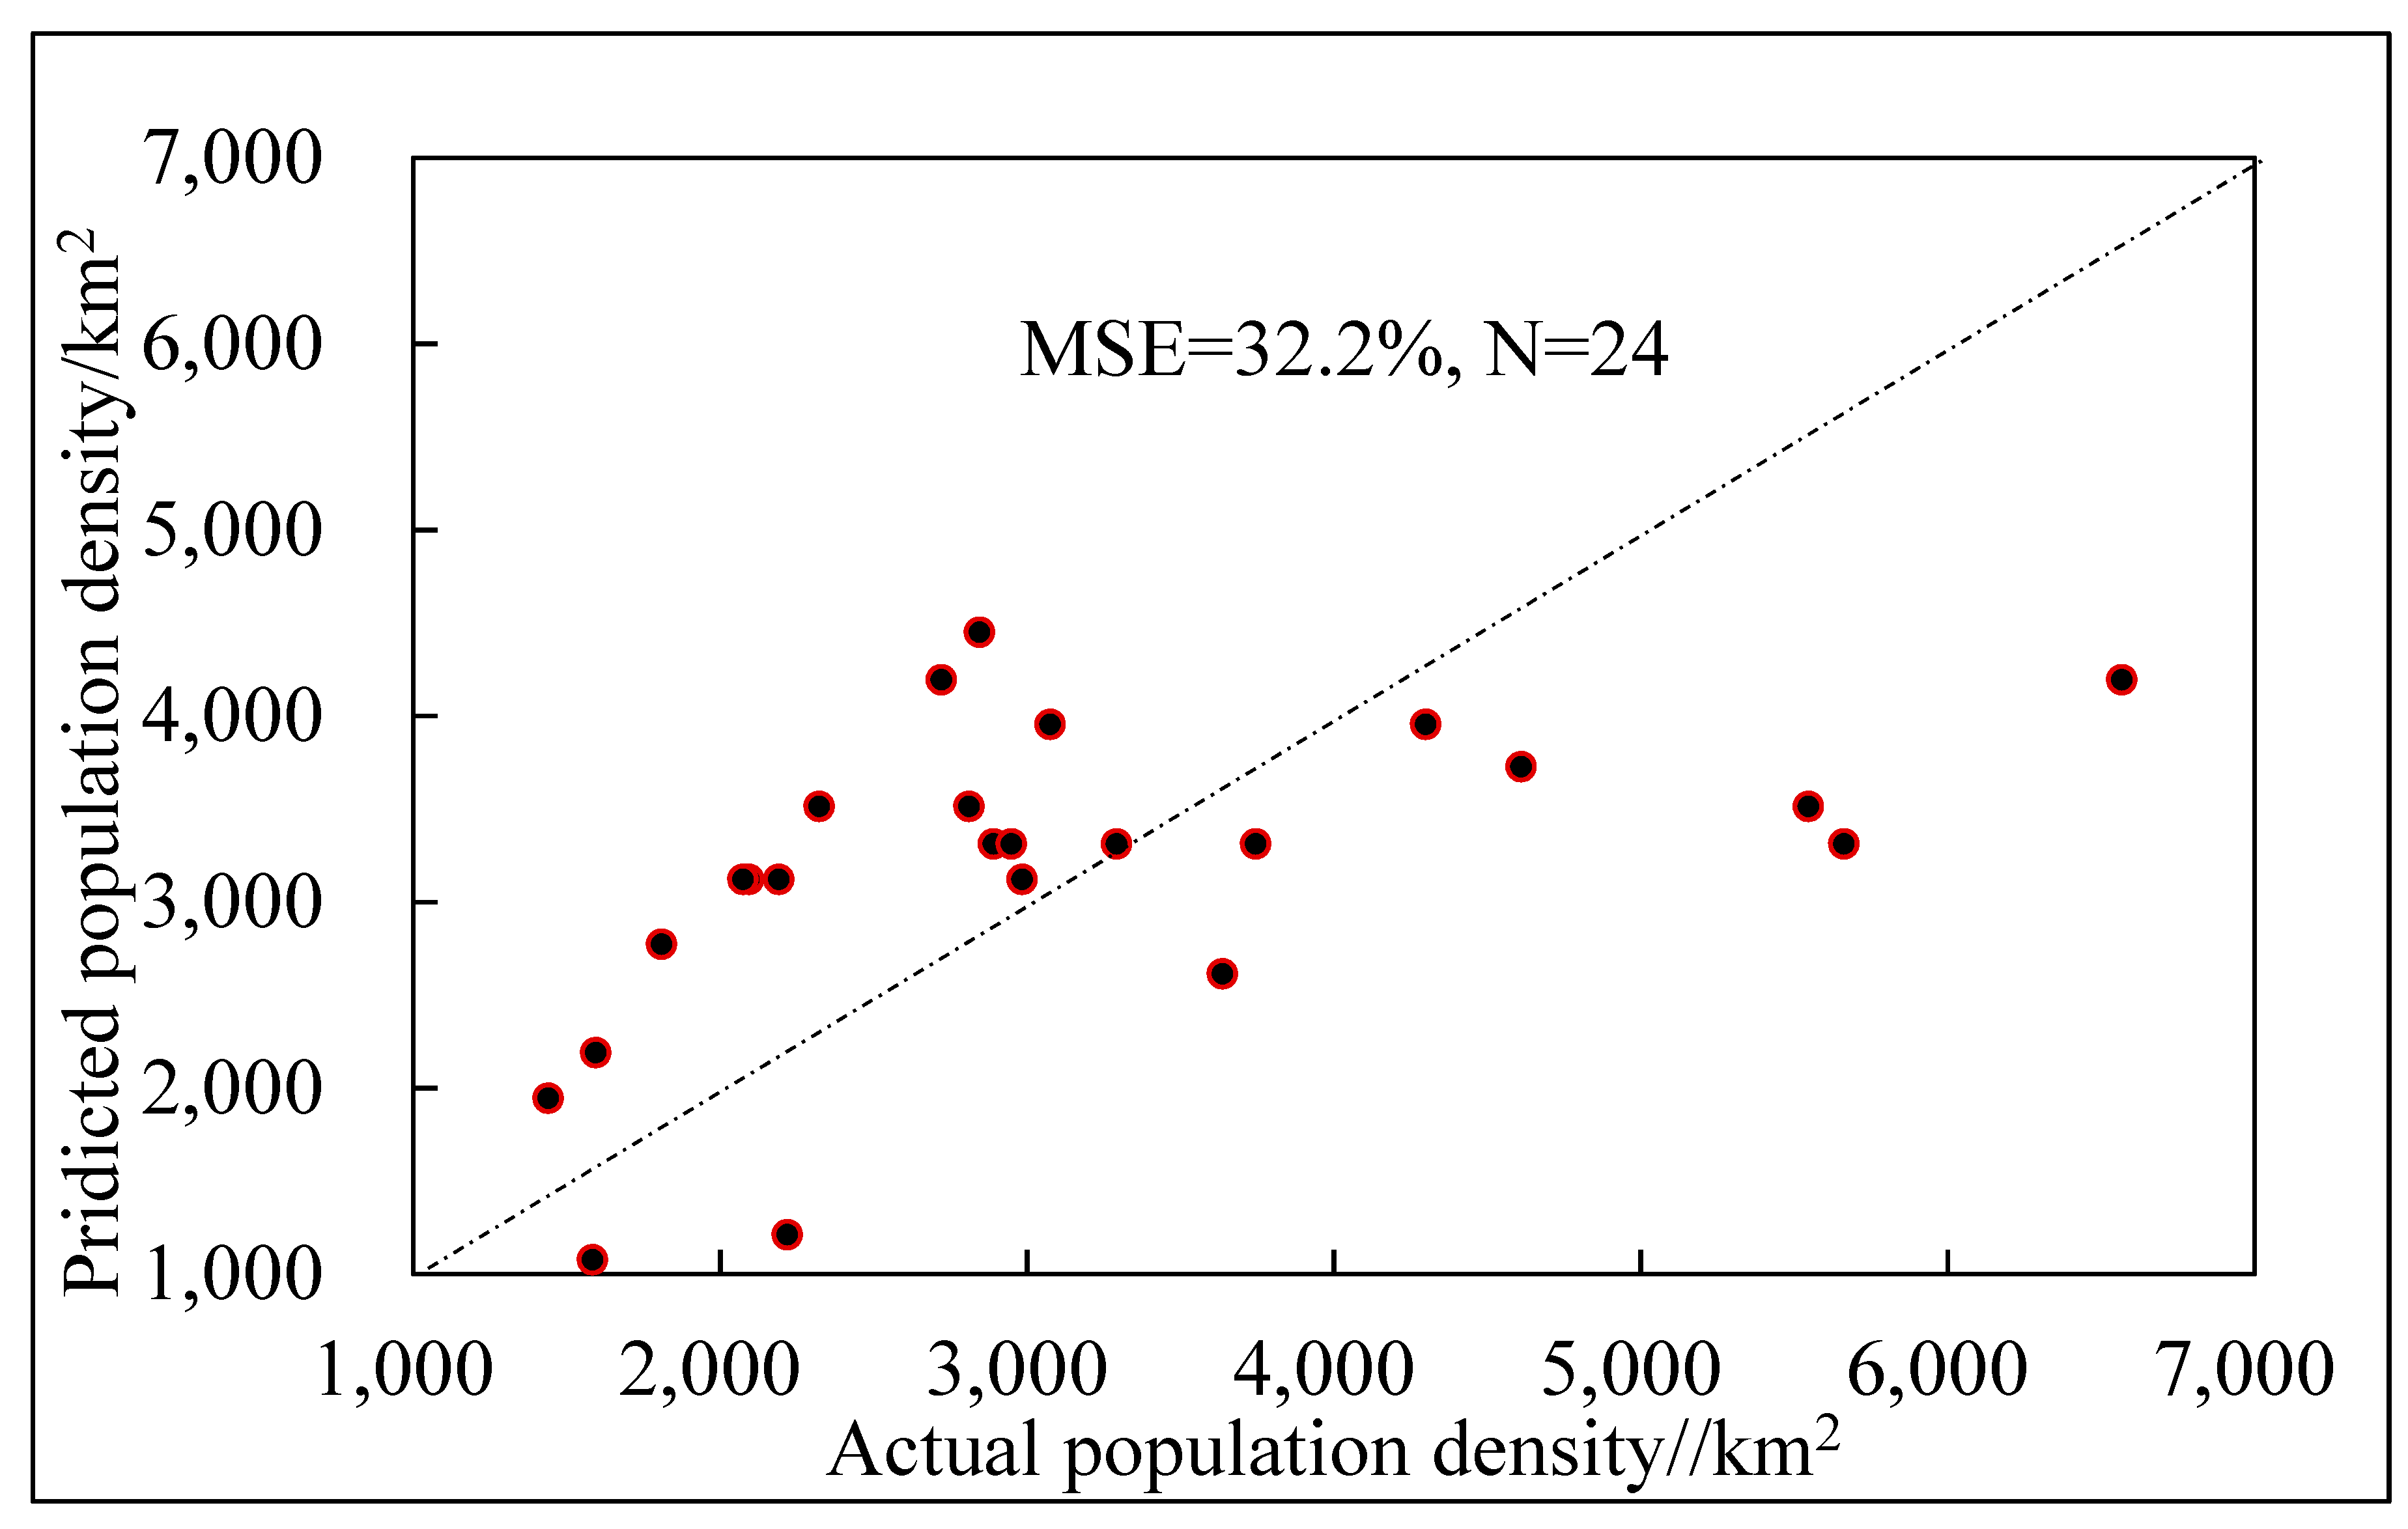
Figure 5 illustrates the simulation of the population density distribution in the Pearl River Estuary based on VANUI saturation correction result of 2013 DMSP/OLS NTL image. The six towns were divided into calibration and validation data sets. However, we find there are the population simulation results of 14 towns having the percent relative errors over 100%. It is probably because the built-sites disturbed the simulation. After removing the 14 towns, the population NTL simulation model is showed in Figure 6 (R2 = 0.43, N = 47), and mean relative error (MSE) was calculated for the total population inside each town boundary based on the total population recorded in the annual statistical yearbook of 2013. The MSE was 32% (N = 24, town level), which confirms the acceptability of the population remote sensing model in this study (Figure 7). Moreover, this is the first time that the similar model at town level was built in PRE.
Population distribution in PRE revealed higher density on the eastern part compared to the west of PRE. The highest density in the study area found to be in Shenzhen City especially in Futian town density exceeds 20,000/km2 in many parts of it. Moreover, Shilong town in Dongguan City has also some parts with population density more than 20,000/km2.
The areas with more than 10,000/km2 population density are all located in Shenzhen city and in Dongguan City (such as Chang-an, Shilong, and Shijie towns). Whereas, the densest area of the western part of the PRE is only one square kilometer in the southeastern part of Nantou town (Zhongshan City) with a density of about 9500/km2, followed by two square kilometers in Zhuhai city (about 9100/km2).
As shown in Figure 5, the high population densities were also retrieved in Zhuhai City, Dongguan City, and urban cores of Zhongshan city, and Shunde District of Foshan City. Whereas, lowest population densities found to be in roughly high-altitude areas, cultivated lands, and newly reclaimed areas.
The areas of population density less than 1000/km2 are mainly located in the district of Nansha in Guangzhou, the towns of Minzhong and Wuguishan in Zhongshan City, Wanshan Islands in Zhuhai, and the high-altitude area of Yinping mountain at the east of Dongguan City.
4.3. Evacuation Priority Map
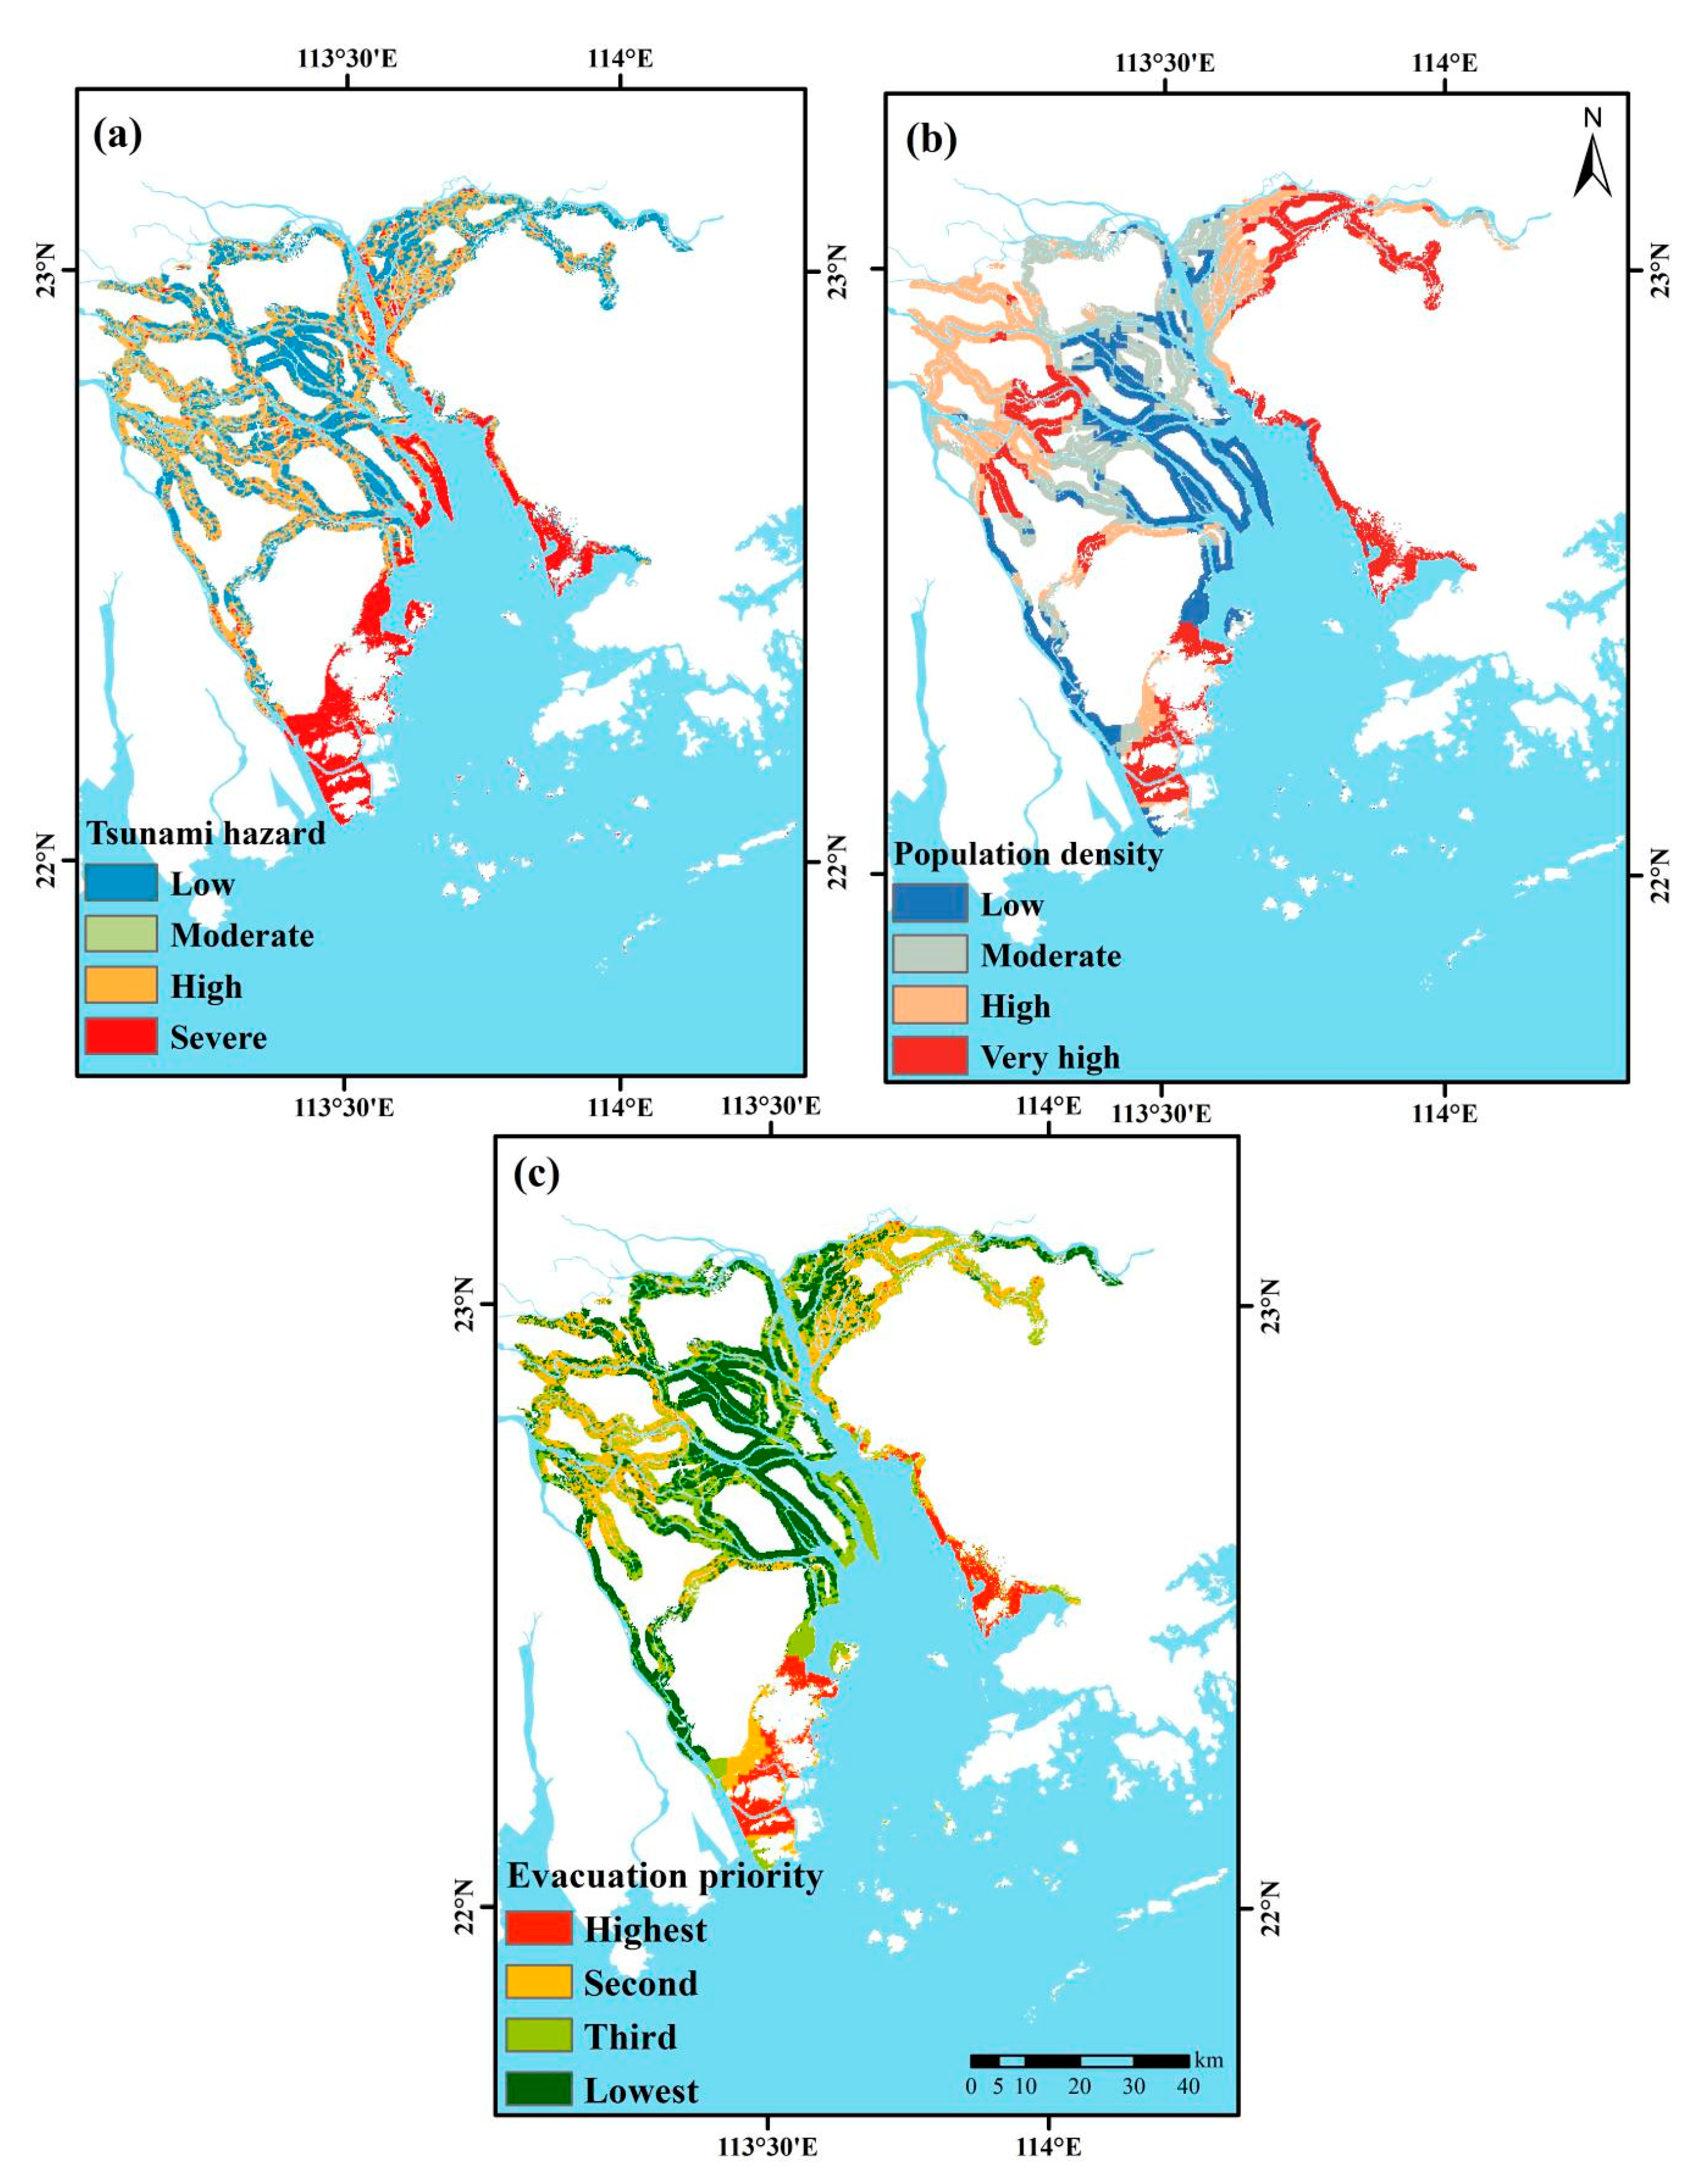
Tsunami hazard map is presented in Figure 8a. This map shows a severe influence on the whole area less than nine meters elevation in Zhuhai, Shenzhen Cities, most of the coastal area in the Zhongshan city, and the eastern island of Nansha Districts of Guangzhou City. While, the hazard is decreasing in the inner river net of PRE, and is mainly controlled by surface and vegetation elements rather than inundation factor.
After quartiles of the population density map, it was clipped to the tsunami hazard area, as shown in Figure 8b. The highest population density was identified in the coastal areas of Shenzhen and Zhuhai cities. Then, urban cores of other cities follow. Low population densities were determined in cultivated and newly reclaimed areas of PRE.
By integrating the tsunami hazard map in Figure 8a into the population map in Figure 8b, the final evacuation priority map is presented in Figure 8c. Due to their high population density and predicted severe tsunami hazard, the Zhuhai and Shenzhen coastal areas were found having the highest priority of evacuation in PRE under the case of tsunami hazard. Exceptions are in those two areas in the newly reclaimed areas and coastal aquaculture areas of Shenzhen City, and low population density in the south and northwestern parts of Zhuhai City.
Although city centers in inner parts of the PRE are away from the coastal area of Lingding Bay, the river net system and dense population in those areas make them in the second priority for population evacuation in case of tsunami hazard. Those areas include the towns of Shijie and Gaobu, and Dongguan’s central urban area in Dongguan City, the town of Ronggui and Daliang in Shunde District of Foshan City, and the towns of Nantou and Shiqi in Zhongshan City.
Third, and lowest evacuation priority, were concluded in the Panyu and Nansha districts of Guangzhou City, eastern coast and western part of Zhongshan City, and Dongguan city’s northeast and northwest parts.
5. Discussions
Although human lives in coastal areas are the most important element under risk in case of any natural hazard, population density distribution was seldom considered in tsunami hazard and evacuation models [15]. Hence, this study overcomes this issue by integrating population density at the town level that was estimated from the DMSP/OLS NTL image with the tsunami hazard map of PRE to model evacuation priority in the study area.
The positive correlation between NTL radiance data and population distribution is also undeniable [29]. Meanwhile, it was still used to measure inequality of population distribution and economic development among Chinese cities including cities of PRE [29,30]. Hence, NTL data is considered as one of the best choices to map population density in PRE for evacuation in case of tsunami hazard. In the NTL simulation of population, the built-site is probably one of the important disturbance elements. Because the same NTL population model was built for all towns, the accuracy of the model simulation in PRE is lower than the individual city-level’s model [36]. So, the town-level’ population simulation from NTL image should be more challenged if relying on the light information [37].
This study focused more on defining evacuation priorities based on remote sensing of population density. This aim is different from Nakai et al. [31] who focused on the evacuation of individual home care recipients in need for permanent medical care in case of a tsunami hazard in Kochi City on Shikoku Island, Japan. From the study, it is clearly important for local governments in PRE to develop an evacuation plan based on findings in this study, especially in Zhuhai and Shenzhen cities. It is also important to communicate with local citizens and spread such a kind of plans to improve residents awareness about their location and inundation potential and depth, and routes to safe places for better decision making to save people’s lives [32,33]. Additionally, Developing a mobile application for tsunami evacuation undoubtedly is helpful for people under risk by feeding them with information about inundation areas and depth under different tsunami risks [34].
As many researchers suggested before, it is difficult to evaluate tsunami evacuation models [32,35], due to the difficulty to predict the exact tsunami wave height, penetration of water into land, and dynamics of people. Primarily, there were no previous incidents in the study area to relay on for model validation. It is also worth noting that the limitation of the NTL population distribution mapping method is the lack of considering the actual population density difference between the daytime and the nighttime. It is because many people should go to work or school or urban center during the daytime, whereas most people should be at home during night-time or weekend. So, the method cannot well reflect the situation where tsunami occurs during the daytime even rush hours. However, the method is still meaningful for direction to tsunami disaster relief work especially with the one kilometer resolution of population density estimation as suggested by Briggs et al. [22]. Hence, authors may suggest a potential gap between this study and reality for the predicted model.
6. Conclusions
Two pixel-based saturation correction methods were evaluated for use to enhance DMSP/OLS NTL image for application of population density mapping in the whole metropolitan area of PRE. The Vegetation Adjusted NTL Urban Index (VANUI) correction method was found to be the better-fit correction method of NTL image saturation for the study area. The HIS correction performed better with greater dynamic range than previous research [27].
The study developed the town-level population density NTL mapping approach for the first time in PRE that uses data of NTL emissions as covariates of population density (Calibration: R2 = 0.43, N = 47; Validation: MRE = 32%, N = 24). The exclusion of built-sites is probably one of the choices for improving the NTL population model further. Besides, the population density map was combined with a tsunami hazard map to model the evacuation priority in case of the worst tsunami scenario using GIS modeling on surface elevation, slope, vegetation cover, and inundation map of the study area.
Highest evacuation priority in case of tsunami hazard was suggested in most areas of Zhuhai and Shenzhen Cities with nine meters or less elevation, and followed by core built-up areas of other cities in the PRE. Moreover, the lowest evacuation priorities were found mainly in Nansha and Panyu districts of Guangzhou city, eastern coast and western areas of Zhongshan City, and northeast and northwest of Dongguan City.
From this study, it is essential for local governments to prepare for the worst-case scenario of a tsunami hazard to prevent fatal loss of residents lives as few as possible. It is suggested to prepare detailed evacuation plans for horizontal and vertical evacuation in severe hazard areas, specifically in the highest evacuation priority areas concluded in this study, mainly in Zhuhai and Shenzhen.
The evacuation priority method was found to be efficient in defining areas under risk for population evacuation purposes or evacuation traffic volume estimation needed in PRE. Although the method cannot well reflect the situation where tsunami occurs during daytime, due to significant movement of population, it could potentially be applied for direction to tsunami disaster relief in different tsunami scenarios of PRE or other coastal tsunami risk emergencies in the world.
Author Contributions
Conceptualization, Bahaa Mohamadi and Shuisen Chen; methodology, Bahaa Mohamadi.; validation, Bahaa Mohamadi and Shuisen Chen; formal analysis, Bahaa Mohamadi.; investigation, Bahaa Mohamadi; resources, Jia Liu; data curation, Jia Liu; writing—original draft preparation, Bahaa Mohamadi; writing—review and editing, Shuisen Chen; visualization, Bahaa Mohamadi; supervision, Shuisen Chen; project administration, Shuisen Chen; funding acquisition, Shuisen Chen
Funding
This research was funded by “THE SCIENCE and TECHNOLOGY PLAN PROJECT OF GUANGDONG PROVINCE, grant number 2016A020223011 and 2018B030320002, GDAS’ SPECIAL PROJECT OF SCIENCE AND TECHNOLOGY DEVELOPMENT, grant number 2017GDASCX-0101, and NATURAL SCIENCE KEY FUND OF GUANGDONG PROVINE grant number 2018B030311059. -Guangzhou Youth Science and Technology Education Project- Guangzhou Education Bureau (208-276). We thank three anonymous reviewers for their constructive remarks, and Jinyue Chen in the Guangzhou Institute of Geography for his contribution in NTL population model validation.
Conflicts of Interest
The authors declare no conflict of interest.
References
- Li, L.; Switzer, A.D.; Chan, C.H.; Wang, Y.; Weiss, R.; Qiu, Q. How heterogeneous coseismic slip affects regional probabilistic tsunami hazard assessment: A case study in the South China Sea. J. Geophys. Res. Solid Earth 2016, 121, 6250–6272. [Google Scholar] [CrossRef] [Green Version]
- Terry, J.P.; Winspear, N.; Goff, J.; Tan, P.H. Past and potential tsunami sources in the South China Sea: A brief synthesis. Earth-Sci. Rev. 2017, 167, 47–61. [Google Scholar] [CrossRef]
- Li, Z.S.; Zhao, X.; An, C.; Liu, H. Wave profiles of a virtual extreme tsunami in the northern region of South China Sea. J. Earthq. Tsunami 2018, 12, 1840004. [Google Scholar] [CrossRef]
- Ren, Z.Y.; Zhao, X.; Wang, B.L.; Dias, F.; Liu, H. Characteristics of wave amplitude and currents in South China Sea induced by a virtual extreme tsunami. J. Hydrodyn. 2017, 29, 377–392. [Google Scholar] [CrossRef]
- Ren, Z.; Liu, H. Modeling Tsunami in South China Sea with Boussinesq equations. Procedia Eng. 2015, 116, 888–896. [Google Scholar] [CrossRef]
- Jingming, H.; Xiaojuan, L.; Ye, Y.; Peitao, W. Tsunami hazard assessment along the Chinese mainland coast from earthquakes in the Taiwan region. Natural Hazards 2016, 81, 1269–1281. [Google Scholar] [CrossRef]
- Ren, Y.; Wen, R.; Zhang, P.; Yang, Z.; Pan, R.; Li, X. Implications of local sources to probabilistic tsunami hazard analysis in south Chinese coastal area. J. Earthq. Tsunami 2017, 11, 1740001. [Google Scholar] [CrossRef]
- Liu, L.F.; Wang, X.; Salisbury, A.J. Tsunami hazard and early warning system in South China Sea. J. Asian Earth Sci. 2009, 36, 1–12. [Google Scholar] [CrossRef]
- Megawati, K.; Shaw, F.; Sieh, K.; Huang, Z.; Wu, T.R.; Lin, Y.; Tan, S.K.; Pan, T.-C. Tsunami hazard from the subduction megathrust of the South China Sea: Part I. source characterization and the resulting tsunami. J. Asian Earth Sci. 2009, 36, 1–20. [Google Scholar] [CrossRef]
- Liu, Y.; Santos, A.; Wang, S.M.; Shi, Y.; Liu, H.; Yuen, D.A. Tsunami hazards along chinese coast from potential earthquakes in south china sea. Phys. Earth Planet. Inter. 2015, 163, 233–244. [Google Scholar] [CrossRef]
- Lau, A.Y.A.; Switzer, A.D.; Dominey-Howes, D.; Aitchison, J.C.; Zong, Y. Written records of historical tsunamis in the northeastern South China Sea—Challenges associated with developing a new integrated database. Nat. Hazards Earth Syst. Sci. 2010, 10, 1793–1806. [Google Scholar] [CrossRef]
- Li, H.; Yuan, Y.; Xu, Z.; Wang, Z.; Wang, J.; Wang, P.; Gao, Y.; Hou, J.; Shan, D. The dependency of probabilistic tsunami hazard assessment on magnitude limits of seismic sources in the South China Sea and adjoining basins. In Earthquakes and Multi-Hazards Around the Pacific Rim; Birkhäuser: Cham, Switzerland, 2018; Volume I, pp. 157–176. [Google Scholar] [CrossRef]
- Dao, M.H.; Tkalich, P.; Chan, E.S.; Megawati, K. Tsunami propagation scenarios in the south china sea. J. Asian Earth Sci. 2009, 36, 1–73. [Google Scholar] [CrossRef]
- Álvarez, G.; Quiroz, M.; León, J.; Cienfuegos, R. Identification and classification of urban micro-vulnerabilities in tsunami evacuation routes for the city of Iquique, Chile. Nat. Hazards Earth Syst. Sci. 2018, 18, 2027–2039. [Google Scholar] [CrossRef]
- Trindade, A.; Teves-Costa, P.; Catita, C. A GIS-based analysis of constraints on pedestrian tsunami evacuation routes: Cascais case study (Portugal). Nat. Hazards 2018, 1–17. [Google Scholar] [CrossRef]
- Schuster, M.; Gomez, C. Evacuation routing out of tsunami hazard zones. GI Forum 2013, 206–215. [Google Scholar] [CrossRef]
- Park, S.; Van de Lindt, J.W.; Gupta, R.; Cox, D. Method to determine the locations of tsunami vertical evacuation shelters. Nat. Hazards 2012, 63, 891–908. [Google Scholar] [CrossRef]
- McCaughey, J.W.; Mundir, I.; Daly, P.; Mahdi, S.; Patt, A. Trust and distrust of tsunami vertical evacuation buildings: Extending protection motivation theory to examine choices under social influence. Int. J. Disaster Risk Reduct. 2017, 24, 462–473. [Google Scholar] [CrossRef]
- Amaral, S.; Monteiro, A.M.V.; Camara, G.; Quintanilha, J.A. Dmsp/ols night-time light imagery for urban population estimates in the brazilian amazon. Int. J. Remote Sens. 2006, 27, 855–870. [Google Scholar] [CrossRef]
- Zhuo, L.; Ichinose, T.; Zheng, J.; Chen, J.; Shi, P.J.; Li, X. Modelling the population density of china at the pixel level based on dmsp/ols non-radiance-calibrated night-time light images. Int. J. Remote Sens. 2009, 30, 1003–1018. [Google Scholar] [CrossRef]
- Stathakis, D.; Baltas, P. Seasonal population estimates based on night-time lights. Comput. Environ. Urban Syst. 2018, 68, 133–141. [Google Scholar] [CrossRef]
- Briggs, D.J.; Gulliver, J.; Fecht, D.; Vienneau, D.M. Dasymetric modelling of small-area population distribution using land cover and light emissions data. Remote Sens. Environ. 2007, 108, 451–466. [Google Scholar] [CrossRef]
- Zhao, H.; Cui, B.; Zhang, H.; Fan, X.; Lei, X. A landscape approach for wetland change detection (1979-2009) in the pearl river estuary. Procedia Environ. Sci. 2010. [Google Scholar] [CrossRef]
- NOAA; DMSP/OLS. 2013. Available online: http://ngdc.noaa.gov/eog/dmsp/downloadV4composites.html (accessed on 20 August 2017).
- Carroll, M.L.; DiMiceli, C.M.; Sohlberg, R.A.; Townshend, J.R.G. 250m MODIS Normalized Difference Vegetation Index; University of Maryland: College Park, MD, USA, 2013. [Google Scholar]
- USGS. Shuttle Radar Topography Mission, 1 Arc Second Scene SRTM; USGS: Reston, VA, USA, 2006.
- Ma, L.; Wu, J.; Li, W.; Peng, J.; Liu, H. Evaluating saturation correction methods for DMSP/OLS nighttime light data: A case study from China’s cities. Remote Sens. 2014, 6, 9853–9872. [Google Scholar] [CrossRef]
- Mak, S.; Chan, L.S. Historical tsunamis in south china. Nat. Hazards 2007, 43, 147–164. [Google Scholar] [CrossRef]
- Zhou, Y.; Ma, T.; Zhou, C.; Xu, T. Nighttime light derived assessment of regional inequality of socioeconomic development in China. Remote Sens. 2015, 7, 1242–1262. [Google Scholar] [CrossRef]
- Fan, J.; Ma, T.; Zhou, C.; Zhou, Y.; Xu, T. Comparative estimation of urban development in China’s cities using socioeconomic and DMSP/OLS night light data. Remote Sens. 2014, 6, 7840–7856. [Google Scholar] [CrossRef]
- Nakai, H.; Itatani, T.; Horiike, R.; Kyota, K.; Tsukasaki, K. Tsunami evacuation simulation using geographic information systems for homecare recipients depending on electric devices. PLoS ONE 2018, 13, e0199252. [Google Scholar] [CrossRef]
- Takabatake, T.; Shibayama, T.; Esteban, M.; Ishii, H. Advanced casualty estimation based on tsunami evacuation intended behavior: Case study at Yuigahama Beach, Kamakura, Japan. Nat. Hazards 2018, 1–26. [Google Scholar] [CrossRef]
- Isagawa, T.; Ohno, R. Influence of residents’ cognition of their local environment on evacuation behavior from tsunamis: A case study of Onjuku, Chiba prefecture. Jpn. Archit. Rev. 2018, 1, 486–503. [Google Scholar] [CrossRef]
- Leelawat, N.; Suppasri, A.; Latcharote, P.; Abe, Y.; Sugiyasu, K.; Imamura, F. Tsunami evacuation experiment using a mobile application: A design science approach. Int. J. Disaster Risk Reduct. 2018, 29, 63–72. [Google Scholar] [CrossRef]
- Mas, E.; Koshimura, S.; Imamura, F.; Suppasri, A.; Muhari, A.; Adriano, B. Recent advances in agent-based tsunami evacuation simulations: Case studies in Indonesia, Thailand, Japan and Peru. Pure Appl. Geophys. 2015, 172, 3409–3424. [Google Scholar] [CrossRef]
- Li, P.; Hong, H. Estimation of Urban Population in Guangdong Province Based on DMSP-OLS Lighting Data. J. South China Norm. Univ. (Nat. Sci. Ed.) 2015, 47, 102–107. [Google Scholar]
- Wang, L.; Wang, S.; Zhou, Y.; Liu, W.; Hou, Y.; Zhu, J.; Wang, F. Mapping Population Density in China between 1990 and 2010 Using Remote Sensing. Remote Sens. Environ. 2018, 210, 269–281. [Google Scholar] [CrossRef]
Figure 1.
Study area location: The model area of interest and Manila Trench location (red line) in South China.
Figure 1.
Study area location: The model area of interest and Manila Trench location (red line) in South China.

Figure 2.
Study workflow: The green color presenting data inputs while the light blue presents model outputs. DMSP/OLS is the night-time light imagery of the Defense Meteorological Satellite Program’s Operational Linescan System in 2013, MODIS NDVI is the Normalized Difference Vegetation Index produced from the Moderate Resolution Imaging Spectroradiometer in 2013.

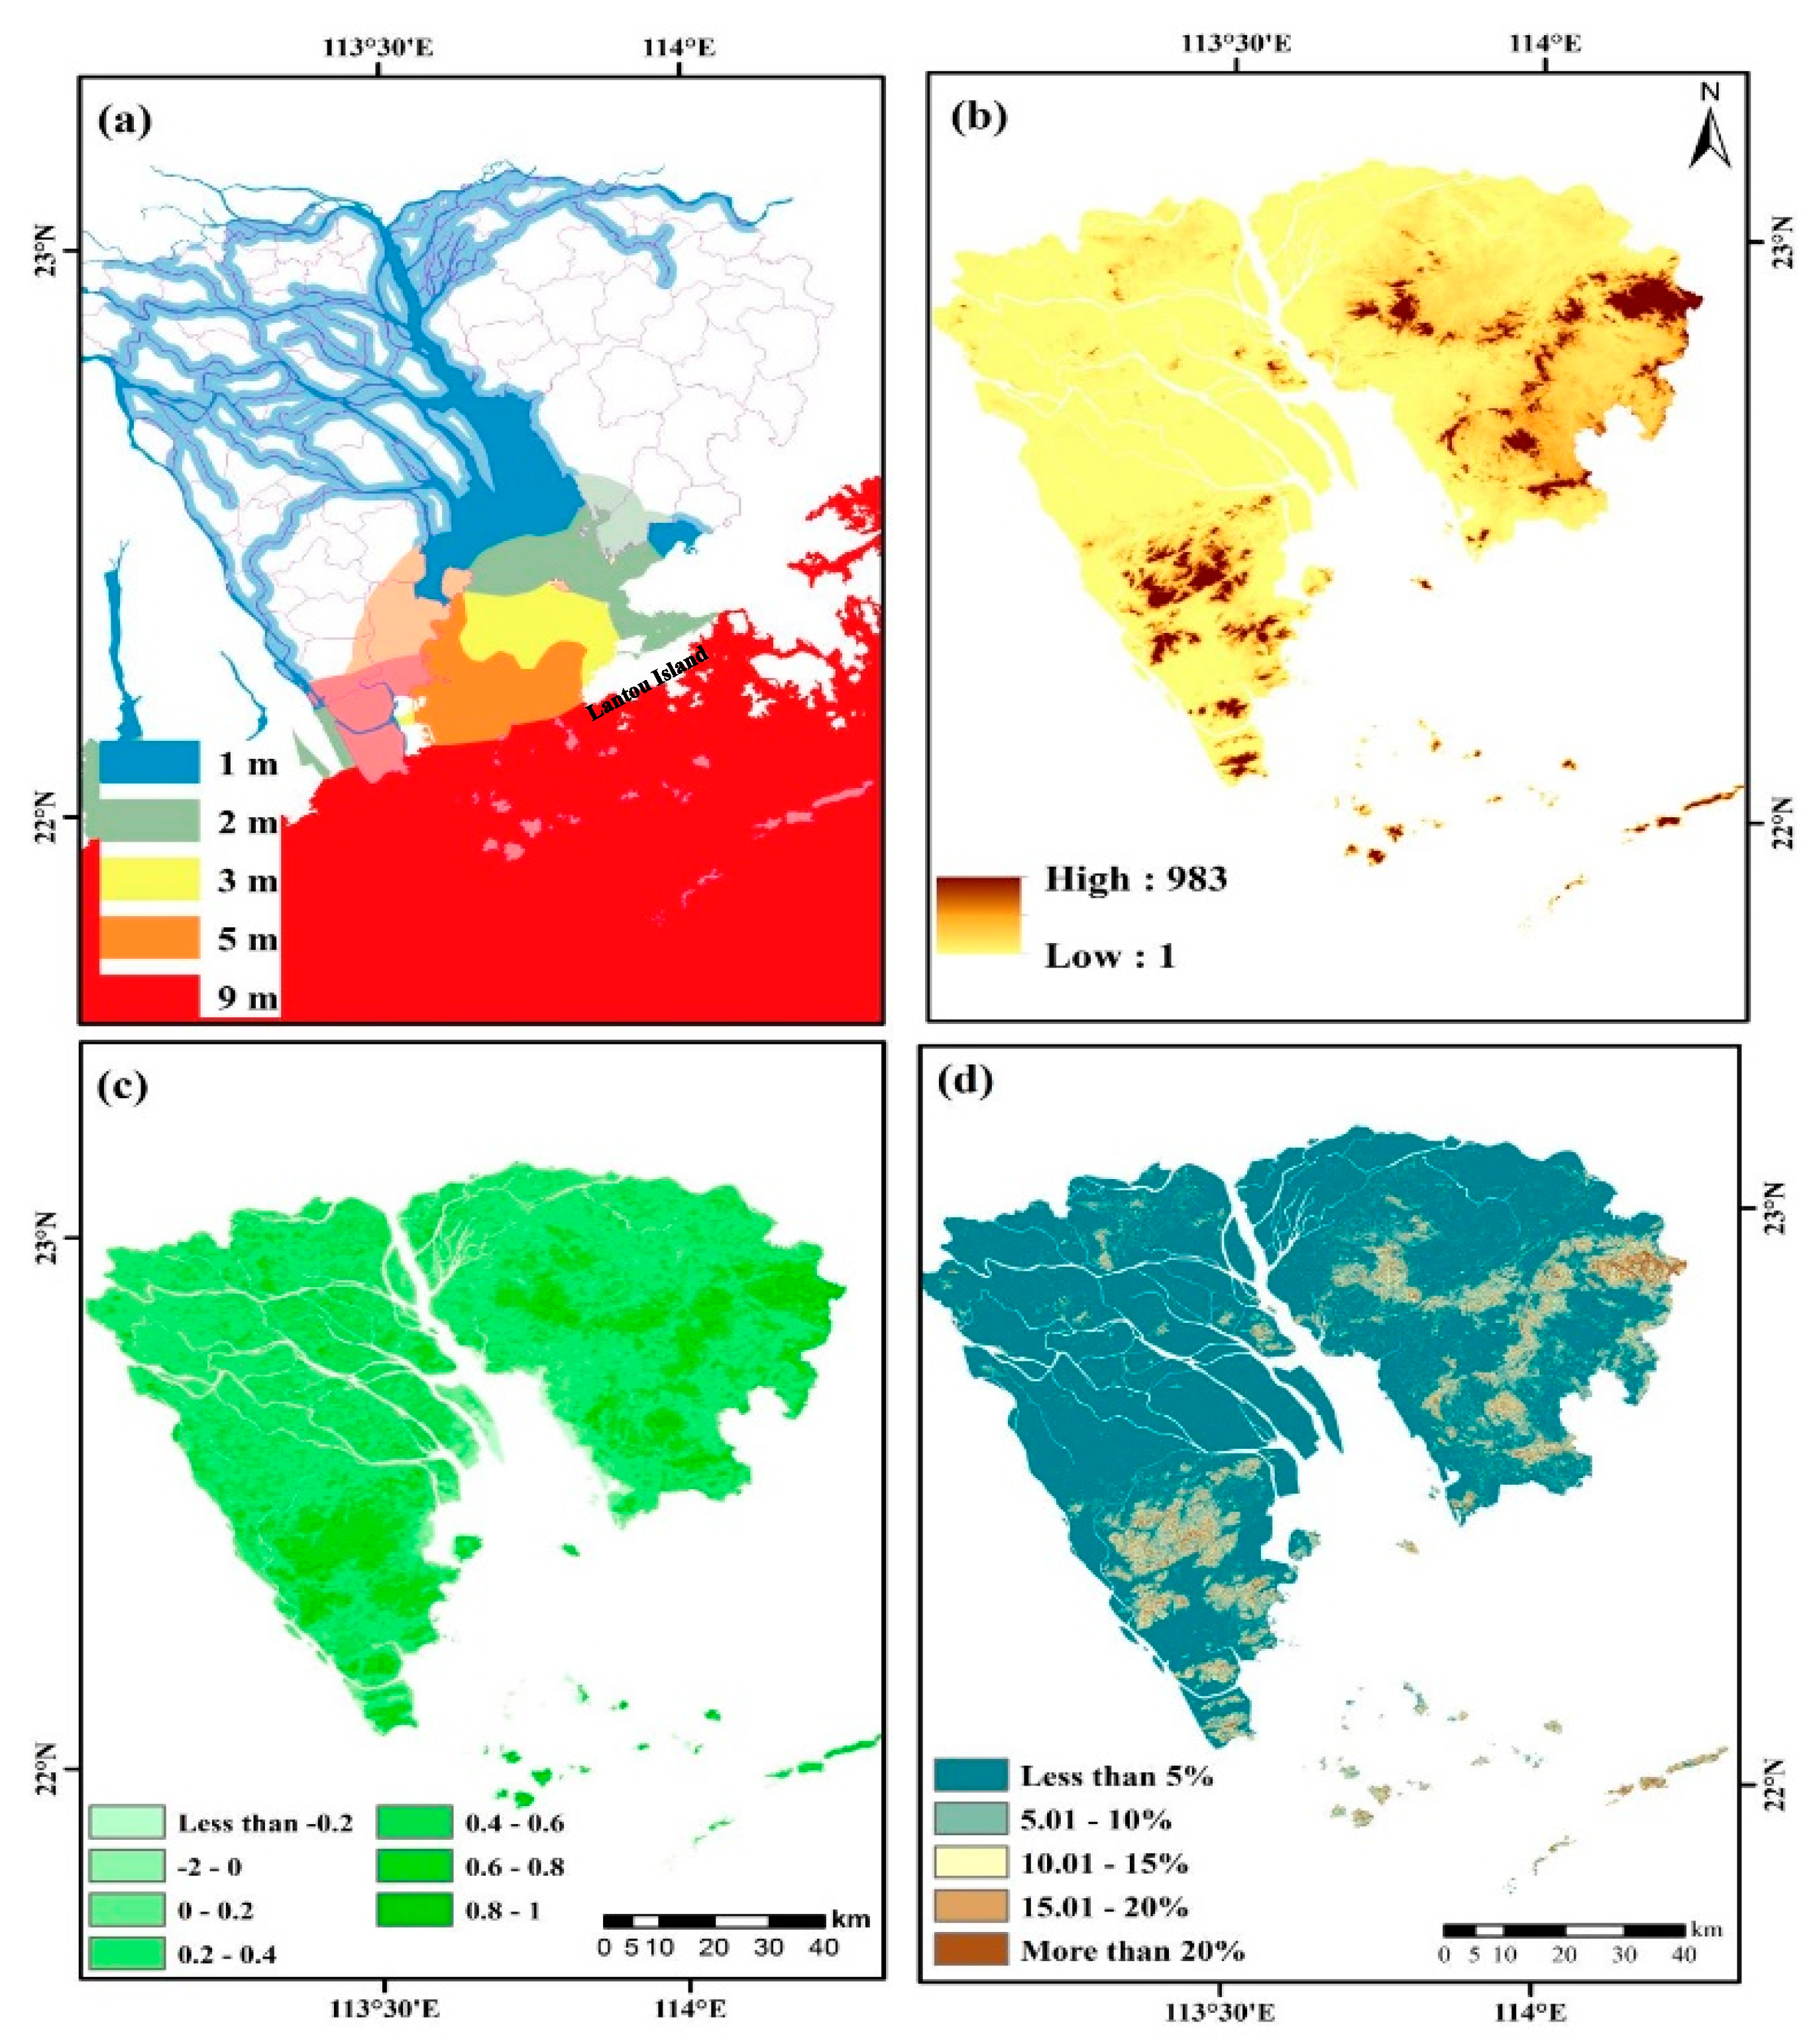
Figure 3.
Tsunami hazard parameters; (a) Tsunami wave heights in different colors based on exported river net system and modified after [4], and its corresponding inundation map in transparent color; (b) elevation map of the study area; (c) NDVI mean of 2013; (d) slope map.
Figure 3.
Tsunami hazard parameters; (a) Tsunami wave heights in different colors based on exported river net system and modified after [4], and its corresponding inundation map in transparent color; (b) elevation map of the study area; (c) NDVI mean of 2013; (d) slope map.

Figure 4.
DMSP/OLS Saturation Correction. (a) Original DMSP/OLS NTL data; (b) the saturation correction results of the HIS method; (c) the saturation correction results of the VANUI method.
Figure 4.
DMSP/OLS Saturation Correction. (a) Original DMSP/OLS NTL data; (b) the saturation correction results of the HIS method; (c) the saturation correction results of the VANUI method.

Figure 5.
Population density in PRE.

Figure 6.
The population NTL simulation at the town level.

Figure 7.
Mean relative error of town-level population NTL simulation.

Figure 8.
Modelling outputs; (a) Tsunami hazard map, (b) population density within the tsunami hazard area (low: Less than 1500/km2, moderate: 1501–2400/km2, high: 2401–3800/km2, very high: More than 3800/km2), (c) evacuation priority map.
Figure 8.
Modelling outputs; (a) Tsunami hazard map, (b) population density within the tsunami hazard area (low: Less than 1500/km2, moderate: 1501–2400/km2, high: 2401–3800/km2, very high: More than 3800/km2), (c) evacuation priority map.


Table 1.
Online population data references for cities in Pearl River Estuary (PRE).
| City | Online Population Data Link | Last Date Accessed |
|---|---|---|
| Dongguan | http://tjj.dg.gov.cn/website/web2/art_list.jsp?columnId=1000 | 13 February 2019 |
| Panyu District of Guangzhou City | http://www.panyu.gov.cn/PY01/xxgk_index.shtml | |
| Nansha District of Guangzhou City | http://www.gzns.gov.cn/zwxxgk/tjxx/ | |
| Shenzhen | http://www.sztj.gov.cn/xxgk/zfxxgkml/tjsj/tjnj/ | |
| Shunde District of Foshan City | http://www.shunde.gov.cn/sg/page.php?Sid=10&Tid=3 | |
| Zhongshan | http://www.zsstats.gov.cn/tjzl/tjnj | |
| Zhuhai | http://www.stats-zh.gov.cn/tjsj/tjnj/ |
Table 2.
Predicted inundation area based on worst case scenario of tsunami produced in Ren et al. [4]
Table 2.
Predicted inundation area based on worst case scenario of tsunami produced in Ren et al. [4]
| Wave Height (m) | Velocity (m/s) | Penetration Distance (m) |
|---|---|---|
| 9 | 5 | 18,000 |
| 5 | 3.2 | 11,520 |
| 3 | 2.4 | 8640 |
| 2 | 1.6 | 5760 |
| 1 | 0.4 | 1440 |
Table 3.
Input parameter criteria of hazard map modeling.
| Elevation (m) | Slope (%) | NDVI | Inundation Buffer | Rank |
|---|---|---|---|---|
| 8–9 | More than 20 | 0.8–1 | 1 | 1 |
| 7–8 | 15–20 | 0.6–0.8 | 2 | 2 |
| 6–7 | 10–15 | 0.4–0.6 | 3 | 3 |
| 5–6 | 5–10 | 0.2–0.4 | - | 4 |
| 4–5 | Less than 5 | 0–0.2 | 5 | 5 |
| 3–4 | - | Less than 0 | - | 6 |
| 2–3 | - | - | - | 7 |
| 1–2 | - | - | - | 8 |
| Less than 1 | - | - | 9 | 9 |
© 2019 by the authors. Licensee MDPI, Basel, Switzerland. This article is an open access article distributed under the terms and conditions of the Creative Commons Attribution (CC BY) license (http://creativecommons.org/licenses/by/4.0/).
Share and Cite
MDPI and ACS Style
Mohamadi, B.; Chen, S.; Liu, J. Evacuation Priority Method in Tsunami Hazard Based on DMSP/OLS Population Mapping in the Pearl River Estuary, China. ISPRS Int. J. Geo-Inf. 2019, 8, 137. https://doi.org/10.3390/ijgi8030137
AMA Style
Mohamadi B, Chen S, Liu J. Evacuation Priority Method in Tsunami Hazard Based on DMSP/OLS Population Mapping in the Pearl River Estuary, China. ISPRS International Journal of Geo-Information. 2019; 8(3):137. https://doi.org/10.3390/ijgi8030137
Chicago/Turabian StyleMohamadi, Bahaa, Shuisen Chen, and Jia Liu. 2019. "Evacuation Priority Method in Tsunami Hazard Based on DMSP/OLS Population Mapping in the Pearl River Estuary, China" ISPRS International Journal of Geo-Information 8, no. 3: 137. https://doi.org/10.3390/ijgi8030137
Note that from the first issue of 2016, this journal uses article numbers instead of page numbers. See further details here.