Article

Semantics-Constrained Advantageous Information Selection of Multimodal Spatiotemporal Data for Landslide Disaster Assessment

1
Faculty of Geosciences and Environmental Engineering, Southwest Jiaotong University, Chengdu 611756, China
2
Institute of Space and Earth Information Science, The Chinese University of Hong Kong, Shatin, N.T., Hong Kong 999077, China
3
College of Engineering, Peking University, Beijing 100871, China
4
Guangzhou Urban Planning & Design Survey Research Institute, Guangzhou 510060, China
*
Authors to whom correspondence should be addressed.
ISPRS Int. J. Geo-Inf. 2019, 8(2), 68; https://doi.org/10.3390/ijgi8020068
Submission received: 27 December 2018 / Revised: 21 January 2019 / Accepted: 27 January 2019 / Published: 30 January 2019

Abstract

:
Although abundant spatiotemporal data are collected before and after landslides, the volume, variety, intercorrelation, and heterogeneity of multimodal data complicates disaster assessments, so it is challenging to select information from multimodal spatiotemporal data that is advantageous for credible and comprehensive disaster assessment. In disaster scenarios, multimodal data exhibit intrinsic relationships, and their interactions can greatly influence selection results. Previous data retrieval methods have mainly focused on candidate ranking while ignoring the generation and evaluation of candidate subsets. In this paper, a semantic-constrained data selection approach is proposed. First, multitype relationships are defined and reasoned through the heterogeneous information network. Then, relevance, redundancy, and complementarity are redefined to evaluate data sets in terms of semantic proximity and similarity. Finally, the approach is tested using Mao County (China) landslide data. The proposed method can automatically and effectively generate suitable datasets for certain tasks rather than simply ranking by similarity, and the selection results are compared with manual results to verify their effectiveness.

1. Introduction

Landslides have become increasingly common in recent years as a result of global climate change, and they have caused large losses in terms of property and lives [1,2,3]. Post-disaster assessments must be performed immediately to collect information on damage and support emergency rescue and subsequent reconstruction [4,5,6,7,8]. When a landslide occurs, the disaster-related organizations collect and firstly prepare the related datasets, including basic geographic data, economic data, remote sensing data, and so on. Then, different models and approaches are adopted to determine the affected area, damage extent, and direct losses. Many issues, such as population of dead or injured, affected crops, collapsed houses, and the economic losses need to be assessed. Finally, the accuracy and precision of assessment result can be improved by integrating field investigation, remote sensing monitoring, model estimation, and local level reporting of disaster impact data. Datasets from multiple sources usually play a fundamental role in the assessment and the accuracy of assessment results depends on the reliability of original datasets. In the practice of disaster-related organizations, the data preparation process is carried out manually by operators with backgrounds, which can be time-consuming and error-prone because of the complexity of the datasets [9,10,11]. Meanwhile, a rapid increase in disaster-related data can be used to provide information for assessment along with the growing popularity of the Internet and earth observation technology. This significant change in the available disaster-related data requires innovative enabling technologies to improve the integration and retrieval of large amounts of information. Therefore, this article focuses on the data preparation process and developing an approach to filter and select the useful datasets for loss assessment. Such an approach can considerably improve the automation of assessment tasks and reduce the difficulty of data preparation efforts.
Disaster-related data, including remote sensing images, ground monitoring data, and historical data, exist in various formats (e.g., text, multimedia, etc.) and come from various sources (e.g., unmanned aerial vehicles, satellites, smartphone devices, etc.) and are characterized by velocity, variety, and veracity [12,13,14,15,16]. However, the massive amount of disaster-related data may result in more redundancy and inconsistency in addition to the information that is useful for assessment. The abundance of multimodal data nowadays can be fruitful for disaster assessment, but they can also pose impediments in such a task since they can be irrelevant, outdated, or redundant. Appropriate information selection from such a repository of big and multimodal data is a challenge, especially in cases of disaster assessment when lives are at stake.
The research on big data selection and recommendation has gradually developed into a focus of attention for many domains; however, providing an effective and efficient way of finding required datasets on demand is a challenge.
Data retrieval is a common way of finding the required information. Traditional geo-information retrieval methods and systems used in disaster response are restricted to keyword-based searches and do not consider the semantics of geo-information [17,18]. Thus, these passive search methods are limited in their capability to capture the conceptualizations and the spatiotemporal nature of geo-information associated with user requirements [19]. Consequently, users must search for many keywords and determine which are relevant for tasks. Semantics-related technology can be adopted to identify semantic concepts and relationships with disaster-related geo-information to enable the fusion of heterogeneous data or to bridge the gap between the task and the original data [20,21,22]. Spatial semantics have been used in disaster data management [18,23,24,25,26]. Semantic similarity measures, including the string-based model, the semantic distance-based model, the information-based model, the tag-based model and the hybrid model, are widely used in graphical data retrieval, and similarity mainly depends on the metadata to create relationships [27,28]. Data characteristics, such as data title, spatial coverage, temporal coverage, and data type, are used to quantitatively calculate the similarity between a dataset (or datasets) and tasks [11,29]. The similarity method has been proven as an efficient way to retrieve geo-information, and this method is adopted in the research to find relevant datasets.
However, most of the contributions focus on evaluating the similarity individually but ignore the redundancy and the combination effect in practical application. How to precisely select the datasets that totally fit the application remains an unsolved problem.
Feature selection, also known as variable selection, aims to select a subset of relevant variables and remove redundancy for analysis; it has been widely applied in the areas of data mining and machine learning. Both relevance and redundancy are taken into consideration when evaluating subsets [30]. Feature selection methods can be categorized into filter and wrapper models based on their subset evaluation function [31]. The filter methods usually use proxy measures, such as distance, dependency, consistency, and information, while wrapper methods use a predictive model to score feature subsets [32,33]. It is known that a total of 2 n 1 candidate subsets must be evaluated to find the best subset of n datasets, and compared with wrapper methods, filter methods are computationally simpler and faster because their evaluation processes do not rely on learning methods. Thus, filter methods are more applicable to high-dimensional datasets related to emergency situations. The minimum-redundancy-maximum-relevance (mRMR) filter criterion is considered one of the most frequently used methods for reducing dimensionality to its high accuracy [34,35], and it is applied to the research to find the optimal datasets. However, most existing filter feature selection approaches use statistical metrics based on samples to calculate the relevance and redundancy of data attributes [33,36,37], so these terms of relevance and redundancy must be properly redefined for data selection. Data similarity is appropriate for creating these filter criteria but when it comes to the specific assessment tasks, more inter-data relationships, such as complementary or homogeneous relations extracting from the domain knowledge and experience, must be considered. Neglecting feature interaction or dependence may not lead to optimal selection results [38,39].
Overall, geographic information retrieval focuses on finding relevant datasets and ranking them using a semantic matching score; however, the retrieval process does not fully consider redundancy, and ranking candidates could not meet the analysis requirements directly. The study of feature selection methods provides a possible way of extending the retrieval process through subset generation and evaluation, but a comprehensive definition of subset evaluation criterions still needs to be studied. In this research, the fittest datasets with minimum redundancy are termed advantageous information, for which we expand the similarity-based data retrieval method and construct an advantageous information selection approach with a focus on giving a comprehensive definition of subset evaluation criteria. Relevancy, redundancy, and complementarity evaluation indicators are combined to find the best subset in this research. These evaluation indicators are defined based on both data-level relations, such as spatial coverage similarity, and task-level relations, such as extracting complementary relations from existing models. Regarding landslide assessment, the proposed method could select and group the candidates to satisfy the analytical requirements rather than simply ranking via measure score. Effectiveness is verified through a comparison with the manual selection result. Moreover, it is more reliable than other methods in terms of Precision and Recall.

2. Methodology

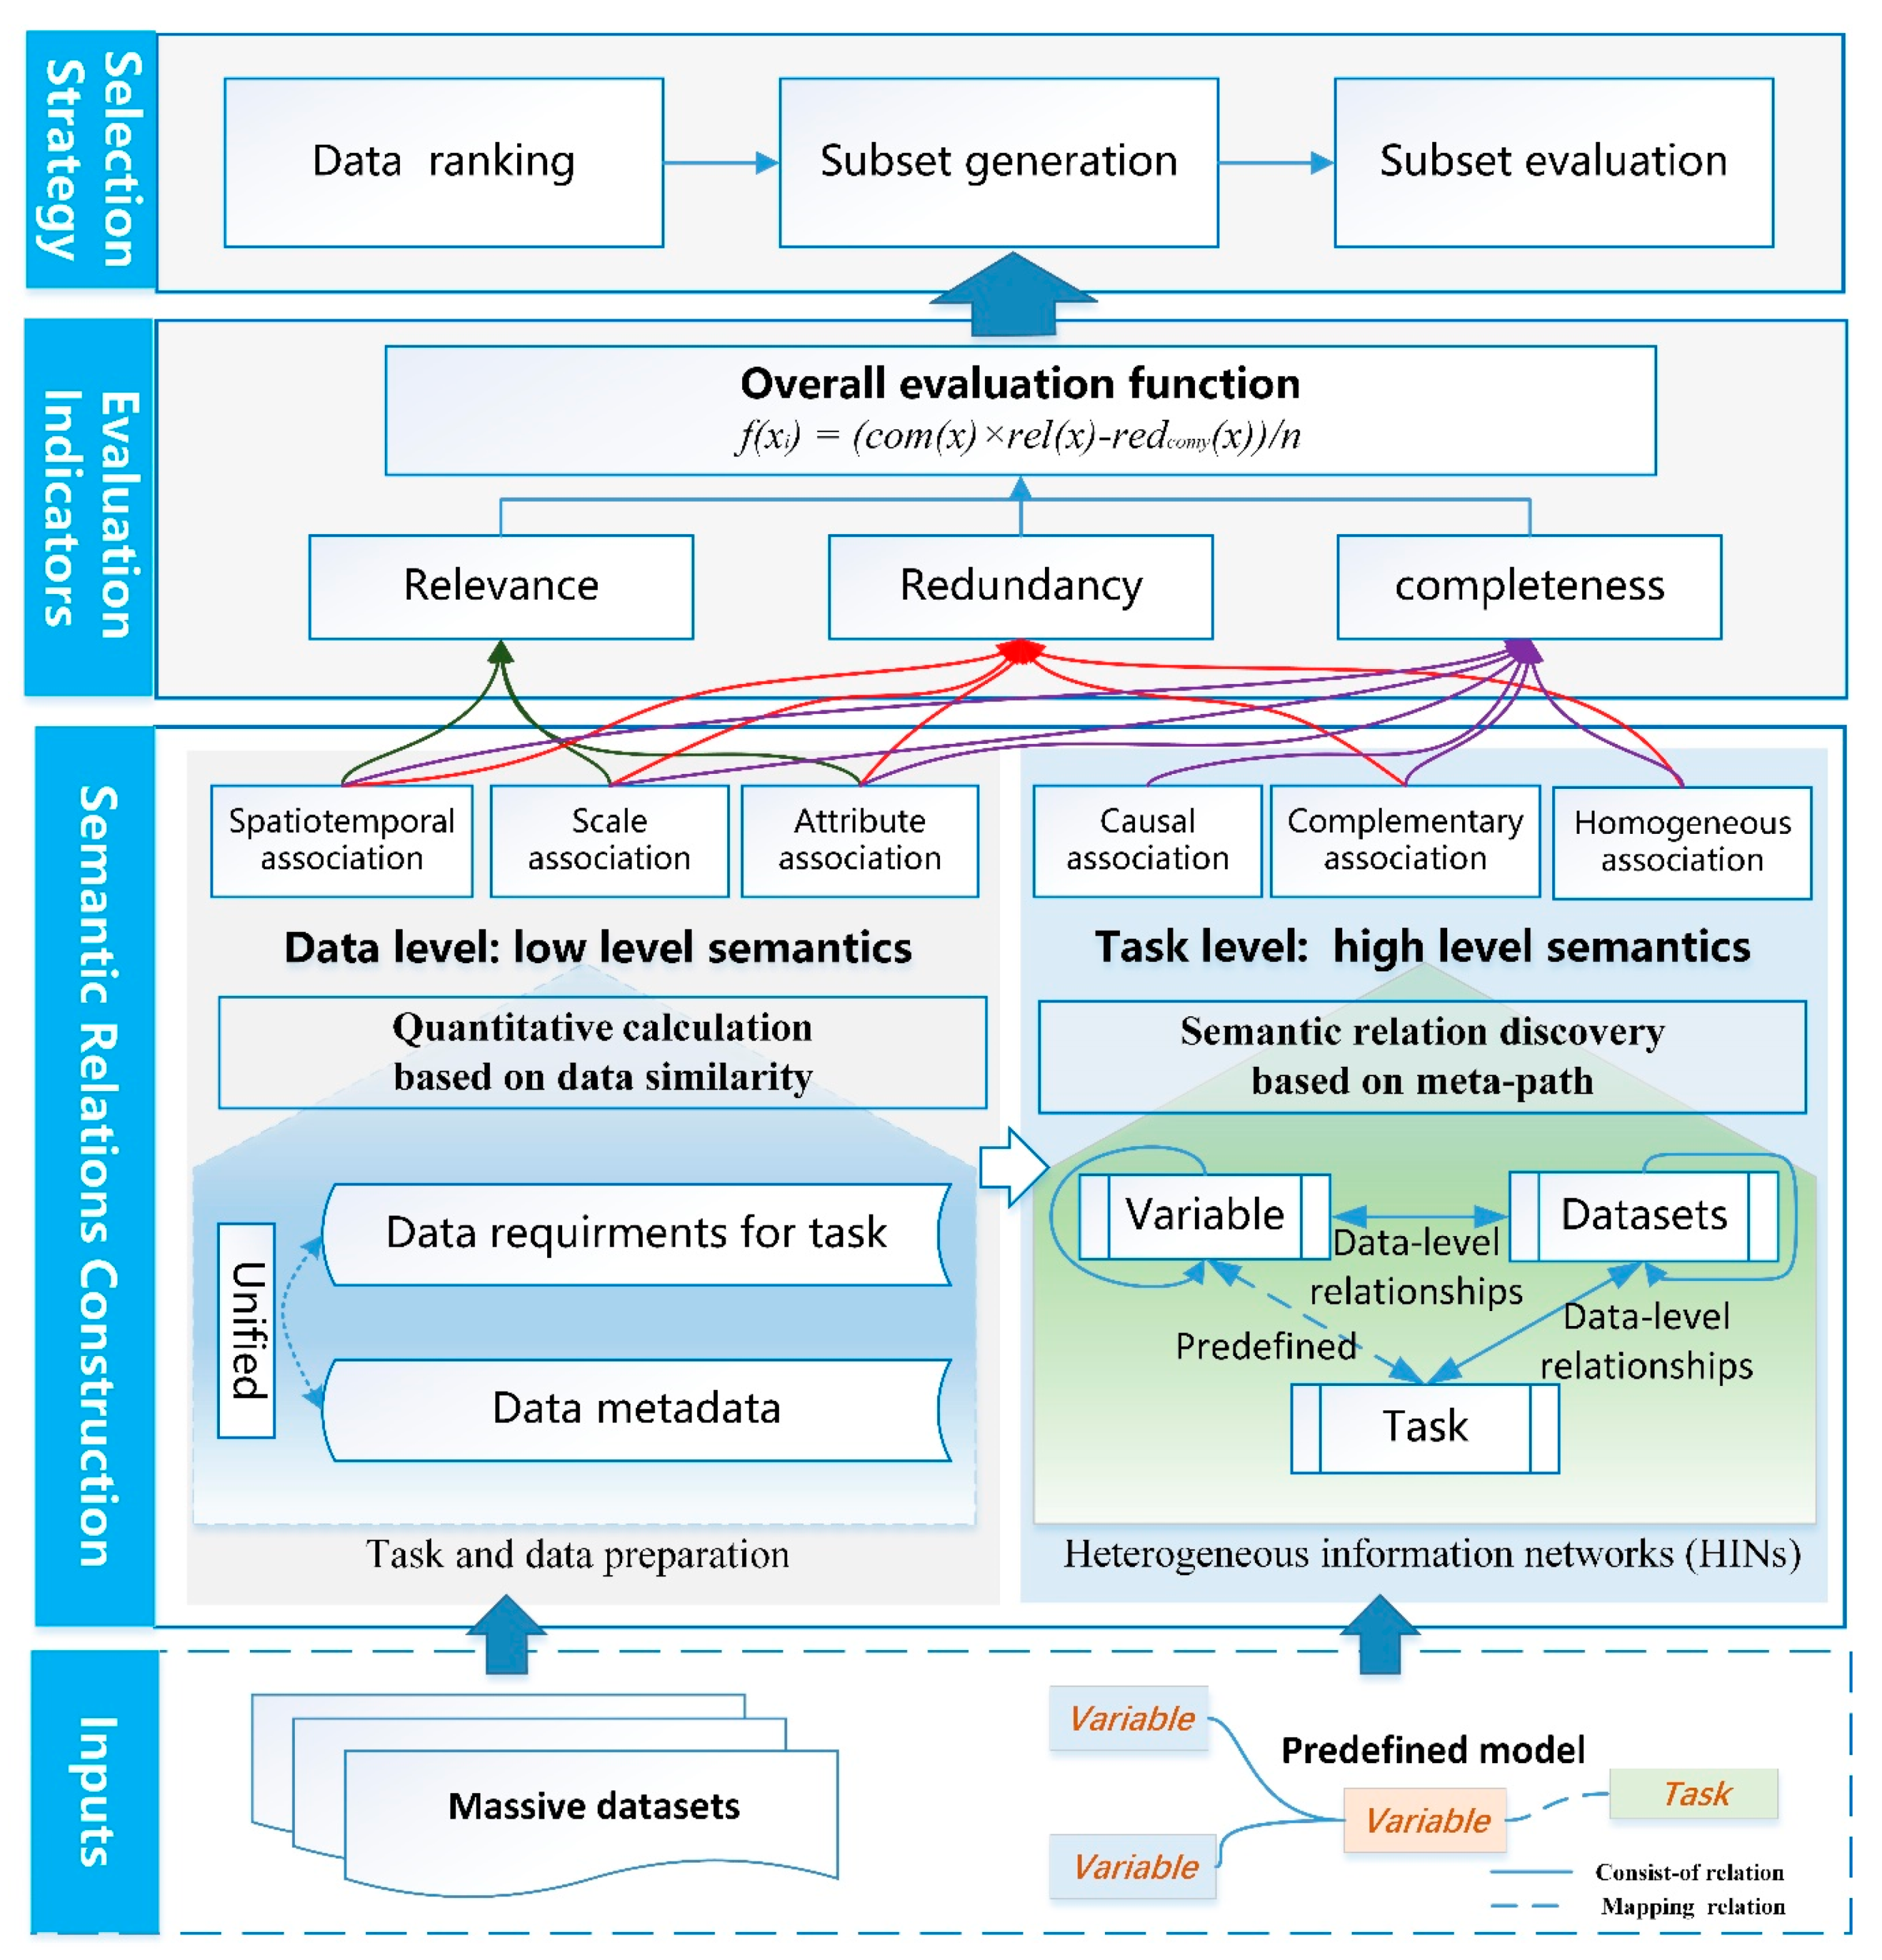
2.1. Framework of the Methodology

As shown in Figure 1, the advantageous information selection approach consists of three components: construction of semantic relationships, definition of evaluation indicators, and selection strategy. Inputs are predefined models and massive datasets, and the models can be ontological or simply conceptual, but this is beyond the scope of this research.
The first component, the construction of semantic relationships, is part of the preprocessing for information selection that includes the two levels of relationships. The datasets, task, and variables are formulated by a set of united metadata, which is addressed elsewhere [11,24]. The data-level relationships are based on semantic similarity and used to link the datasets, tasks, and variables. Then, all these relations are organized as heterogeneous information networks (HINs) and the task-level relationships are reasoned through a meta-path method which is used to constrain the selection process. In the second component, three evaluation indicators, relevance, redundancy, and complementarity, are defined based on the relationships to measure the datasets as a whole. The relevant indicator is used to filter irrelevant datasets; the redundancy indicator can be used to eliminate redundant datasets; and the complementarity indicator guarantees effectiveness for a given task. Finally, the selection strategy component provides a detailed approach flow, which mainly contains datasets filtered by relevance, subset generation, and subset evaluation.

2.2. Construction of Multidimensional Semantic Relationships

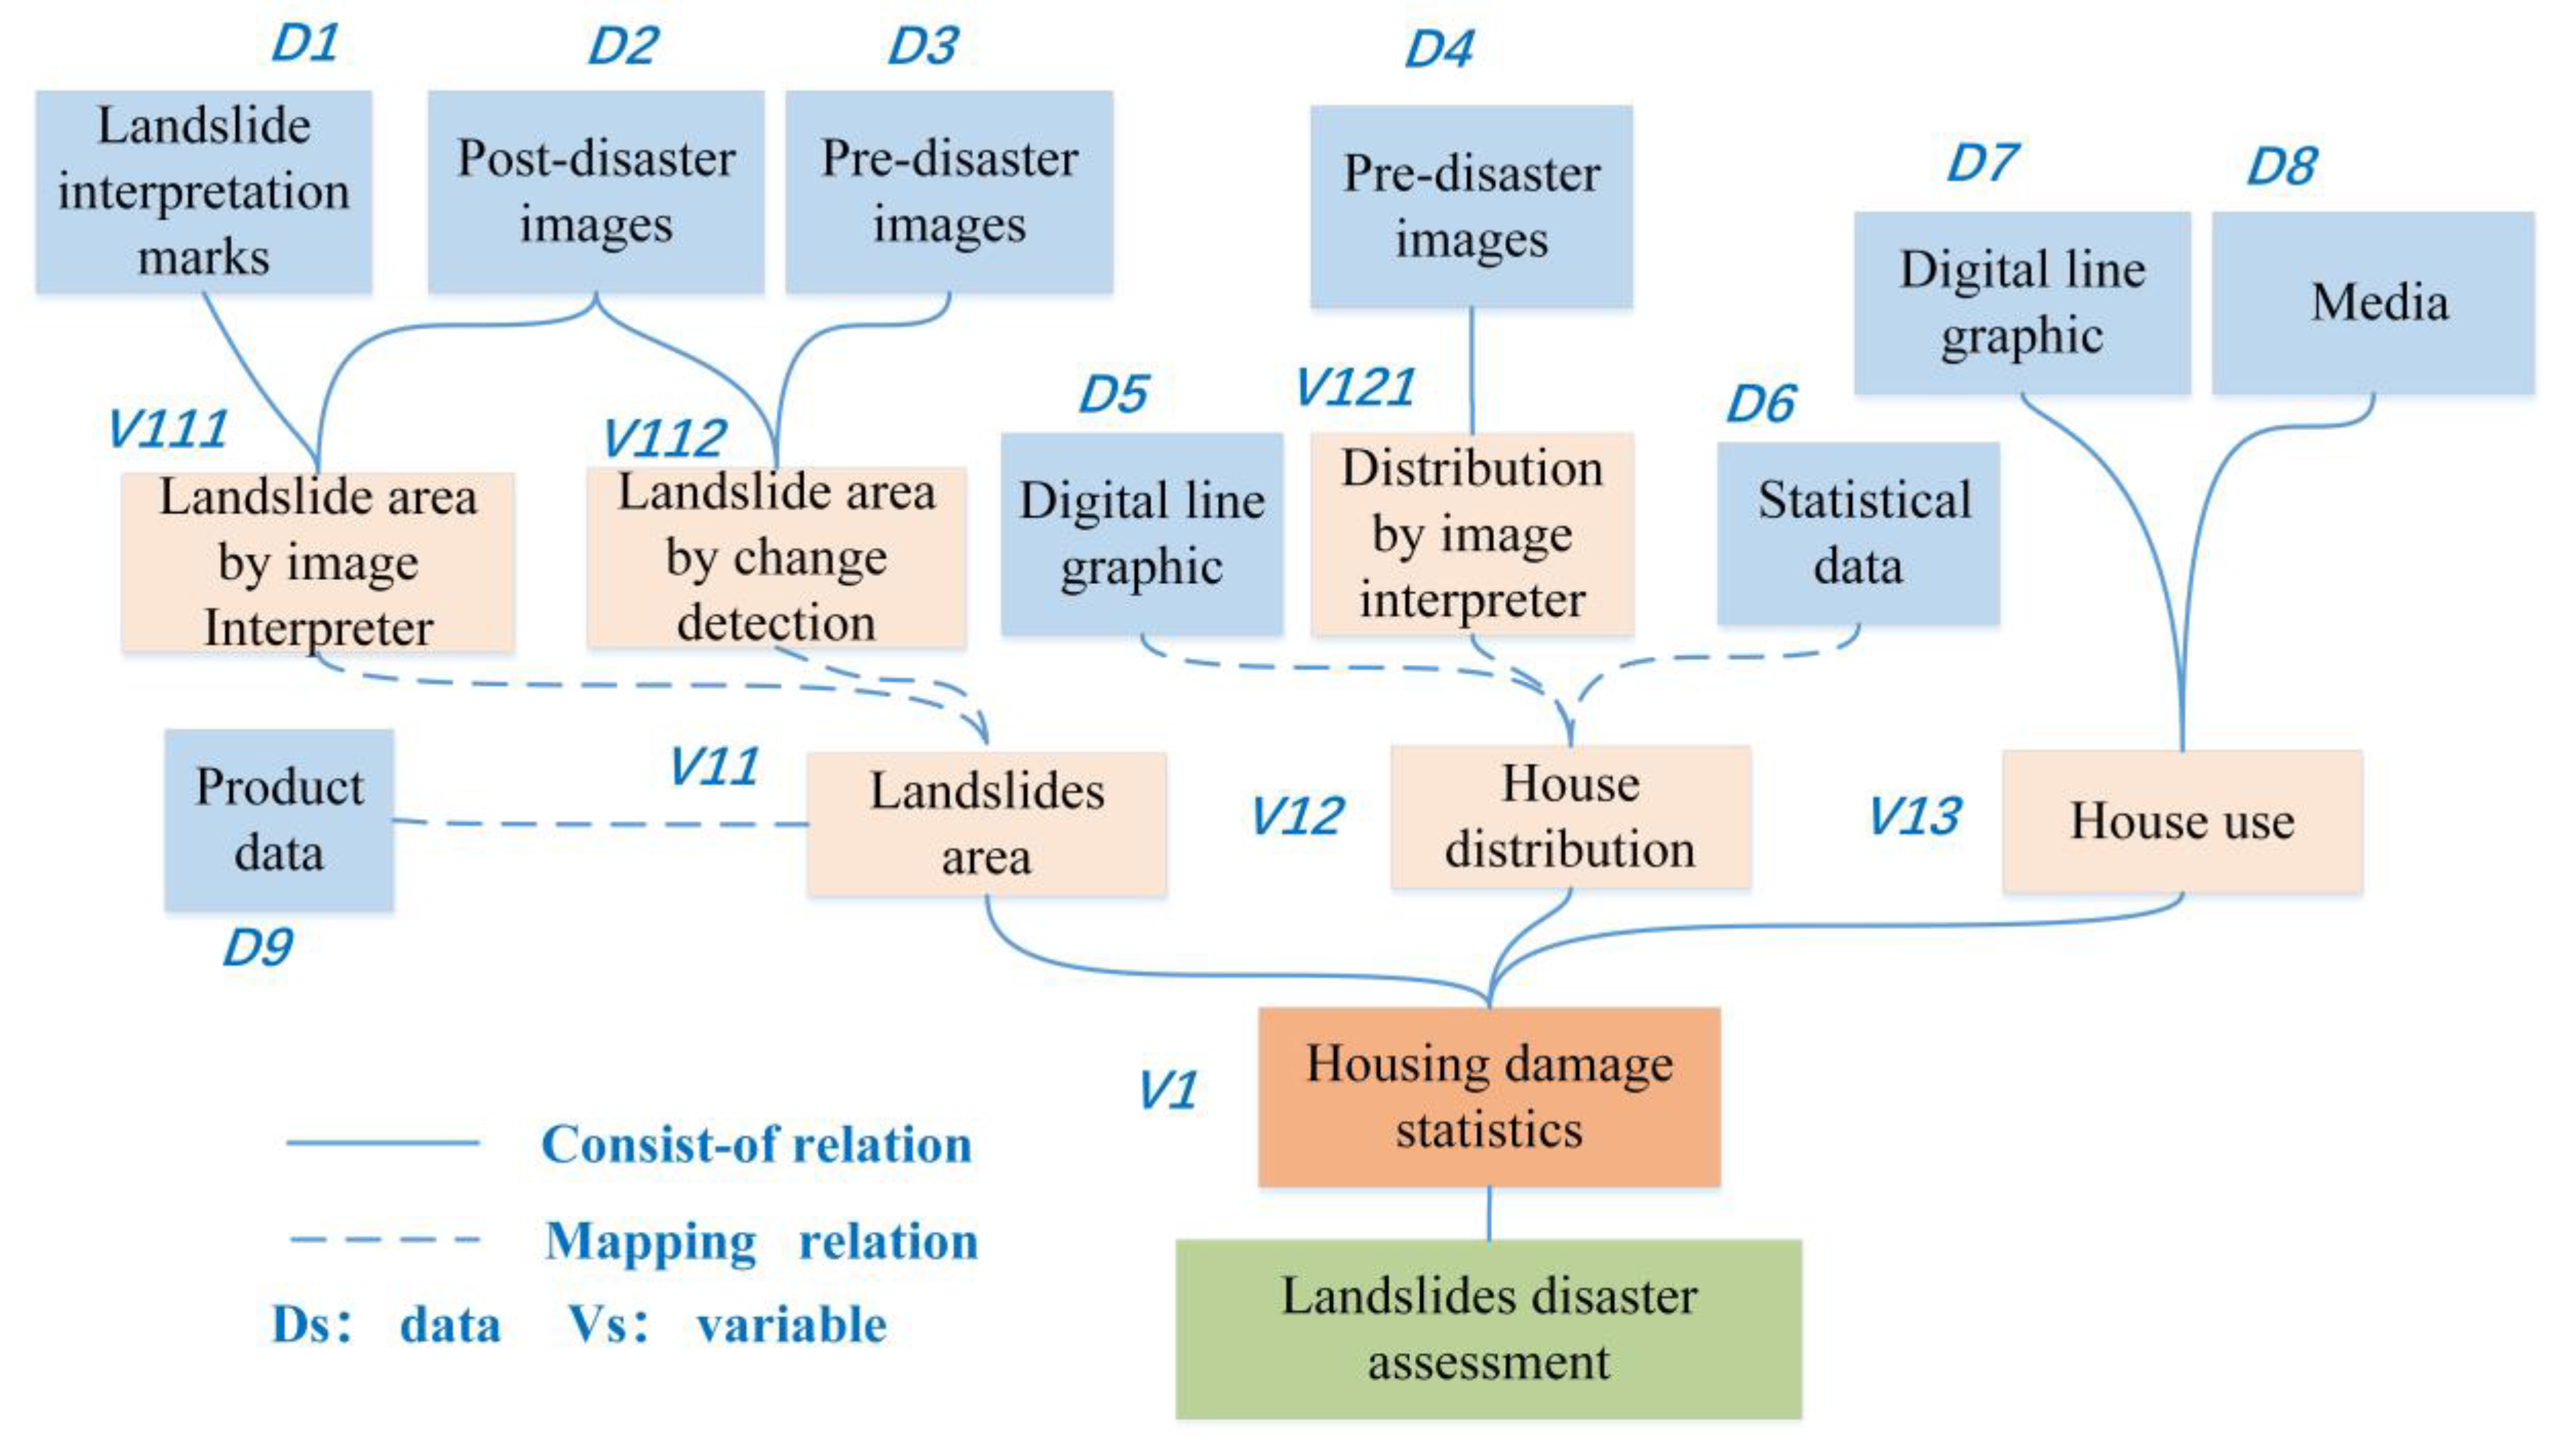
2.2.1. Unified Description of Multiple-Association Relationships

This paper abstracts and defines the multiple-association relationships as two levels according to their roles in data selection (shown in Figure 1). Data-level relationships (denoted as DRs) include data attribute relationships (ARs), scale relationships (SRs), and spatiotemporal relationships (STRs), which indicate the intrinsic characteristics of geospatial data. Task-level semantic relationships (denoted as KRs) include causal relationships (CauRs), homogeneous relationships (HomoRs) and complementary relationships (ComRs), which represent the specific ‘knowledge’ for each task and application [40,41]. These semantic relationships are difficult to obtain using data alone and must be developed from an existing domain ontology, models, or expert experience. Given two datasets, Di and Dj, the various relationships between them are defined as follows:
R(Di, Dj) = <DR, KR>,
where DR = <STR, SR, AR> and KR = <CauR, HomoR, ComR>.
The spatiotemporal relationship is a principal characteristic of earth observation data, as it is the essential filter condition for geographical data retrieval [42,43]. Scale relationships show the autocorrelations and interactions among scales. These relationships exist within geographic spatiotemporal variables, and variables at different scales can depict a geographic phenomenon or process at micro-, meso-, and macro-levels. Attribute relationships express the similarity between variables with data content, spatial precision, and temporal granularity.
Causal relationships refer to the objective relationships that describe and analyze cause and effect. This type of relationship is defined here to express the hierarchical relationships between parameters or data. During implementation, causal relationships are divided into mapping relationships and consist-of relationships. Homogeneous relationships are defined to show the synonymy between heterogeneous data from different domains on the application level. Datasets from different sources that reflect the same variable can share a relationship. For example, an earthquake intensity map and a Weibo or Twitter post distribution map may have the same effect in disaster assessment. Complementary relationships show variables that complement each other; considerable research has contributed to the discovery and utilization of this type of relationship [44,45]. In the next section, the calculation methods of these relationships will be given.

2.2.2. Calculation of Data-Level Relationships Based on Data Similarity

Data-level relationships can be quantitatively measured using similarity according to a previous study [46,47,48,49]. Since calculating the data-level relationships is the foundation of the following approach, we briefly introduce the formula in this paper. Some modifications and simplifications have been made based on recent research, and more detailed information can be found in the literature [29]. Three elementary similarities between the characteristics can be calculated using the following methods. Before the calculation, the metadata of datasets and the description of task or variables are formulized and unified through a series of description factors such as title, keywords, data resolution, spatial coverage, and so on [11,24].
(1) Spatiotemporal similarity
Spatiotemporal similarity refers to spatial coverage similarity and temporal coverage similarity; the former can be determined using the overlapping area and the latter can be determined by the time overlapping length or distance of the analysis, usually with preference for the latest data. The spatiotemporal similarity is calculated using Equation (2):
S S T = W S × S S × W T × S T
S S = ( A r e a ( S D T D ) / A r e a ( T D )
S T = δ | Time ( SD ) Time ( TD ) |
where SD represents the source data; TD represents the task requirement or target data; W S and W T refer to the weights of spatial coverage and temporal coverage, respectively, which are both set to 0.5 as space and time are tightly coupled during disasters; T i m e   ( S D ) and T i m e   ( T D ) indicate the middle time; and δ   represents the adjustment parameters used to control deceleration, which is set to 0.9 when the time interval between T i m e   ( S D ) and T i m e   ( T D ) is less than a year and a half; otherwise it is set to 0.6. The product in Equation (2) may be transformed into a sum when space and time are not tightly coupled.
(2) Scale similarity
Scale similarity refers to the spatial and temporal granularity/resolution similarity. If the scales of SD and TD are the same, then their similarity is equal to 1. Furthermore, a reasonable interval is defined as I = [ s c a l e T D σ ,   s c a l e T D + σ ] , where σ represents the acceptable error threshold. If the scale of SD is different from that of TD and if s c a l e S D is in interval I , we set the similarity to 0.875 when the scales of SD and TD are fine-to-coarse, whereas similarity is set to 0.125 when coarse-to-fine, for data that can be converted but whose conversion simplicity differs. Otherwise, if s c a l e S D exceeds interval I , similarity is equal to 0. Scale similarity is calculated using Equation (5).
S S C A ( S D , T D ) = { 1 s c a l e T D = s c a l e S D 0.875     s c a l e S D   [ s c a l e T D σ ,   s c a l e T D ) 0.125   s c a l e S D   ( s c a l e T D ,   s c a l e T D + σ ) 0 s c a l e S D   I
(3) Attribute similarity
Attribute similarity can be determined by the matching degree of the keywords. Keywords mainly include category, data type, and usage. The keyword type can be predefined for the convenience and accuracy of computing. Given keyword sets K W S D and K W T D , similarity is calculated using Equation (6). String and linguistic similarity calculation methods can be used here when keywords have not been extracted from text [44], but these methods are not included in this research.
S A ( S D , T D ) = N u m b e r _ o f ( K W S D K W T D ) / N u m b e r _ o f ( K W T D )

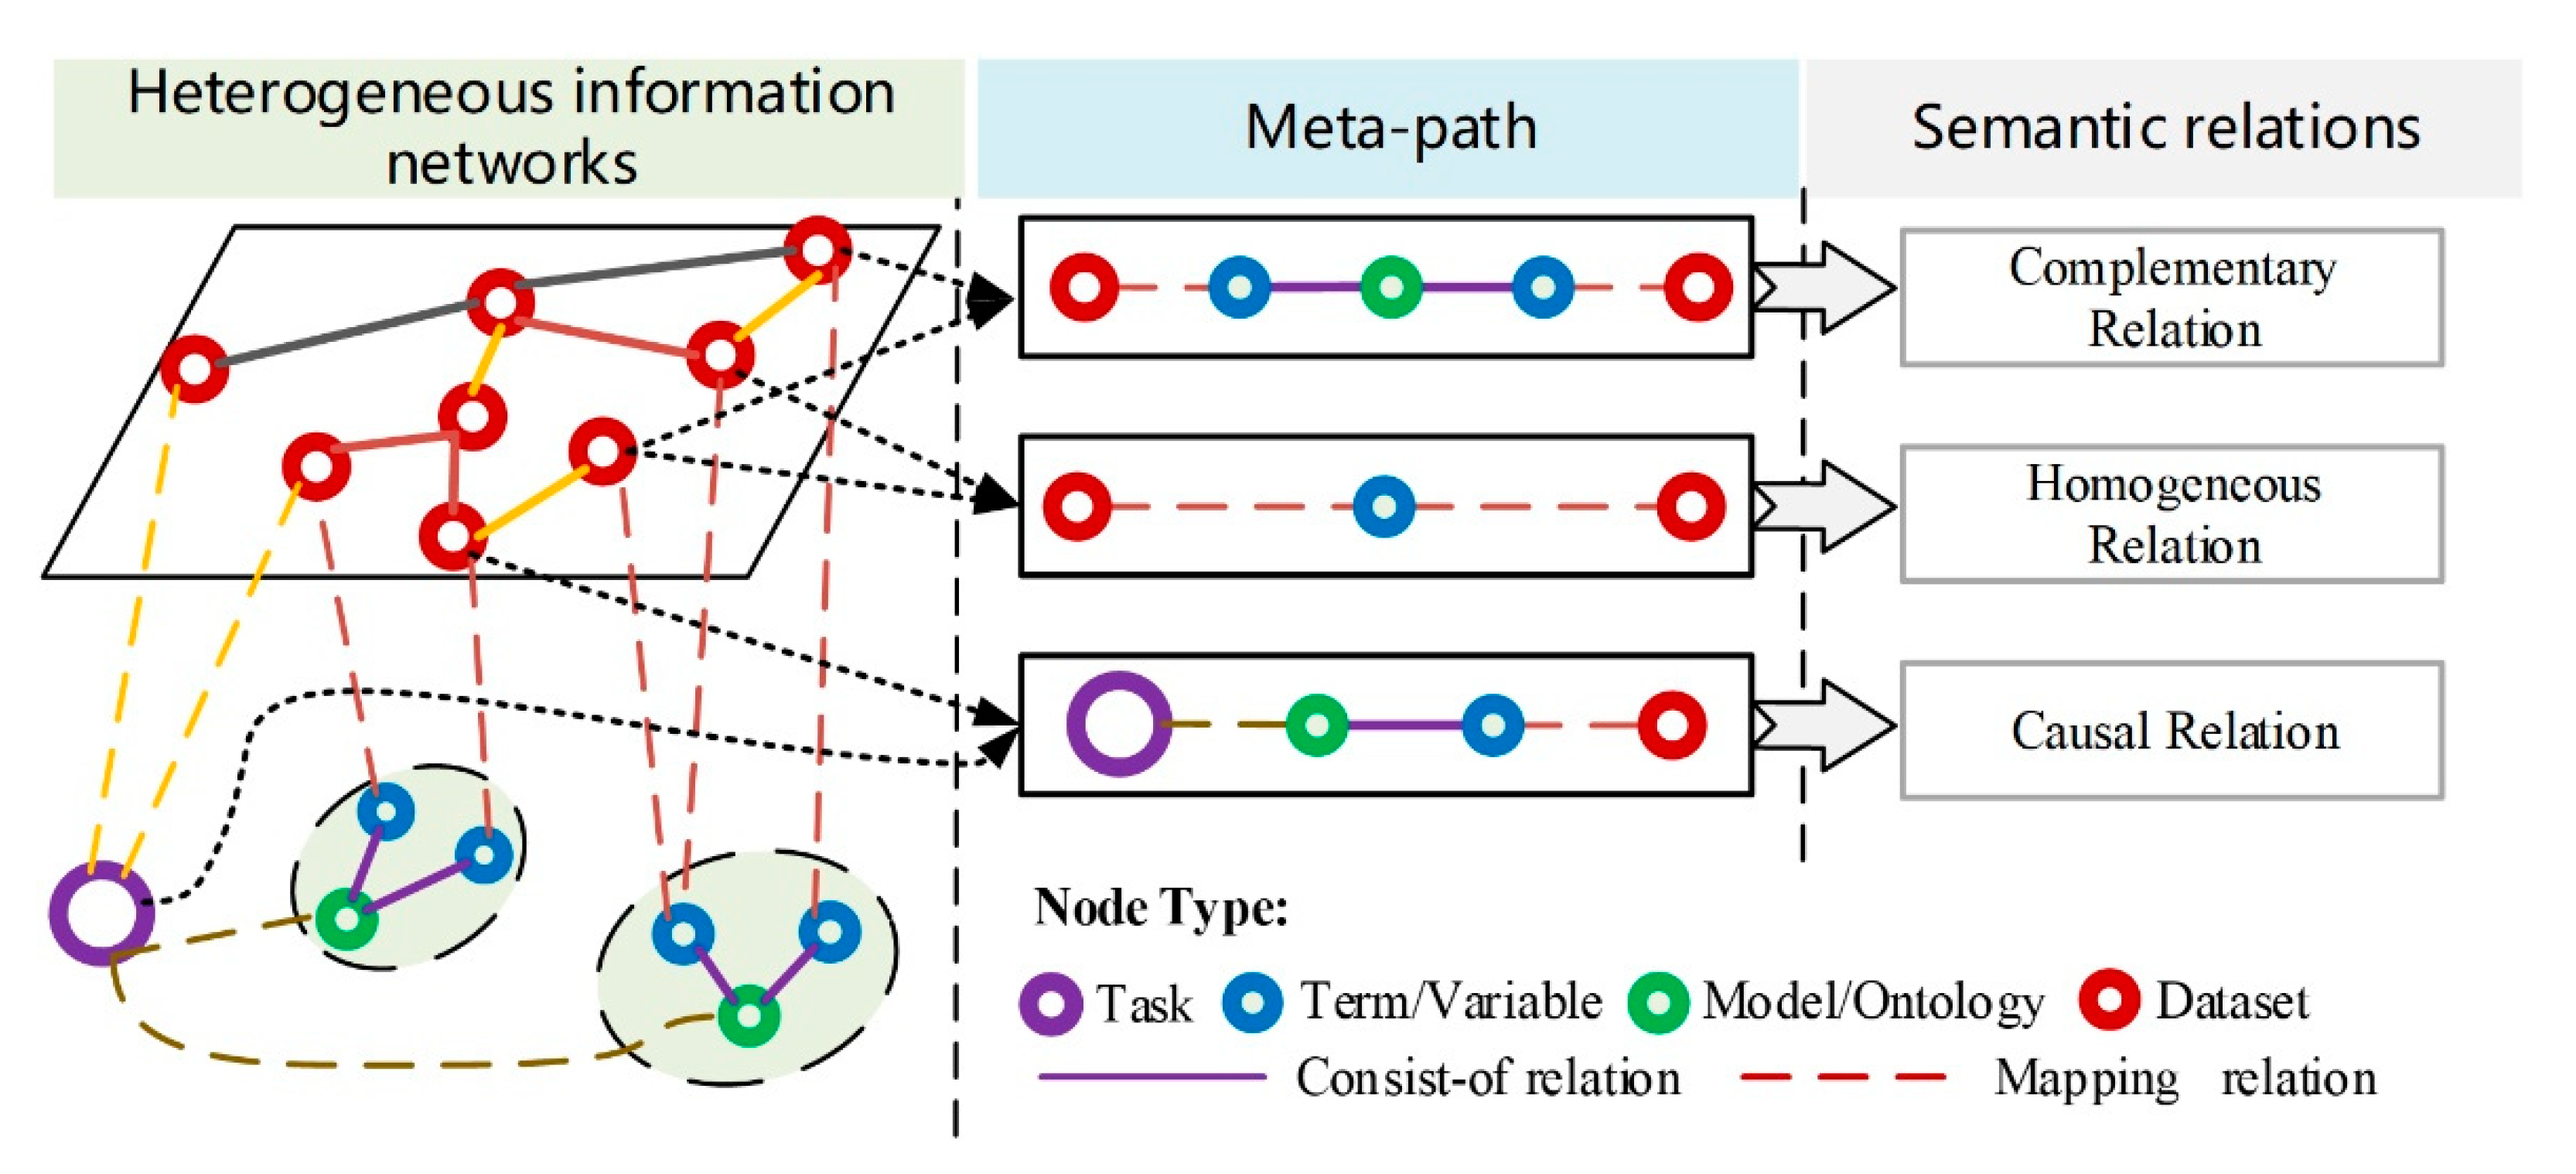
2.2.3. Task-Level Relationship Discovery Based on Meta-Paths

Task-level relationships are reasoned through the meta-path method based on the HIN which can powerfully represent the essential information and links among various objects [50,51]. The HIN is built firstly by integrating the related datasets and a pre-defined model (such as Figure 2) that describes the relations between terms or variables.
As shown in Figure 3, the heterogeneous information network is composed of task, model, variable, and data, the first three of which can be considered term nodes. Specifically, the heterogeneous information network is defined as G = (N, E, D, W), where N indicates the set of nodes; E is the set of links between nodes and consists of triplets (u, v, d, where u, vN and dD); D is a set of relationship types, each member of which represents a different type of link; and W is the set of the weights of the links between nodes u and v in dimension d and represents the strength of the links. The link type can be abstracted as two relationships: mapping and consist-of.
To complete the network, the datasets are required to link with the corresponding variables (or task) by matching the metadata and description factors of requirements. The data similarity method mentioned in Section 2.2.2 is used to quantitatively calculate the strength of relations. The relations between task node and data node can be used to roughly filter the datasets, and the relations between the variable node and the data node are used to further filter irrelevant data and support the discovery of the following task-level relations.
After the HIN is completed, the task-level relationships can be reasoned by a meta-path-based approach. A meta-path is defined as the shortest typed sequence that connects two or more objects in a HIN. The node of the sequence is the object type, and the edge is the relationship between object types. A meta-path can be a widely used description of how two objects are uniquely related in networks, and the relationships among similar types of links usually share similar semantic meanings. Once standard meta-paths are defined, the relationships between two objects can be found in a network by matching the meta-path query [52].
In this paper, the hierarchical structure of the terms is organized as a tree graph, and the term node with minimum depth in the shortest path between two datasets is defined as the middle node (MN). The relationship type on both sides of the node determines the association type of the datasets. As shown in Figure 3, three types of semantic relationships of type nodes are defined as follows:
(1) Causal relationship
The causal relationship reflects data that affect the analysis results in a certain way. This type of relationship between a task and data is constructed by using an existing model as a bridge. The corresponding meta-path indicated in Figure 3 is Ijgi 08 00068 i001, which represents a path of type t a s k R m o d e l R v a r i a b l e R   · · ·   R d a t a .
(2) Homogeneous relationship
The homogeneous relationship is defined for dataset pairs with the same physical meaning. Two datasets will have a homogeneous relationship when not all relationships linked to the MN are consist-of relationships in the shortest path between them. The corresponding path indicated in Figure 3 is Ijgi 08 00068 i002, which represents a path of type d a t a R · · ·   r 1 M N r 2   · · ·   R d a t a , where the relationships of r1 and r2 do not belong to the consist-of relationship at the same time.
(3) Complementary relationship
A complementary relationship refers to the group capacity of datasets, and a group of datasets with a complementary relationship always has a synergistic effect during analysis. Two datasets will have a complementary relationship when all relationships linked to the MN are consist-of relationships in the shortest path between them. The corresponding path indicated in Figure 3 is Ijgi 08 00068 i003, which represents a path of type d a t a R · · ·   c o n s i s t o f M N c o n s i s t o f   · · ·   R d a t a .
For example, if one dataset (denoted as DS1) is linked to variable D9, and another dataset (denoted as DS2) is linked to variable D5 in Figure 2. The relationship between datasets DS1 and variables D9 is treated as a causal relationship. And data with no corresponding variables will be removed from the candidates. The shortest path between DS1 and DS2 is D S 1 V 11 V 1 V 12 D 5 D S 2 . Its meta-path is d a t a R v a r i a b l e c o n s i s t o f v a r i a b l e ( M N ) c o n s i s t o f v a r i a b l e R v a r i a b l e R d a t a , which is matched with the meta-path of the complementary relationship. The semantic relationships of homogeneous and complementary are used to group the datasets automatically and find the best data sets for the execution of the analysis.

2.3. Semantics-Concerned Evaluation Indicators

Advantageous information selection methods aim to find a suitable and reliable subset of datasets that minimize redundancy and maximize relevance. In this paper, relevance, completeness and redundancy are defined for selection results evaluation. If X = ( d 1 , d 2 , · · · , d n 1 , d n ) is a subset with n datasets, then the indicators can be defined as follows.
Relevance is used to evaluate and rank datasets individually. We apply data similarity, including spatiotemporal similarity, scale similarity, and attribute similarity, to the quantitative calculation of relevance. Relevance, as used to quantify the total similarity between X and T ( T A S K ) , is defined as Equation (7).
R e l ( X i ) = ( S S T ( X i ,   T ) + S S × S S C A ( X i ,   T ) + S A ( X i ,   T ) ) / 3
Completeness is used to evaluate all candidates as a whole, and it is ignored in general selection methods, which are usually not constrained by the analytical model. Completeness consists of two parts in this study, i.e., spatiotemporal integrity and data category integrity. The former is a basic component of spatiotemporal analysis, and the latter is necessary for specific analytical model. Suppose that the analytical model needs n essential variables. Then, completeness is defined as follows:
C o m s ( X ) = S S T × V a r N u m ( X ) / n
where Var N u m ( X ) denotes the number of corresponding variables in the candidate set X. Multiple variables that have causal relationships can be counted only once.
Redundancy refers to information that is expressed more than once. Examples of redundancy include multiple datasets with homogeneous relationships or multiple datasets with a repeating spatiotemporal range. However, redundancy should be a relative concept, and it changes according to the situation [34]. For example, some datasets may be redundant with regard to the spatiotemporal range but complementary with regard to resolution. Therefore, we define a redundancy-complementarity indicator to consider the intercorrelations between datasets. Given datasets X i and X j , which have a homogeneous relationship, redundancy and related definitions are calculated as follows:
R e d C o m y ( X i ,   X j ) =   R ( X i ,   X j ) × C S C A ( X i ,   X j   )
R ( X i ,   X j ) =   S S T ( X i ,   X j ) × S S C A ( X i ,   X j ) × S A ( X i ,   X j )
C S C A ( X i ,   X j   ) = { 0 C o m R ( X i , X j )   e x i s t s 1 e l s e
where C S C A represents the constraints delivered from semantic relationships. Datasets with high similarity score may bring few redundancies when they represent different variables or semantic meanings. Taking two image data points of the same area as an example, one is obtained on 23 June and the other on 24 June. These two data may be redundant because they are so similar. Once the landslides occurred in the early hours of 24 June, they become complementary because they are both necessary to detect changes. R ( X i ,   X j )   can reflect the amount of repetitive information. Here, we use multiplication to emphasize the potential information gains in space, time, scale and attributes. Local detailed information may improve global accuracy according to the methods of data fusion, transfer learning, etc.
Finally, based on the evaluation indicators above, the overall evaluation function is proposed as follows:
f ( X ) = ( C o m s ( X ) × R e l ( X ) R e d C o m y ( X ) ) / n
where R e l ( X ) is the total relevance of the candidates, R e d C o m y ( X ) is the sum of the redundancy of each pair of datasets in the candidate set, and n is the number of candidates. This equation is used as the utility function in the selection process to effectively evaluate the subsets.

2.4. Semantics-Constrained Advantageous Information Selection Strategy
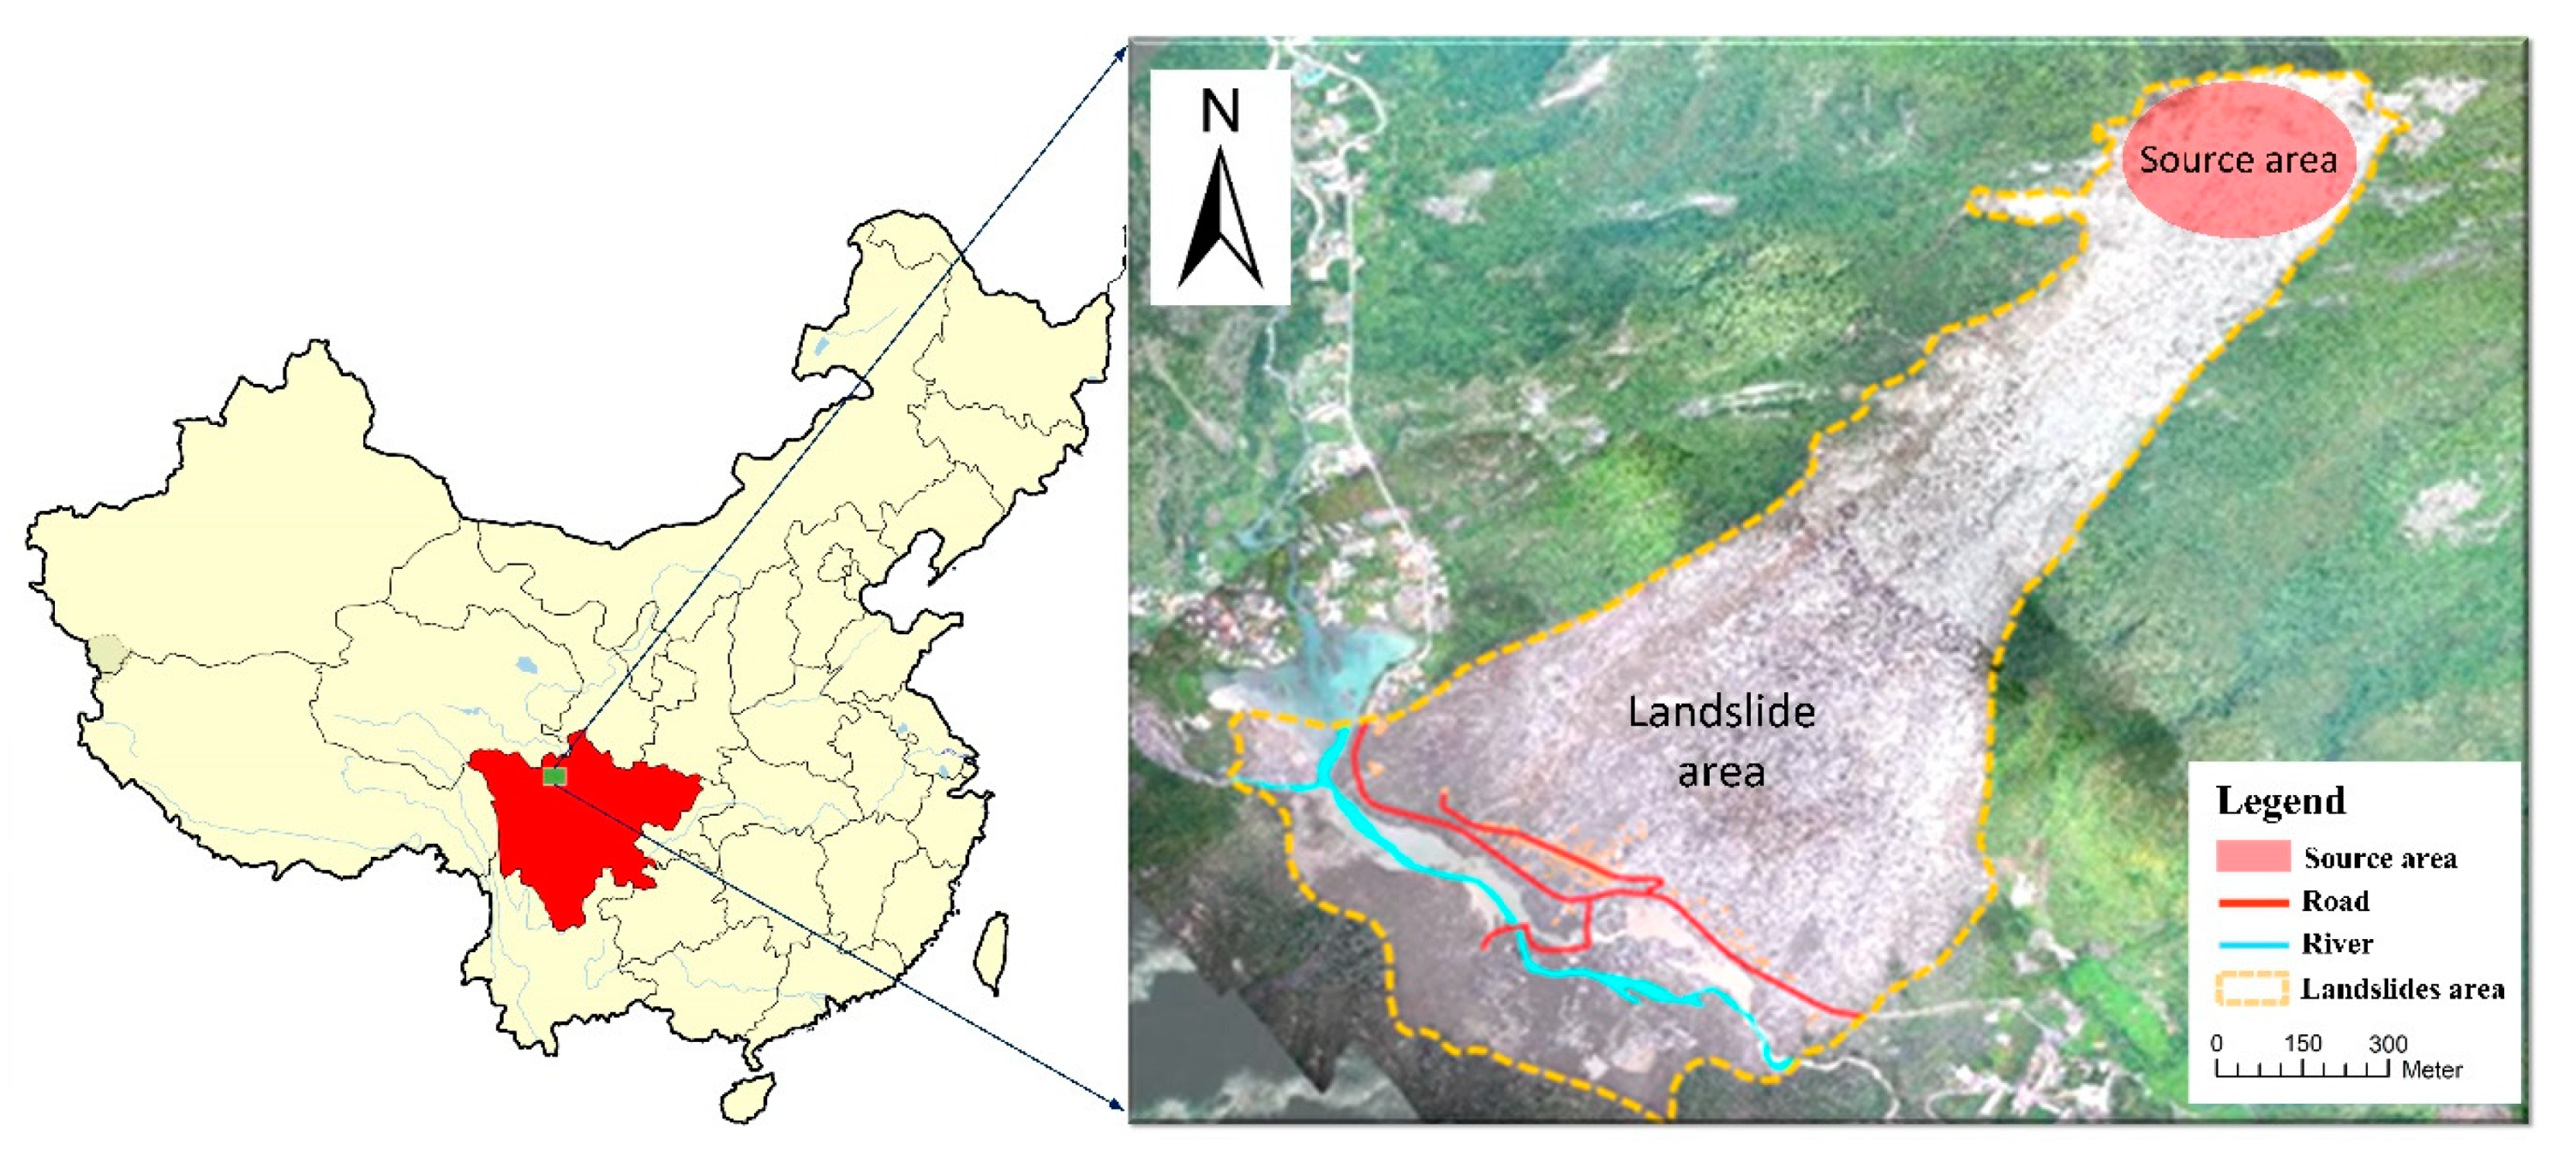
The proposed selection approach is divided into three steps:
(1) Dataset ranking by relevance
The relevance ranking process aims to rank the dataset based on the relevance between task requirements and available datasets. As shown in the previous section, relevance can be calculated by Equation (6). Datasets are ranked by the final relevance score, and datasets without spatiotemporal similarity will be removed.
(2) Subset generation
Random generation and sequential selection are adopted to generate subsets. First, n datasets are randomly selected from the candidates as the original subset, and then all datasets that are complementary to them are selected into the subset.
(3) Subset evaluation
The indicators of completeness and redundancy are calculated firstly for the subset. Then, sequential backward selection, which sequentially removes datasets that can increase the value of overall evaluation function defined in Equation (12), is adopted. This subset generation and evaluation processes will repeat until the value of the overall evaluation function cannot be increased.

3. Case Study

To verify the effectiveness of the proposed approach, we adopt landslide loss assessment as the target and the case study demonstrates the process of the automatic and adaptive selection of data for an assessment. Post-disaster damage and losses assessment of landslides is a complex process that involves many factors, such as landslide area and strength, the distribution and property value of housing and infrastructure.
The studied landslide occurred on 24 June 2017 in Diexi Town, Mao County, Sichuan Province in south-western China (Figure 4). It destroyed 40 homes in Xinmo Village and killed 10 people, with a further 73 people missing [53]. It was a high-speed and long-distance landslide. The volume of this landslide was about 8 million m3 and the sliding rocks buried village and blocked the river near the toe of the slope [54]. The direct economic loss was about 300 million Yuan according to the assessment reports. The pre-disaster information collection is necessary for the loss assessments because nearly all the buildings was buried and even the field investigations could not determine the exact losses situation. Therefore, the assessment of housing damage and losses was selected for the implementation of the proposed method in the case study. The assessment can be carried out using the following steps. (1) The landslide area must be identified according to airborne or satellite images before and after the disaster. The area can be extracted through image interpretation or change detection. (2) Housing distribution should be determined based on Digital Line Graphics (DLGs), high-resolution images or local statistical data. (3) Housing type is also used in the assessment to determine the cost of a building; this information can be generated from field survey data, local statistical data or other in situ data.
The presented implementations do not focus on the entire assessment process to generate the final assessment results, but rather concentrate on automatically finding the best datasets for the assessment. The feasibility and applicability of the proposed method are verified by demonstrating the use cases.

3.1. Test Data Description

To test the effectiveness of the proposed approach, test data are collected from the National Catalogue Service for Geographic Information of China (http://www.webmap.cn) and the Sichuan Geomatics Center. The following datasets are used in the implementation:
(1) Basic geographic data
Basic geographic data mainly cover DLG, DOM (Digital Orthophoto Map), DEM (Digital Elevation Model), DRGs (Digital Raster Graphics), and massive original images from satellites or UAVs (unmanned aerial vehicles). Two hundred DLG data points, ten thousand DEM data points, and twenty thousand images (with resolutions ranging from 0.1 m to 15 m) are included in the test datasets.
(2) Emergency thematic data
Emergency thematic data contain historical case data, socioeconomic data, real-time field data, and crowd-sourced geographic data. Some historical case data, Sichuan province census data, and more than 5000 pieces of multimedia data were obtained via crowd sourcing. In addition, four pieces of data from UAV (unmanned aerial vehicle) images and two pieces of interpreted data are included in the test datasets.

3.2. Advantageous Information Selection Process

The overall workflow of the advantageous information selection approach for geographic analysis has four steps (Figure 5):

3.2.1. Task and Data Preparation

The metadata of datasets usually includes data title, keywords, abstract, data type, data scale or resolution, spatial coverage, and temporal coverage. Similarly, requirements of task and variables are also described by these factors. All these descriptors are extracted and stored in the database in JSON format. For example, the task requirements can be represented by {"TaskName":"landslides assessment", "Keywords": "Mao county; Diexi town; landslides", "Boundary":"32.0593; 103.6373; 32.0936; 103.6787", "Occurtime": "2017-06-24","Scale": "1:500"}. This step is the basis of data retrieval.

3.2.2. Data Filtering

This step aims to remove obviously irrelevant data and reduce the overall amount of data through relevance (Equation 7) between task requirement and available data. Data with low relevance score will be removed from the original datasets and the threshold is set to 0.3. The filter results are listed in Table 1. Some datasets (i.e., items 16 and 17) are irrelevant; they are in Mao but far from the landslide area.

3.2.3. Task-Level Relationship Construction

A conceptual model of landslide assessment, as shown in Figure 2, is used to provide hierarchical associations between variables. Then, the datasets are linked with the corresponding variables and the datasets without no corresponding variables will be removed from the candidates. For example, the radar data (item 3 in Table 1) is removed because it cannot meet the optical image requirement of the variable predisaster image (D3). Finally, the meta-path approach introduced in Section 2.2.3 is used to discover task-level relationships.

3.2.4. Selection and Optimization of Datasets

The candidates are ranked by the relevance calculated by Equation (7), as shown in Table 1. Random generation and sequential selection are adopted to generate subsets. First, a dataset is randomly selected and all datasets that are complementary to it are selected as subsets. Then, sequential backward selection, which sequentially removes datasets that can increase the value of overall evaluation function defined in Equation (12), is adopted. This process is repeated until the value of the overall evaluation function cannot be increased. Taking candidates S = [2,4,5] for landslide area as the example, the selection and evaluation processes proceed as follows. First, we calculate relevance ( R e l ( X 2 ) = 1 , R e l ( X 4 ) = 0.738 , R e l ( X 5 ) = 0.685 ). Then, redundancy is computed ( R e d C o m y ( X 4 ,   X 5 ) = 0.12 , R e d C o m y ( X 2 ,   X 4 ) = 0 , R e d C o m y ( X 2 ,   X 5 ) = 0) because the C o m R relationship exists. Finally, completeness is calculated ( C o m s ( S ) = 1 ). Therefore, the overall evaluation function can be computed ( f ( S ) = 0.768 ). Given subsets St1 = {2, 4} and St2 = {2, 5}, and completeness C o m s ( S t 1 ) = 0.651 and C o m s ( S t 2 ) = 0.469 , the overall evaluation function is computed ( ( S t 1 ) = 0.565 f ( S t 2 ) = 0.440 ). Although the number of datasets in St1 and St2 is lower, the overall evaluation score is worse for the incompleteness of the spatiotemporal characteristic.

3.3. Selection Results

Although the initial datasets used in this implementation are massive, most of them are removed during filtering. The best candidate subset, with which all indicators are satisfied, consists of 5 datasets (Nos. 1, 4, 5, 6, and 11), as indicated with a green background in Table 1. No. 1 represents the landslide area; Nos. 4 and 5 correspond to house distribution and are complementary in spatial range; and Nos. 6 and 11 represent house use and are complementary variables in the assessment model. Datasets (Nos. 2, 7–10, and 12–15) with a blue background are redundant data, and datasets (Nos. 3, 16, and 17) with a red background are removed due to low relevance or lack of causal relationships. To verify the effectiveness of the selection results, ten students with professional backgrounds participated in the selection process and manually picked the datasets; the results of the 8 students are consistent with the results of the proposed research.

4. Result Analysis and Discussion

The proposed method based on an integrated evaluation index of relevancy, redundancy, and completeness can help in the data collection process and improve automation and efficiency. Table 2 shows the statistics of the final results and the results were evaluated in terms of Precision and Recall. In an information retrieval scenario, the indicators of Precision and Recall are widely used to evaluate the query methods. The high Precision means that an algorithm return more useful datasets than useless ones while high Recall means that an algorithm returned most of the useful results without consideration on redundancy. Three methods, namely keyword-based retrieval method, the relevance-based retrieve method, and the semantics-constrained advantage selection method, are compared in the table. The results of the proposed approach, which considers more semantic constraints and integrates the subset evaluation process into the retrieval method, is more reliable and has higher Precision and Recall values than the other two methods.
Keyword-based retrieval contains the most irrelevant and redundant items and its Precision is lowest (33%) of the three methods. As shown in Table 1, datasets with a red background (No. 16 and No. 17) are selected using the keyword “Mao County”, but they are far away from the landslide area due to semantic ambiguity. Moreover, multimedia datasets may not be retrieved by keywords because they are from different domains and do not contains the label related to “Mao County” or “landslides”, but it’s helpful to restore the scene before the disaster when the village are completely buried.
The relevance-based method usually only filter datasets by similarity. However, a high similarity value does not mean that they are useful for the assessment task. For example, the ranking of radar images will drop significantly after considering the gain in relevance from causal relationships because they are useless in the house losses assessment. The recommended results by relevance-based method must be further selected by operators for every variable as the method still ignores the redundancy. Furthermore, as we can see from the change of statistical indicators, this method is sensitive to the threshold values of relevance; large threshold values will improve Precision but worsen Recall. There is an inverse relationship between precision and recall, where it is possible to increase one at the cost of reducing the other. The threshold value definition remains a problem for relevance-based methods [11].
In the proposed method, relevance is used to generate the original candidates, and then the subsets generation and evaluation processes are used to select final results. Therefore, a lower relevance value (0.3) is adopted to guarantee that all useful datasets are selected into the original candidates. In the subset generation and evaluation process, the redundancy is removed while ensuring the completeness of the datasets. Hence, the proposed method can have a higher Precision and Recall at the same time. The improvements depend on the domain knowledge and the new evaluation indicators. Domain knowledge is presented by the predefined conceptual model (Figure 2) in this research, which can give the relationships between assessment factors or variables. But, these hierarchical relations cannot be adopted directly for the selection process. Thus, the task-level relationships are defined in this paper and the hierarchical relationships between concepts can be converted into semantic constraints between datasets by the reasoning method based on meta-path. The predefined conceptual model can be transformed from the existing assessment models and case data and an automatic transformation tool should be developed in the future.
Comprehensive disaster assessment of affected area, damage extent, and direct economic losses is an emergency work for the government in order to make rescue and reconstruction plans. The proposed selection approach can facilitate the automation and accuracy of loss assessment and can be applied to the disaster management platform as a service to help improve the efficiency of the response and assessment works. Experts or operators can concentrate more on the decision-making process rather than the time-consuming data collection and selection process. The selection method is task-oriented, and operators can change the input parameters, such as keywords, in the task requirements when a new landslide happens. Then, the methods can retrieve and select the advantageous information for loss assessment. During the selection process, the semantic relationships between datasets can be dynamically built and the relationships between the concepts will not change with the landslides. This research concentrates on landslide assessment as specific knowledge input is required for implementation. We believe that it can be adopted for other disaster scenarios, and even for other data selection tasks, such as visualization. The users can establish different task requirements and corresponding concept association graphs as the predefined input model for other cases. However, the thresholds used for the indicators may need to be adjusted for ideal selection when a new task is given.

5. Conclusions and Future Studies

Determining optimal datasets for complex geographic analysis has become an urgent but time-consuming issue in the age of “big data”. Therefore, it is important to rapidly and accurately identify appropriate input data to ensure the timeliness and reliability of disaster assessment. This study proposes a framework based on semantic relationships for the automatic recommendation of the best dataset for the assessment model according to a group evaluation index that includes relevance, redundancy, and completeness. The employment of semantics can make the selection process smarter based on an understanding of the concepts underlying geo-information. In the framework, semantic relationship types are formalized into two levels that contain a similarity relationship based on geospatial data characteristics and an interaction relationship based on their roles in analytical models. Furthermore, a reasoning method is adopted to qualitatively and quantitatively indicate associations based on HIN and similarity calculation. Thus, dataset evaluation indices are defined and calculated based on these relationships. Through this index, the advantageous information selection method is adopted for choosing the best subset. As illustrated in the case study, this approach effectively contributes to the discovery of reliable and high-quality datasets for the analytical model. The results cover all the needs of the dataset, and users do not need to manually choose and combine datasets based on their experience and knowledge because all this knowledge is transformed into semantic relationships and used in the selection process.
Threshold value or weight parameters appear to play important roles in the assessments considered in this research, and the values of these parameters often vary with the task. Further work will employ data mining methods to adjust the parameters based on historical case data.

Author Contributions

All of the authors contributed concepts and participated in discussing and writing the manuscript. Q.Z., Y.D. and J.Z. conceived and designed the case study. J.Z. performed the experiments and wrote the paper. M.L., Y.L. and S.M. revised the paper; B.F., W.Y. and H.H. prepared and tested the datasets.

Funding

This research was supported by the National Key Research and Development Program of China (Grant No. 2016YFC0803105), the National Natural Science Foundation of China (Grant No. 41501421), the Smart Guangzhou Spatio-temporal Information Cloud Platform Construction (Grant No. GZIT2016-A5-147). Research and Development Program of Sichuan Province (Grant No. 2018SZ0339).

Conflicts of Interest

The authors declare no conflict of interest.

References

  1. Kryvasheyeu, Y.; Chen, H.; Obradovich, N.; Moro, E.; Van Hentenryck, P.; Fowler, J.; Cebrian, M. Rapid assessment of disaster damage using social media activity. Sci. Adv. 2016, 2, e1500779. [Google Scholar] [CrossRef] [PubMed] [Green Version]
  2. Qiu, L.Y.; Zhu, Q.; Gu, J.Y.; Du, Z.Q. A task-driven disaster data link approach. Int. Arch. Photogram. Remote Sens. Spat. Inf. Sci. 2015, 40, 179–186. [Google Scholar] [CrossRef]
  3. Velev, D.; Zlateva, P. Current state of enterprise 2.0 knowledge management. Int. J. Trade Econ. Financ. 2012, 39, 245–250. [Google Scholar] [CrossRef]
  4. Tsai, F.; Hwang, J.H.; Chen, L.C.; Lin, T.H. Post-disaster assessment of landslides in southern Taiwan after 2009 Typhoon Morakot using remote sensing and spatial analysis. Nat. Hazards Earth Syst. Sci. 2010, 10, 2179–2190. [Google Scholar] [CrossRef] [Green Version]
  5. Hayashi, H.; Asahara, A.; Sugaya, N.; Ogawa, Y.; Tomita, H. Spatio-temporal similarity search method for disaster estimation. In Proceedings of the 2015 IEEE International Conference on Big Data (Big Data), Santa Clara, CA, USA, 29 October–1 November 2015; Hayashi, H., Asahara, A., Sugaya, N., Ogawa, Y., Tomita, H., Eds.; IEEE: Washington, DC, USA, 2014. [Google Scholar]
  6. Alizadeh, M.; Ngah, I.; Hashim, M.; Pradhan, B.; Pour, B.A. A Hybrid Analytic Network Process and Artificial Neural Network (ANP-ANN) model for urban Earthquake vulnerability assessment. Remote Sens. 2018, 10, 975. [Google Scholar] [CrossRef]
  7. Alizadeh, M.; Alizadeh, E.; Kotenaee, S.A.; Shahabi, H.; Pour, B.A.; Panahi, M.; Bin Ahmad, B.; Saro, L. Social vulnerability assessment using artificial neural network (ANN) model for earthquake hazard in Tabriz city, Iran. Sustainability 2018, 10, 3376. [Google Scholar] [CrossRef]
  8. Alizadeh, M.; Hashim, M.; Alizadeh, E.; Shahabi, H.; Karami, M.R.; Pour, A.B.; Paradhan, B.; Zabihi, H. Multi-criteria decision making (MCDM) model for seismic vulnerability assessment (SVA) of urban residential buildings. Isprs Int. J. Geo-Inf. 2018, 7, 444. [Google Scholar] [CrossRef]
  9. Guillera-Arroita, G.; Lahoz-Monfort, J.J.; Elith, J.; Gordon, A.; Kujala, H.; Lentini, P.E.; McCarthy, M.A.; Tingley, R.; Wintle, B.A. Is my species distribution model fit for purpose? Matching data and models to applications. Glob. Ecol. Biogeogr. 2015, 24, 276–292. [Google Scholar] [CrossRef] [Green Version]
  10. Tarboton, D.G.; Idaszak, R.; Horsburgh, J.S.; Heard, J.; Ames, D.; Goodall, J.L.; Band, L.; Merwade, V.; Couch, A.; Arrigo, J.; et al. HydroShare: Advancing collaboration through hydrologic data and model sharing. In Proceedings of the 7th International Congress on Environmental Modelling and Software: Bold Visions for Environmental Modeling, iEMSs 2014, San Diego, CA, USA, 15–19 June 2014; Tarboton, D.G., Idaszak, R., Horsburgh, J.S., Heard, J., Ames, D., Goodall, J.L., Band, L., Merwade, V., Couch, A., Arrigo, J., et al., Eds.; International Environmental Modelling and Software Society: San Diego, CA, USA, 2014. [Google Scholar]
  11. Zhu, Y.; Zhu, A.X.; Feng, M.; Song, J.; Zhao, H.; Yang, J.; Zhang, Q.; Sun, K.; Zhang, J.; Yao, L. A similarity-based automatic data recommendation approach for geographic models. Int. J. Geogr. Inf. Sci. 2017, 31, 1403–1424. [Google Scholar] [CrossRef]
  12. Goodchild, M.F.; Glennon, J.A. Crowdsourcing geographic information for disaster response: A research frontier. Int. J. Digit. Earth. 2010, 3, 231–241. [Google Scholar] [CrossRef]
  13. Pu, C.; Kitsuregawa, M. Big Data and Disaster Management: A Report from the JST/NSF Joint Workshop; Georgia Institute of Technology, CERCS: Atlanta, GA, USA, 2013. [Google Scholar]
  14. Guo, H.; Wang, L.; Chen, F.; Liang, D. Scientific big data and digital earth. Chin. Sci. Bull. 2014, 59, 5066–5073. [Google Scholar] [CrossRef]
  15. Hashim, M.; Misbari, S.; Pour, B.A. Landslide mapping and assessment by integrating Landsat-8, PALSAR-2 and GIS techniques: A case study from Kelantan state, peninsular Malysia. J. Indian Soc. Remote Sens. 2018, 46, 233–248. [Google Scholar] [CrossRef]
  16. Pour, B.A.; Hashim, M. Application of Landsat-8 and ALOS-2 data for structural and landslide hazard mapping in Kelantan, Malaysia. Nat. Hazards Earth Syst. Sci. 2018, 17, 1285–1303. [Google Scholar] [CrossRef]
  17. Hu, Y. Geospatial semantics. In Comprehensive Geographic Information Systems, also Included in Elsevier’s Reference Module in Earth Systems and Environmental Sciences; Huang, B., Cova, T.J., Tsou, M., Eds.; Elsevier: Oxford, UK, 2017; pp. 80–94. [Google Scholar]
  18. Li, J.; Zlatanova, S.; Fabbri, A.G. Geomatics Solutions for Disaster Management; Springer: New York, NY, USA, 2007. [Google Scholar]
  19. Fernández, M.; Cantador, I.; López, V.; Vallet, D.; Castells, P.; Motta, E. Semantically enhanced information retrieval: An ontology-based approach. J. Web Semant. 2011, 9, 434–452. [Google Scholar] [CrossRef]
  20. Hristidis, V.; Chen, S.-C.; Li, T.; Luis, S.; Deng, Y. Survey of data management and analysis in disaster situations. J. Syst. Softw. 2010, 83, 1701–1714. [Google Scholar] [CrossRef]
  21. Wiegand, N.; García, C. A task-based ontology approach to automate geospatial data retrieval. Trans. GIS 2007, 11, 355–376. [Google Scholar] [CrossRef]
  22. Wu, Y.; Zhong, Z.; Xiong, W.; Jing, N. Geo-Link: Correlations of heterogeneous geo-spatial entities. Arab. J. Sci. Eng. 2014, 39, 8811–8824. [Google Scholar] [CrossRef]
  23. Fan, Z.; Zlatanova, S. Exploring ontologies for semantic interoperability of data in emergency response. Appl. Geomat. 2011, 3, 109–122. [Google Scholar] [CrossRef]
  24. Qiu, L.; Du, Z.; Zhu, Q.; Fan, Y. An integrated flood management system based on linking environmental models and disaster-related data. Environ. Model. Softw. 2017, 91, 111–126. [Google Scholar] [CrossRef]
  25. Schulz, A.; Döweling, S.; Probst, F. Integrating process modeling and linked open data to improve decision making in disaster management. In International Reports on Socio-Informatics (IRSI), Proceedings of the CSCW 2012 Workshop on Collaboration and Crisis Informatics, Seattle, WA, USA, 11–15 February 2012; Pipek, V., Landgren, J., Palen, L., Eds.; International Institute for Socio-Informatics: Bonn, Germany, 2012. [Google Scholar]
  26. Silva, T.; Wuwongse, V.; Sharma, H.N. Disaster mitigation and preparedness using linked open data. J. Ambient Intell. Hum. Comput. 2012, 4, 591–602. [Google Scholar] [CrossRef]
  27. Janowicz, K.; Raubal, M.; Kuhn, W. The semantics of similarity in geographic information retrieval. J. Spat. Inf. Sci. 2011, 2, 29–57. [Google Scholar] [CrossRef]
  28. Sun, S.; Wang, L.; Ranjan, R.; Wu, A. Semantic analysis and retrieval of spatial data based on the uncertain ontology model in digital earth. Int. J. Digit. Earth 2015, 8, 3–16. [Google Scholar] [CrossRef]
  29. Zhu, Y.; Zhu, A.X.; Song, J.; Yang, J.; Feng, M.; Sun, K.; Zhang, J.; Hou, Z.; Zhao, H. Multidimensional and quantitative interlinking approach for linked geospatial data. Int. J. Digit. Earth 2017, 10, 923–943. [Google Scholar] [CrossRef]
  30. Guyon, I.; Elisseeff, A.; Kaelbling, L.P. An introduction to variable and feature selection. J. Mach. Learn. Res. 2003, 3, 1157–1182. [Google Scholar] [CrossRef]
  31. Tang, J.; Alelyani, S.; Liu, H. Feature selection for classification: A review. In Data Classification: Algorithms and Applications; Aggarwal, C., Ed.; CRC Press: Boca Raton, FL, USA, 2014; pp. 37–64. [Google Scholar]
  32. Bolón-Canedo, V.; Sánchez-Maroño, N.; Alonso-Betanzos, A. Recent advances and emerging challenges of feature selection in the context of big data. Knowl. Based Syst. 2015, 86, 33–45. [Google Scholar] [CrossRef]
  33. Li, J.; Cheng, K.; Wang, S.; Morstatter, F.; Trevino, R.P.; Tang, J.; Liu, H. Feature selection. ACM Comput. Surv. 2016, 50, 1–45. [Google Scholar] [CrossRef]
  34. Peng, H.; Long, F.; Ding, C. Feature selection based on mutual information: Criteria of max-dependency, max-relevance, and min-redundancy. IEEE Trans. Pattern Anal. Mach. Intell. 2005, 27, 1226–1238. [Google Scholar] [CrossRef] [PubMed]
  35. Ramírez-Gallego, S.; Lastra, I.; Martínez-Rego, D.; Bolón-Canedo, V.; Benítez, J.M.; Herrera, F.; Alonso-Betanzos, A. Fast-mRMR: Fast minimum redundancy maximum relevance algorithm for high-dimensional big data. Int. J. Intell. Syst. 2016, 32, 134–152. [Google Scholar] [CrossRef]
  36. Jovic, A.; Brkic, K.; Bogunovic, N. A review of feature selection methods with applications. In Proceedings of the 2015 38th International Convention on Information and Communication Technology, Electronics and Microelectronics (MIPRO), Opatija, Croatia, 25–29 May 2015; Jovic, A., Brkic, K., Bogunovic, N., Eds.; IEEE: Opatija, Croatia, 2015. [Google Scholar]
  37. Yang, Q.; Shao, J.; Scholz, M.; Plant, C. Feature selection methods for characterizing and classifying adaptive sustainable flood retention basins. Water Res. 2011, 45, 993–1004. [Google Scholar] [CrossRef]
  38. Chen, Z.; Wu, C.; Zhang, Y.; Huang, Z.; Ran, B.; Zhong, M.; Lyu, N. Feature selection with redundancy-complementariness dispersion. Knowl. Based Syst. 2015, 89, 203–217. [Google Scholar] [CrossRef] [Green Version]
  39. Zeng, Z.; Zhang, H.; Zhang, R.; Yin, C. A novel feature selection method considering feature interaction. Pattern Recognit. 2015, 48, 2656–2666. [Google Scholar] [CrossRef]
  40. Bratasanu, D.; Nedelcu, I.; Datcu, M. Bridging the semantic gap for satellite image annotation and automatic mapping applications. IEEE J. Sel. Top. Appl. Earth Obs. Remote Sens. 2011, 4, 193–204. [Google Scholar] [CrossRef]
  41. Liu, X.; He, J.; Yao, Y.; Zhang, J.; Liang, H.; Wang, H.; Hong, Y. Classifying urban land use by integrating remote sensing and social media data. Int. J. Geogr. Inf. Sci. 2017, 31, 1675–1696. [Google Scholar] [CrossRef]
  42. Atkinson, P.M.; Aplin, P. Spatial variation in land cover and choice of spatial resolution for remote sensing. Int. J. Remote Sens. 2004, 25, 3687–3702. [Google Scholar] [CrossRef]
  43. Li, M.; Zhu, X.; Guo, W.; Yue, P.; Fan, Y. A case-based reasoning approach for task-driven remote sensing image discovery under spatial–temporal constraints. IEEE J. Sel. Top. Appl. Earth Obs. Remote Sens. 2016, 9, 454–466. [Google Scholar] [CrossRef]
  44. de Albuquerque, J.P.; Herfort, B.; Brenning, A.; Zipf, A. A geographic approach for combining social media and authoritative data towards identifying useful information for disaster management. Int. J. Geogr. Inf. Sci. 2015, 29, 667–689. [Google Scholar] [CrossRef]
  45. Rosser, J.F.; Leibovici, D.G.; Jackson, M.J. Rapid flood inundation mapping using social media, remote sensing and topographic data. Nat. Hazards 2017, 87, 103–120. [Google Scholar] [CrossRef] [Green Version]
  46. Jia, X.; Tinghua, A.; Peng, Z.; Wang, G. The LOD representation and proximity measurement of semantic about geographic information. Geomat. Inf. Sci. Wuhan Univ. 2016, 41, 1299–1306. [Google Scholar]
  47. Resnik, P. Semantic similarity in a taxonomy: An information-based measure and its application to problems of ambiguity in natural language. J. Artif. Intell. Res. 1999, 11, 95–130. [Google Scholar] [CrossRef]
  48. Rodríguez, M.A.; Egenhofer, M.J. Comparing geospatial entity classes: An asymmetric and context-dependent similarity measure. Int. J. Geogr. Inf. Sci. 2004, 18, 229–256. [Google Scholar] [CrossRef]
  49. Kim, J.; Vasardani, M.; Winter, S. Similarity matching for integrating spatial information extracted from place descriptions. Int. J. Geogr. Inf. Sci. 2017, 31, 56–80. [Google Scholar] [CrossRef]
  50. Sun, Y.; Han, J. Mining heterogeneous information networks: Principles and methodologies. Synth. Lect. Data Min. Knowl. Discov. 2012, 3, 1–159. [Google Scholar] [CrossRef]
  51. Shi, C.; Li, Y.; Zhang, J.; Sun, Y.; Yu, P.S. A survey of heterogeneous information network analysis. IEEE Trans. Knowl. Data Eng. 2015, 29, 17–37. [Google Scholar] [CrossRef]
  52. Sun, Y.; Han, J.; Yan, X.; Yu, P.S.; Wu, T. Pathsim: Meta path-based top-k similarity search in heterogeneous information networks. Proc. Vldb Endow. 2011, 4, 992–1003. [Google Scholar]
  53. Fan, X.; Xu, Q.; Scaringi, G.; Dai, L.; Li, W.; Dong, X.; Zhu, X.; Pei, X.; Dai, K.; Havenith, H.B. Failure mechanism and kinematics of the deadly June 24th 2017 Xinmo landslide, Maoxian, Sichuan, China. Landslides 2017, 14, 2129–2146. [Google Scholar] [CrossRef]
  54. Chen, K.T.; Wu, J.H. Simulating the failure process of the Xinmo landslide using discontinuous deformation analysis. Eng. Geol. 2018, 239, 269–281. [Google Scholar] [CrossRef]
Figure 1. Computational framework of semantics-constrained advantageous information selection.
Ijgi 08 00068 g001
Figure 2. Flowchart of advantageous information selection from the original datasets.
Ijgi 08 00068 g002
Figure 3. Relationship discovery based on heterogeneous information networks (HINs).
Ijgi 08 00068 g003
Figure 4. Case study area: a landslide in Diexi Town, Mao County.
Ijgi 08 00068 g004
Figure 5. Flowchart of advantage information selection from the original datasets.
Ijgi 08 00068 g005
Table 1. Data selection results of the proposed method.
No.Data Title/DescriptionSpatiotemporal SimilarityScale SimilarityAttribute SimilarityCorresponding VariablesRelevance
12017.6.25 Diexi Town, Mao County landslide interpretation results. 1:5001.00011.000D91.0000
22017.6.25 Diexi Town, Mao County landslide UAV optical images 0.1 m1.00011.000D21.0000
32017.6.24 Gaofen-3 satellite radar image 1 m1.0000.8750.500null0.7917
42017.4.8 Gaofen-2 satellite optical image 1 m0.5900.8750.750D3,D40.7383
52016.12 Gaofen-2 satellite optical image 1 m0.4300.8750.750D40.6850
6Multimedia datasets1.0000.8750.000D80.6250
72017.6.24 Diexi Town, Mao County landslide UAV optical images 0.1 m0.40011.000D3,D40.6000
82017.6.24 Diexi Town, Mao County landslide interpretation results. 1:5000.40011.000D90.6000
92017.5.31 ZY-3 satellite optical image 2.1 m0.7290.1250.750D3,D40.5347
102017.5.16 ZY-3 satellite optical image 2.1 m0.6560.1250.750D3,D40.5103
112014.11.1 Diexi Town, Mao County DLG 1:100000.2540.1250.667D5,D70.3486
122015.1 Diexi Town, Mao County DLG 1:50000 0.2540.1250.667D5,D70.3486
132014.12 Diexi Town, Mao County DLG 1:500000.2060.1250.667D5,D70.3326
142013 Diexi Town, Mao County DLG 1:500000.1850.1250.667D5,D70.3256
152011 Diexi Town, Mao County DLG 1:500000.1190.1250.667D5,D70.3036
162015.12 Mao County DLG00.8750.333D5,D70.1111
172014.8 Mao County DLG010.333D5,D70.1111
Results: selected items (Nos. 1, 4, 5, 6, and 11), irrelevant items (Nos. 3, 16, and 17), and redundant items (others).
Table 2. Evaluation of selection methods.
Query MethodResult NumberRelevant NumberRedundant NumberIrrelevant NumberRecallPrecision
Relevance-based0.7431140%75%
0.51095180%40%
0.3151481100%33%
Keyword-based151293100%33%
Semantics-constrained
(proposed method)
5500100%100%

