Article

A Volunteered Geographic Information Framework to Enable Bottom-Up Disaster Management Platforms

by
Mohammad Ebrahim Poorazizi
1,*,
Andrew J.S. Hunter
1,† and
Stefan Steiniger
2,†
1
Department of Geomatics Engineering, University of Calgary, 2500 University Drive NW, Calgary, AB T2N 1N4, Canada
2
Departamento de Ingeniería Transporte y Logística, Pontificia Universidad Católica de Chile, Avda. Vicuña Mackenna 4860, Macul, Santiago, Chile
*
Author to whom correspondence should be addressed.
These authors contributed equally to this work.
ISPRS Int. J. Geo-Inf. 2015, 4(3), 1389-1422; https://doi.org/10.3390/ijgi4031389
Submission received: 11 February 2015 / Revised: 21 May 2015 / Accepted: 31 July 2015 / Published: 13 August 2015
(This article belongs to the Special Issue Open Geospatial Science and Applications)

Abstract

:
Recent disasters, such as the 2010 Haiti earthquake, have drawn attention to the potential role of citizens as active information producers. By using location-aware devices such as smartphones to collect geographic information in the form of geo-tagged text, photos, or videos, and sharing this information through online social media, such as Twitter, citizens create Volunteered Geographic Information (VGI). To effectively use this information for disaster management, we developed a VGI framework for the discovery of VGI. This framework consists of four components: (i) a VGI brokering module to provide a standard service interface to retrieve VGI from multiple resources based on spatial, temporal, and semantic parameters; (ii) a VGI quality control component, which employs semantic filtering and cross-referencing techniques to evaluate VGI; (iii) a VGI publisher module, which uses a service-based delivery mechanism to disseminate VGI, and (iv) a VGI discovery component to locate, browse, and query metadata about available VGI datasets. In a case study we employed a FOSS (Free and Open Source Software) strategy, open standards/specifications, and free/open data to show the utility of the framework. We demonstrate that the framework can facilitate data discovery for disaster management. The addition of quality metrics and a single aggregated source of relevant crisis VGI will allow users to make informed policy choices that could save lives, meet basic humanitarian needs earlier, and perhaps limit environmental and economic damage.

1. Introduction

Sharing up-to-date and accurate information is an effective strategy for improving disaster management activities [1]. Information sharing plays an important role in raising situational awareness, delivering assistance to those affected by the crisis, and aiding in the development of mitigation plans [2,3]. Disaster management platforms have the potential to foster that strategy by providing (online) tools that allow the collection, analysis, and distribution of spatial, temporal, and thematic information. Such platforms should be able to handle incoming crisis data, visualize information, and develop future scenarios, which, ideally, help mitigate further negative disaster effects [4]. As such, these systems have the potential to minimize destruction, economic loss, and death that might otherwise result from a disaster event. For example, Ushahidi (http://www.ushahidi.com/) has been used extensively to help people find and use critical emergency information in different situations, from political crises [5] to natural disasters [6].
To create such platforms, some data management challenges need to be addressed. For example, an emergency situation can change rapidly during a disaster event due to the occurrence of post-disaster incidents (e.g., power outages, road and bridge closures, etc.) and the progress of disaster response operations (e.g., deployment of emergency crews). Hence, these systems should be able to regularly, if not continuously, collect and share up-to-date crisis information from different resources. Such information should include (real-time) citizen-generated data delivered by Web 2.0 services (i.e., social networking websites) from people who are reporting from/about difficult situations, since there is limited time to update formal data repositories [7]. The creation of geographic information by the public using Web 2.0-enabled collaborative methods has been labelled Volunteered Geographic Information (VGI) [8].
Although there are several successful examples of VGI used for emergency response [9], there is still a lack of efficient interoperable mechanisms for discovery, access, and use of VGI by disaster management platforms. For instance, Web 2.0 services provide access to VGI through different application programming interfaces (APIs) and data encodings. This can make data access and retrieval difficult for client applications because they need to implement different APIs and understand specific data encodings to be able to access and retrieve data from various Web 2.0 services [10]. Moreover, these platforms should be able to integrate heterogeneous (geospatial) data of different type and quality from different resources, for example, VGI data from Web 2.0 services and authoritative data from spatial data infrastructures (SDIs). The integration and use of VGI data together with existing authoritative data requires quality control tools to better understand the uncertainty and completeness of VGI datasets. It also requires standardization mechanisms to overcome heterogeneity in data description and data formats. A further point is that it is difficult to verify volunteer-provided information from a particular source. Triangulating, i.e., crosschecking, multiple VGI sources may lead to results with a higher level of credibility and confidence [11].
The main goal of this paper is to present a framework for the effective use of user-generated content in disaster management platforms to enable bottom-up data creation and distribution approaches. This, in turn, will support integration of authoritative SDI data and VGI. We first analyze the current state of disaster management platforms and evaluate data-related challenges from a technical perspective. We then develop a framework for the discovery and use of VGI in disaster management platforms that consists of four components: (i) a VGI brokering module to provide a standard service interface to retrieve VGI from multiple resources based on spatial, temporal, and quality search parameters; (ii) a VGI quality control component to evaluate the spatiotemporal relevance and credibility of VGI; (iii) a VGI publisher module, which uses a service-based delivery mechanism to disseminate VGI; and (iv) a VGI discovery component, which acts as a catalog service to find, browse, and query metadata about available VGI datasets. A first set of quality metrics that may be used for VGI evaluation is suggested. Then we present the technical architecture of a prototype implementation and test this prototype with social media data collected during Typhoon Hagupit (i.e., Typhoon Ruby), which hit the Philippines during December 2014. Finally, we evaluate and discuss the prototype with respect to technical attributes, such as platform flexibility and portability, and the preliminary set of quality metrics with respect to the case studies’ social media data.

2. Previous Works

Information and communication infrastructure components are the building blocks of disaster management systems. Many systems have been developed over the past decade—moving from traditional telephone-, radio-, and television-based systems towards modern web-based platforms [11]. In the early 2000s, disasters, such as the terrorist attacks of 9/11 and Hurricane Katrina in the US, demonstrated that traditional disaster management systems are limited in their ability to meet community-wide information sharing and communication needs of all stakeholders, e.g., jurisdictional authorities, emergency respondents, and citizens [12]. Compared to the Internet, the amount of information published by telephone, radio, or television is limited, and the systems focus on one-direction information flow. This limits the level of interaction possible [13]. Hence, there is a need for platforms that can provide many-to-many communication and offer effective information sharing mechanisms that facilitate rather than impede disaster management.
Over the past decade, different approaches to the design and development of disaster management systems have been investigated. We can group these works into three generations: the first generation covers systems that were designed based on SDI principles [14]. A spatial data infrastructure [15] presents a promising framework to facilitate and coordinate the exchange and sharing of spatial data in disaster management systems, resulting in improved quality of decision-making and increased efficiency of disaster management activities [1,16,17,18]. Several implementations of SDI frameworks for disaster management have been tested in different case studies, such as (1-i) evacuation scenarios after a bomb threat [19], (1-ii) wild fire risk assessment [20], and a flood alert system [21]. See Table 1 for a technical description of these systems.
Table 1. A comparison of web-based disaster management platforms.
Generation 1Generation 2Generation 3
1-i1-ii1-iii2-i2-ii2-iii3-i3-ii
Weiser & Zipf [19]Mazzetti et al. [20]Agosto et al. [21]Okolloh [5]De Longueville et al. [22]Zook et al. [6]Díaz et al. [23]Schade et al. [24]
Enabling InfrastructureCommunication Networks and ProtocolsHTTPHTTPHTTPHTTP, SMSHTTP, Social mediaHTTP, SMSHTTPHTTP, Social media
System Architectures 1Client-serverSOAClient-serverClient-serverClient-serverClient-serverSOAClient-server
Computing Platforms 2Local/CloudGridGridCloudLocalLocal/CloudLocal/CloudLocal/Cloud
Standards 3W3C, OGCW3C, OGCW3C, OGCW3C W3C W3C W3C, OGCW3C, OGC
Data FrameworksAuthoritative dataAuthoritative dataAuthoritative dataVGIVGIAuthoritative data, VGIAuthoritative data, VGIAuthoritative data, VGI
FunctionDiscovery and Access 4Service-based discovery and accessService-based accessService-based accessAd hoc discoveryAd hoc discoveryAd hoc discovery and accessService-based discovery, accessService-based discovery, access
Quality ControlNoYes (QoS)NoYes (manually)NoYes (manually)NoYes (spatiotemporal validation)
Dissemination 4Service-based disseminationService-based disseminationService-based disseminationAd hoc disseminationAd hoc disseminationAd hoc disseminationService-based disseminationService-based dissemination
1 System Architectures: “Client-server” refers to a traditional distributed architecture where a service requester (i.e., client) and a service provider (i.e., server) work together to accomplish a task in a tightly coupled, ad hoc manner. In SOA, a service is the basic computing unit (independent from service requesters or clients) developed based on a set of communication and data exchange standards. This promotes interoperability, loose coupling, and reusability of the system components [25]. 2 Computing Platforms: Depending on the case study requirements, the platform can be deployed on a “local” or “cloud”-computing environment. Thereby, “cloud” refers to a large-scale infrastructure that delivers on-demand, dynamically scalable resources to external consumers over the Internet [26]. “Grid” platforms” indicates a distributed system that consists of a collection of (pre-reserved) computer resources (e.g., computing power and storage) working together to reach a common goal. 3 The category “Standards” focuses on open IT standards for web services (also known as W3C services) and open geospatial standards for geospatial web services (also known as OGC services).4 Service-based vs. Ad hoc: the use of “service-based” access methods requires the definition of communication procedures and vocabulary, i.e., standards. Subsequently we use the term “ad hoc” to refer to non-standards-based communication.
Although SDIs facilitate data sharing and management, SDI implementation follows a top-down approach that does not consider that non-institutional users might contribute data in a participatory fashion [27]. This leads to a provide-consume paradigm, where only official data providers such as national mapping or environmental agencies are permitted to collect, deploy, and maintain resources [23]. Moreover, official data providers have strict update and release cycles that may hinder access to timely information, especially during a disaster. For example, in Haiti, although GIS (Geographic Information System) databases were available, they lacked critical up-to-date post-earthquake information that complicated rescue and recovery efforts in the first days following the earthquake. In the Haiti case, high-quality satellite images of post-earthquake Haiti were collected and made freely available within 24 hours of the disaster by commercial geospatial content providers like DigitalGlobe. However, as reported by Zook et al. [6], there was still a need to process the images to extract useful information (e.g., tracing roads and buildings) and perform required analyses (e.g., damage assessment analysis). SDI-based platforms also tend to use a complex deployment mechanism, which can impede citizens' participation during data collection and resource deployment [23]. However, during the Haiti event, a volunteer community was able to quickly build an information infrastructure that permitted collaborative data collection and distribution by using free and open source tools and services such as OpenStreetMap (http://www.openstreetmap.org/) and Ushahidi. The approach placed appropriate tools in the hands of a concerned public who were able to increase situational awareness that ultimately facilitated emergency response activities [6].
The 2010 Haiti earthquake has highlighted the role that the Internet can have in a participatory environment [6], in which people not only consume content, but also produce new content [28]. The idea of “citizens as sensors” [8] underscores the potential that citizens have to be active information producers who can provide timely and cost-effective information (i.e., VGI) in support of disaster management activities [8,29]. In addition, local people often have a greater awareness of what is happening on the ground during a disaster than do traditional authoritative data collectors. This local knowledge should be used to complement authoritative scientific knowledge [30]. Subsequently, the second generation of disaster management platforms places VGI at the center of the management system.
The use of VGI in disaster management has four main benefits: (i) it significantly decreases the time required to collect crisis information [3]; (ii) it often has comparable accuracy to authoritative sources [31]; (iii) its update and refresh rates are generally very rapid, especially for the affected area [32]; and (iv) as the data is open and freely accessible, different crisis management platforms from, perhaps, different organizations can discover, process, and publish them without restrictions [11]. Several research works have reported the successful use of VGI-centric platforms in events such as (2-i) the 2008 post-election violence in Kenya [5], (2-ii) the 2009 forest fire around Marseille, France [22], and (2-iii) the 2010 Haiti earthquake [6].
As outlined by De Longueville et al. [29], VGI is a rich and complementary source of information for SDIs, especially in the context of disaster management. Therefore, the third generation of disaster management systems finally aims to incorporate VGI into SDI. Here, the user’s role in an SDI changes from a passive recipient of data to an active “producer” [33]. In this context, Genovese & Roche [34] discuss the strengths, weaknesses, opportunities, and threats of VGI for improving SDI in the global context of north vs. south (i.e., developed vs. developing countries). Their investigation suggests that although substantial funding has been dedicated to the creation of SDIs in developed countries, there are still issues that hinder VGI-SDI integration. For example, one weakness is the ability of users to understand VGI quality and credibility. Therefore, VGI inclusion in official SDIs may pose a threat to data integrity, and tools for quality evaluations are needed.
Genovese & Roche [34] identify economics to be a limiting factor regarding SDI infrastructure development, particularly in developing countries. They also highlight that SDI map coverage seems to not be uniform: urban areas tend to have more complete coverage than rural areas. To address these drawbacks there may be opportunities to use VGI to fill existing administrative geospatial data holes in SDIs. Works by (3-i) Díaz et al. [23] and (3-ii) Schade et al. [24] discuss the different aspects of integration of VGI with authoritative (official) data under an SDI paradigm.
Table 1 lists prominent web-based disaster management platforms and characterizes them based on their functionality and enabling infrastructure. It is not an exhaustive inventory, since we aim to give a short overview of, in our opinion, notable, recent work.
Enabling infrastructures: In terms of enabling infrastructures, the World Wide Web is the underlying communication channel for all the platforms, although some of them employ additional communication mediums such as SMS and social networking websites (e.g., generation 2 and 3). From a system architecture perspective, most of the online disaster management platforms were developed using a client-server architecture. However, the prototypes developed by Mazzetti et al. [20] and Díaz et al. [23] were implemented based on a service-oriented architecture (SOA).
The use of SOA for online disaster management applications is useful for three reasons. First, SOA supports a “Data as a Service” (DaaS) approach [35], which provides an interoperable solution to access data stored at different locations, as is usually the case with data needed for disaster management. Second, the adoption of SOA leads to an architecture that enables functions to be delivered based on a “Software as a Service” (SaaS) mechanism [36] utilizing common communication standards. This way, disaster data management and analysis functions can be provided for users in different locations with different access levels. It also enables distributed deployment of functionality so that distributed processing can be employed during high-demand times [37]. Third, an SOA-based development approach enables the production of systems that can be adapted to changing requirements and technologies. These are easier to maintain and allow a consistent treatment of data and functionality [38].
In an SOA-based approach, a service design strategy (DaaS and SaaS) is necessary to maintain an appropriate balance between multiple criteria such as flexibility, reusability, and performance [39,40]. To achieve this goal and have services tailored to specific application use cases, it is necessary to consider different architectural design patterns and principles such as the workflow control pattern, the data interaction pattern, and the communication pattern [41]. These patterns control (i) the management and execution of a workflow of services, (ii) the data transfer among services in a workflow or between a client and a service chain, and (iii) the message exchange mechanisms among services or between a client and services (for a detailed discussion, see Poorazizi et al. [25]).
In terms of deployment, most of the platforms reviewed can be deployed on a local-, grid-, or cloud-computing environment (for the differences, see the notes of Table 1). With respect to standard compliance and interoperability, all platforms were developed based on SDI guidelines (e.g., OGC (Open Geospatial Consortium) standards) except for generation 2 systems, which followed W3C-compatible approaches for platform development. Most of the platforms use authoritative data as the main source of information, while some of them support real-time data streams such as VGI.
Platform Functions: All the platforms support discovery of and access to (spatial) data. To do so, most use standard-based approaches, but some adopt non-standard ad hoc methods, for instance, the generation 2 systems. Okolloh’s [5] Ushahidi platform permits users to search and contribute information using Ushahidi’s geoportal component, or by sending mobile phone text messages (SMS). De Longueville et al. [22] utilized Twitter’s API (https://dev.twitter.com/) to search and retrieve crisis-related information (i.e., tweets), and web-crawling scripts to filter and classify the content. Zook et al. [6] described an infrastructure based on free and open source tools and services that was used in the 2010 Haiti earthquake and included OpenStreetMap, Ushahidi, and GeoCommons (http://geocommons.com/) to support emergency response activities. All systems provided a geoportal for volunteers to contribute and report crisis information, while Ushahidi and GeoCommons also fetched data from external resources such as SMS and social networking websites (e.g., Twitter).
There is still a lack of effective, flexible, and interoperable mechanisms for discovery of VGI. For example, recent approaches used spatial, temporal, and textual (e.g., type of disaster) criteria to search and retrieve VGI [10,24,42]. However, data quality is not considered, which, from our perspective, it should be when searching for content on the web. This need emerges, for example, from the existence of spam and biased content [43,44]. Therefore, there is a need to develop a discovery mechanism that considers quality-related parameters when searching for VGI, especially when considering VGI-SDI integration.
Data Quality Assessment: Except for the generation 1 systems, all platforms are capable of handling VGI generated by citizens. However, automated quality control functionality is implemented in only two of eight platforms in Table 1. Poser and Dransch [45] discussed two general approaches to VGI quality assessment: quality-as-accuracy, and quality-as-credibility. The first concept measures the level of similarity between the data produced and the real-world phenomena it describes. This approach is mainly used by data providers [45]. The second concept, often applied in the context of Web 2.0, refers to the credibility of data, especially data generated by (non-expert) users. While accuracy is an objective property, credibility is subjective, and tends to rely on users rating the credibility of other users and the information they contributed [46].
Poser and Dransch [45] propose different quality assessment approaches for different phases of the disaster management cycle, i.e., for mitigation, preparedness, response, and recovery. They suggest using the quality-as-credibility approach in the mitigation and preparedness phases, where there are continuous contributions from citizens. They then propose the use of the quality-as-accuracy approach during the response phase, where there is a need to collect factual information about the crisis to determine its impact. Examples of quality evaluation following either one of the two general approaches are presented by several authors (see Fan, Zipf, Fu, & Neis [47], Bishr & Mantelas [48], Bishr & Kuhn [49], Goodchild & Li [50], Schade et al. [24], De Longueville et al. [22]) and are discussed below.
Fan, Zipf, Fu, & Neis [47] evaluated the quality of building footprint data in OpenStreetMap for Munich, Germany, based on the quality-as-accuracy approach. In their work, they used completeness, semantic accuracy, position accuracy, and shape accuracy as quality evaluation criteria. Based on the quality-as-credibility approach, Bishr & Mantelas [48] and Bishr & Kuhn [49] proposed a trust and reputation model for quality assessment of VGI. They constructed a computational model that considers spatiotemporal context for urban planning [48] and water quality management applications [49].
Another quality assessment approach proposed by Goodchild & Li [50] emphasized the use of procedures to control and enhance quality during the acquisition and compilation of spatial data. This is similar to quality assurance processes used by traditional mapping agencies. The method requires mechanisms to generate quality metrics for data being generated, and mechanisms to evaluate the VGI against authoritative reference sources.
Finally, Schade et al. [24] proposed a cross-validation mechanism to overcome VGI’s credibility challenge. The main idea in their work was to aggregate VGI from multiple sources such as Twitter, Flickr, OpenStreetMap, etc., and process these VGI data to determine their relevance in a given context. Among the validation techniques, k-fold cross-validation is a common approach used for VGI verification and validation [7,51,52].
Additionally, spatiotemporal analysis has been used to evaluate the quality of VGI. For example, De Longueville et al. [22] extracted spatial information from VGI such as contributors’ location and place names to assess the relevance of the content to the 2009 forest fire around Marseille, France. They then performed a temporal analysis to estimate the temporal accuracy of the content compared to the actual event. Ostermann & Spinsanti [53] recommended using spatial analysis to determine the correlation between the spatial information attached to the content (e.g., geo-tagged tweets), extracted from the content (e.g., geocoded place names), and associated with contributors’ profiles (e.g., a user’s location). The information can then be used to rate the content based on the distance from the contributor’s location to the event location and evaluate the credibility of the VGI.
Data Distribution: In terms of VGI dissemination, a number of solutions have been developed, as listed in Table 1. All the SDI-based platforms (generation 1) support standard service-based data dissemination using OGC’s WMS (Web Map Service) [54]. In contrast, VGI-centered generation 2 systems distribute data using ad hoc, i.e., non-standard, approaches, for example, by using an open data format such as JSON. The two generation 3 examples also utilize service-based approaches.
The generation 3 platform by Díaz et al. [23] uses OGC services such as WFS (Web Feature Service) [55], WMS, and WCS (Web Coverage Service) [56] to publish VGI. Although this approach facilitates sharing of user-generated information, it does not cover the temporal dimension of VGI, which is crucial in disaster management activities. This issue is addressed by the other generation 3 platform by Schade et al. [24]. They propose a new approach for VGI data management, called VGI Sensing, which uses OGC’s SWE (Sensor Web Enablement) framework [57] to publish VGI. As a part of OGC’s Interoperability Testbed-10 (OWS-10), Bröring et al. [58] also investigated a framework for integrating VGI into SDI through the use of OGC’s SWE and WFS standards. However, these platforms do not support dissemination of quality information, which is a major concern especially in the context of VGI-SDI integration [59]. While Cornford et al. [60] and Devaraju et al. [61] do suggest how OGC’s SWE framework and the UncertML specification [62] can be used to provide quality information (e.g., uncertainty) about sensor observations, there is currently no interoperable approach for the dissemination of VGI data that addresses the need for integrated data quality assessment tools.
Consequently, our work aims to address the limitations of previously developed web-based disaster management platform with respect to: (i) enabling a hybrid data-sharing paradigm that supports both top-down and bottom-up data creation and distribution approaches; and (ii) a flexible system architecture that supports interoperability and extensibility through standard compliance and modularization.

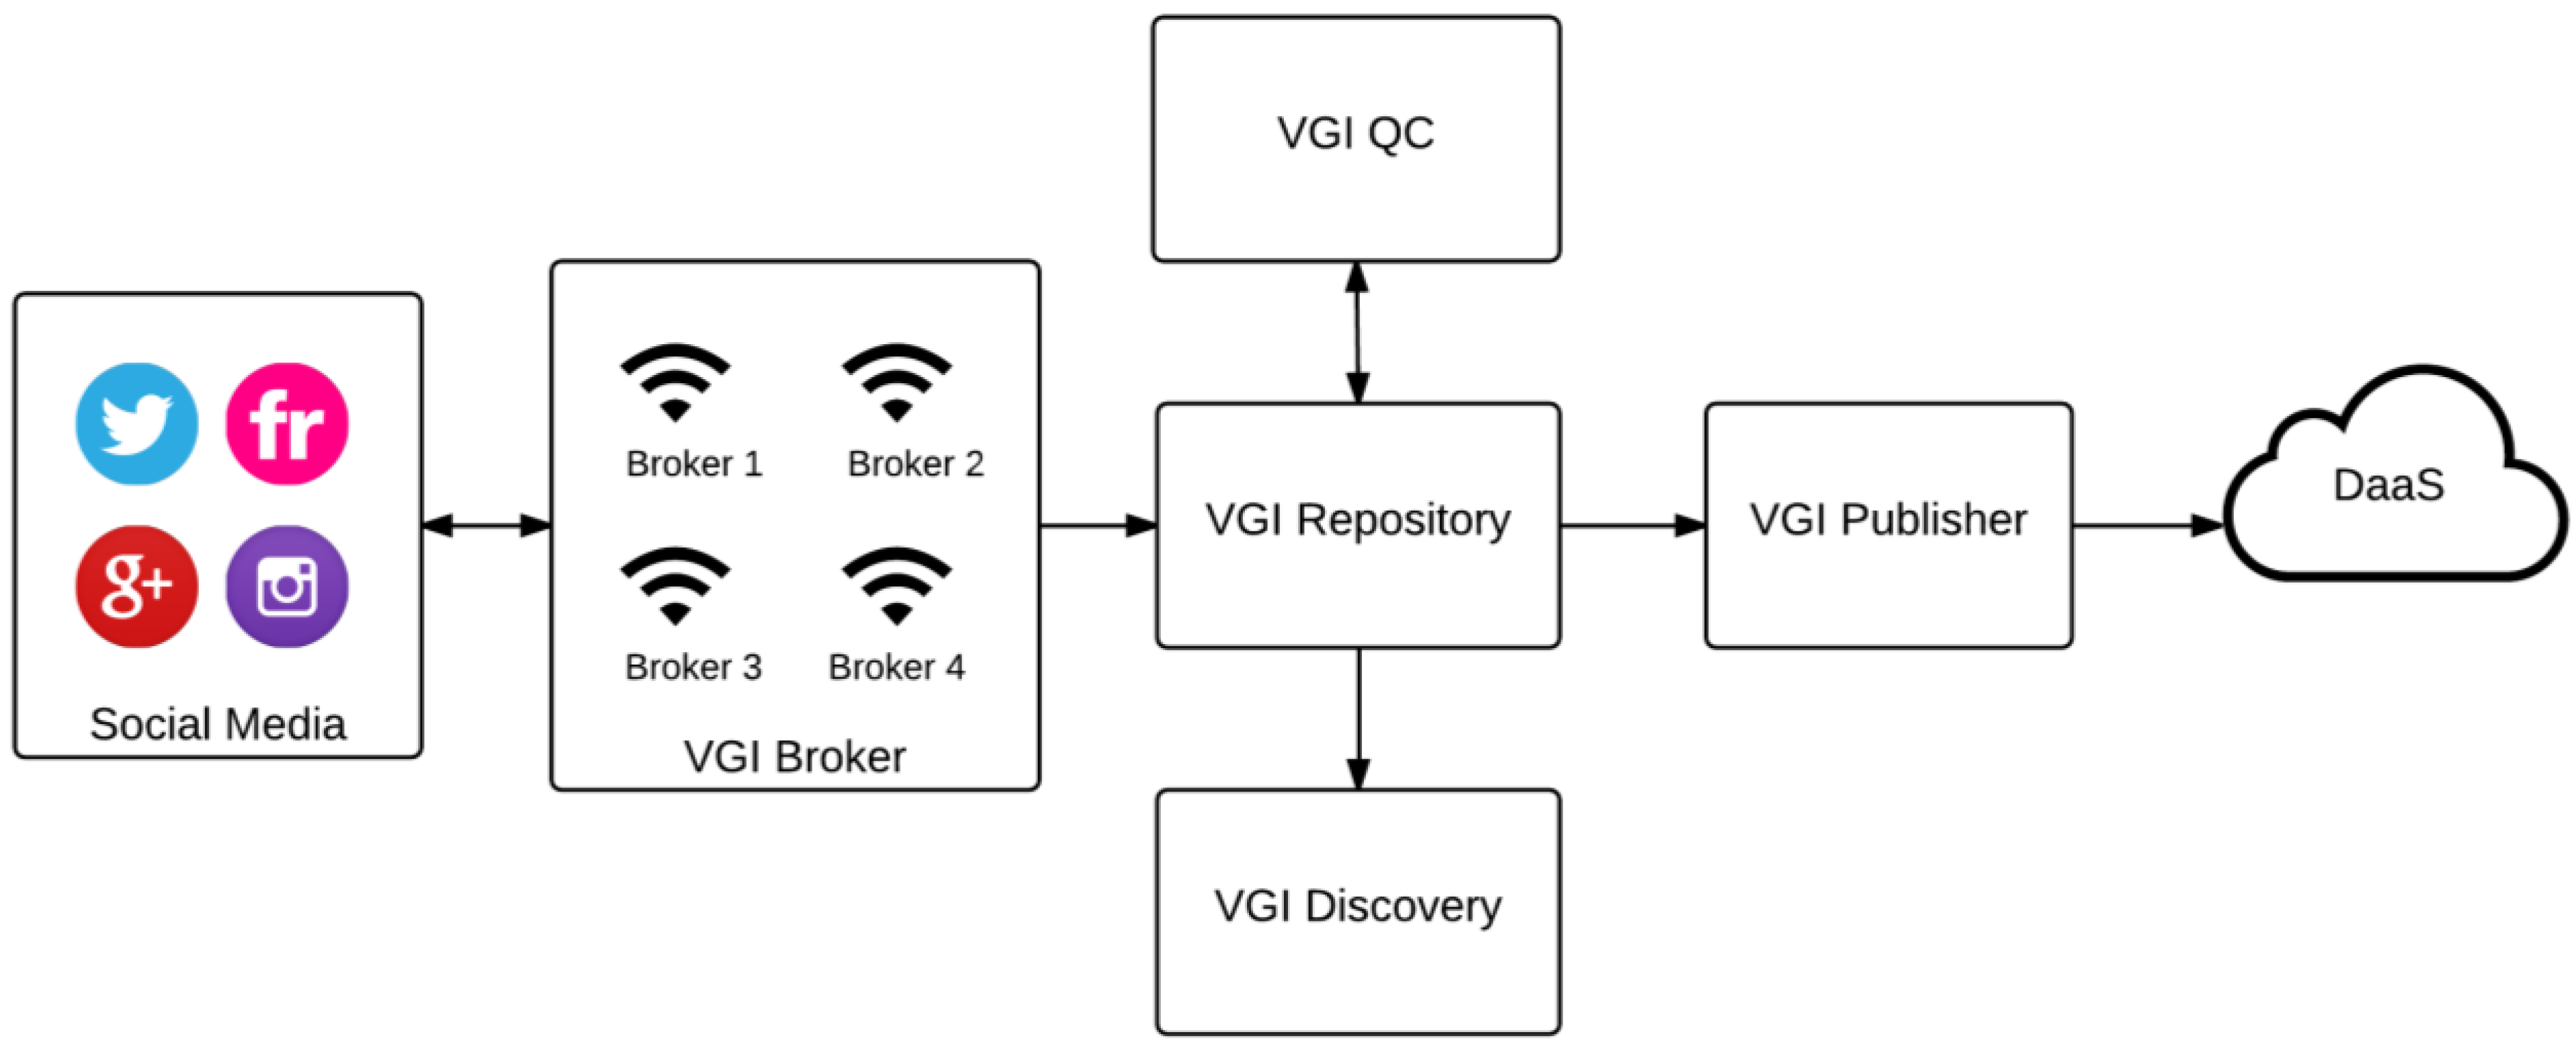
3. The VGI Framework

As described above, our objective is to provide an effective and interoperable approach for VGI discovery, quality control, and dissemination. To guide platform development, we identified a set of platform quality attributes/requirements and business goals [63,64]. The requirements were prioritized according to their importance for disaster management and can be found in graphical form in Appendix. In addition to using the requirements in the framework design process, they were also helpful for the evaluation of the consequences of architectural decisions, and the identification of system architecture limitations/risks [65].
During the framework/platform design phase, first priority was given to the following quality attributes: (a) scalability/extensibility, (b) open systems/standards, and (c) interoperability. These attributes ensure that systems built using the VGI framework will work together efficiently, and that a set of services developed using this framework will be coherent, and at the same time will address legitimate disaster management issues such as crisis information sharing. The secondary design priorities were: (d) performance, (e) flexibility, (f) integrability, (g) security, (h) ease-of-installation, (i) ease-of-use, and (j) portability. These criteria focus on system capability and quality. Furthermore, there are additional low-level priorities, such as (k) distributed development and (l) ease-of-repair, along with a number of quality metrics (see Appendix) that should ideally be satisfied to achieve all business goals. In the following sections, we discuss the conceptual design of the framework, technical architecture, and implementation details.

3.1. Conceptual Design

Figure 1 illustrates the conceptual overview of the VGI framework, which was developed based on the functional and architectural requirements discussed above. The VGI Broker, VGI QC (Quality Control), VGI Discovery, and VGI Publisher are the building blocks of the proposed framework.
Figure 1. A conceptual workflow for discovery, assessment, and dissemination of VGI.
Ijgi 04 01389 g001
The VGI Broker provides a service interface to find and collate user-generated content from various social media platforms. Many social media platforms provide public APIs for clients to interact with them using their specific request-response message system. Although they usually adopt REST (REpresentational State Transfer)-based interfaces and support popular data formats (e.g., JSON or XML), there is no uniform description of service interfaces and data encodings [10]. Hence, the VGI Broker module connects the platform user to different APIs, enabling data retrieval from multiple social media platforms via a single service interface. It translates a single query to multiple API-based queries and handles different request-response data formats. The retrieved data is then stored in the VGI Repository based on the data models designed for each platform (e.g., Twitter, Flickr, etc.).
Having VGI data stored in the repository allows the VGI QC module to perform quality control checks on the data and to generate quality-related metadata that are stored in the VGI Repository. This is a crucial step, especially in the context of disaster management, where VGI can potentially be used along with authoritative data for decision-making. It also enables quality-based data retrieval, which is missing in current social media platforms. The VGI QC module manages the quality control procedures in the proposed framework.
The VGI Publisher module is a data service that disseminates quality-assessed VGI following a DaaS approach. It also allows clients to access and retrieve VGI based on spatiotemporal and quality parameters in an interoperable manner. This means that unlike social media platforms that have different request-response paradigms, the VGI Publisher provides a single interface and a common data encoding for data dissemination.
Finally, the VGI Discovery module acts as a catalog service to discover, browse, and query metadata about the available VGI datasets. It offers quality-based search options to the clients. A search returns a metadata document, which includes information about data such as time, location, and quality, as well as a link to the data itself.

3.2. Quality Evaluation Metrics

Based on the quality assessment approaches presented and discussed above (see [7,29,53,66,67,68]), we have adopted five metrics to evaluate VGI data quality and obtain data quality scores. We note that with this set of metrics we do not strive to define indefectible quality evaluation. Rather, the metrics are used as an initial test set to assess the general functionality of the proposed framework using Typhoon Ruby as a case study (described later).
(1) Positional Nearness: Equation (1) is used to calculate the positional nearness score (PNS), where d is the distance (in kilometers) between each contribution (e.g., a tweet) and the centroid of all contributions (e.g., all tweets) for a given context, which can be calculated as the mean center using Equation (2). We note that there are numerous ways to estimate a centroid, the arithmetic mean, weighted mean, center of minimum distance, center of greatest intensity, etc.; for simplicity, we have used the arithmetic mean for this work as an initial starting point.
( k > d P N S = 1 ) ( k < d P N S = k 1 d )
X ¯ = i = 1 n x i n , Y ¯ = i = 1 n y i n
k is a scalar defined by the standard distance deviation of the set of contributions. Equation (3) is used to calculate the two-dimensional equivalent of a standard distance deviation, where di is the distance between each point i and the mean center, and n is the total number of points. In essence, this model gives greater weight to contributions closer to the center of the set of contributions.
k = i = 1 n ( d i ) 2 n 2
(2) Temporal Nearness: The creation date and time of each contribution (e.g., a tweet) is compared to the event time (or end of the event, if there is a duration) to determine the number of days since the event actually happened ( t ). Equation (4) is used to calculate the temporal nearness score (TNS). As ( t ) increases, TNS decreases.
( t < 1 T N S = 1 ) ( t > 1 T N S = 1 t )
(3) Semantic Similarity: Each contribution (e.g., a tweet) is compared to a pre-defined dictionary of disaster-related words and then Equation (5) is used to calculate the semantic similarity score (SSS), where Ni is the number of dictionary words appearing in a contribution and M is the number of words contained in the dictionary.
S S S = N i M
(4) Cross-referencing: The spatial extent in the form of an axis-parallel minimum-bounding rectangle (MBR) is calculated from all contributions for each social media platform (e.g., the Twitter dataset). Afterwards, the point-in-polygon operation is performed for each contribution (e.g., a tweet) on each social dataset MBR (e.g., the Twitter dataset). Equation (6) is then used to calculate the cross-referencing score (CRS), where Ni is the number of bounding boxes that a contribution falls within and M is the total number of bounding boxes/media streams. We note that spatial extent in terms of social media contributions is a vague concept. We use it here as a measure of nearness. We also note that there are many ways to represent nearness. We have chosen nearness to mean, for simplicity, “something is nearest if it falls within the intersection of all contribution MBRs”.
C R S = N i M
(5) Credibility: A set of credibility factors was defined and the maximum value of each factor within all the contributions (e.g., all the tweets) is calculated for each social media platform (e.g., Twitter) for a particular event (e.g., Typhoon Ruby) (M). For example, the Twitter API allows a client to collect a number of credibility factors for each tweet. They include: verification of the tweeter (a verified Twitter account formally validates the identity of the person or company that owns the account), the tweeter's followers count (the number of followers this account currently has; with more followers, a Twitter account gains more attention, thus increasing its popularity), how many times the tweet has been “favorited” (approximately how many times a tweet has been favorited by Twitter users; favoriting a tweet indicates that a user liked a specific tweet), and the retweet count (number of times this tweet has been retweeted; retweeting means a reposting or forwarding a message on Twitter). Equation (7) (a) is then used to calculate a credibility score for each factor (CSi), where Nij is the value of each factor i for a contribution j and Mi is the maximum value of each factor within all j contributions. The total credibility score (CS) is calculated using Equation (7) (b). n is the number of factors used to assess credibility.
( a ) C S i = N i j M i , ( b ) C S = i = 1 n C S i / n
In our implementation/case study we employ the following credibility factors: for Twitter, (i) verification (of the tweeter); (ii) the tweeter's followers count; (iii) how many times the tweet has been “favorited” and (iv) retweeted. For Flickr we use, as a surrogate for credibility, the number of times that a photo has been “viewed”. For Google Plus we evaluated the number of times a post has been “re-shared”, “replied” to, or “plus-oned” (a “plus-one” or “+1” indicates that a user liked a specific post on Google Plus). For Instagram we assessed how many times a photo/video has been “liked” and “commented” on, in addition to the follower count of an Instagram user.
Quality Score: Finally, the VGI QC module calculates a total quality score (QS) for each contribution (e.g., a tweet), summing individual quality scores (n) calculated for each metric (Equation (8)). Summation is necessary since individual scores can be zero. For instance, the positional nearness score is zero when a contribution is without a spatial reference (i.e., coordinate).
Q S = P N S i + T N S i + S S S i + C R S i + C S i
All quality scores will return values between zero and five, with zero indicating comparatively low quality and five indicating a comparatively high-quality contribution for disaster management.
Quality control is performed as an iterative process and, therefore, quality scores will evolve over time, as more data is added to the VGI Repository. To enable quality-based queries, all the quality scores (i.e., PNS, TNS, SSS, CRS, CS, and QS) for each contribution are stored in the VGI Repository.

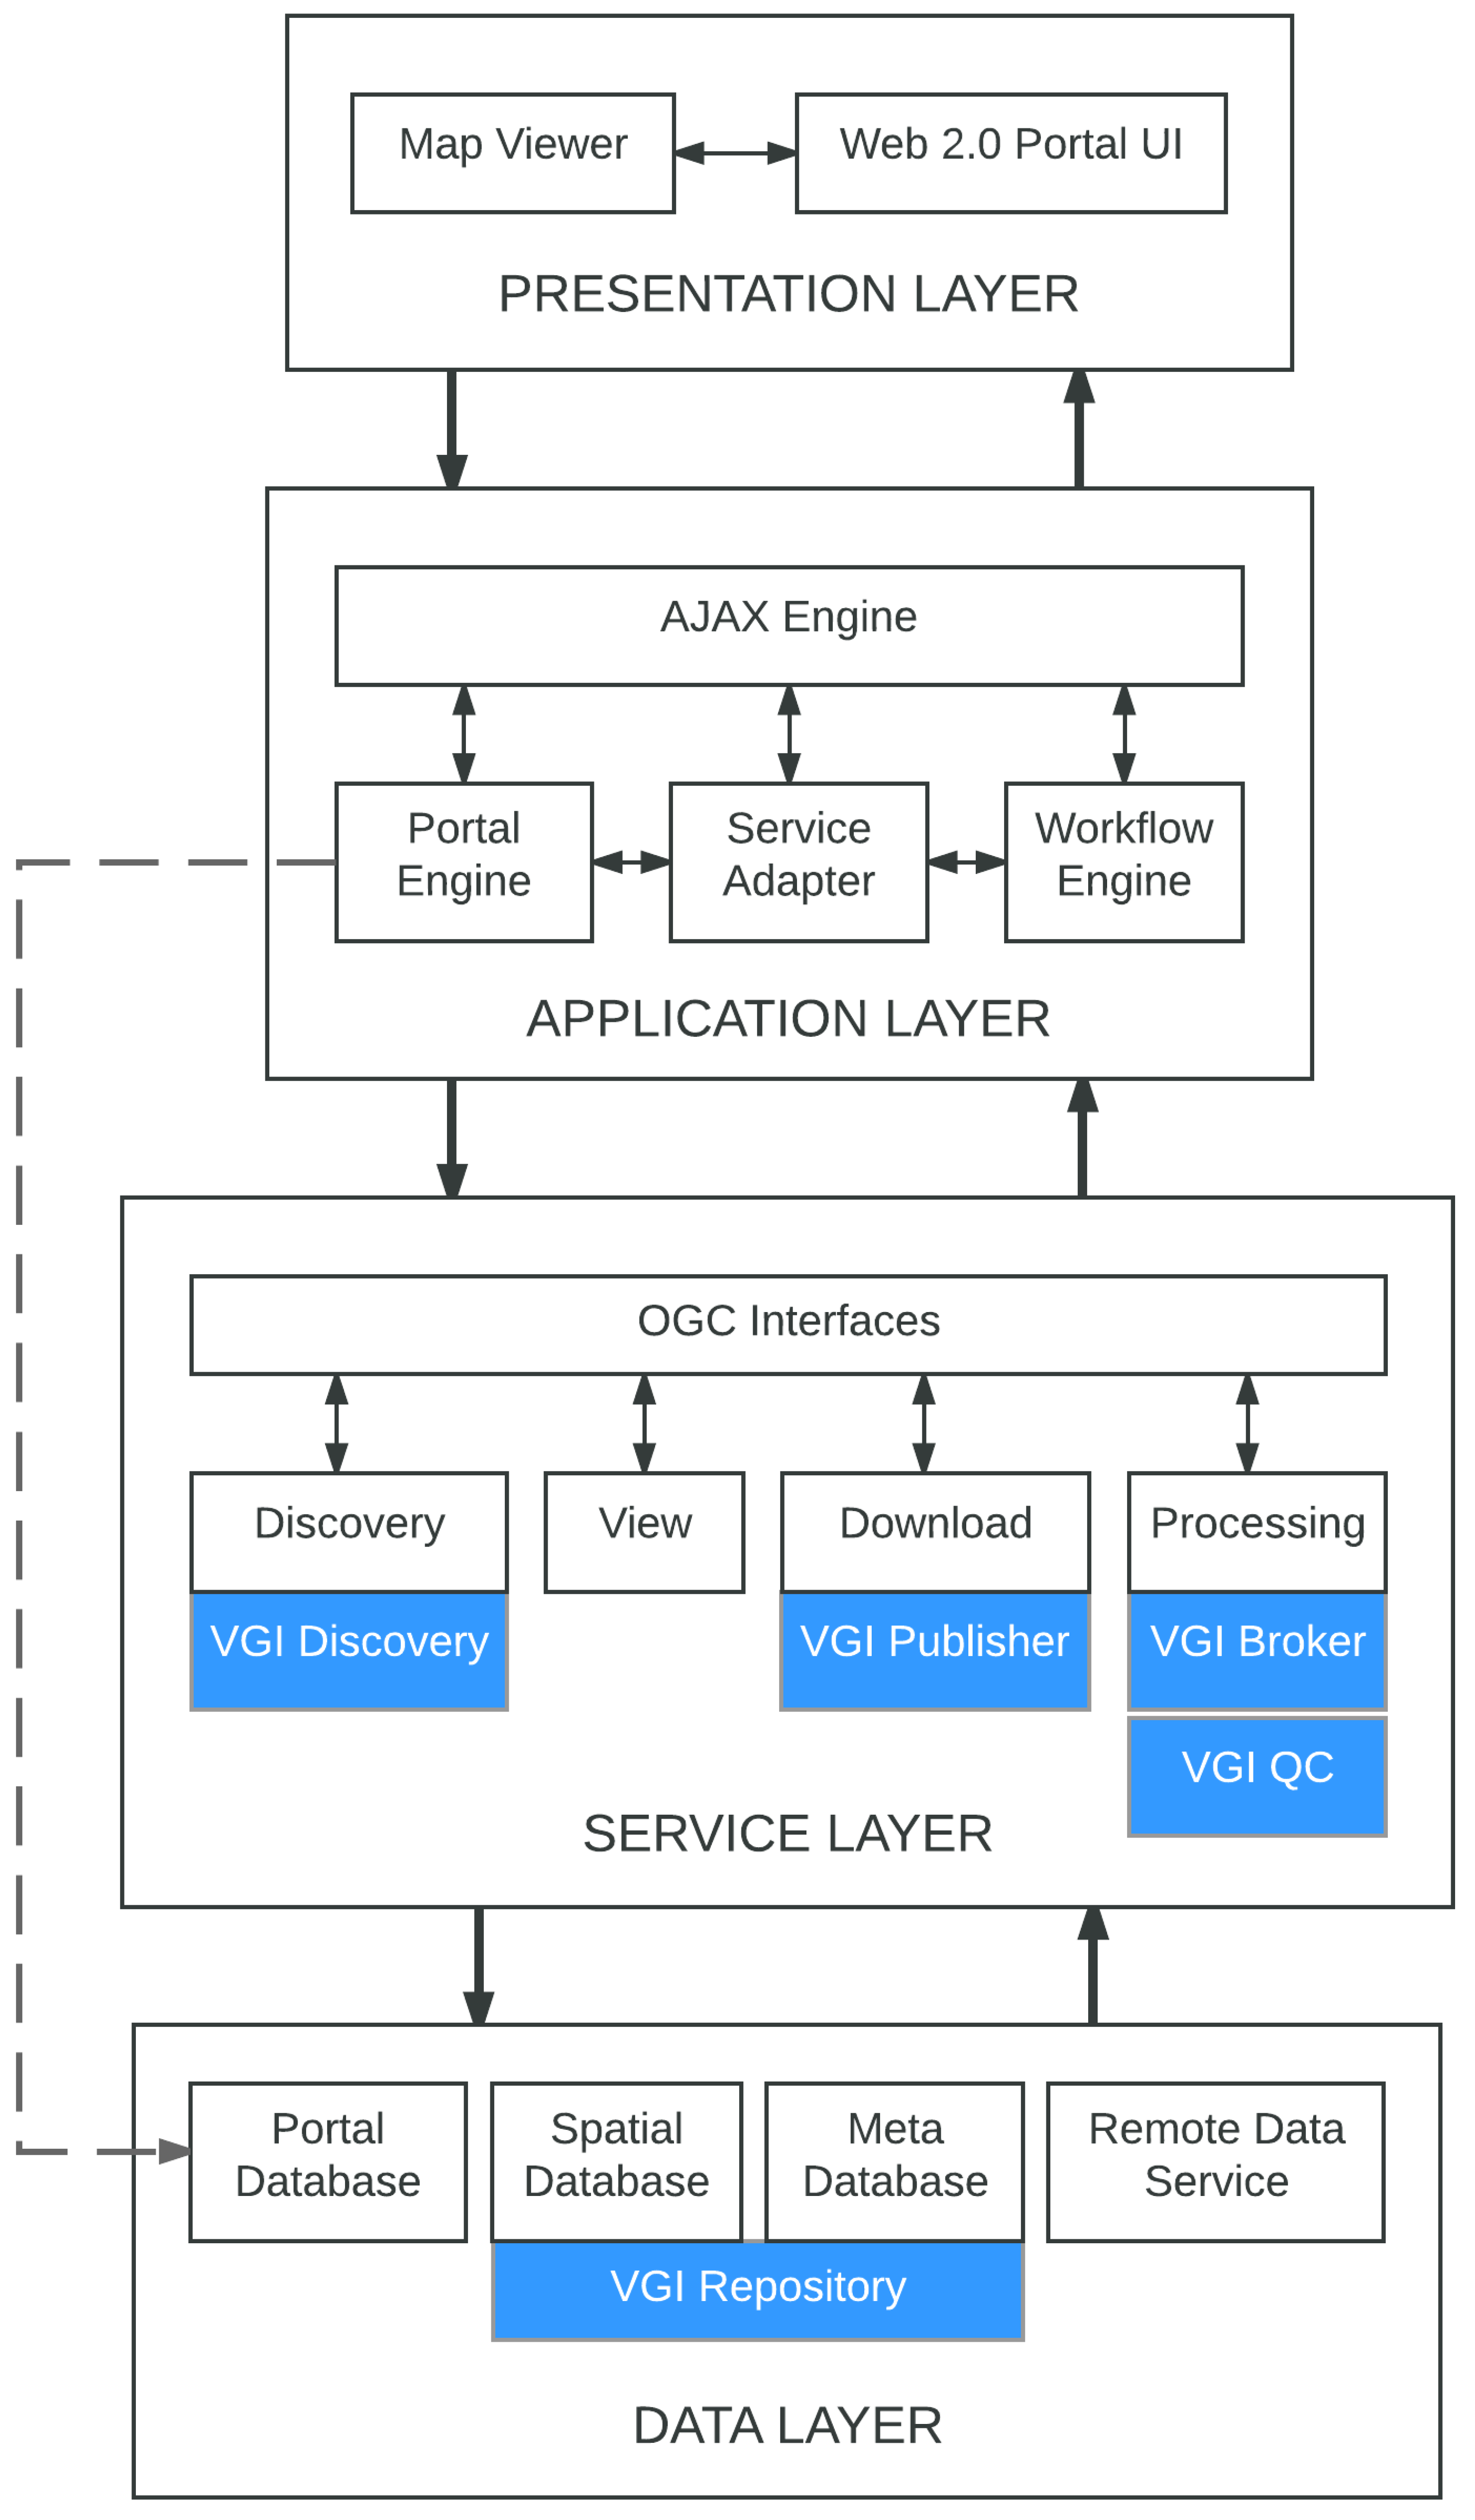
3.3. Technical Architecture

Figure 2 illustrates a typical reference architecture with the VGI framework’s components incorporated. The result is an accessible, flexible, and maintainable disaster management platform. It is a layered architecture that exploits SOA design and delivery approaches, SDI principles, and Web 2.0 technologies. It consists of four tiers of modules, including a presentation layer, an application layer, a service layer, and a data layer. This architecture is adapted from the e-Planning system architecture proposed by Poorazizi et al. [25]. As shown in Figure 2, the VGI framework’s components are classified as SDI service types deployed in the service layer. Hence, in the following, we only focus on the service layer components and refer to Poorazizi et al. [25] for a description of the other layers.
The service layer contains a set of web services that provide capabilities to search, access, and analyze spatial data, including authoritative and VGI datasets. The web services are grouped based on SDI service types: (i) discovery service (e.g., OGC CSW [69]) to search and provide access to available spatial data and services; (ii) download service (e.g., WFS or WCS) to access spatial data at the geographic feature level in vector formats such as GML, KML, or GeoJSON; (iii) view service (e.g., WMS or WMTS [70]) to visualize data in map form; and (iv) processing service (e.g., WPS [71]) to execute statistical and geo-computational models.
Figure 2. A reference architecture incorporating proposed VGI framework components.
Ijgi 04 01389 g002
The VGI Broker module is developed as a processing service. It is implemented using the WPS standard, and, based on the number of brokers, consists of several service instances (i.e., a WPS instance per broker). Each WPS instance runs independently to search a social media platform to find, retrieve, and store VGI data in the VGI Repository.
VGI QC has also been implemented as a set of WPS instances. For each of the five quality metrics above (i.e., PNS, TNS, SSS, CRS, and CS), we implemented a service instance. A further service instance is used to calculate the overall quality score (QS, see Section 3.1). The five quality metric service instances can be run individually or in parallel since the order of service execution is flexible.
The VGI Publisher has been developed as a download service. We have adopted OGC’s SWE framework to publish quality-assessed VGI as a service. Therefore, we have extended the Sensor Observation Service (SOS) standard interface [72] and the Observations and Measurements (O&M) data model [73] to enable distribution of VGI together with quality metrics. This allows clients to retrieve VGI data based on spatiotemporal parameters and quality-related metrics.
Finally, VGI Discovery is developed as a discovery service to publish metadata about the VGI data available. We have adopted OGC’s OpenSearch Geo and Time Extensions (OSGTE) specification [74] to develop VGI Discovery as a standard web service that returns VGI datasets (i.e., the VGI data published by VGI Publisher) based on spatial, temporal, and quality search parameters to a client.

4. The VGI Framework in Action
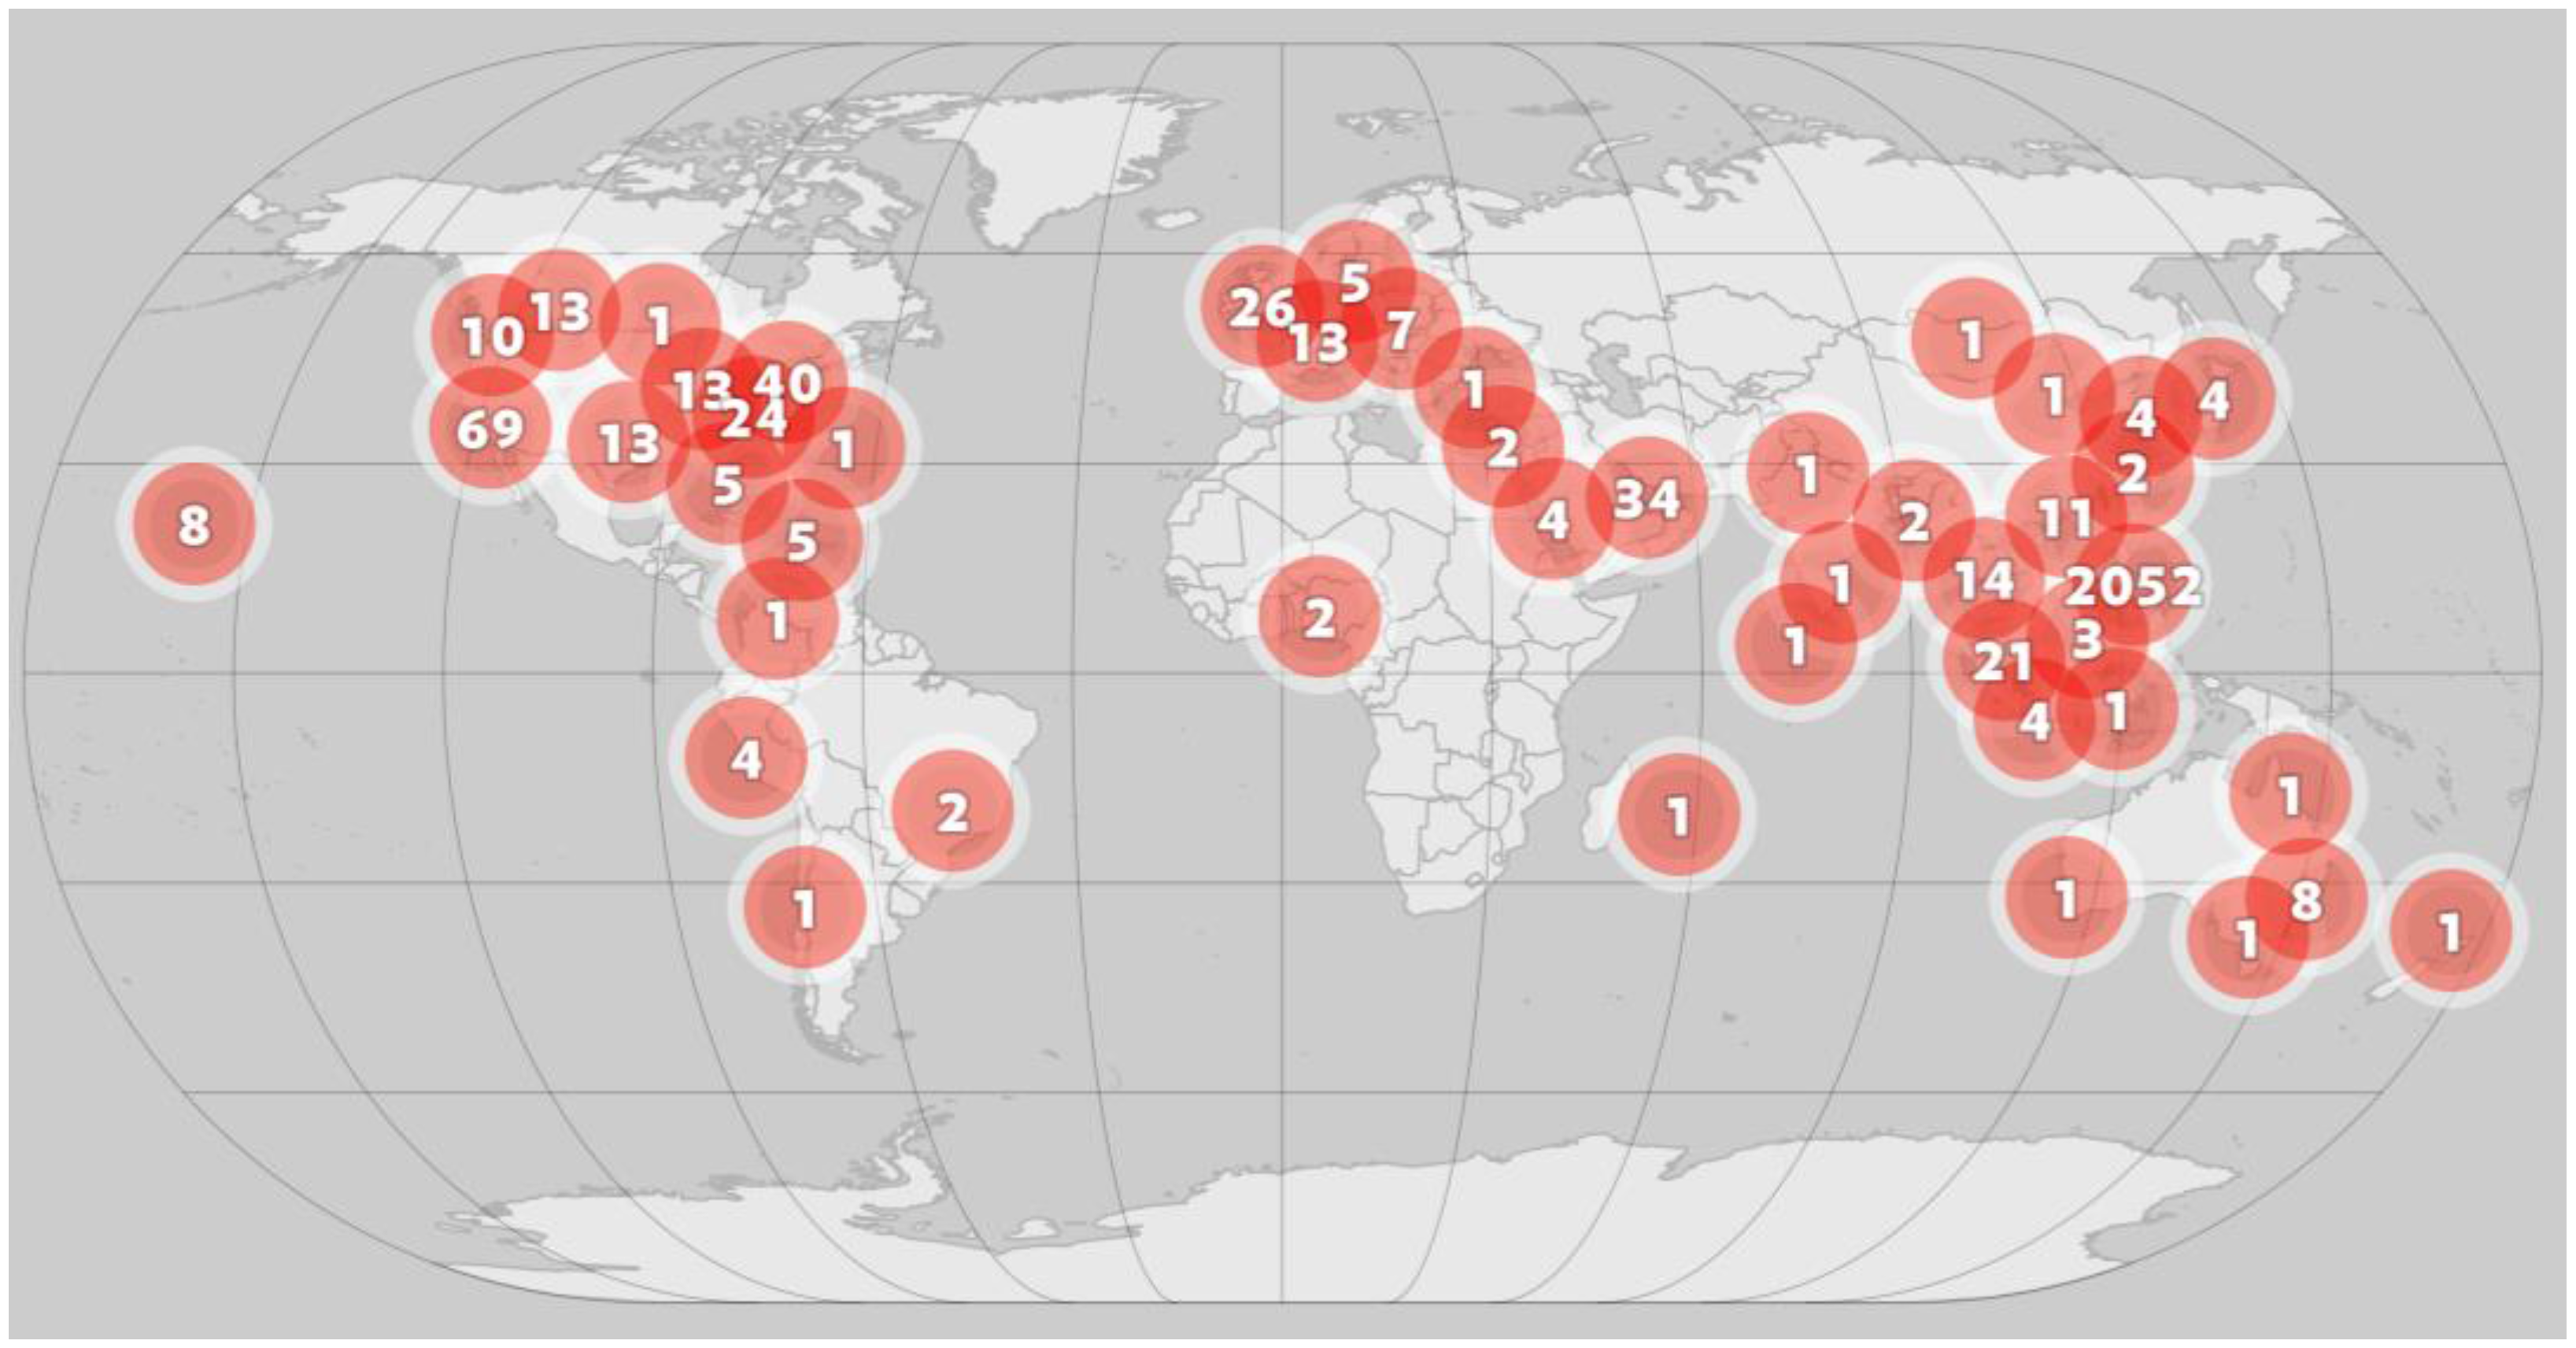
To demonstrate how the VGI framework works and to assess its performance, we studied weather and social media data related to Typhoon Ruby [75]. In the following sections, we briefly describe the disaster event and implementation details of the VGI framework, and then discuss the results of experiments undertaken.

4.1. Case Study

Typhoon Ruby was a catastrophic typhoon, which ranked as the most intense tropical cyclone of 2014 [76,77]. During the typhoon, 18 people lost their lives and significant damage to private and public property and infrastructure (~$114 million USD) occurred [78]. The typhoon entered the Philippines on 4 December 2014, made first landfall over Eastern Samar on 6 December 2014 with wind speeds reaching a maximum velocity of 175 km/h (kilometer per hour), and exited the country on 10 December 2014 as a tropical storm [79].
We collected user-generated content from Twitter, Flickr, Google Plus, and Instagram using the VGI Broker between 4 December and 17 December 2014 based on a set of predefined search parameters, hashtags, and keywords (see Table 2). Four brokers were implemented using the social media platforms’ Python API using HTTP GET/POST requests. The brokers were then wrapped using GeoServer WPS and exposed as a set of standard WPS instances. We designed a data model for each social media dataset and deployed four PostgreSQL/PostGIS databases to store and manage the incoming data stream. Table 2 lists the Python APIs used to develop the brokers and the search parameters used to invoke them. It should be noted that the search parameters were chosen through an initial investigation of each social media platform's public stream to find a relevant sample of data with relatively little noise.
Table 2. Python APIs used to develop the VGI Broker and search parameters.
Search Parameters (Hashtag/Keyword)Python API
TwitterHashtag: rubyph, hagupit, Keyword: Typhoon Hagupit, Typhoon Rubytwitter 1.15.0 1
FlickrHashtag: rubyph, hagupit, Keyword: Typhoon Hagupit, Typhoon Rubyflickrapi 2.0 2
Google PlusKeyword: Typhoon Ruby, Typhoon Hagupitgoogleapiclient 1.3.1 3
InstagramHashtag: typhoonruby, typhoonhagupitpython-instagram 1.3.0 4
Following data collection, VGI QC processing was undertaken. The quality score calculators were implemented as web accessible (HTTP GET/POST) Python applications. Therefore, the quality metric functionality was developed using Python libraries. The quality score calculators were then wrapped and exposed as standard WPS instances using the GeoServer WPS framework. PostGIS spatial functions were used to perform geometric computations, such as calculating distances between pairs of points and point-in-polygon tests (for the cross-referencing metric).
VGI Discovery and VGI Publisher were developed as service endpoints. To develop VGI Discovery, we used and extended the pycsw (http://pycsw.org/) libraries to enable quality-supported publishing and discovery. For the VGI Publisher, we adopted 52°North’s SOS server (http://52north.org/communities/sensorweb/sos/index.html) to enable data access and retrieval based on quality attributes.

4.2. Results

In this section, we describe the characteristics of contributions from each dataset and present results for quality control scores. For simpler presentation, values of the five quality scores were classified into Levels 1 to 4 representing values between 0.00 and 0.25, 0.25 and 0.50, 0.50 and 0.75, and 0.75 and 1.00, respectively. Similarly, the QS values, ranging from 0 to 5, were classified as Level 1 to Level 5, corresponding to values between 0 and 5 with a step value of 1. Consequently, a higher valued level (score) corresponds to a higher quality contribution, which is assumed to have better utility for disaster management given the metric models used.
Positional Nearness: We collected about 117,300 contributions from the four different data sources, Twitter, Flickr, Google Plus, and Instagram, that referenced Typhoon Ruby [75]. Of these contributions, only 2,440 (~2%) were geo-tagged with coordinate (location) information. In Table 3 we show the number of contributions for each positional nearness score (PNS) according to their source. PNS level 1 contributions were not geo-referenced. It appears that for this case study we had only two geo-referenced contributions from both Flickr and Google Plus. Hence, Google Plus provided the lowest proportion of geo-tagged content (2 out of 935 ~ 0.2%), followed by Twitter (440 out of 110,249 ~ 0.3%), then Flickr (2 out of 66 ~ 3.0%), with Instagram providing a significantly greater proportion of geo-tagged contributions (1,996 out of 6,022 ~ 33.1%). A 2-sample test for equality of proportions was carried out indicating a significant difference between the two proportions ( χ 2 = 30 , 051 , d . f . = 1 , p 0.001 ) . Three of the data streams, Twitter, Flickr, and Google Plus, were conflated as both Flickr and Google Plus provided fewer than five contributions with coordinates, which could result in an unreliable solution. There was also no significant difference between the count proportions for those services. The greater proportion of geo-tagged Instagram contributions can be partially explained by the fact that Instagram’s users can only publish photos and videos via their mobile phones, whereby Instagram may deduce spatial information from the users’ GPS or IP addresses. Figure 3 shows the spatial distribution of the retrieved data from social media.
Figure 3. Spatial distribution of social media content. Each circle represents a certain number of social media contributions.
Ijgi 04 01389 g003
Table 3. Counts of positional nearness score (PNS) values for each media stream.
TwitterFlickrGoogle PlusInstagram
PNSLevel 1110,239649354,165
Level 280035
Level 32005
Level 40201,817
Temporal Nearness: During the data collection period, social media feeds were streaming at an average rate of 2,129 contributions per day. As shown in Figure 4, of the contributions collected, most were published between 4 December 2014 and 10 December 2014, when the event itself took place in the Philippines. It is evident from Figure 4 that while we did capture data prior to the arrival of the typhoon in the Philippines, there was already a considerable volume of contributions being created on Twitter, etc., at the time we deployed the VGI Broker.
The temporal nearness evaluation indicates that more than 76% of all contributions were streamed during the event, which were assigned the highest temporal nearness score (i.e., Level 4). Level 1 contributions were all published several days before or after the event. Of the four contributing streams, Flickr had the highest proportion of Level 4 TNS contributions at 98.5%, followed by Instagram at 82.4%, then Twitter at 76.6%, and finally Google Plus at 56.9% (see Table 4). A pairwise comparison of proportions indicates that there is a significant difference in temporal performance of all social media streams, χ 2 = 331.6 , d.f. = 3 , p 0.001. For instance, Instagram photo and video contributions were posted, predominantly, during the event, whereas Twitter contributions were also published prior to the typhoon as forms of warnings, and then post-typhoon, as messages of hope to those affected.
Figure 4. Temporal dynamics of users’ contributions on social media.
Ijgi 04 01389 g004
Semantic Similarity: The most frequently employed (determined post-event) hashtags/keywords used to describe the event were rubyph, hagupit, typhoonruby, typhoonhagupit, and philippines. However, in order to collect data in real-time, we used a reference dictionary of trending crisis-related words as of December 4 2014, containing the four keywords typhoon, ruby, hagupit, and philippines to perform the semantic similarity assessment. Contributions classified as Level 1 in Table 5 matched few of the reference words exactly—they actually had partial hashtag/keyword matches, as this was necessary to enter the event database. Level 2 contributions had at least one match with a reference-word.
Table 4. Counts of temporal nearness score (TNS) values for each dataset.
TwitterFlickrGoogle PlusInstagram
TNSLevel 11,74606529
Level 224,04113381,033
Level 3 *0000
Level 484,462655324,960
* Please note that given the model used (see Equation (4)), Level 3 is not possible.
Table 5. Counts of semantic similarity score (SSS) values of each dataset.
TwitterFlickrGoogle PlusInstagram
SSSLevel 138,967105,236
Level 241,56100560
Level 329,390171187
Level 43314893439
Google Plus’s content was semantically very similar to the reference dictionary since 100% of the collected data was classified as Level 3 or 4. This is, however, not significantly more than the contributions for the data retrieved from Flickr (98.5% achieved Level 3 or 4). Overall, a 4-sample test for equality of proportions along with a pairwise comparison indicates that there is no significant difference in the semantic quality of contributions between the four social media streams, χ 2 = 4 , 384 ,  d . f . = 3 ,  p 0.001 . Twitter data contained enough tags from the reference dictionary to achieve Level 3 or 4 27% of the time, while Instagram did so 3.7% of the time.
Cross-referencing: The cross-referencing process focused on the spatial component of the contributions, measuring how many times each contribution did fall within the MBR of each social media stream. Contributions that were assigned to Level 1 had either no spatial reference or did not fall in a bounding box other than their own. As can be seen from a pairwise comparison of proportions indicates that Instagram contributions are more likely to be within or near the geographic intersection of the social media data sources.
Table 6, and few contributions (~0.1%) were located in the bounding box of at least two other datasets. There were only 684 tweets that fell within the MBRs of two other datasets. No contributions fell in the intersection of all MBBs. A 3-sample test for equality of proportions reports that there is a significant difference in cross-referencing across the four social media streams with χ 2 = 26 , 554 , d . f . = 2 , p 0.001. In this test, Flickr and Google Plus were conflated, as were Levels 2 to 4, to ensure that the χ 2 approximation would be correct. A pairwise comparison of proportions indicates that Instagram contributions are more likely to be within or near the geographic intersection of the social media data sources.
Table 6. Counts of cross-referencing score (CRS) values of each dataset.
TwitterFlickrGoogle PlusInstagram
CRSLevel 1109,545649334,040
Level 2684021,852
Level 32020130
Level 40000
Credibility: Given the different characteristics of the social media platforms (e.g., data model), we selected a different set of factors for credibility assessment for each media stream as described above. Depending on the media source, Level 1 contributions will have no shares, likes, contributors, or followers. As indicated in Table 7, few contributions obtained a high credibility score. A 2-sample test for equality of proportions reports that there is a significant difference in credibility across the four social media streams, with χ 2 = 111.4 , d . f . = 1 , p 0.001 . In this test, Flickr, Google Plus and Instagram were conflated, as were Levels 2 to 4, to ensure that the χ 2 approximation would be correct. The data suggests that Twitter offers more credible information.
Table 7. Counts of credibility score (CS) values of each dataset.
TwitterFlickrGoogle PlusInstagram
CSLevel 1108,060649266,018
Level 22183061
Level 36022
Level 40211
Overall Score: Table 8 presents a summary of the final quality score calculations for each dataset. Given the data, most of the content published on the social media services fell in levels 2 and 3. No dataset contained a contribution that was identified as Level 5, the highest quality. Indeed, contributions without any geographical reference can only reach a quality level of 3. A 4-sample test for equality of proportions along with a pairwise comparison indicates that there are significant differences in the quality of each social media data stream with χ 2 = 22 , 003 , d . f . = 3 , p 0.001 . In this test, Levels 3 to 5 were conflated to ensure that the χ 2 approximation would be correct. We state with caution that given the data, our results indicate that Flickr provides the highest quality data with 72.7% of the data falling in Level 3 or higher, followed by Instagram (30.6%), Google Plus (19.2%), and Twitter with 0.9%.
Table 8. Counts of total quality score (QS) values of each dataset.
TwitterFlickrGoogle PlusInstagram
QSLevel 113,67400626
Level 295,566187553,550
Level 31,009461801,655
Level 4020190
Level 50000

5. Evaluations and Discussion

The evaluation and discussion of this work has been split following the two themes contained in the work. First we evaluate the VGI framework in terms of the framework objectives set out in Section 3. This is followed by an evaluation of the quality assessment model and metrics.

5.1. Evaluation of the Technical Framework

To evaluate the proposed framework, it is useful to use both qualitative and quantitative criteria to verify whether the system design successfully meets users’ needs and to evaluate how well it performs under different conditions [80]. In this section, we will discuss qualitative criteria. A quantitative evaluation, which may, for instance, address the computational performance of search and storage capabilities of the framework, and the thorough analysis of media streams, are a focus of future work.
To implement the architecture, we employed a FOSS (Free and Open Source Software) strategy for two reasons. First, it minimizes the potential cost required to implement, modify, or customize the system. Second, it facilitates the free adoption of the platform by organizations tasked with disaster management responsibilities [81,82]. With respect to the properties of the architecture, we can say:
(i)
The proposed framework follows open geospatial and World Wide Web standards (i.e., OGC and W3C), which facilitate machine-machine and human-machine interactions in an interoperable manner;
(ii)
It allows developers to design and build system components (i.e., services) using various technologies and tools (e.g., FOSS or proprietary);
(iii)
The architecture supports a service-based development approach, which provides the flexibility necessary to allow changes or customization of the system; and
(iv)
It provides a flexible deployment solution where the system components can be easily “plugged into” existing systems, and allows deployment in both local and distributed (e.g., cloud) environments.
Consequently, regarding the primary quality attribute requirements and business goals [63,64] that drove system development (see Appendix), we conclude that quality attributes such as scalability/extensibility, open systems/standards, and interoperability are (theoretically) all met in the proposed framework. The secondary priorities of flexibility, integrability, ease-of-installation, and functionality have been built into the system through the adoption of development “best practices” throughout the design process. Lower level priorities such as portability and ease-of-repair are also met (see Table 9).
However, as outlined, there is still a need to assess the framework in terms of practical technical performance, scalability, and usability. This will be necessary to understand how the system responds in real emergency operations to ensure that system operators are able to put the VGI framework to good use. There is also a need to study mechanisms that enable integration of the VGI framework into existing (enterprise) information and decision-making workflows. This will facilitate incorporation of more data sources (i.e., authoritative and user-generated data) into the platform, which subsequently permits refinement of the quality control procedures so as to achieve more realistic results.
Table 9. Quality attribute requirements and business goals addressed by the VGI framework.
Framework CharacteristicsBusiness Goals
OGC- and W3C-compatible service interfaces and data encodingsInteroperability
Integrability
Flexibility
Ease-of-use
Service-based development approachPortability
Integrability
Ease-of-installation
Flexibility
Ease-of–repair
Scalability
Functionality
FOSS development strategyPortability
Flexibility
Ease-of-repair
Functionality

5.2. Evaluation of Quality Control Metrics

Several works have investigated spatial data quality requirements for the creation of authoritative and organizational spatial data, such as data collected by national mapping agencies [83,84,85,86]. Examples of such quality standards concern “lineage”, “positional accuracy”, “attribute accuracy”, “logical consistency”, “completeness”, and “temporal accuracy”. Although some of these quality metrics may seem independent of a specific application, they need to be defined with respect to the particular context of data (or map) use to ensure that the data are fit-for-purpose [87].
Fitness-for-purpose is a critical issue for quality assurance of VGI [87], whereby VGI demands a somewhat different approach to quality assessment. This difference emerges from (1) the different procedures undertaken to produce authoritative data and VGI, (2) the socio-technical nature of VGI systems, and (3) the heterogeneity of VGI (see [87] for a detailed discussion). Therefore, several approaches have been proposed by researchers to fill this gap, including “crowdsourcing”, “social”, “geographic”, “domain”, “instrumental observation”, and “process-oriented” approaches [50,87]. These approaches are not necessarily used in isolation for a given use case, but rather combined for real-world applications [87]. For example, in this study, we used three approaches to ensure that the quality assurance fits the disaster management purpose: (a) “crowdsourcing” to evaluate user ratings and to measure the quality of a contribution (e.g., retweets); (b) “geographic” analysis to evaluate the spatial quality of the information; and (c) “domain” analysis to ensure the relevance of the information to a given context (e.g., Typhoon Ruby). Consequently, positional nearness and cross-referencing are “geographic” analysis approaches, temporal nearness and semantic similarity evaluations can be considered “domain” approaches, and credibility is a “crowdsourcing” approach.
The current set of quality assessment metrics is to be regarded as an experimental set with its primary purpose being to demonstrate the utility of the proposed architecture for quality-based VGI data retrieval. However, our case study also permits us to evaluate the metrics and identify which ones may work, and which require rework or refinement.
Positional Nearness: Although the Philippines was the center of the crisis, there was a substantial amount of data streaming from other parts of the world (see Figure 3). These contributions have been referred to as a response to a “cyber event” by social media [88]. This means that they are not reports of the crisis itself, but, rather, reactions to its coverage in social media. Therefore, such contributions should receive lower positional nearness scores as they may have a negative effect on attempts to localize the crisis using social media feeds [88]. For example, the mean center of all Twitter contributions is located in the Arabian Sea (65.66996° E, 19.57687° N), 750 km east of Mumbai, India, which is about 6,000 km away from the center of the crisis.
Instagram contributions are significantly more tightly clustered than Twitter contributions, and closer to the actual typhoon with the proportion of Level 4 contributions reaching 30.2%. A 2-sample test for equality of proportions indicates that Instagram produced a significantly higher proportion of contributions that were clustered near each other ( χ 2 = 34 , 35 , d . f . = 1 , p 0.001 ) . For statistical accuracy, Twitter, Google Plus, and Flickr were grouped to ensure that the χ 2 approximation would be correct, as were Levels 1 to 3 within each grouping. That Instagram contributions are closer to the actual typhoon might be because Instagram contributions generally contain photos and videos related to the typhoon—not text messages as with Twitter. Hence, Instagram contributors are more likely to have created the photos or videos in the vicinity of the event, whereas the other contributions can in reality be created from anywhere in the world. This is also seen in our data where Instagram nearness scores have a higher proportion of Level 3 and 4 scores than other media streams (see Table 3 and Table 4).
We are left, however, with two problems: First, it is difficult to apply this metric for events with a global response as these data sources will be biased by the coordinate system used to store geographic location, and may well generate geographic (arithmetic) centers that are far away from the crisis. Other metrics, such as the center of mean distance, or the center of intensity, may be more appropriate. Second, there are very few Google Plus and Flickr contributions with a spatial reference. It would be desirable that each media stream has a substantial number of geo-referenced contributions for both the nearness and cross-referencing metrics. One of the reasons for having a small number of geo-tagged features is that we only used explicit spatial information attached to the contributions (i.e., geographic coordinates). However, geographic information retrieval techniques [89] need to be considered in future work to extract implicit spatial information (e.g., place names or POIs) that is embedded in the text, or to retrieve location information from users’ profiles to enrich the spatial component of the user contributions.
Temporal Nearness: One of the reasons for having contributions with lower temporal nearness scores is that we started monitoring the event two days before the typhoon hit the Philippines and continued collecting data until after it exited the country. This means that the datasets contain social media contributions from different phases of the disaster, preparedness through response and then recovery. The differences in temporal patterns, as seen in Figure 4, may have two different reasons: (i) because contributors prefer to use different social media services during different phases of an event; and (ii) because of the different spatial distribution patterns of each of the social media datasets due to world-wide responses to the “cyber event”. This latter point suggests that the metric should be combined with positional nearness scores to identify the spatiotemporal center, or moving center, of an event. An additional question to consider is, however, what time-span should be used to best calculate the scores. In our case study we have qualified data in terms of “days” since the end of the event. This temporal unit seemed to work adequately as the typhoon was moving slowly given the spatial extent of the event area. However, other types of events, like an earthquake or an accident, of smaller spatial scale, may also require adjustment of the temporal unit.
Semantic Similarity: The semantic similarity assessment suggested that contributions from Google Plus contained all dictionary reference tags in 99% of the cases. This might be because of the way that Google Plus functions as a social networking website. Compared to Twitter, a micro-blogging service with a 140 character limit, Instagram and Flickr, both photo/video sharing services, Google Plus allows users to post both short- and medium-length textual content directly to their stream, and share content (e.g., photos, videos, or news articles) from third-party websites. Hence, given the content types and word volume per contribution, Google may be favored by the semantic similarity calculation used. This indicates the need to weigh contributions for each social media stream and also for each media type (image, text, etc.).
An issue that we observed with the current data is that sometimes words similar to the reference words were contained in the message but with different or incorrect spellings. Consequently, a different word-matching approach may be introduced that measures similarity using character-based distance, for example, such as the Hamming Distance [90]. Another challenge is to interpret different languages and terminologies in contributions, which is crucial when a disaster happens in a multilingual country or where people use vernacular and alternative terms to describe an event [91]. A promising approach to minimize this issue is to use a data dictionary that covers different languages or terms in a given context, similar to CrisisLex proposed by Olteanu et al. [92].
Cross-referencing: Looking at Table 3 and Table 6, it appears that Google and Flickr have only two contributions each and that both have a high score, as these are geo-referenced contributions. This raises some concern about how the concept of nearness should be defined. We chose to use an MBR, but with worldwide social media contributions, Twitter, and Instagram, this may be of little value. Additionally, if there is little data obtained from a selected social media stream, the bounding boxes may potentially be very small (Flickr and Google Plus in our case), or in a different geographic location than the event location. Surprisingly, and due to the small Google and Flickr bounding boxes, we still arrived at “reasonable” results. However, we think that this metric could be improved or replaced by a density-based metric, e.g., a standard deviation ellipse, 95% MBR (minimum bounding rectangle), or perhaps a core home range as used in animal home range estimation (see [93]).
Credibility: This metric is fairly straightforward and enables us to weigh each contribution with its peers. However, it is interesting to observe that very few contributions have a credibility level of three or higher. This indicates two things: either the credibility criteria are too demanding, and it may be difficult to develop civic credibility within the context of a crisis because of bandwagon effects [94], or the media’s hierarchical network structure (i.e., network centrality and connectivity [95]) does not allow a more equal distribution of contributions among the credibility levels. A problem that we observed, relevant to the total quality score calculation, is that the maximal credibility scores (i.e., not levels) for the geo-reference data subsets reached 0.25 and not 1.0, as would be most desirable. Similarly, spam and biased content is another challenge when analyzing the credibility of social media content [96]. Hence, there is a need to investigate spam detection methods and subsequently improve the credibility evaluation algorithm.
Total QS; It is somewhat difficult to assess the overall quality scores with this initial set of (un-refined) metrics and for this particular case study because of the problems mentioned above: positional nearness and cross-referencing appear to have limited utility if a dataset is global. Second, location information is double-weighted as we have two location-dependent metrics, leading to a limitation that contributions without any spatial reference can only score 3 at most. Third, the credibility scores are low, with a maximum score of 0.25 for the subset of spatially referenced contributions. Therefore, credibility is basically not accounted for. This raises the issue of the relative merit of each metric in relation to a crisis: should all metrics be weighted equally, or do some contribute greater value with respect to a crisis? If this is the case, then development of an appropriate weighting scheme using the Analytical Hierarchical Process [97], for example, is necessary.
As a result of these three issues, the highest-ranking contributions for Twitter and Instagram still contain a lot of noise, and perhaps only half of the contributions can be considered informative (see Table 10, Table 11, Table 12 and Table 13). Additionally, a number of the results reported may well be affected by the disparity in sample size. This raises the question of how much value is contained in the 96,575 tweets that achieved QC Level 2 or 3 versus Flickr’s 64 contributions or Google Plus’ 935. To this end, any metrics that are used should also be (qualitatively) validated before being widely adopted.
Table 10. A sample of Twitter contributions with the highest total quality score.
TweetTotal QSPNSTNSSSSCRSCS
Trust in the Lord always!! Pray for our country! Philippines! Typhoon #hagupit! http://t.co/bm3w1eR7FN2.7530.50310.750.50
Typhoon #Hagupit Kills 21 In The Philippines @IanWoodsSky reports from south of Manila http://t.co/ARrJlw5LNA2.6190.11810.750.50.25
An evacuated family in #Borongan, waits as #Philippines prepares for typhoon #RubyPH #Hagupit @UNDPPH @UNDPasiapac http://t.co/PjB0aWyRnn2.5940.08410.750.50.26
Philippines Braces For Typhoon #Hagupit: http://t.co/zWpIp2wU07 http://t.co/zlT74zmv8x2.5850.08410.750.50.251
As Typhoon #Hagupit nears, millions in the #Philippines are preparing for wind speeds of up to 286 km/h and 4 metre storm surges.2.5850.08410.750.50.251
Table 11. A sample of Google Plus contributions with the highest total quality score.
TextAttachment titleTotal QSPNSTNSSSSCRSCS
Bed weather... me, still in bed literally!!! So apparently according to the latest updates about typhoon…Bed weather... me, still in bed literally!!! So apparently according to the latest updates about typhoon…, the expected 4th landfall is around 8 pm tonight.2.55601100.556
www.Suspicious0bservers.org www.ObservatoryProject.com TODAY''s LINKS: Unzicker: http://www.euroscientist.comBig Earthquake, Magnetic Storm | S0 News December 7, 20142.5501100.55
Manila - NO CLASSES TOMORROW...The picture below showed some situation in some provinces that been …Manila - NO CLASSES TOMORROW… The picture below showed some situation in some provinces that been hit by the typhoon Hagupit. The typhoon Ruby with it''s international name Hagupit is expected to hit Manila tonight until tomorrow morning.. Please continue to pray for my country. THANK YOU!2.36801100.368
Super Typhoon Hagupit/Ruby from Space #Typhoon #Philippines #RubyPHSuper Typhoon Hagupit/Ruby from Space #Typhoon #Philippines #RubyPH2.34401100.344
PAGASA: Typhoon 'Ruby' has slightly weakened as it continues to threaten the Samar provinces while maintaining...Typhoon Ruby (Hagupit): December 6, 2014 Update2.31701100.317
However, implementation of the metrics has shown that the workflow itself, from VGI data retrieval to data quality evaluation, worked as designed. Only the set of quality metrics needs refinement and further experimentation with different event datasets. We expect that additional events would have different spatial and temporal characteristics that will enable better evaluation and understanding of metric correlation and usability.
Table 12. A sample of Flickr contributions* with the highest total quality score.
CaptionPhotoTotal QSPNSTNSSSSCRSCS
Calm before the StormIjgi 04 01389 i0013.9681110.750.218
Pre RubyIjgi 04 01389 i0023.9571110.750.207
Typhoon HagupitIjgi 04 01389 i003301101
Super Typhoon HagupitIjgi 04 01389 i0042.26600.5100.766
Week 46/52: I will trust in the shelter of your wingsIjgi 04 01389 i0052.2401100.24
* Source: this information is retrieved from Flickr using its photo search API based on the hashtags/keywords related to Typhoon Ruby. The images above are copyrighted to ilovestrawberries (Carmi) (https://www.flickr.com/photos/ilovestrawberries), Klaus Stiefel (https://www.flickr.com/photos/pacificklaus), and EUMETSAT (https://www.flickr.com/photos/eumetsat).
Table 13. A sample of Instagram contributions* with the highest total quality score.
CaptionPhotoTotal QSPNSTNSSSSCRSCS
Typhoon ruby is coming in now. The wind is building and it’s quite rainy. There are a few Poole on the street, mostly looking around but the majority have taken shelter. #Philippines #tacloban #typhoonruby #hagupit #cnnIjgi 04 01389 i0063.5231110.50.023
#RUBYPH Latest satellite image of Typhoon Ruby (Super Typhoon Hagupit as it makes it way to the Philippines. 19 days before Christmas we will be hit by a devastating typhoon #SuperTyphoonHagupit #TyphoonRuby #PAGASA #Philippines #PrayForPhilippinesIjgi 04 01389 i0073.5031110.50.003
Welcoming new members for Miracles Do Happen! Yep, that’s right! MDH Philippines is back to serve. Excited to donate and participate in charity work? Stay tune for more updates as we are going to help people affected by the typhoon #Ruby add us on Facebook and learn how you can be a miracle to others. #mdhphilippines #miraclesdohappen #beamiracle #typhoonruby #hagupit #volunteerIjgi 04 01389 i0083.5021110.50.002
My lovely neighbours always smile even if it's rains, even if their houses are flood... #lovethem #locals #typhoonhagupit #tocute #neighbors #girls #kids #bacolod #filipinas #philippines #pilipinas #rain #hagupit #rubyIjgi 04 01389 i0093.501110.750.750.001
Just over a year ago, our C.O.O. snapped this photo while visiting a small mountain town in Northern Cebu as part of a relief team in the days after Super Typhoon Haiyan ravaged the Philippines...sadly, these same children just had to brave Super Typhoon Hagupit The Just Picked CoCoWater team are sending all our love to the people of the Philippines and asking for you to help in any way you can #Philippines #TyphoonHagupit #BeStrong #LoveIjgi 04 01389 i0103.501110.750.750.001
* Source: this information is retrieved from Instagram using its media search API based on the hashtags related to Typhoon Ruby. The images above are copyrighted to @cnnbrad (https://instagram.com/cnnbrad/), @doberdoggies (https://instagram.com/doberdoggies/), @jessicalorriz (https://instagram.com/jessicalorriz/), @merinsbcn (https://instagram.com/merinsbcn/), and @justpickedcoco (https://instagram.com/justpickedcoco/).

6. Conclusions

In this paper, we introduced a VGI framework for discovery and use of user-generated content within the context of disaster management. We considered both functional and architectural requirements to develop the framework. We have also shown that compliance to open standards and specifications, following a FOSS strategy, and the use of a service-based development approach were key factors for building a prototype platform. As a result, this platform enables interoperability and is flexible in terms of component integration for new or existing disaster management platforms. Although the system was used for the specific use case of Typhoon Ruby, the proposed framework can be easily adapted to support other types of disaster events.
Results of the case study on Typhoon Ruby highlight the difference between contributions from the four media streams. These differences include different types of media (text, images, etc.), different temporal contribution patterns, and different credibility information. However, due to a lack of geo-referenced contributions, no conclusive statement can be made about differences in spatial contribution patterns. For this type of event, a typhoon, Instagram looks to be a promising source of information in comparison to Flickr and Google Plus. However, given the differences mentioned above, these media streams should most likely be used in a complementary fashion.
Our discussion of the metric evaluation has also been manifold, showing that there is a need to develop more sophisticated algorithms and models for quality metrics for a hurricane-type event. Thus, further investigation of the metrics requires different event datasets to evaluate model parameterization options and robustness.
There is a need for ongoing evaluation of the framework and platform in terms of both technical and usability aspects to assure efficiency and effectiveness of the platform in meeting users’ needs during a disaster. In particular, it needs to be validated if high-quality-ranked contributions are indeed useful for disaster management. This can partly be achieved by evaluation of official sources of information such as newspapers or government-managed disaster response websites. As an example, the government of the Philippines set up a website (http://www.gov.ph/crisis-response/typhoon-ruby/) to keep the public informed of Typhoon Ruby. We will peruse these tasks in our future research.
There are some limitations to using the proposed platform as a tool for disaster management. For instance, people living in remote and less developed areas may have limited access to the Internet and social networking websites such as Twitter. Moreover, some social networking websites such as Twitter have API restrictions, such as the API rate limits (https://dev.twitter.com/rest/public/rate-limiting) or restricted historical data download (for example, Twitter’s Search API index includes between 6–9 days of tweets (https://dev.twitter.com/rest/public/search)), which hinders data access during a disaster event. Also Internet censorship, which may be imposed by governments, private organizations, or a group of people, to control what can be accessed, published, or viewed on the Internet [13,98,99], can hinder adoption of VGI-based disaster management platforms. However, before these particular cases are to be addressed, there exists the challenge of obtaining political support to enable integration of bottom-up disaster management platforms into emergency management strategies. Privacy, intellectual property rights, and data ownership and copyright are some examples of controversial issues in this context [100,101]. To address the issues, government organizations need to re-evaluate and perhaps adapt the legal and policy frameworks that currently facilitate governance of SDIs so that they can be extended to allow integration and management of VGI with authoritative data.

Acknowledgments

Ebrahim Poorazizi is thankful to Alberta Innovates—Technology Futures and Alberta Innovation & Advanced Education for financial support with a graduate student scholarship. Stefan Steiniger has been supported with funding provided by the Centro de Desarrollo Urbano Sustentable (CEDEUS), Conicyt/Fondap/15110020.

Author Contributions

Ebrahim Poorazizi and Andrew Hunter developed the VGI framework and design. Ebrahim Poorazizi implemented the prototype application. Ebrahim Poorazizi, Andrew Hunter, and Stefan Steiniger analyzed the results of the case study and wrote the manuscript.

Conflicts of Interest

The authors declare no conflict of interest.

Appendix

Ijgi 04 01389 i011

References

  1. Mansourian, A.; Rajabifard, A.; Valadan Zoej, M.J.; Williamson, I. Using SDI and web-based system to facilitate disaster management. Comput. Geosci. 2006, 32, 303–315. [Google Scholar] [CrossRef]
  2. Zlatanova, S.; Fabbri, A.G. Geo-ICT for risk and disaster management. In Geospatial Technology and the Role of Location in Science; Scholten, P.H.J., van de Velde, D.R., van Manen, N., Eds.; Springer: Amsterdam, The Netherlands, 2009; pp. 239–266. [Google Scholar]
  3. Schulz, A.; Paulheim, H. Mashups for the emergency management domain. In Semantic Mashups; Endres-Niggemeyer, B., Ed.; Springer: Berlin, Germany, 2013; pp. 237–260. [Google Scholar]
  4. Li, D.; Zeng, L.; Chen, N.; Shan, J.; Liu, L.; Fan, Y.; Li, W. A framework design for the Chinese National Disaster Reduction System of Systems (CNDRSS). Int. J. Digit. Earth 2014, 7, 68–87. [Google Scholar] [CrossRef]
  5. Okolloh, O. Ushahidi, or “testimony”: Web 2.0 tools for crowdsourcing crisis information. Particip. Learn. Action 2009, 59, 65–70. [Google Scholar]
  6. Zook, M.; Graham, M.; Shelton, T.; Gorman, S. Volunteered geographic information and crowdsourcing disaster relief: A case study of the Haitian Earthquake. World Med. Health Policy 2010, 2, 7–33. [Google Scholar] [CrossRef]
  7. Spinsanti, L.; Ostermann, F. Automated geographic context analysis for volunteered information. Appl. Geogr. 2013, 43, 36–44. [Google Scholar] [CrossRef]
  8. Goodchild, M.F. Citizens as sensors: The world of volunteered geography. GeoJournal 2007, 69, 211–221. [Google Scholar] [CrossRef]
  9. Duc, K.N.; Vu, T.-T.; Ban, Y. Ushahidi and Sahana Eden open-source platforms to assist disaster relief: Geospatial components and capabilities. In Geoinformation for Informed Decisions; Lecture Notes in Geoinformation and Cartography; Rahman, A.A., Boguslawski, P., Anton, F., Said, M.N., Omar, K.M., Eds.; Springer: Amsterdam, The Netherlands, 2014; pp. 163–174. [Google Scholar]
  10. Díaz, L.; Granell, C.; Huerta, J.; Gould, M. Web 2.0 Broker: A standards-based service for spatio-temporal search of crowd-sourced information. Appl. Geogr. 2012, 35, 448–459. [Google Scholar] [CrossRef]
  11. Roche, S.; Propeck-Zimmermann, E.; Mericskay, B. GeoWeb and crisis management: Issues and perspectives of volunteered geographic information. GeoJournal 2013, 78, 21–40. [Google Scholar] [CrossRef]
  12. Jaeger, P.T.; Shneiderman, B.; Fleischmann, K.R.; Preece, J.; Qu, Y.; Fei Wu, P. Community response grids: E-government, social networks, and effective emergency management. Telecommun. Policy 2007, 31, 592–604. [Google Scholar] [CrossRef]
  13. Huang, C.-M.; Chan, E.; Hyder, A.A. Web 2.0 and internet social networking: A new tool for disaster management?—Lessons from Taiwan. BMC Med. Inf. Decis. Mak. 2010. [Google Scholar] [CrossRef]
  14. Global Spatial Data Infrastructure Association. Spatial Data Infrastructure Cookbook; Global Spatial Data Infrastructure Association: Orono, ME, USA, 2009. [Google Scholar]
  15. Granell, C.; Gould, M.; Manso, Á.M.; Bernabé, Á.B. Spatial data infrastructures. In Handbook of Research on Geoinformatics; Karimi, H.A., Ed.; Hershey: New York, NY, USA, 2009; pp. 36–41. [Google Scholar]
  16. Annoni, A.; Bernard, L.; Douglas, J.; Greenwood, J.; Laiz, I.; Lloyd, M.; Sabeur, Z.; Sassen, A.-M.; Serrano, J.-J.; Usländer, T. Orchestra: Developing a unified open architecture for risk management applications. In Geo-Information for Disaster Management; van Oosterom, P.D.P., Zlatanova, D.S., Fendel, E.M., Eds.; Springer: Berlin, Germany, 2005; pp. 1–17. [Google Scholar]
  17. Molina, M.; Bayarri, S. A multinational SDI-based system to facilitate disaster risk management in the Andean Community. Comput. Geosci. 2011, 37, 1501–1510. [Google Scholar] [CrossRef] [Green Version]
  18. Giuliani, G.; Peduzzi, P. The PREVIEW Global Risk Data Platform: A geoportal to serve and share global data on risk to natural hazards. Nat. Hazards Earth Syst. Sci. 2011, 11, 53–66. [Google Scholar] [CrossRef]
  19. Weiser, A.; Zipf, A. Web service orchestration of OGC web services for disaster management. In Geomatics Solutions for Disaster Management; Li, A.P.J., Zlatanova, A.P.S., Fabbri, P.A.G., Eds.; Springer: Berlin, Germany, 2007; pp. 239–254. [Google Scholar]
  20. Mazzetti, P.; Nativi, S.; Angelini, V.; Verlato, M.; Fiorucci, P. A grid platform for the European civil protection e-infrastructure: The forest fires use scenario. Earth Sci. Inform. 2009, 2, 53–62. [Google Scholar] [CrossRef]
  21. Agosto, E.; Dalmasso, S.; Pasquali, P.; Terzo, O. Ithaca worldwide flood alert system: The web framework. Appl. Geomat. 2011, 3, 83–89. [Google Scholar] [CrossRef]
  22. De Longueville, B.; Smith, R.S.; Luraschi, G. “OMG, from Here, I Can See the Flames!”: A Use Case of Mining Location Based Social Networks to Acquire Spatio-temporal Data on Forest Fires. In Proceedings of the 2009 International Workshop on Location Based Social Networks, Seattle, WA, USA, 4–6 November 2009.
  23. Díaz, L.; Granell, C.; Gould, M.; Huerta, J. Managing user-generated information in geospatial cyberinfrastructures. Future Gener. Comput. Syst. 2011, 27, 304–314. [Google Scholar] [CrossRef]
  24. Schade, S.; Díaz, L.; Ostermann, F.; Spinsanti, L.; Luraschi, G.; Cox, S.; Nuñez, M.; De Longueville, B. Citizen-based sensing of crisis events: sensor web enablement for volunteered geographic information. Appl. Geomat. 2013, 5, 3–18. [Google Scholar] [CrossRef]
  25. Poorazizi, M.E.; Steiniger, S.; Hunter, A.J.S. A service-oriented architecture to enable participatory planning: an e-planning platform. Int. J. Geogr. Inf. Sci. 2015, 1–30. [Google Scholar] [CrossRef]
  26. Foster, I.; Zhao, Y.; Raicu, I.; Lu, S. Cloud computing and grid computing 360-degree compared. In Proceedings of the 2008 Grid Computing Environments Workshop, Austin, TX, USA, 16 November 2008; pp. 1–10.
  27. Bejar, R.; Latre, M.A.; Nogueras-Iso, J.; Muro-Medrano, P.R.; Zarazaga-Soria, F.J. An architectural style for spatial data infrastructures. Int. J. Geogr. Inf. Sci. 2009, 23, 271–294. [Google Scholar] [CrossRef]
  28. Bugs, G.; Granell, C.; Fonts, O.; Huerta, J.; Painho, M. An assessment of public participation GIS and Web 2.0 technologies in urban planning practice in Canela, Brazil. Cities 2010, 27, 172–181. [Google Scholar] [CrossRef]
  29. De Longueville, B.; Annoni, A.; Schade, S.; Ostlaender, N.; Whitmore, C. Digital Earth’s nervous system for crisis events: Real-time sensor web enablement of volunteered geographic information. Int. J. Digit. Earth 2010, 3, 242–259. [Google Scholar] [CrossRef]
  30. McCall, M. Can Participatory GIS Strengthen Local-Level Planning? Suggestions for Better Practice; Universiti Teknologi Malaysia: Johor, Malaysia, 2004. [Google Scholar]
  31. Li, L.; Goodchild, M.F. The role of social networks in emergency management: A research agenda. Int. J. Inf. Syst. Crisis Response Manag. 2010, 2, 48–58. [Google Scholar] [CrossRef]
  32. Mooney, P.; Corcoran, P. Has OpenStreetMap a role in digital earth applications? Int. J. Digit. Earth 2014, 7, 534–553. [Google Scholar] [CrossRef]
  33. Budhathoki, N.R.; Bruce, B.; Nedovic-Budic, Z. Reconceptualizing the role of the user of spatial data infrastructure. GeoJournal 2008, 72, 149–160. [Google Scholar] [CrossRef]
  34. Genovese, E.; Roche, S. Potential of VGI as a resource for SDIs in the North/South context. Geomatica 2010, 64, 439–450. [Google Scholar]
  35. Olson, J.A. Data as a service: Are we in the clouds? J. Map Geogr. Libr. 2009, 6, 76–78. [Google Scholar] [CrossRef]
  36. Wei-dong, C.; Qing-zhan, Z. Research of GIS services mode based on SaaS. In Proceedings of the 2nd International Conference on Information Science and Engineering (ICISE), Hangzhou, China, 4–6 December 2010; pp. 6812–6814.
  37. Castronova, A.M.; Goodall, J.L.; Elag, M.M. Models as web services using the Open Geospatial Consortium (OGC) Web Processing Service (WPS) standard. Environ. Model. Softw. 2013, 41, 72–83. [Google Scholar] [CrossRef]
  38. Sahin, K.; Gumusay, M.U. Service oriented architecture (SOA) based web services for geographic information systems. In Proceedings of the XXIst ISPRS International Archives of Photogrammetry, Remote Sensing, and Spatial Information Science, Beijing, China, 3–11 July 2008.
  39. Granell, C.; Díaz, L.; Gould, M. Service-oriented applications for environmental models: Reusable geospatial services. Environ. Model. Softw. 2010, 25, 182–198. [Google Scholar] [CrossRef]
  40. Haesen, R.; Snoeck, M.; Lemahieu, W.; Poelmans, S. On the definition of service granularity and its architectural impact. In Advanced Information Systems Engineering; Lecture Notes in Computer Science; Bellahsène, Z., Léonard, M., Eds.; Springer: Berlin, Germany, 2008; Volume 5074, pp. 375–389. [Google Scholar]
  41. Friis-Christensen, A.; Lucchi, R.; Lutz, M.; Ostländer, N. Service chaining architectures for applications implementing distributed geographic information processing. Int. J. Geogr. Inf. Sci. 2009, 23, 561–580. [Google Scholar] [CrossRef]
  42. Arcaini, P.; Bordogna, G.; Sterlacchini, S. Flexible Querying of Volunteered Geographic Information for Risk Management; Atlantis Press: Paris, France, 2013. [Google Scholar]
  43. Brin, S.; Page, L. The anatomy of a large-scale hypertextual Web search engine. Comput. Netw. ISDN Syst. 1998, 30, 107–117. [Google Scholar] [CrossRef]
  44. Mandl, T. Implementation and evaluation of a quality-based search engine. In Proceedings of the Seventeenth Conference on Hypertext and Hypermedia (HYPERTEXT’06), Odense, Denmark, 22–25 August 2006.
  45. Poser, K.; Dransch, D. Volunteered geographic information for disaster management with application to rapid flood damage estimation. Geomatica 2010, 64, 89–98. [Google Scholar]
  46. Flanagin, A.J.; Metzger, M.J. The credibility of volunteered geographic information. GeoJournal 2008, 72, 137–148. [Google Scholar] [CrossRef]
  47. Fan, H.; Zipf, A.; Fu, Q.; Neis, P. Quality assessment for building footprints data on OpenStreetMap. Int. J. Geogr. Inf. Sci. 2014, 28, 700–719. [Google Scholar] [CrossRef]
  48. Bishr, M.; Mantelas, L. A trust and reputation model for filtering and classifying knowledge about urban growth. GeoJournal 2008, 72, 229–237. [Google Scholar] [CrossRef]
  49. Bishr, M.; Kuhn, W. Trust and reputation models for quality assessment of human sensor observations. In Spatial Information Theory; Lecture Notes in Computer Science; Tenbrink, T., Stell, J., Galton, A., Wood, Z., Eds.; Springer: Amsterdam, The Netherlands, 2013; pp. 53–73. [Google Scholar]
  50. Goodchild, M.F.; Li, L. Assuring the quality of volunteered geographic information. Spat. Stat. 2012, 1, 110–120. [Google Scholar] [CrossRef]
  51. Bodnar, T.; Salathé, M. Validating models for disease detection using Twitter. In Proceedings of the 22Nd International Conference on World Wide Web Companion (WWW’13 Companion), Rio de Janeiro, Brazil, 13–17 May 2013.
  52. Achrekar, H.; Gandhe, A.; Lazarus, R.; Yu, S.-H.; Liu, B. Predicting flu trends using Twitter data. In Proceedings of the 2011 IEEE Conference on Computer Communications Workshops (INFOCOM WKSHPS), Shanghai, China, 10–15 April 2011.
  53. Ostermann, F.O.; Spinsanti, L. A conceptual workflow for automatically assessing the quality of volunteered geographic information for crisis management. In Proceedings of AGILE 2011 Conference, Utrecht, Netherlands, 7–13 August 2011.
  54. Web Map Service. Available online: portal.opengeospatial.org/files/?artifact_id=5316 (accessed on 1 February 2014).
  55. Web Feature Service Implementation Specification. Available online: https://portal.opengeospatial.org/files/?artifact_id=8339 (accessed on 16 July 2014).
  56. Evans, J.D. Web Coverage Service (WCS). Available online: portal.opengeospatial.org/files/?artifact_id=3837 (accessed on 3 April 2014).
  57. Botts, M.; Percivall, G.; Reed, C.; Davidson, J. OGC® sensor web enablement: Overview and high level architecture. In GeoSensor Networks; Nittel, S., Labrinidis, A., Stefanidis, A., Eds.; Springer: Berlin, Germany, 2008; Volume 4540, pp. 175–190. [Google Scholar]
  58. Bröring, A.; Jirka, S.; Rieke, M.; Pross, B. OGC® Testbed-10 CCI VGI Engineering Report 2014; Open Geospatial Consortium: New York, NY, USA.
  59. Elwood, S. Volunteered geographic information: Future research directions motivated by critical, participatory, and feminist GIS. GeoJournal 2008, 72, 173–183. [Google Scholar] [CrossRef]
  60. Cornford, D.; Williams, M.; Bastin, L. Uncertainty enabled Sensor Observation Services; EGU General Assembly: Vienna, Austria, 2010; Volume 12, p. 9082. [Google Scholar]
  61. Devaraju, A.; Kunkel, R.; Sorg, J.; Bogena, H.; Vereecken, H. Enabling quality control of sensor web observations. In Proceedings of the 3rd International Conference on Sensor Networks (SENSORNETS 2014), Lisboa, Portugal, 7–9 January 2014.
  62. Williams, M.; Cornford, D.; Bastin, L.; Pebesma, E. Uncertainty Markup Language (UnCertML). Available online: https://portal.opengeospatial.org/files/?artifact_id=33234. (accessed on 20 May 2015).
  63. Barbacci, M.R.; Ellison, R.J.; Lattanze, A.J.; Stafford, J.A.; Weinstock, C.B.; Wood, W.G. Quality Attribute Workshops (QAWs); Software Engineering Institute, Carnegie Mellon University: Pittsburgh, Pennsylvania, 2003. [Google Scholar]
  64. Kazman, R.; Bass, L. Categorizing Business Goals for Software Architectures; Software Engineering Institute, Carnegie Mellon University: Pittsburgh, Pennsylvania, 2005. [Google Scholar]
  65. Kazman, R.; Gagliardi, M.; Wood, W. Scaling up software architecture analysis. J. Syst. Softw. 2012, 85, 1511–1519. [Google Scholar] [CrossRef]
  66. Spinsanti, L.; Ostermann, F. Validation and relevance assessment of volunteered geographic information in the case of forest fires. In Proceedings of 2nd International Workshop on Validation of Geo-Information Products for Crisis Management, Ispra, Italy, 11–13 October 2010.
  67. Bimonte, S.; Boucelma, O.; Machabert, O.; Sellami, S. A new Spatial OLAP approach for the analysis of Volunteered Geographic Information. Comput. Environ. Urban Syst. 2014, 48, 111–123. [Google Scholar] [CrossRef]
  68. Meek, S.; Jackson, M.J.; Leibovici, D.G. A Flexible Framework for Assessing the Quality of Crowdsourced Data; AGILE Digital Editions: Castellón, Spain, 2014. [Google Scholar]
  69. Nebert, D.; Whiteside, A.; Vretanos, P. OpenGIS® Catalogue Services Specification. Available online: portal.opengeospatial.org/files/?artifact_id=20555 (accessed on 21 February 2014).
  70. Maso, J.; Pomakis, K.; Julia, N. OpenGIS® Web Map Tile Service Implementation Standard. Available online: http://www.opengeospatial.org/standards/wmts (accessed on 1 June 2014).
  71. Schut, P. OpenGIS Web Processing Service. Available online: portal.opengeospatial.org/files/?artifact_id=28772&version=2 (accessed on 10 August 2014).
  72. Na, A.; Priest, M. Sensor Observation Service. Available online: http://portal.opengeospatial.org/files/?artifact_id=12846 (accessed on 2 July 2014).
  73. Observations and Measurements—XML Implementation. Available online: http://portal.opengeospatial.org/files/?artifact_id=41510 (accessed on 11 September 2014).
  74. Gonçalves, P. OGC® OpenSearch Geo and Time Extensions. Available online: https://portal.opengeospatial.org/files/?artifact_id=56866 (accessed on 26 April 2014).
  75. Ellis, R.; Gray, M. Thousands Evacuate as Typhoon Hagupit Lashes Philippines. Available online: http://www.cnn.com/2014/12/06/world/asia/philippines-typhoon-hagupit-ruby/index.html (accessed on 9 February 2015).
  76. Rice, D. Super Typhoon Hagupit takes aim on the Philippines. Available online: http://www.usatoday.com/story/weather/2014/12/03/super-typhoon-hagupit-philippines/19849821/ (accessed on 9 February 2015).
  77. Typhoon Hagupit 2014. Available online: http://en.wikipedia.org/w/index.php?title=Typhoon_Hagupit_(2014)&oldid=644324125 (accessed on 27 January 2015).
  78. Pama, A. SitRep No. 27 re Effects of Typhoon “Ruby” (Hagupit); National Disaster Risk Reduction and Management Council: Quezon City, Philippines, 2014; p. 42. [Google Scholar]
  79. Official Gazette. Tropical Cyclone Warning: Tropical Storm Ruby; National Printing Office: Quezon City, Philippines, 2014.
  80. Murugesan, S.; Deshpande, Y.; Hansen, S.; Ginige, A. Web engineering: A new discipline for development of web-based systems. In Web Engineering; Murugesan, S., Deshpande, Y., Eds.; Springer: Berlin, 2001; pp. 3–13. [Google Scholar]
  81. Currion, P.; Silva, C. de; van de Walle, B. Open source software for disaster management. Commun. ACM 2007, 50, 61–65. [Google Scholar] [CrossRef]
  82. Steiniger, S.; Hunter, A.J.S. The 2012 free and open source GIS software map—A guide to facilitate research, development and adoption. Comput. Environ. Urban Syst. 2013, 39, 136–150. [Google Scholar] [CrossRef]
  83. Devillers, R.; Jeansoulin, R. Spatial data quality: Concepts. In Fundamentals of Spatial Data Quality; Devillers, R., Jeansoulin, R., Eds.; ISTE: New Delhi, India, 2006; pp. 31–42. [Google Scholar]
  84. Guptill, S.C.; Morrison, J.L. Elements of Spatial Data Quality; Elsevier: Amsterdam, The Netherlands, 2013. [Google Scholar]
  85. Van Oort, P. Spatial Data Quality: From Description to Application; Wageningen Universiteit: Wageningen, The Netherlands, 2006. [Google Scholar]
  86. Shi, W.; Fisher, P.; Goodchild, M.F. Spatial Data Quality; CRC Press: Boca Raton, FL, USA, 2003. [Google Scholar]
  87. Haklay, M. Volunteered geographic information, quality assurance. Int. Encycl. Geogr. People Earth Environ. Technol. 2015, in press. [Google Scholar]
  88. Crooks, A.; Croitoru, A.; Stefanidis, A.; Radzikowski, J. #Earthquake: Twitter as a distributed sensor system. Trans. GIS 2013, 17, 124–147. [Google Scholar]
  89. Purves, R.; Jones, C. Geographic information retrieval. SIGSPATIAL Spec. 2011, 3, 2–4. [Google Scholar] [CrossRef]
  90. Li, M.; Chen, X.; Li, X.; Ma, B.; Vitanyi, P.M.B. The similarity metric. IEEE Trans. Inf. Theory 2004, 50, 3250–3264. [Google Scholar] [CrossRef]
  91. Chan, C.K.; Vasardani, M.; Winter, S. Leveraging Twitter to detect event names associated with a place. J. Spat. Sci. 2014, 59, 137–155. [Google Scholar] [CrossRef]
  92. Olteanu, A.; Castillo, C.; Diaz, F.; Vieweg, S. CrisisLex: A lexicon for collecting and filtering microblogged communications in crises. In Proceedings of the 8th International AAAI Conference on Weblogs and Social Media, Ann Arbor, ML, USA, 1–4 June 2014.
  93. Steiniger, S.; Hunter, A.J.S. A scaled line-based kernel density estimator for the retrieval of utilization distributions and home ranges from GPS movement tracks. Ecol. Inform. 2013, 13, 1–8. [Google Scholar] [CrossRef]
  94. Moe, W.W.; Schweidel, D.A. Online product opinions: Incidence, evaluation, and evolution. Mark. Sci. 2012, 31, 372–386. [Google Scholar] [CrossRef]
  95. Romero, D.M.; Meeder, B.; Kleinberg, J. Differences in the mechanics of information diffusion across topics: Idioms, political hashtags, and complex contagion on Twitter. In Proceedings of the 20th International Conference on World Wide Web, Hyderabad, India, 28 March–1 April 2011.
  96. Guo, D.; Chen, C. Detecting non-personal and spam users on geo-tagged Twitter network. Trans. GIS 2014, 18, 370–384. [Google Scholar] [CrossRef]
  97. Saaty, T.L. The Analytic Hierarchy Process; McGraw-Hill: New York, NY, USA, 1980. [Google Scholar]
  98. Laituri, M.; Kodrich, K. On line disaster response community: People as sensors of high magnitude disasters using internet GIS. Sensors 2008, 8, 3037–3055. [Google Scholar] [CrossRef]
  99. Shankar, K. Wind, water, and Wi-Fi: New trends in community informatics and disaster management. Inf. Soc. 2008, 24, 116–120. [Google Scholar] [CrossRef]
  100. Rak, A.; Coleman, D.; Nichols, S. Legal liability concerns surrounding volunteered geographic information applicable to Canada. In Spatially Enabling Government, Industry and Citizens: Research and Dev elopment Perspectives; Rajabifard, A., Coleman, D., Eds.; GSD I Association Press: Needham, MA, USA, 2012; pp. 25–142. [Google Scholar]
  101. Ho, S.; Rajabifard, A. Learning from the crowd: The role of volunteered geographic information in realising a spatially enabled society. In Proceedings of GSDI 12 World Conference: Realising Spatially Enabled Societies, Singapore, 19–22 October 2010.

